An Experimental and Numerical Study of Diorite-Porphyrites With Different Weathered Degree in the Direct Shear Test
 Haotian Fan
 Shaorui Sun*
  Wuchao Wang
- College of Earth Science and Engineering, Hohai University, Nanjing, China
There are many well-developed weathered diorite-porphyrites, except main rocks, in the Jurong pumped storage power station of Jiangsu Province, China. Due to different geological environments, diorite-porphyrites emerged by invading faults and can alter from weakly weathered to strongly weathered in less than half a year, which directly affected the safety and stability of hydraulic structures. Therefore, it is important to study the mechanical properties of diorite-porphyrites with different degrees of weathering. The main purpose of this paper is to investigate the effects of the different degrees of weathering on the shear behavior and the mechanical properties of diorite-porphyrites. Experimental and numerical direct shear tests were performed under normal stresses of 0.54, 0.77, 1.53, and 2.30 MPa on strongly weathered, moderately weathered, and weakly weathered samples, respectively. The test results show that with the increase of the degree of weathering, the chemical composition changed; the cohesion and the internal friction angle both decreased. Crack initiation, propagation, and coalescence were all observed with the numerical simulations using two-dimensional particle flow code (PFC2D). The numerical results are in good agreement with the experimental results, and this numerical approach can reproduce the shear behavior of the weathered diorite-porphyrites under different shear conditions. Based on the gradient of the pre-peak stage, the peak stress, and the residual stress, the shear stress–displacement curves can be categorized into three types: type A (mostly for the strongly weathered diorite-porphyrite), type B (mostly for the moderately weathered diorite-porphyrite), and type C (mostly for the weakly weathered diorite-porphyrite). A set of microparameters that can properly simulate the weathered diorite-porphyrites in PFC2D was proposed, which can be applied in the engineering simulation for further analysis.
Introduction
Weathering is widespread in nature. Generally, there are two basic categories of weathering. Mechanical weathering is accomplished by the physical forces that break rocks into smaller and smaller pieces without changing the rock’s mineral composition. Chemical weathering involves the chemical transformation of rock into one or more new compounds. Both types of weathering reduce the strength of rocks (Carroll, 2012). The mechanical and chemical weathering processes usually work simultaneously in nature and reinforce each other. Mechanical weathering which is caused by expansion, resulting from unloading or excavation and salt crystal growth, is the focus in the field of geotechnical engineering. The mechanical weathering forces work to pry apart grains and enlarge fractures. The most important factor of chemical weathering is water. Oxygen dissolved in water oxidizes iron-rich minerals, and carbon dioxide dissolved in water forms carbonic acid, which attacks and alters the rock. Cracks that are exploited by mechanical weathering will increase the surface area exposed to chemical action, thus amplifying the rate of disintegration. Chemical weathering contributes to mechanical weathering by weakening the outer portions of some rocks, which, in turn, makes them more susceptible to being broken by the mechanical weathering processes (Lutgens et al., 2014).
However, different rocks are composed of different minerals and different structures, which lead to the different weathering rates of rocks. The weathering front does not propagate in a uniform way. It preferably follows the joints and other weak zones (Colman, 1981; Lin et al., 2019b). Hence, there are many weak intercalations caused by weathering in the rock mass (Bons et al., 2012). The weak intercalation is the main weak surface which controls rock stability and strongly influences the stability of the rock masses in geotechnical engineering projects such as an underground excavation. The mechanical response of the weak intercalation to weathering becomes a hot topic for geotechnical engineers (Fei et al., 2010; Zelin et al., 2016; Zhang et al., 2018; Zhao et al., 2018a). To obtain the deformation and shear strength of a weathering rock, researchers have attempted to develop some new apparatus and methods (Sun et al., 2004; Duan et al., 2017; Vlastelica et al., 2017; Chen and Lin, 2019). Treatments like freezing–thawing cycles, drying–wetting cycles, and cooling–heating cycles were applied on various rocks, including granite, marl, and mudstone, to simulate the weathering process (Özbek, 1998; Miščević and Vlastelica, 2010; Li et al., 2011; Zeng et al., 2018). These laboratory experiments showed that the compressive strength, the shear strength, and the tensile strength generally decrease after the weathering treatments, mainly owing to the generation of intergranular microcracks at the interfaces between the different minerals.
Currently, the combination of physical tests and numerical simulations has become an efficient method to carry out research in the area of rock mechanics (Sun et al., 2014; Fan et al., 2018; Wang et al., 2019a). The two-dimensional commercial discrete element method (DEM) program particle flow code (PFC2D) was first introduced by Cundall and Strack (1979) and has become an important numerical analysis tool to simulate the mechanical behavior of a granular material (Potyondy and Cundall, 2004; Lin et al., 2019a; Wang et al., 2019b). In the process of numerical simulation, the rock materials are represented by 2D dense packing assembly of rigid circular particles. The particles are bonded at their contact points. There are two basic bonding models: a contact-bond model, which can only resist the force, and a parallel-bond model, which can resist both the force and the moment. The contact force and the moment between two particles are computed based on their overlap and relative moments. When the component of the contact force exceeds either the tensile strength or the shear bond strength, the bond breaks and damage occurs. Optimized methods of building a microscaled model and calibration of microscopic parameters have been raised to overcome the disadvantages of the particle flow method (Yoon, 2007; Shi et al., 2019). Therefore, PFC can be used to monitor the number and the location of microcracks in the numerical samples; the form and the coalescence of microcracks can also be presented. Hu et al. (2017) used PFC to simulate the failure behavior of mudded weak interlayer during the direct shear tests. The strain-softening characteristics of the weak interlayers were found, and the shear strength indexes were predicted, which can provide help for judging the slope stability. Zhao et al. (2018b) investigated the thermal effect on the granites using experimental Brazilian tensile tests and numerical simulations, and they found that heat advection is an important factor in weakening the strength of granite.
As a permanent deformation zone, the weak intercalation formed by weathering has poor support capability (Zhao et al., 2014; Le et al., 2018). Therefore, the weak interlayer is a poor rock mass system with variable thickness and weak mechanical properties, which plays a controlling role in the stability of the dam foundation against sliding and seepage. The instability of the lots of the dam foundation and the arch dam abutment are caused by the weak interlayer (Espada et al., 2018). For example, in Gezhouba Dam Hydropower Station, shear dislocation occurred in the foundation pit wall rock due to the weak interlayer (Naiqi and Wei, 1991), and the instability risk in the Xiluodu arch dam abutment was also improved by the soft interlayer (Liu et al., 2013). Moreover, one of the factors which lead to the stability of the large, deep underground caverns is the weak interlayer caused by weathering. Because of the low shear strength of tuff breccia, the weak interlayer makes it difficult to excavate the underground caverns safely in the Baihetan Hydropower Station (Dai et al., 2016). In the thermo-hydro-chemical environment, the weak interlayer can seriously damage the shape of the Yunying salt cavern (Meng et al., 2016).
In previous researches, little attention has been paid to the mechanical properties of naturally weathering rocks, and the weak intercalation of diorite-porphyrites has not been considered. In the field of Jurong pumped storage power station, a large number of diorite-porphyrite dikes are filled in with dolomite. The degree of weathering of the diorite-porphyrites that are exposed in the exploratory tunnels altered a lot during the excavation of the tunnel, changing from being weakly weathered to being strongly weathered in less than half a year. The stability of the reservoir slope and the water delivery tunnel is seriously affected by this weathered diorite-porphyrite weak interlayer. Therefore, in this paper, direct shear tests were conducted on the weathering diorite-porphyrites collected from Jurong pumped storage power station. The main aim of this study is to investigate the weathering effect on the shear behavior and the mechanical properties of diorite-porphyrites with similar mineralogical compositions but with different degrees of weathering. Laboratory tests to determine the shear strength parameters of the weathering rocks were performed on the diorite-porphyrites samples collected from the field. By numerical direct shear tests using PFC2D, a set of parameters that can correctly simulate the weathering diorite-porphyrites was proposed. The experimental results can help to evaluate the stability of the underground caverns and the dam foundations in Jurong pumped storage power station. Moreover, the microparameters can be used as a reference for the study of the weathering diorite-porphyrite in PFC2D in the future.
Rock Specimens and Testing Procedure
Material and Sample Preparation
The sampling locality is in the region surrounding the upper reservoir of Jurong pumped storage power station, which is located in the Jiangsu Province, Southeastern China (Figure 1). At the micrometer scale, the diorite-porphyrite samples are mainly constituted of quartz, feldspar, calcite, dolomite, chlorite, mica, and pyrite. The diorite-porphyrite specimens used for the direct shear tests were cylinder-shaped, with a height of 50 mm and a diameter of 50 mm. As shown in Figure 2, cylindrical samples of 50 mm in diameter (Figure 2B) were first cored from an original rock block (Figure 2A), and then the cylindrical samples were cut to a final height of 50 mm and polished at both ends for the laboratory tests (Figures 2C,D). Due to the difficulty in obtaining a large number of good-quality samples from a single rock block, a total of 45 samples were produced from the diorite-porphyrite blocks, respectively. The samples were stored in dry air at room temperature before the mechanical tests.
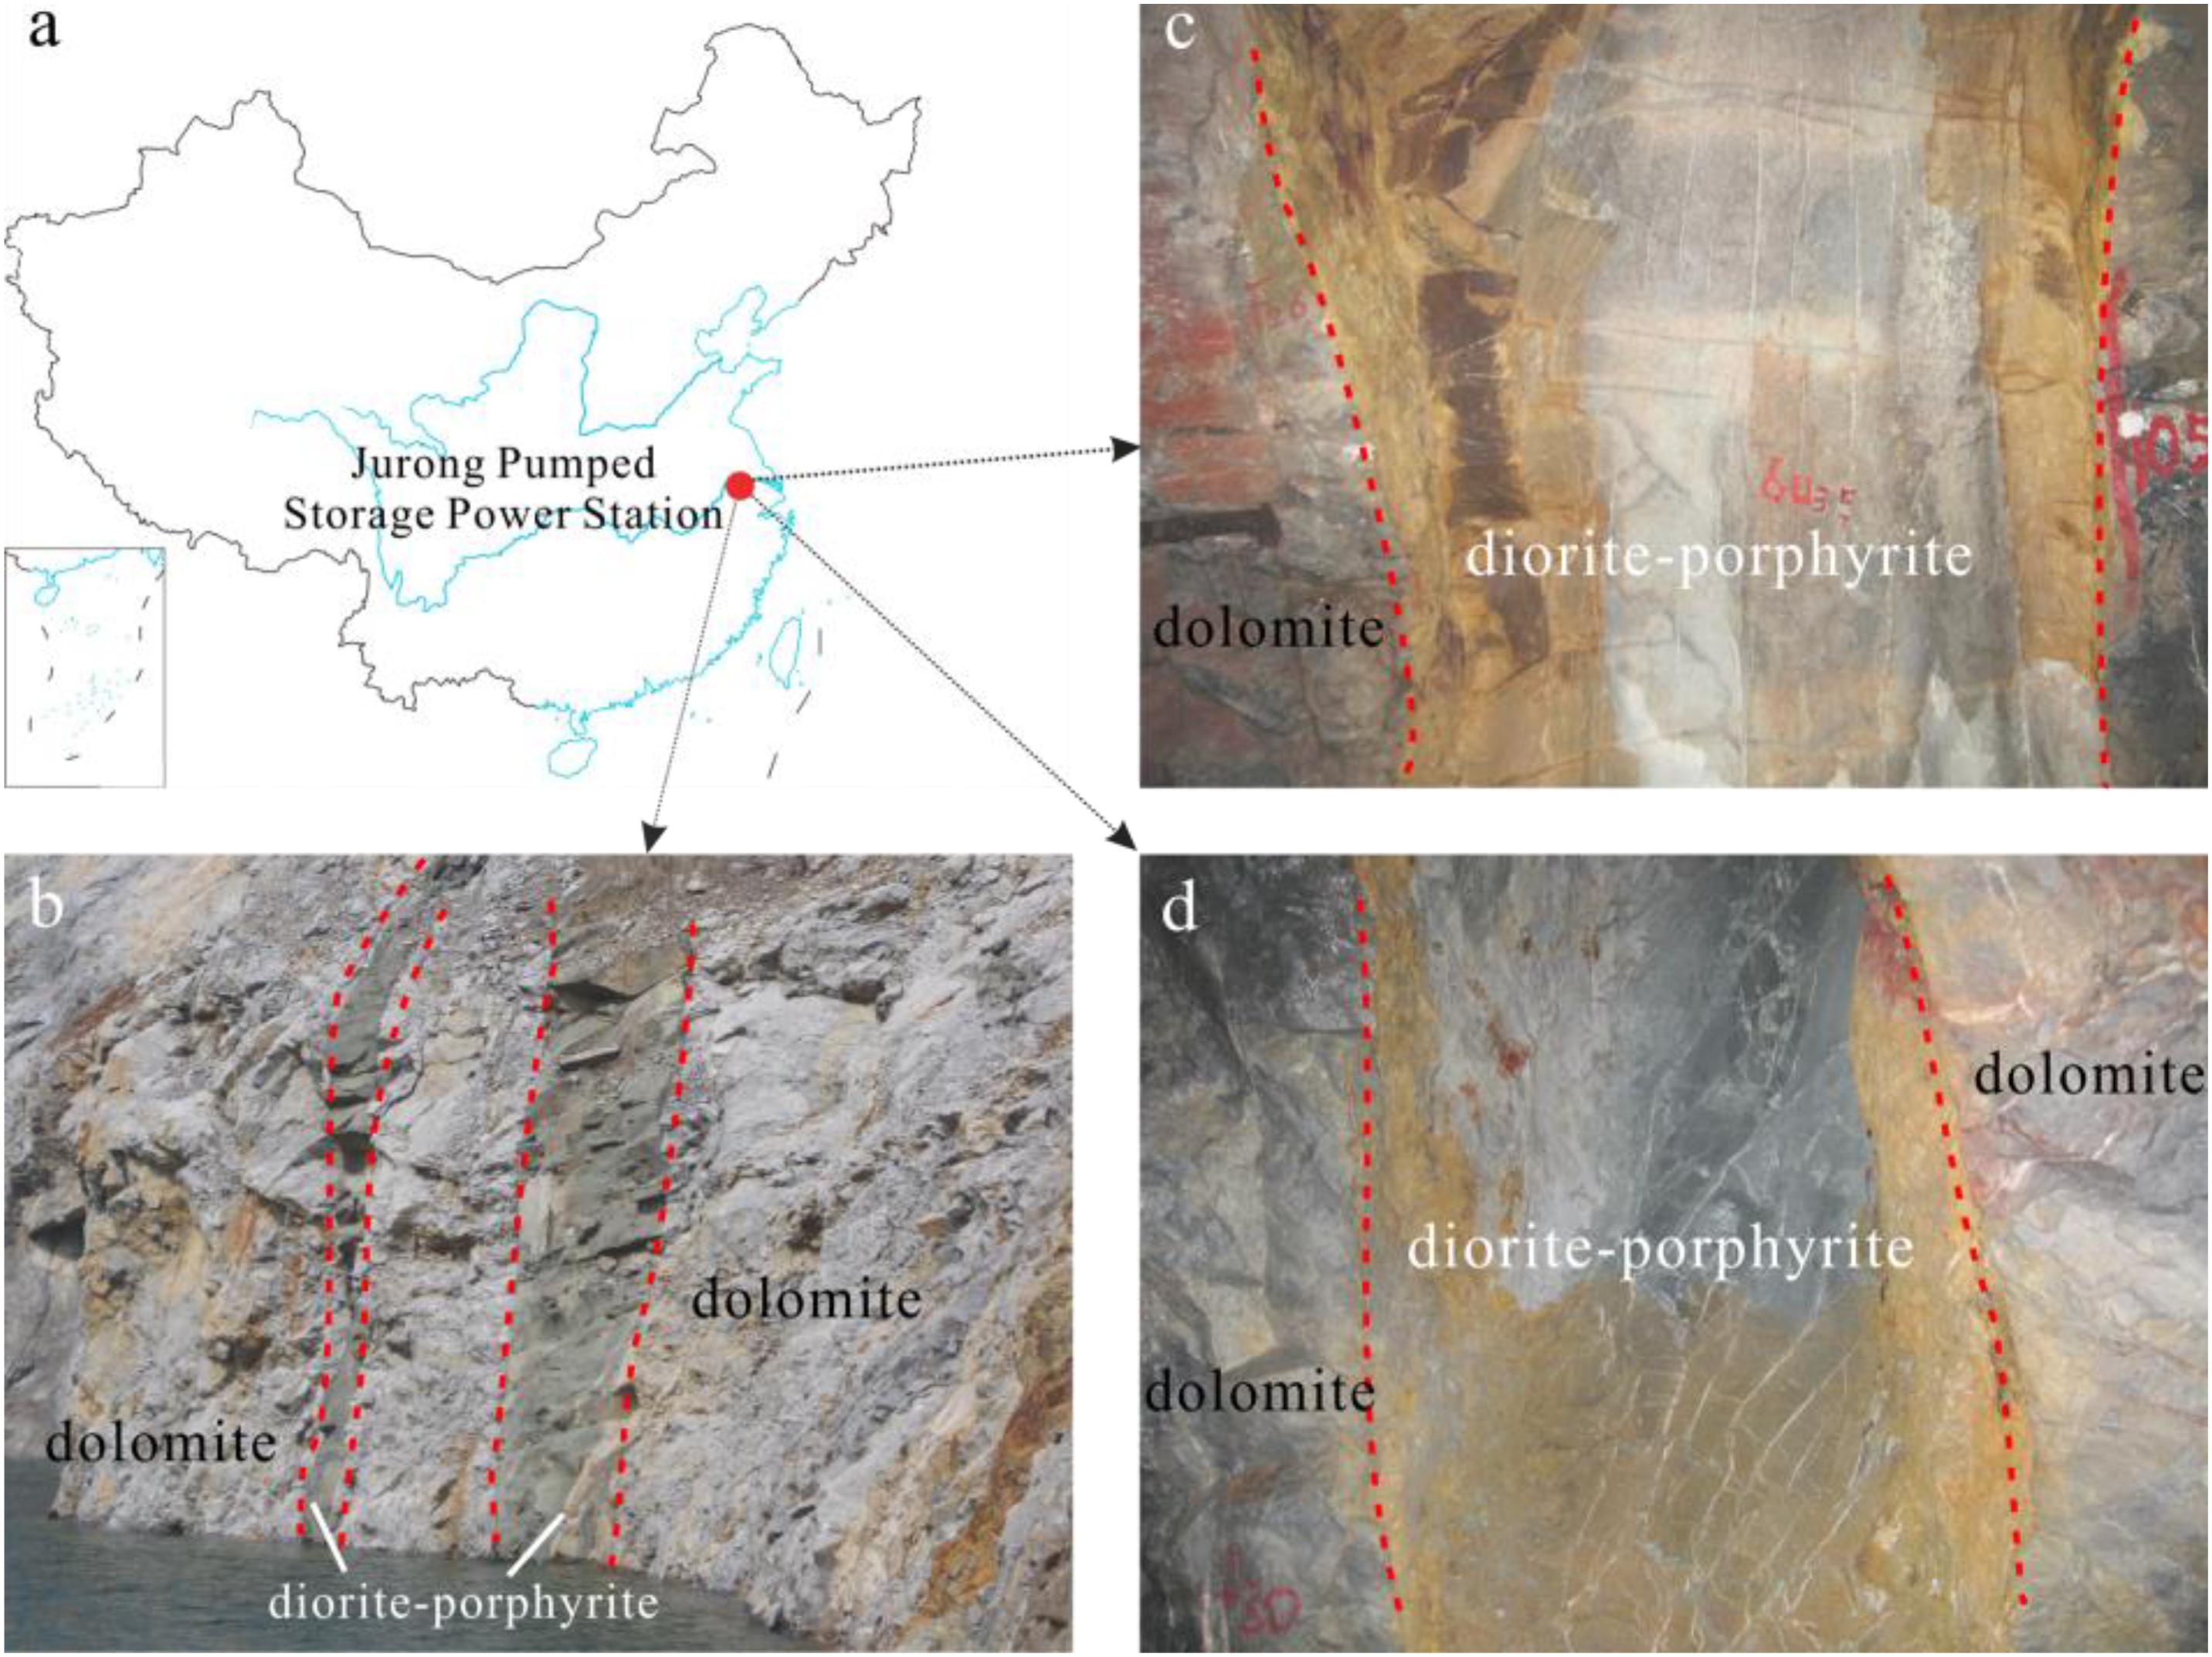
Figure 1. (a) Geological location of Jurong pumped storage power station. (b) Weathered diorite-porphyrite on the ground. (c) Weathered diorite-porphyrite in the exploratory tunnel PD2. (d) Weathered diorite-porphyrite in the exploratory tunnel PD4.
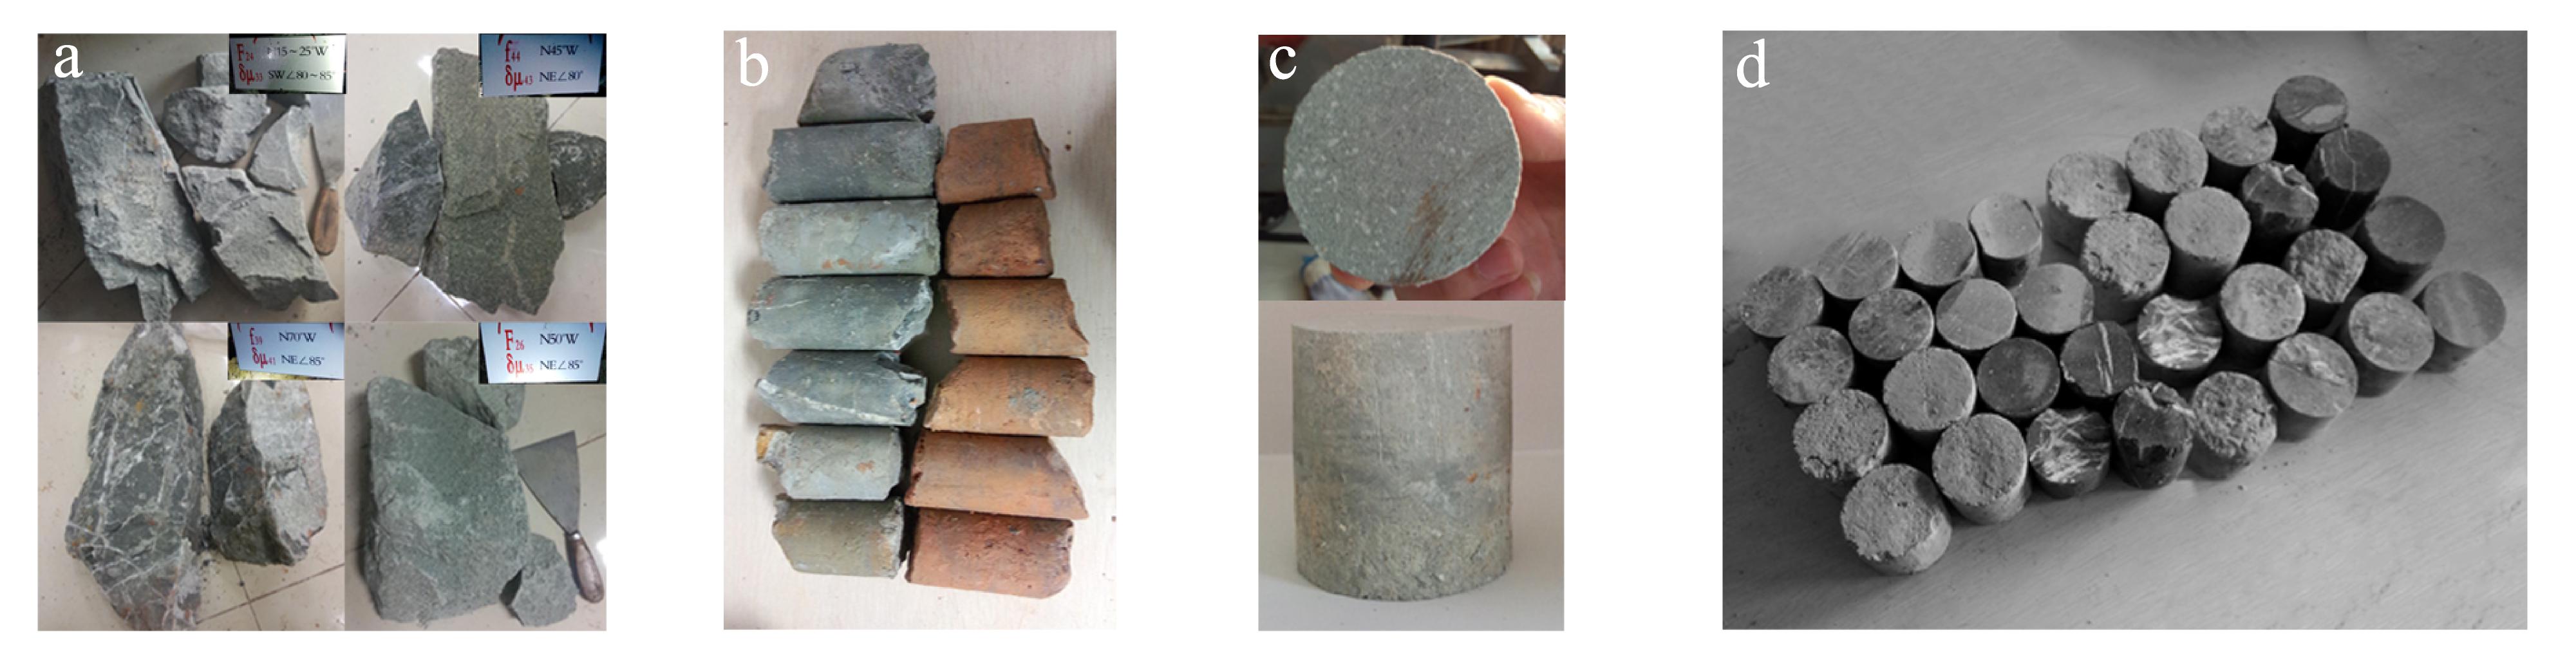
Figure 2. The process of preparing the test samples. (a) Original rock samples. (b) Drilling rock samples. (c) Grinding rock samples. (d) Final rock samples.
Weathering Classification of the Samples
Figure 3 shows the process of evaluating the degree of weathering of the diorite-porphyrite samples. The degree of weathering of the samples was categorized according to the Chinese standard method for investigation of geotechnical engineering (GB 50021-2001) (Ministry of Housing and Urban-Rural Development, 2009). As shown in Figure 3A, the chemical analyses were firstly performed on six diorite-porphyrite blocks collected from the exploratory tunnels, named PD2, PD4, and PD5. The chemical compositions of the six intact diorite-porphyrite blocks were analyzed and are presented in Figure 3B. The average distribution of the chemical composition in the diorite-porphyrite samples is SiO2 – 49 ± 15% of the rock, Al2O3 – 14 ± 2% of the rock, and Fe2O3, CaO, MgO – 7 ± 4% of the rock; the ancillary minerals constituting of K2O, Na2O, and SO3 were less than 4%. According to their content of Na2O, the samples were divided into two groups: the unaltered group and the altered group. The unaltered diorite-porphyrite group contains Na2O, while the altered diorite-porphyrite group does not. For the six blocks, samples PD2-45 and PD2-75 are the unaltered specimens, and they were directly classified as weakly weathered samples. On the contrary, samples PD2-84, PD2-347, PD4-55, and PD5-70 are the altered specimens, which should be further categorized according to the integrity of the rock mass.
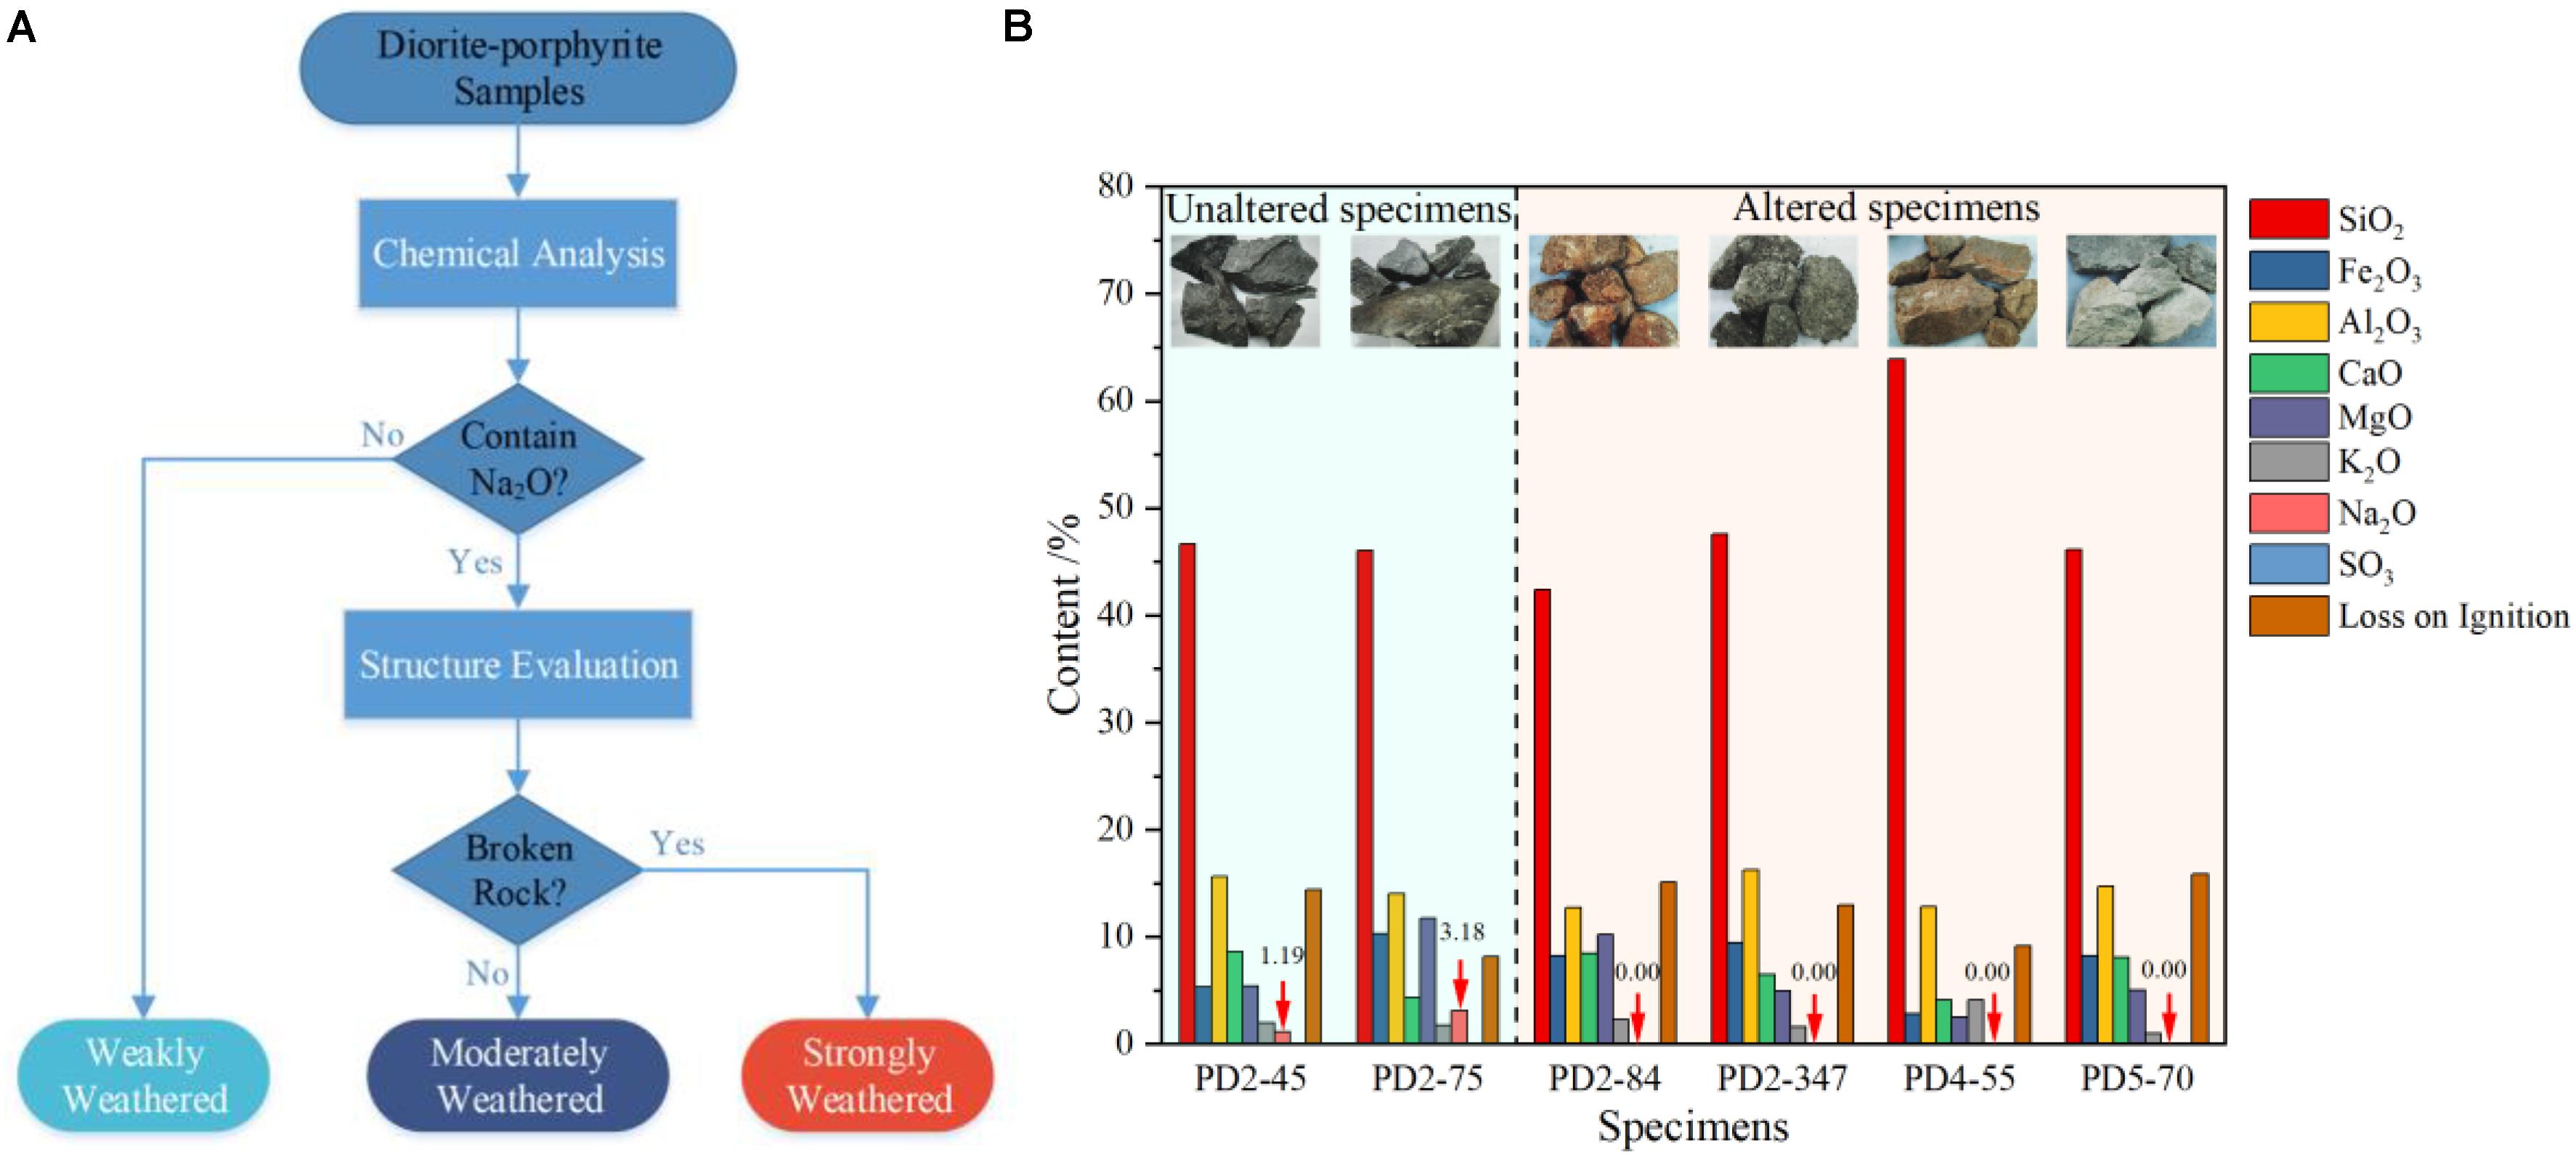
Figure 3. Evaluation of the degree of weathering. (A) Process for determining the degree of weathering. (B) Chemical composition of the content of samples.
Structure evaluation was then carried out on the altered diorite-porphyrite group. In accordance with the recommendations of the Chinese standard method and the rock mass structure characteristic in the field, the rock sample collected from broken rock mass with abundant weathering fissures was identified as a strongly weathered sample, and the rock sample collected from the rock mass with a small number of weathering fissures was identified as a moderately weathered sample.
Test Procedure
In order to obtain a reference value of normal stress for the direct shear tests, nine samples of different degrees of weathering were randomly selected from the total of 45 samples for the uniaxial compression test. The obtained results are given in Figure 4. Figure 4 shows that the average uniaxial compressive strength of the nine samples is 7.65 MPa (SW – strongly weathered, σc < 5 MPa; MW – moderately weathered, 5 MPa < σc < 10 MPa; and WW – weakly weathered, σc > 10 MPa). Furthermore, 7, 10, 20, and 30% of the uniaxial compressive strength (0.54, 0.77, 1.53, and 2.30 MPa) were chosen as the normal stress in the direct shear tests.
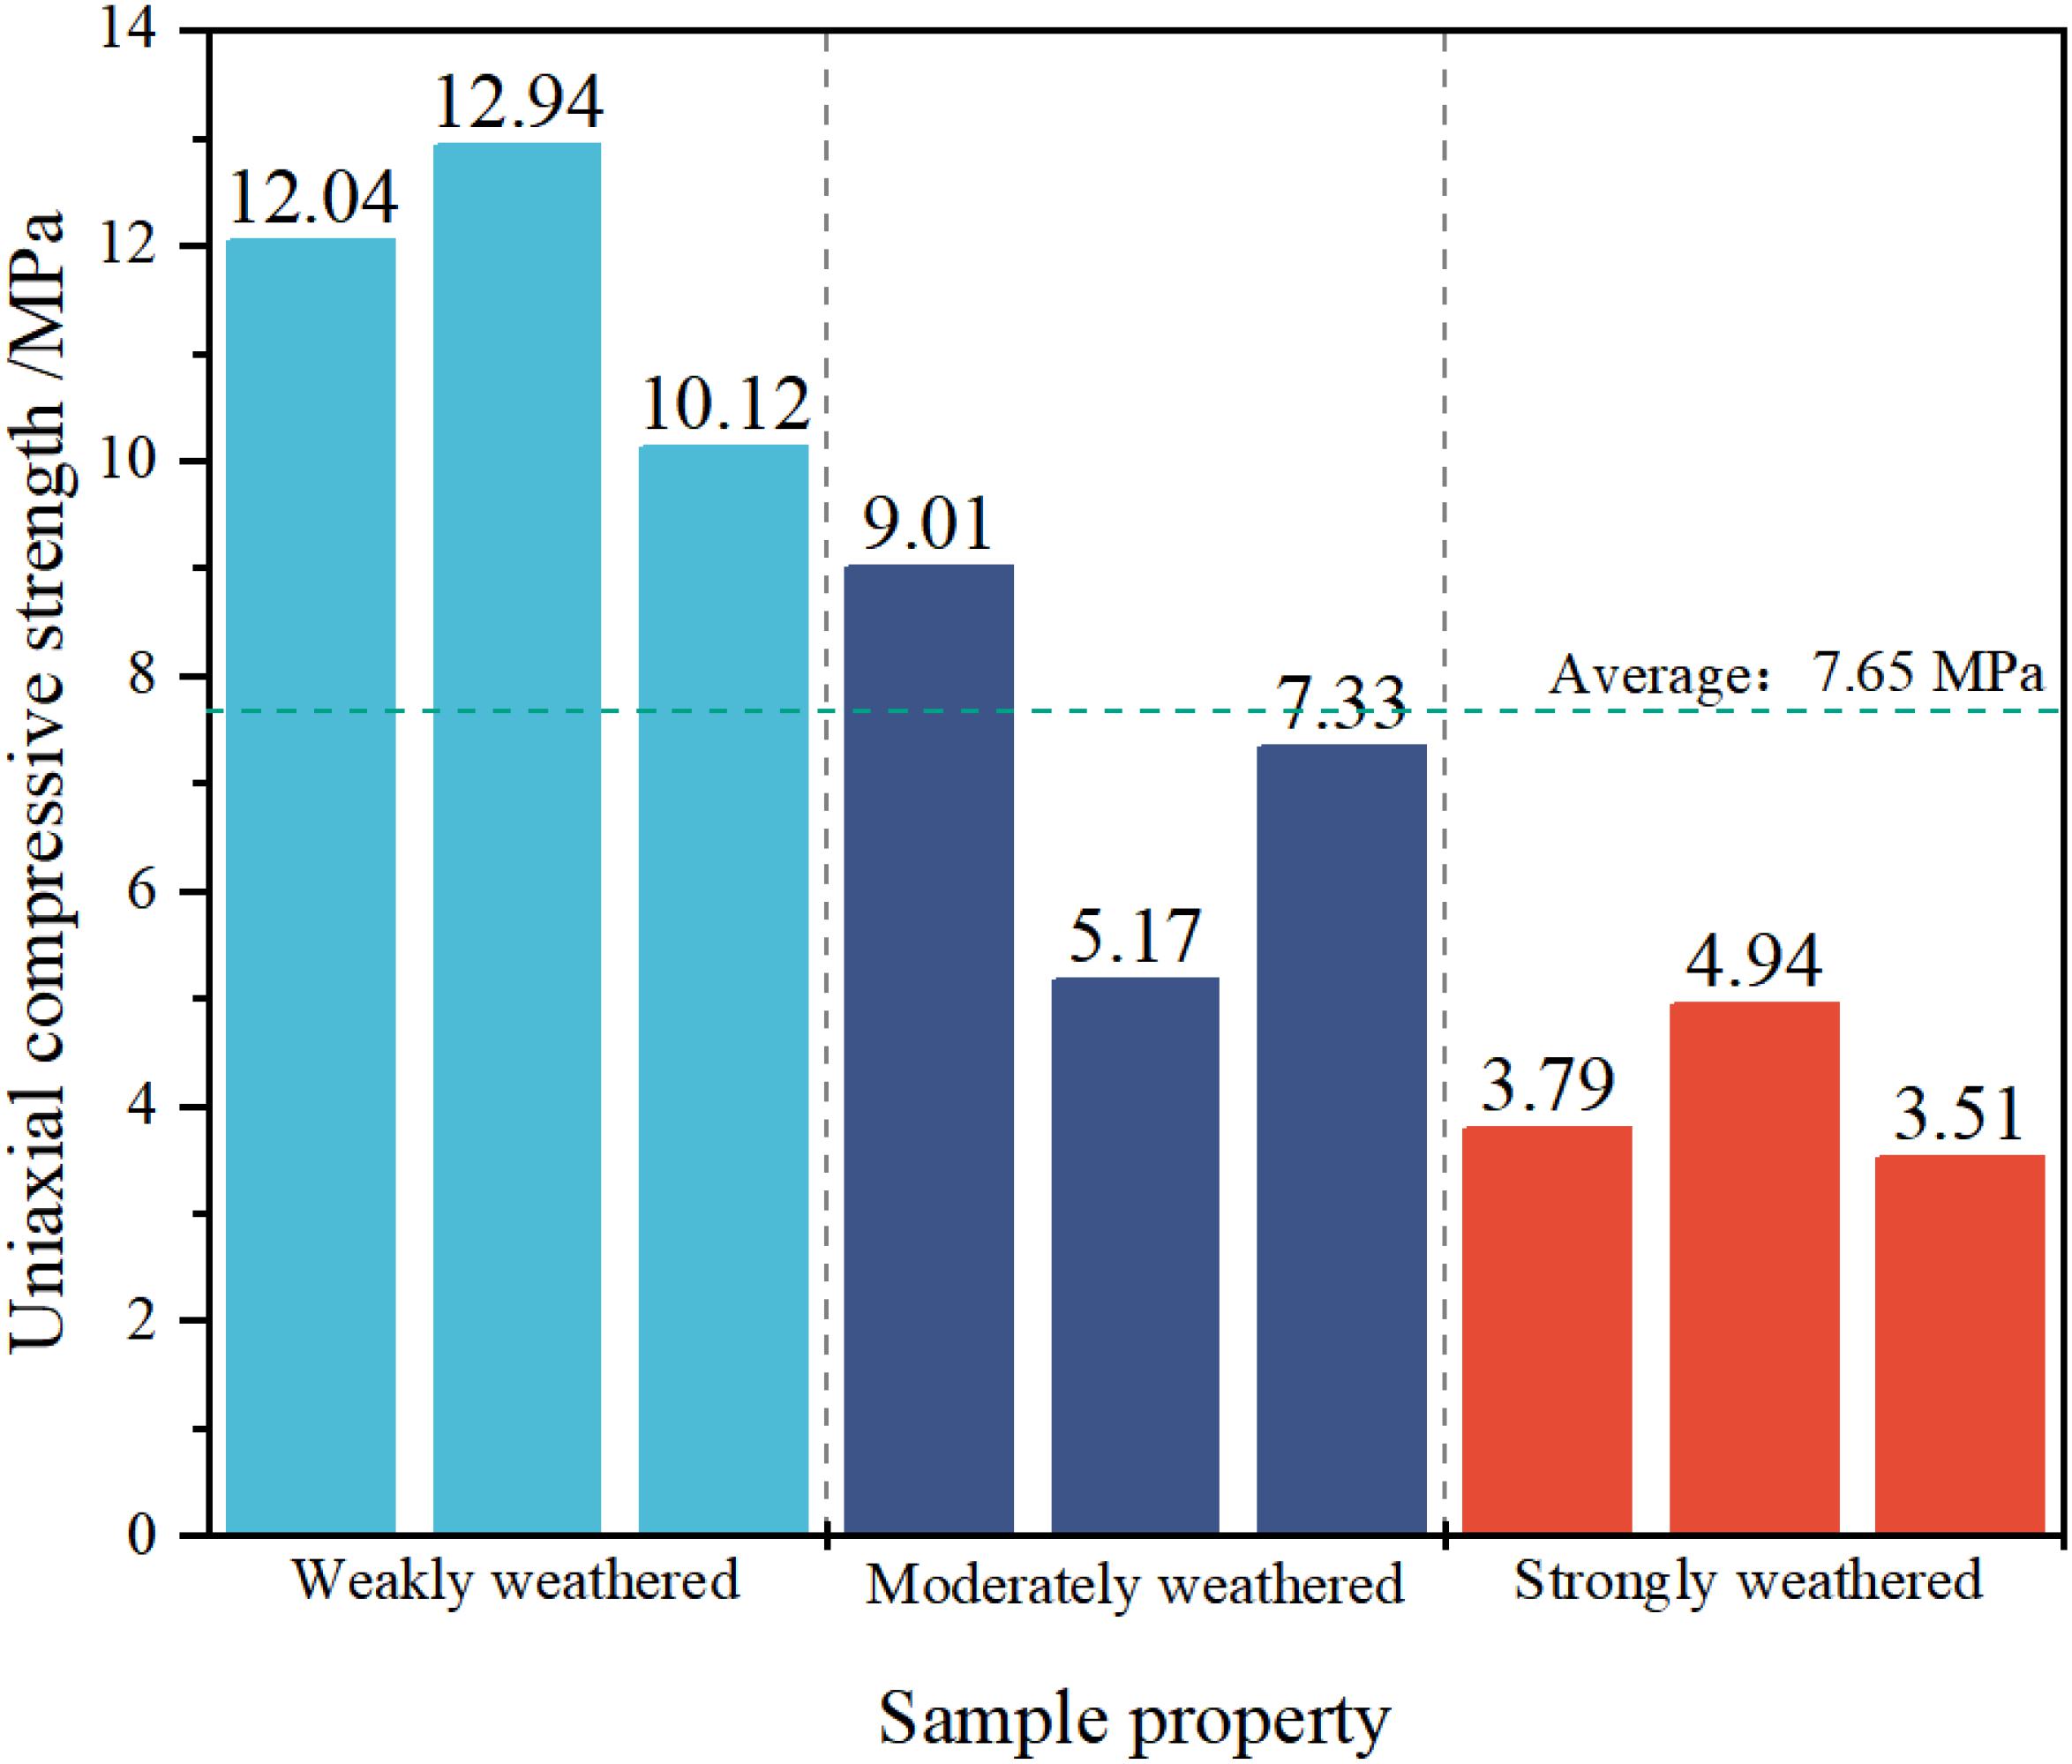
Figure 4. Uniaxial compressive strength of the tested rock samples.
A servo-control testing system (YZ-30B) was employed for the direct shear tests. At the beginning of the shear tests, the normal load is firstly applied to a specific value mentioned above to maintain a constant normal force. Then, the shear load with a horizontal loading rate of 0.2–0.4 kN/s is applied to the diorite-porphyrite samples during the direct shear tests. The shear load is finished when the shear displacement reaches 4 mm, and the shear stress–displacement curve is recorded for further analysis.
Experimental Results
Shear Stress–Displacement Curves
Figure 5 shows the typical shear stress–displacement curves of diorite-porphyrite specimens with different degrees of weathering. It can be seen from Figure 5 that the shear strength corresponding to the normal stress is also larger for the samples with a milder degree of weathering, which indicates that the weakly weathered diorite-porphyrite is more brittle than the moderately weathered and the strongly weathered samples. This observation was predictable because of the low alteration of the mineral composition. Indeed, of the 36 samples, the strongly weathered samples had the lowest shear strength under the normal stress of 0.54 MPa. The average shear strength decreased with the magnitude of the degree of weathering, which indicated that weathering can affect the shear strength of diorite-porphyrite.
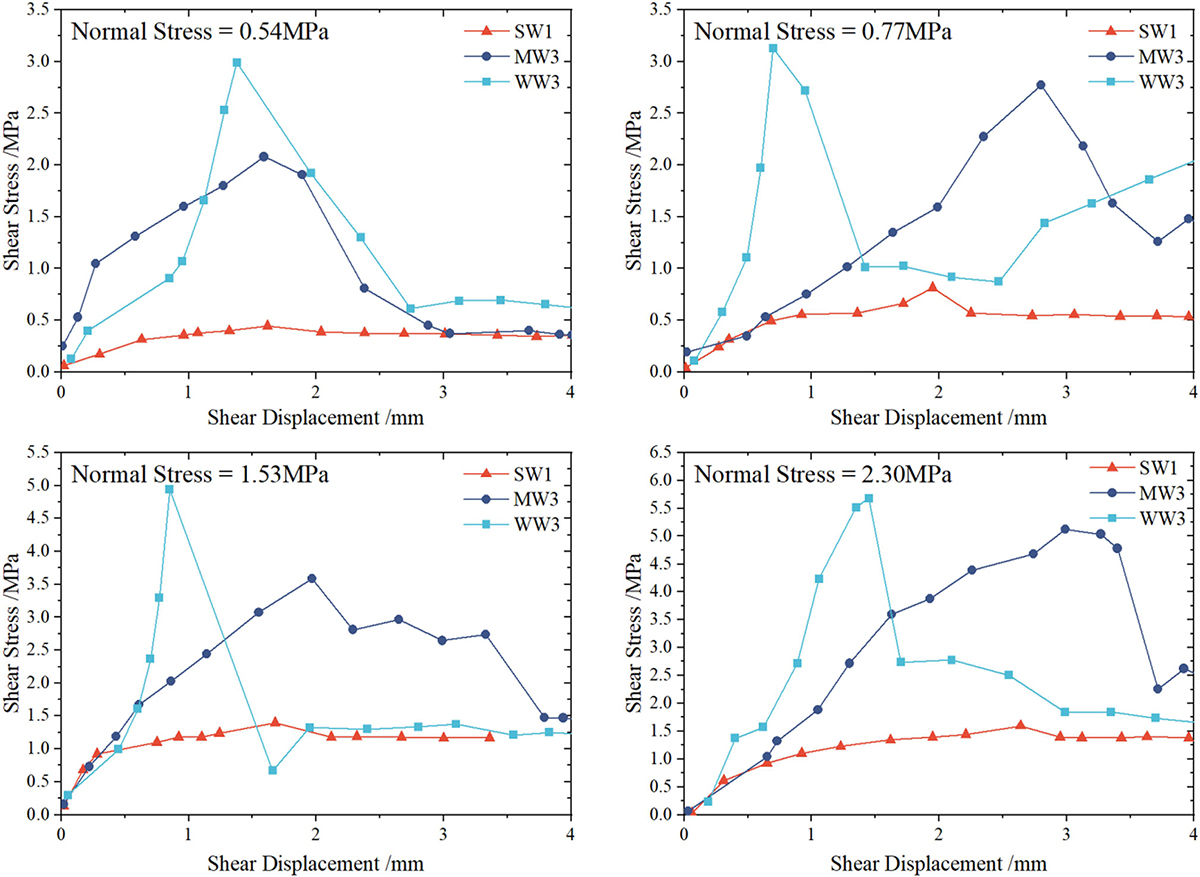
Figure 5. Shear stress–displacement curves of weathered diorite-porphyrite specimens under direct shear tests.
Macro-Mechanical Parameters
Table 1 shows the shear strength of the direct shear tests on the diorite-porphyrite samples with different degrees of weathering. From Table 1, it can be seen that, under the normal stress of 0.54, 0.77, 1.53, and 2.30 MPa, the respective average shear strength values of the strongly weathered diorite-porphyrite samples are 0.54, 0.77, 1.47, and 1.54 MPa, the respective average shear strength values of the moderately weathered diorite-porphyrite samples are 2.00, 2.77, 3.40, and 4.44 MPa, and the average shear strength values of the weakly weathered diorite-porphyrite samples are 3.19, 3.50, 4.95, and 5.64 MPa, respectively. Generally, the shear strength increases with the normal stress. This phenomenon was observed for most samples, except for samples SW3 and MW2. The exceptional cases were related to the tiny discontinuities in the weathered diorite-porphyrite samples.
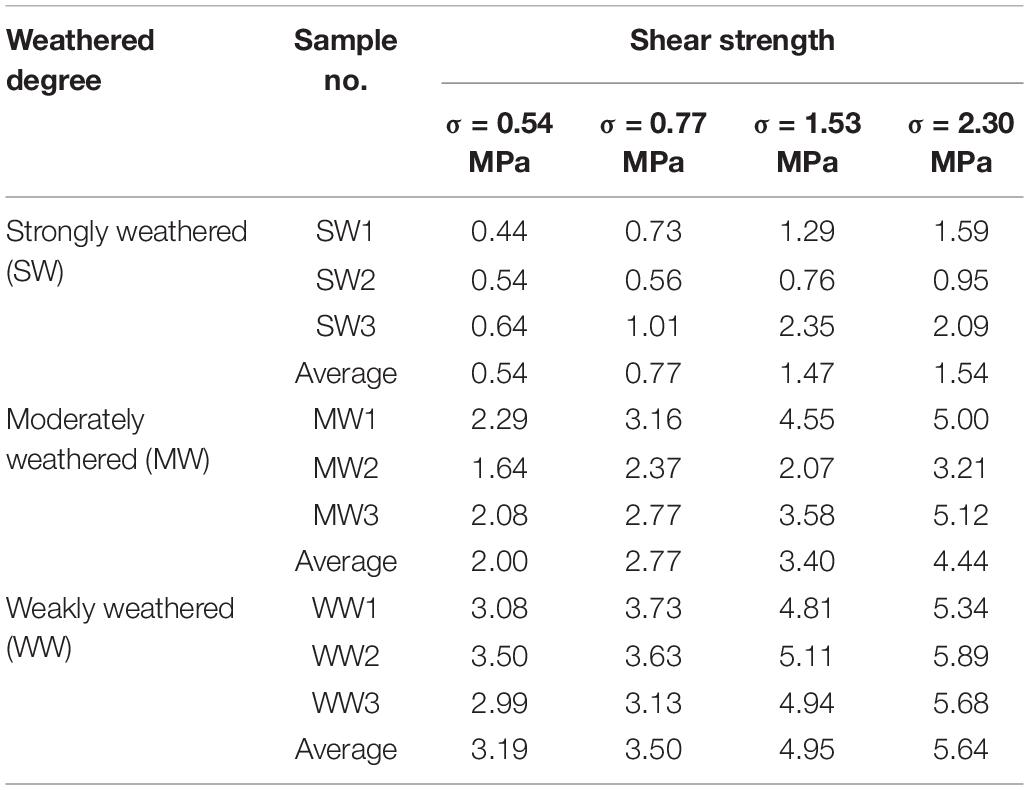
Table 1. Shear strength of diorite-porphyrite samples with different degrees of weathering.
According to the Mohr–Coulomb criterion, the variations of cohesion and internal friction angle with the degree of weathering are shown in Table 2 and Figure 6. Both the cohesion and the internal friction angle of the three types of the diorite-porphyrite samples exhibit a monotonous increasing trend with the decreasing degree of weathering. The specimens with strong, moderate, and weak degrees of weathering had average cohesion values of 0.32, 1.52, and 2.47 MPa, respectively. It is also observed from Figure 6 that the diorite-porphyrite samples with these three degrees of weathering had average internal friction angles of 29.30°, 49.75°, and 55.06°, respectively.
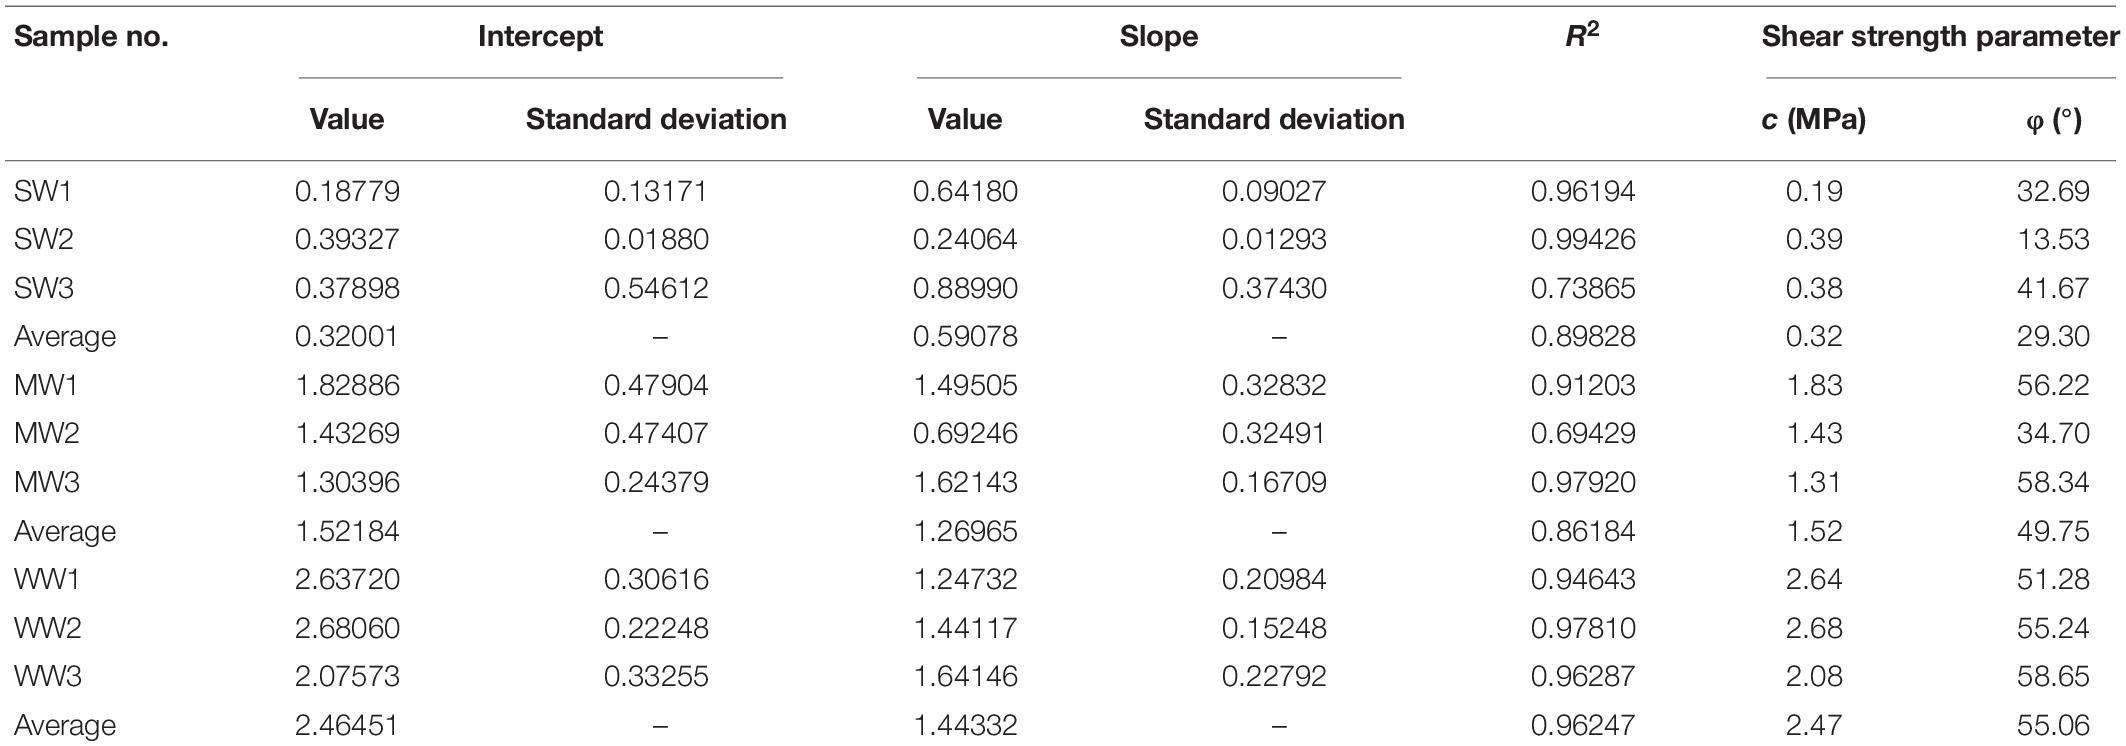
Table 2. Shear strength parameter of weathered diorite–porphyrite samples according to the Mohr–Coulomb criterion.
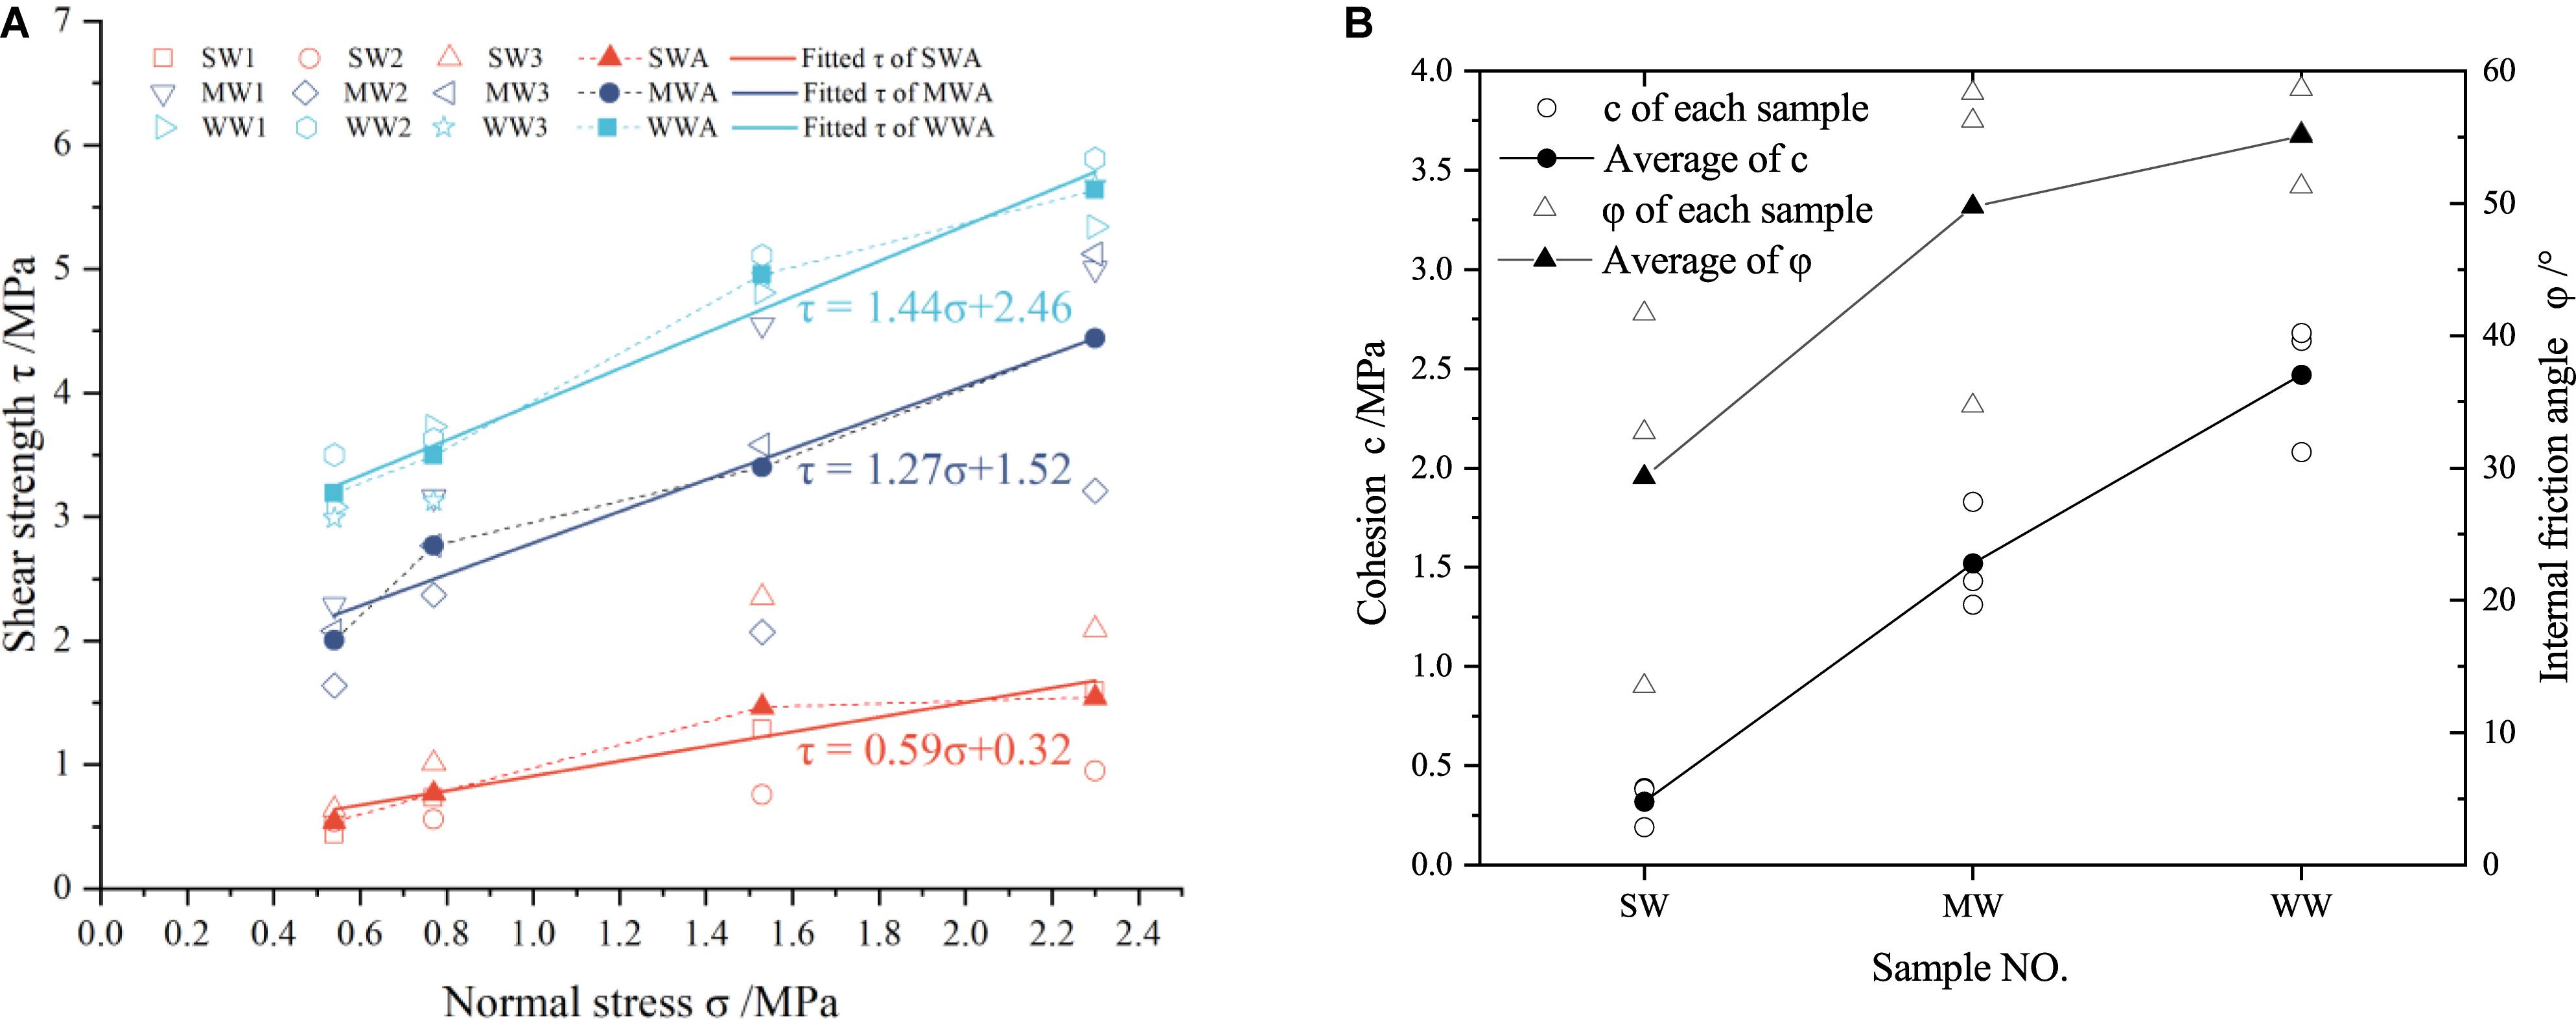
Figure 6. Shear strength parameters of samples according to the Mohr–Coulomb criterion. (A) Direct shear test results and Mohr–Coulomb fits. (B) Cohesion and internal friction angle of the samples.
Numerical Modeling and Simulated Results
Numerical Model and Micro-Parameters
The cohesion and the internal friction angle of weathering diorite-porphyrite have been obtained using specimens by experimental tests, and numerical simulation should be conducted to illustrate the distribution of the contact force and the initiation, propagation, and coalescence of microcracks for further analysis. Considering the calculation efficiency, a two-dimensional commercial DEM program particle flow code (PFC2D) was used in this section. In the numerical simulation, the size of the sample is 5 cm × 5 cm. Taking into account the computing time, 7,555 fine-grained particles with a minimum radius of 0.25 mm and a maximum radius of 0.4 mm were generated to simulate the rock sample.
The determination of the microparameters in the numerical simulation software is of great importance, which is related to the accuracy of engineering analysis in the future. Corresponding to the indoor laboratory tests in section “Rock Specimens and Testing Procedure”, three types of numerical diorite-porphyrite models were considered in this numerical study: (1) NSW for the strongly weathered diorite-porphyrite, (2) NMW for the moderately weathered diorite-porphyrite, and (3) NWW for the weakly weathered diorite-porphyrite. Mechanical weathering can reduce the modulus and the density of the rock, so different effective modulus and density were adopted to simulate the effects of physical weathering. Chemical weathering can reduce the bond strength on the mineral surfaces (Grgic et al., 2013), and thus different parallel bond parameters, especially the tensile strength and the cohesion, were adopted to simulate the chemical weathering of the diorite-porphyrite samples.
Uniaxial compression tests were firstly performed to calibrate the microscopic parameters on the numerical specimens. The calibration process of microscopic parameters was performed by a trial-and-error method. In the laboratory tests, the uniaxial compressive strength of the strongly weathered, the moderately weathered, and the weakly weathered samples is 4.08, 7.17, and 11.70 MPa, respectively. In the numerical tests, the uniaxial compressive strength of the strongly weathered, the moderately weathered, and the weakly weathered samples is 4.14, 7.39, and 12.10 MPa, respectively. Note that the errors of the uniaxial compressive strength between the numerical models and the experimental specimens are less than 4% (1.47% for the strongly weathered model, 3.07% for the moderately weathered model, and 3.42% for the weakly weathered model), so the calibration achievements can be adopted for the numerical direct shear tests. The microscopic parameters of the three types of numerical diorite-porphyrite models are listed in Table 3.
Table 3. Microscopic parameters of three types of numerical diorite-porphyrite samples.
Direct shear tests were performed on the numerical models under the normal stress of 0.54, 0.77, 1.53, and 2.30 MPa, respectively. To ensure that the specimens remain in a quasi-static equilibrium state, a horizontal velocity of 0.02 m/s was applied on the upper shear box, and the lower shear box was kept stationary. Bond breakage and shear stress were monitored by the history command in PFC until the shear displacement reaches 4 mm.
Analysis of the Crack Evolution Process
Figure 7 shows the morphology, the contact force chain, and the fractures of the numerical models with different degrees of weathering. The initiation, propagation, and coalescence of microcracks can be observed from Figure 7. In the figure of contact force chain, the blue color stands for the compressive force, while the red color stands for the tensile force. In the figure of fractures, the red points stand for the shear crack, while the blue points stand for the tensile crack. It can be seen that the number of microcracks decreases as the degree of weathering decreases, which indicates that the shear strength increases with the decrease of the degree of weathering.
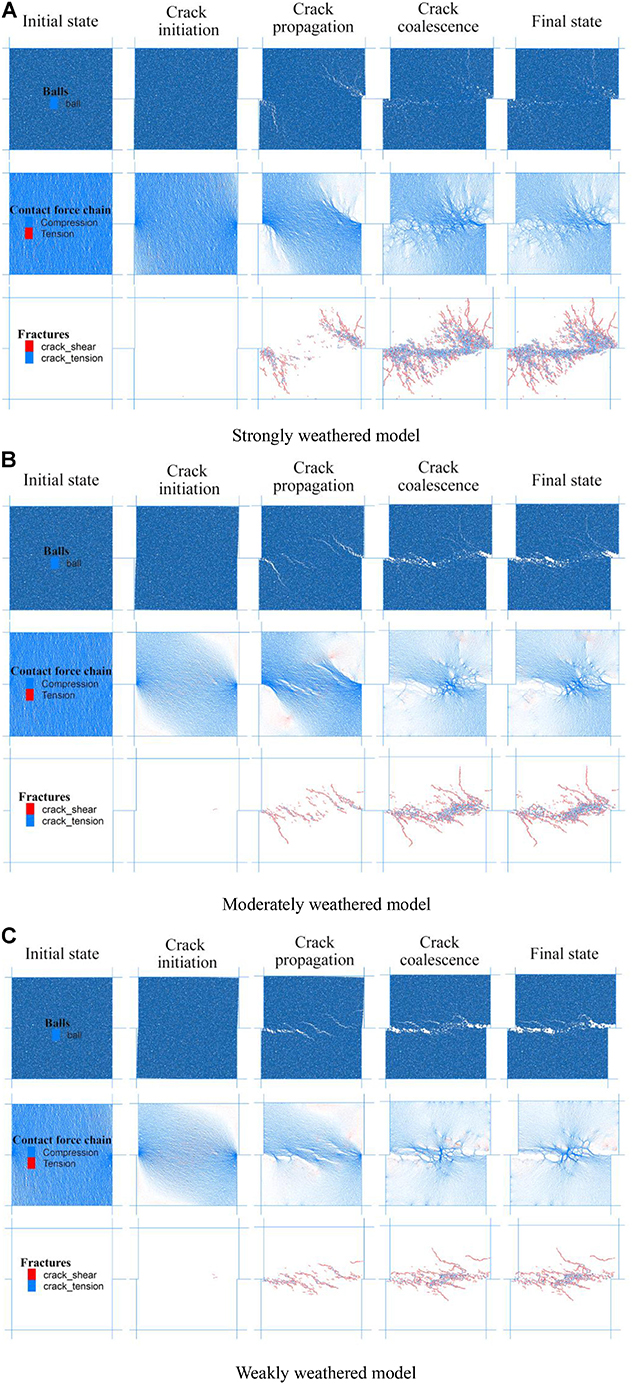
Figure 7. Failure stages of models with different degrees of weathering. (A) Strongly weathered model. (B) Moderately weathered model. (C) Weakly weathered model.
It is observed that the microcracks are initiated at around two edges of the shear boxes. The contact force chain shows that the concentration of stress occurs at the edge of the two shear boxes. The tensile cracks obviously increase with the increase of the degree of weathering. Moreover, the increased rate of the tensile crack numbers after the peak strength is obviously higher than that of shear crack numbers. At the final state, i.e., the shear displacement reaches the maximum at 4 mm, for the strongly weathered specimens, the cracks run through the upper and the lower edges of the specimen, reflecting the looseness of the rock samples. Furthermore, comparing the crack in the weakly weathered samples to that in the moderately weathered samples, the length becomes small and the number becomes reduced, reflecting the integrality of the weakly weathered rock samples.
Numerically Simulated Shear Stress–Displacement Curves
Figure 8 shows the shear stress–displacement curves of the diorite-porphyrite models with different degrees of weathering. It can be seen that the shear strength of the specimen with a specific degree of weathering generally increased with an increase in the normal stress. The shear stress curves show similar trends, with an increase up to the peak followed by a decrease to the residual stress. For the strongly weathered specimens, the shear stress–displacement curve shows a relatively flat trend under a low normal stress. Moreover, with the increase of the normal stress, the difference between the residual shear strength and the peak shear strength increases gradually. For both of the moderately weathered and the slightly weathered specimens, there are typical peak points in the shear stress–displacement curves under the different normal stresses. After the specimens were destroyed, the shear stress declined quickly to the residual stress. Moreover, it can also be observed in Figure 8 that the shear displacements at the peak strengths of the slightly weathered specimens are greater than those of the moderately weathered specimens.
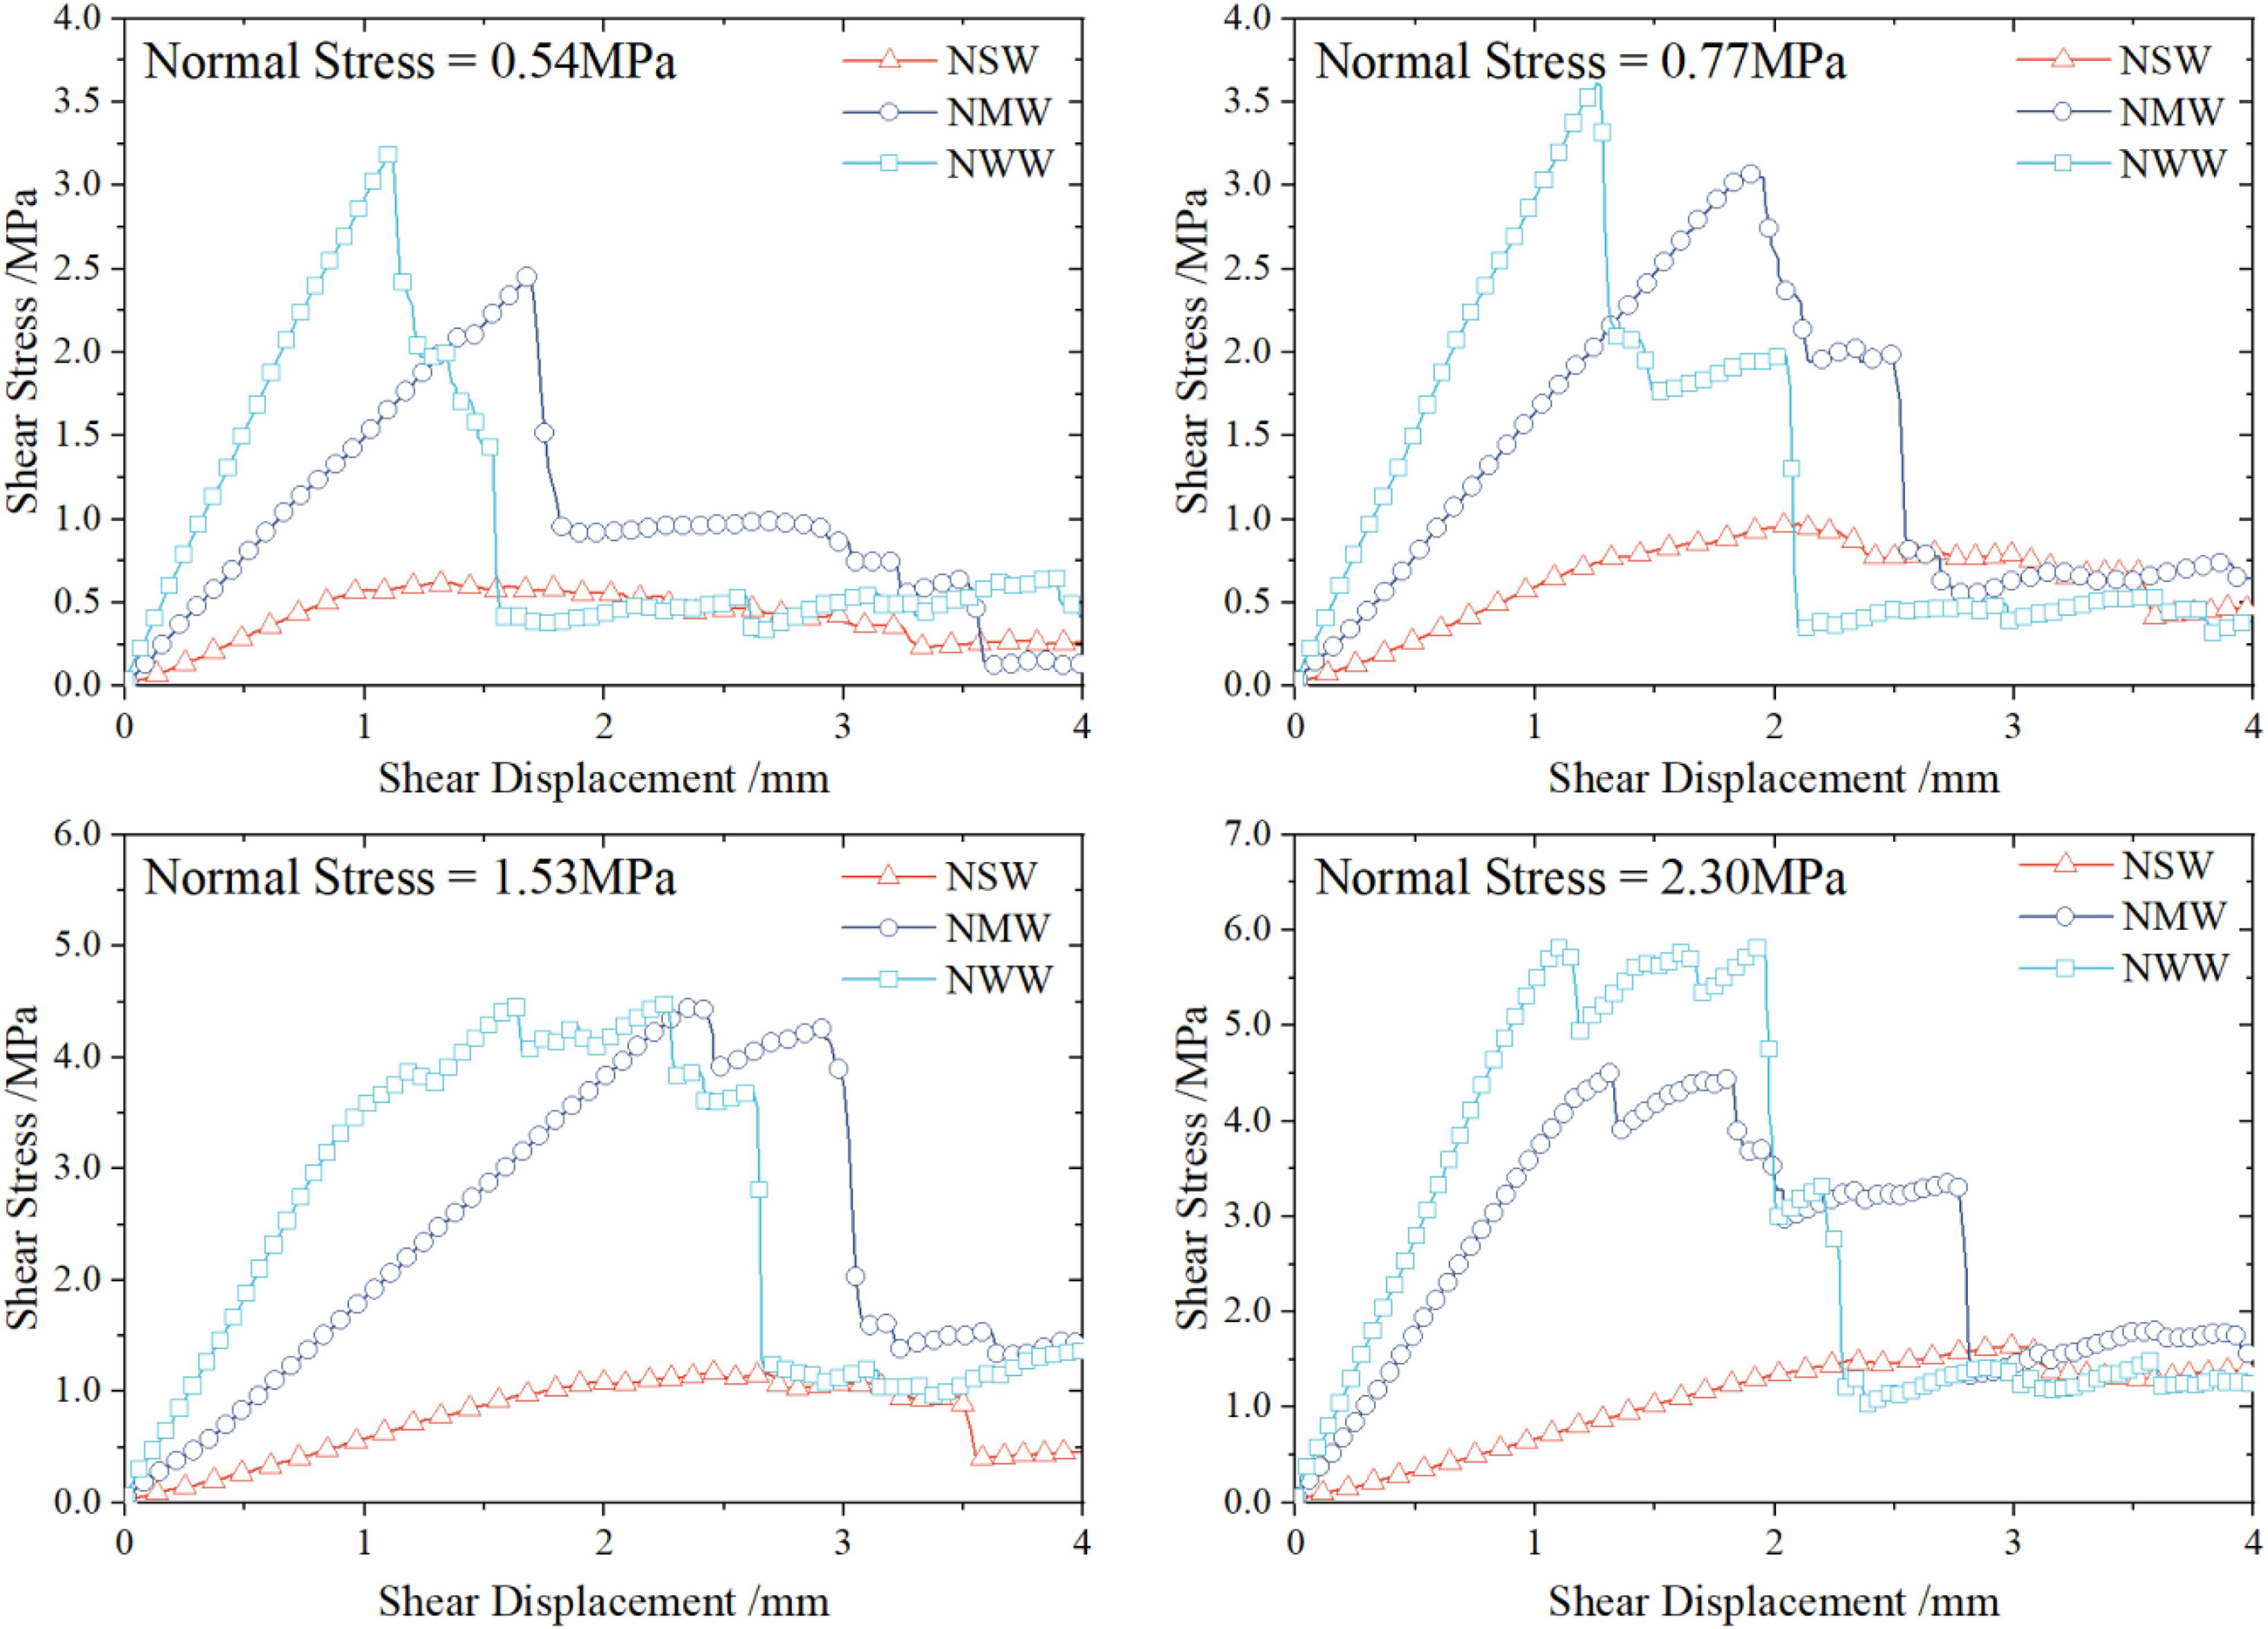
Figure 8. Shear stress–displacement curves of numerical models under direct shear tests.
From Figure 8, it can be seen that the shear strength of the strongly weathered models is much lower than that of the moderately weathered and the weakly weathered models regardless of the normal stress. The shape of the shear stress–displacement curve of the moderately weathered model is similar to that of the weakly weathered model under the different normal stresses. With the decrease of the degree of weathering, the shear displacement at the peak stress decreases, indicating that the stiffness of the specimen increases. After the shear failure, the residual strength changes stably in the same interval with the increase of the shear displacement, regardless of the degree of weathering.
Numerically Simulated Macro-Mechanical Parameters
Table 4 is a list of the shear strengths obtained by the numerical experiments in this research. From Table 4, it is clear that the shear strength of the diorite-porphyrites specimens with different degrees of weathering shows a similar increasing trend with the increase of the normal stress. With the decrease of the degree of weathering, the shear strength increased from 0.58, 0.77, 1.34, and 1.86 MPa to 2.76, 3.30, 4.32, and 5.00 MPa when the normal stresses are 0.54, 0.77, 1.53, and 2.30 MPa, respectively. The shear strength parameters with the different weathering numerical models are also shown in Table 4. The cohesion and the internal friction angle of the numerical strongly weathered models, the moderately weathered models, and the weakly weathered models are 0.21 MPa and 35.70° (R2 value of 0.9993), 1.62 MPa and 39.71° (R2 value of 0.9819), and 2.25 MPa and 50.99° (R2 value of 0.9694), respectively. The coefficients of determinations are all above 0.96, which show the linear relationship between the shear strength and the normal stress.
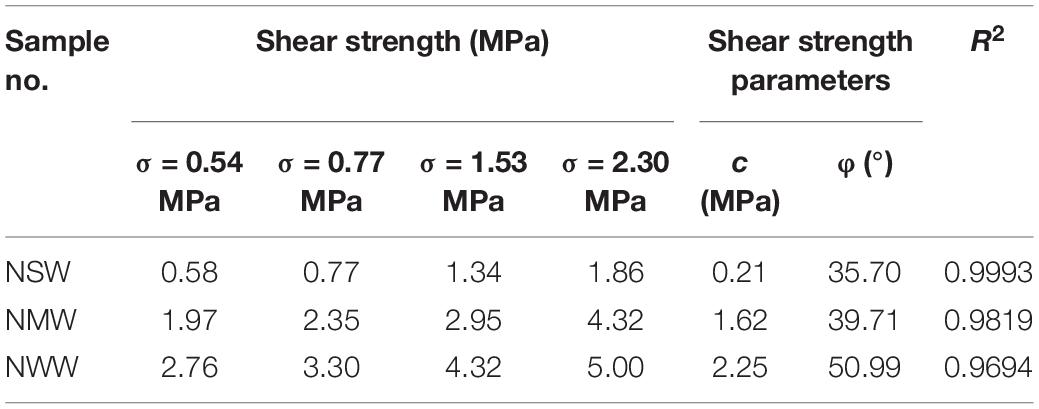
Table 4. Shear strength parameters of the numerical diorite-porphyrite model.
Figure 9A shows the relationship of the shear strength with the normal stress in the models of the different degrees of weathering. Figure 9B shows the cohesion and the internal friction angle of the models of the different degrees of weathering. It can be seen from Figure 9 that with the decrease of the degree of weathering, the shear strength of the specimen increases gradually, and the difference between the different grades is also approximately equal. The cohesion and the internal friction angle of the models of the different degrees of weathering increase obviously with the decrease of the degree of weathering. From the perspective of growth rate, the increase rate of the cohesion is bigger than that of the internal friction angle from the strongly weathered model to the moderately weathered model, while in the moderately weathered stage to the weakly weathered stage, the growth rate of the cohesion is smaller than that of the internal friction angle.
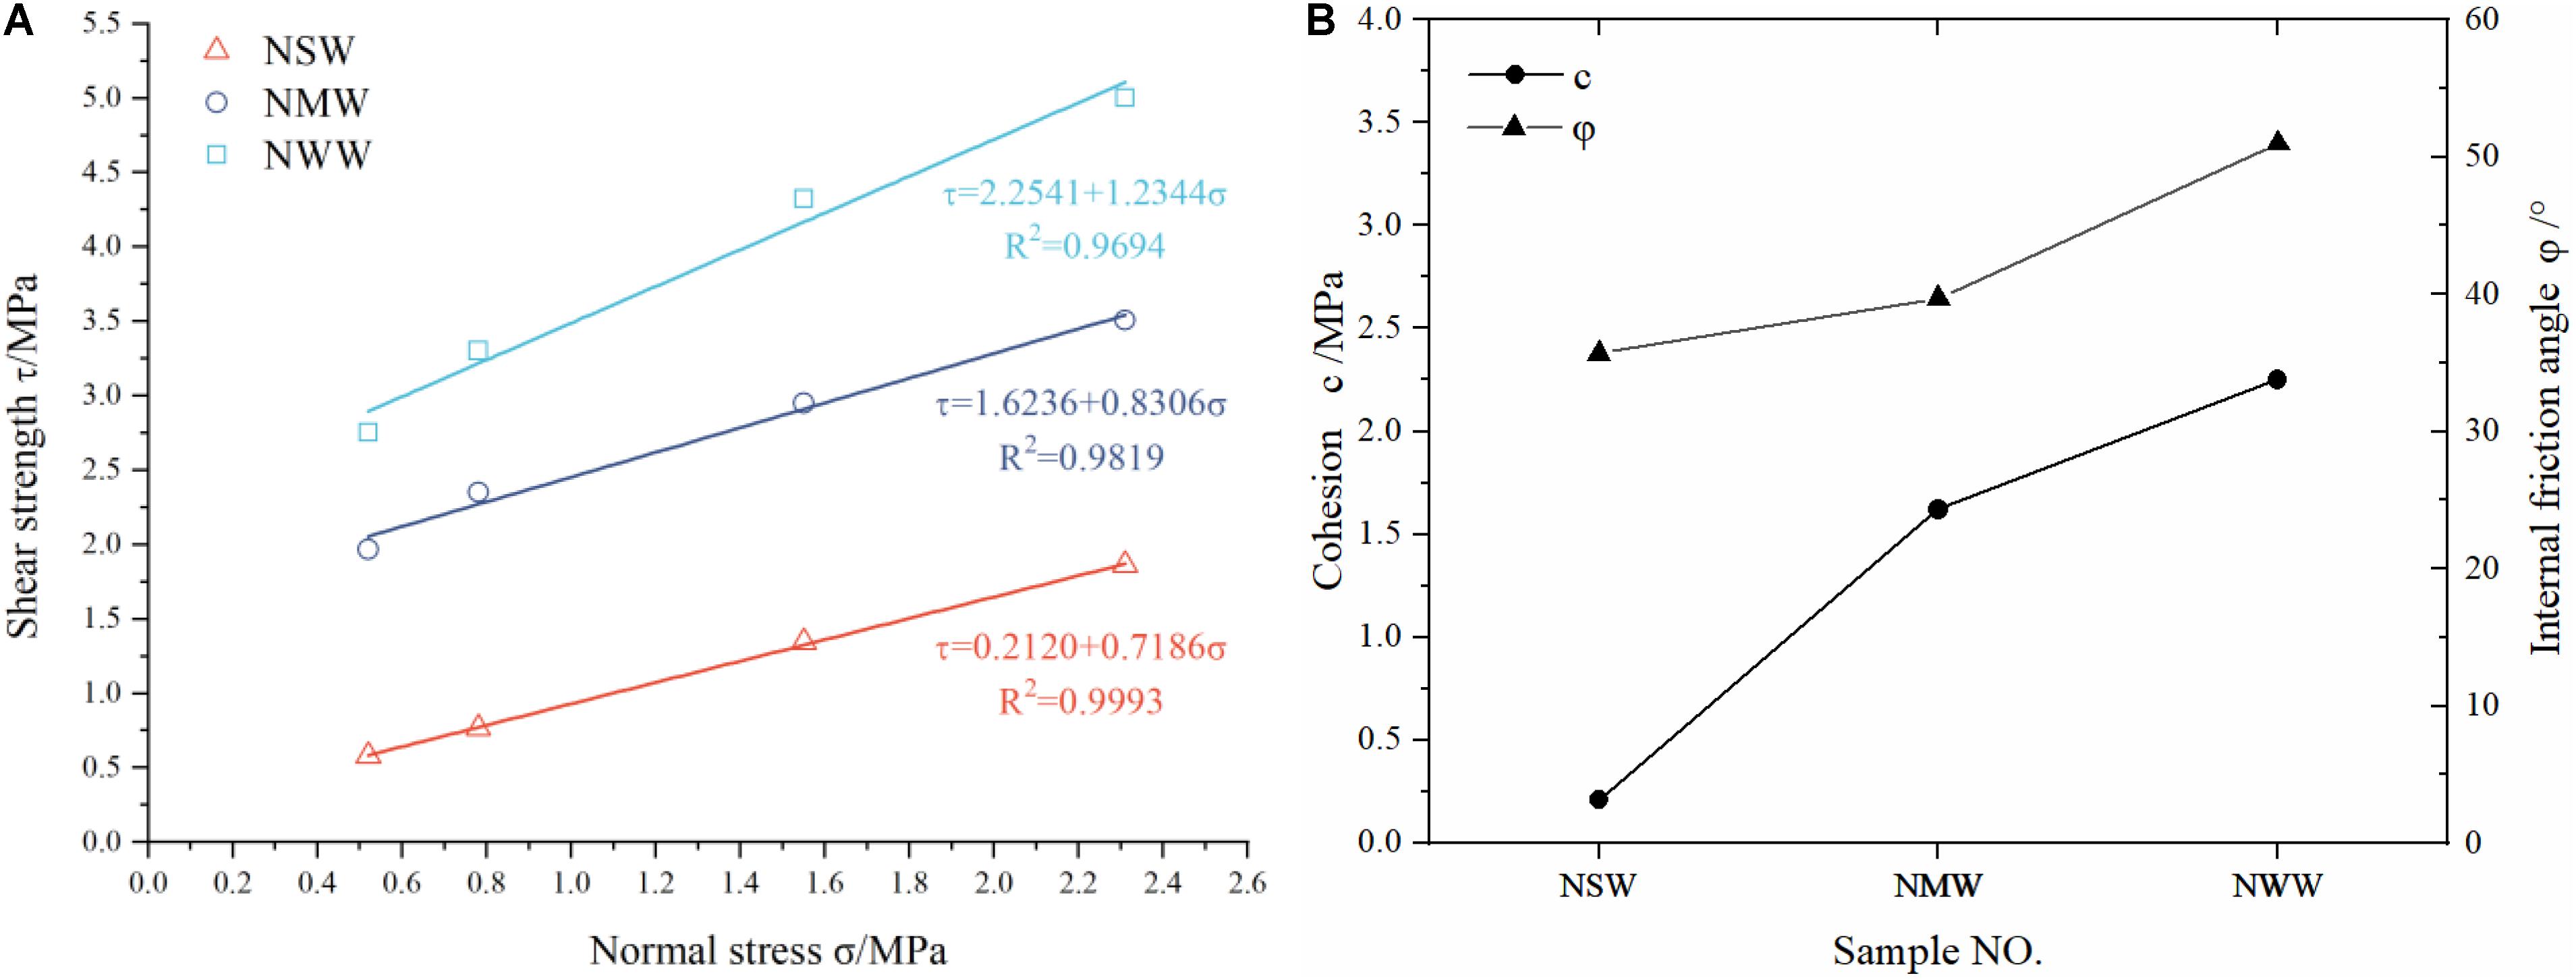
Figure 9. Shear strength parameters of numerical models according to the Mohr–Coulomb criterion. (A) Direct shear test results and Mohr–Coulomb fits. (B) Cohesion and internal friction angle.
Discussion
Figure 10 compares the status of the models of the different degrees of weathering after experiencing the shear process at the different normal stresses between the experiment and the PFC simulation. From Figure 10, it can be observed that the fracture patterns simulated by PFC2D are in good agreement with the results of the experiment.
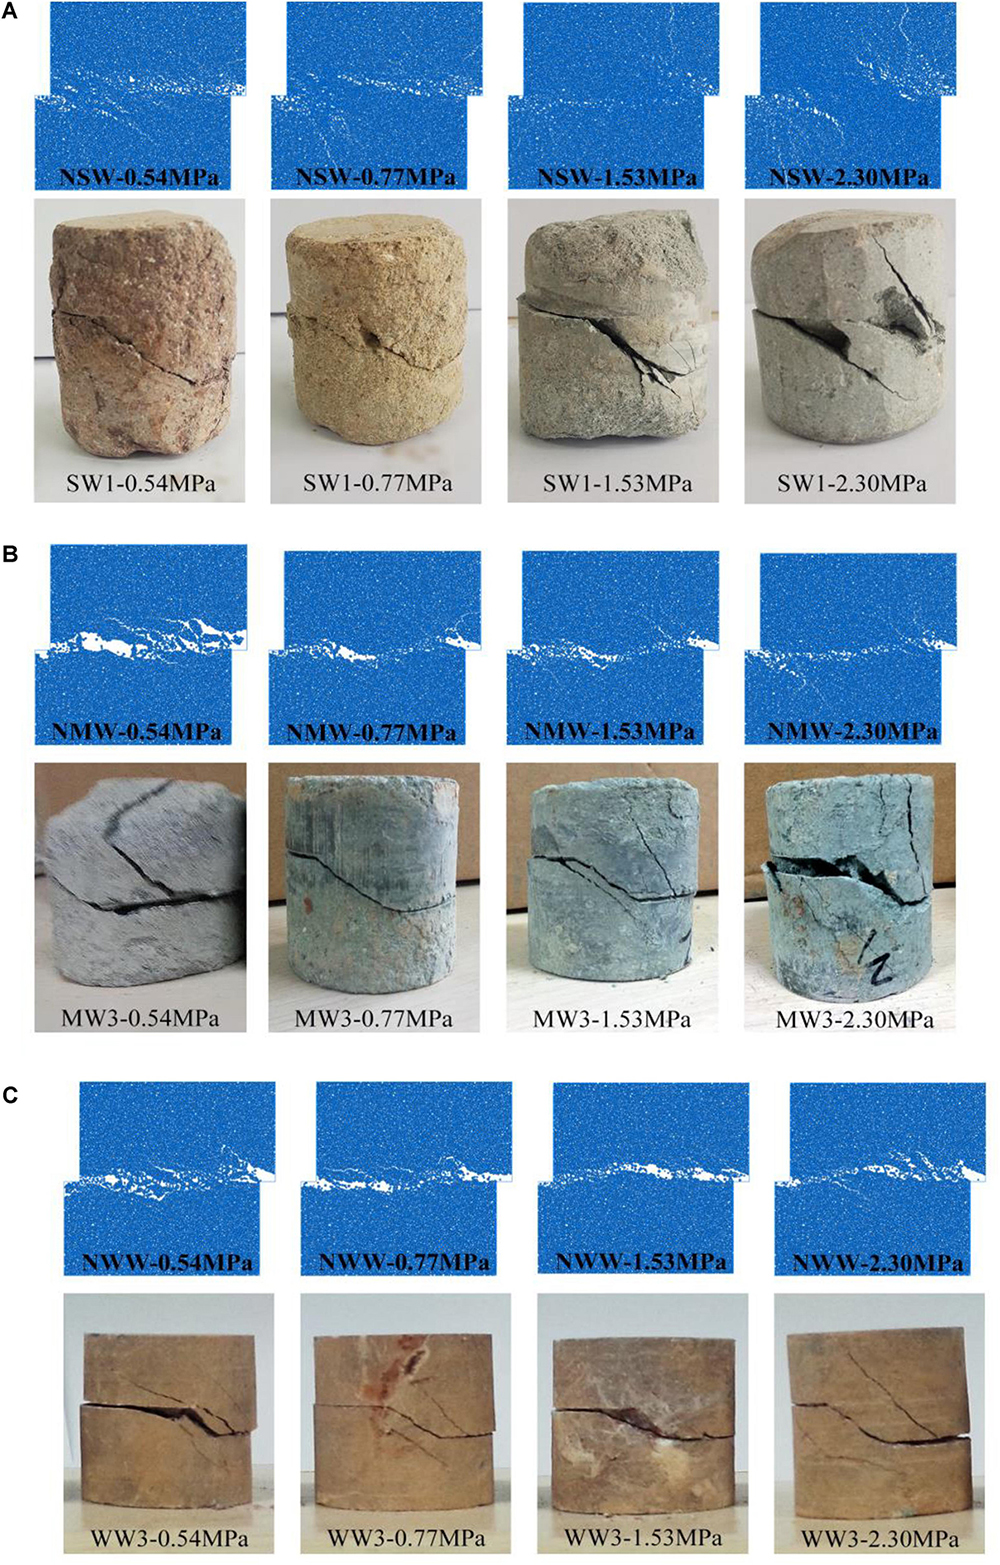
Figure 10. Crack morphology of the different weathered samples after experiencing shear process at different normal stresses. (A) Strongly weathered samples. (B) Moderately weathered samples. (C) Weakly weathered samples.
A major failure surface and a secondary failure surface can be observed in each model. With the decrease of the degree of weathering, the failure surfaces become obvious gradually. Meanwhile, with the increase of the normal stress, the secondary failure surfaces become obvious. Under the same normal force, the length of the fracture becomes shorter when the degree of weathering weakens, which indicates the integrity of the rock sample. Due to the calcite fracture surface in the natural rock mass, there are some tiny shear failure surfaces in the natural models, which reduce the shear strength of the natural diorite-porphyrite models.
Based on Figure 10, we can conclude that the agreement between the experiment and the numerical simulations is impressive. It reflects the failure behavior of the weathered diorite-porphyrite sample in the direct shear test appropriately. To better understand the mechanical properties of the weathered diorite-porphyrite samples, typical types of shear stress–displacement curves were summarized from all of the 72 shear stress–displacement curves in the experimental and the numerical tests, which are shown in Figure 11.
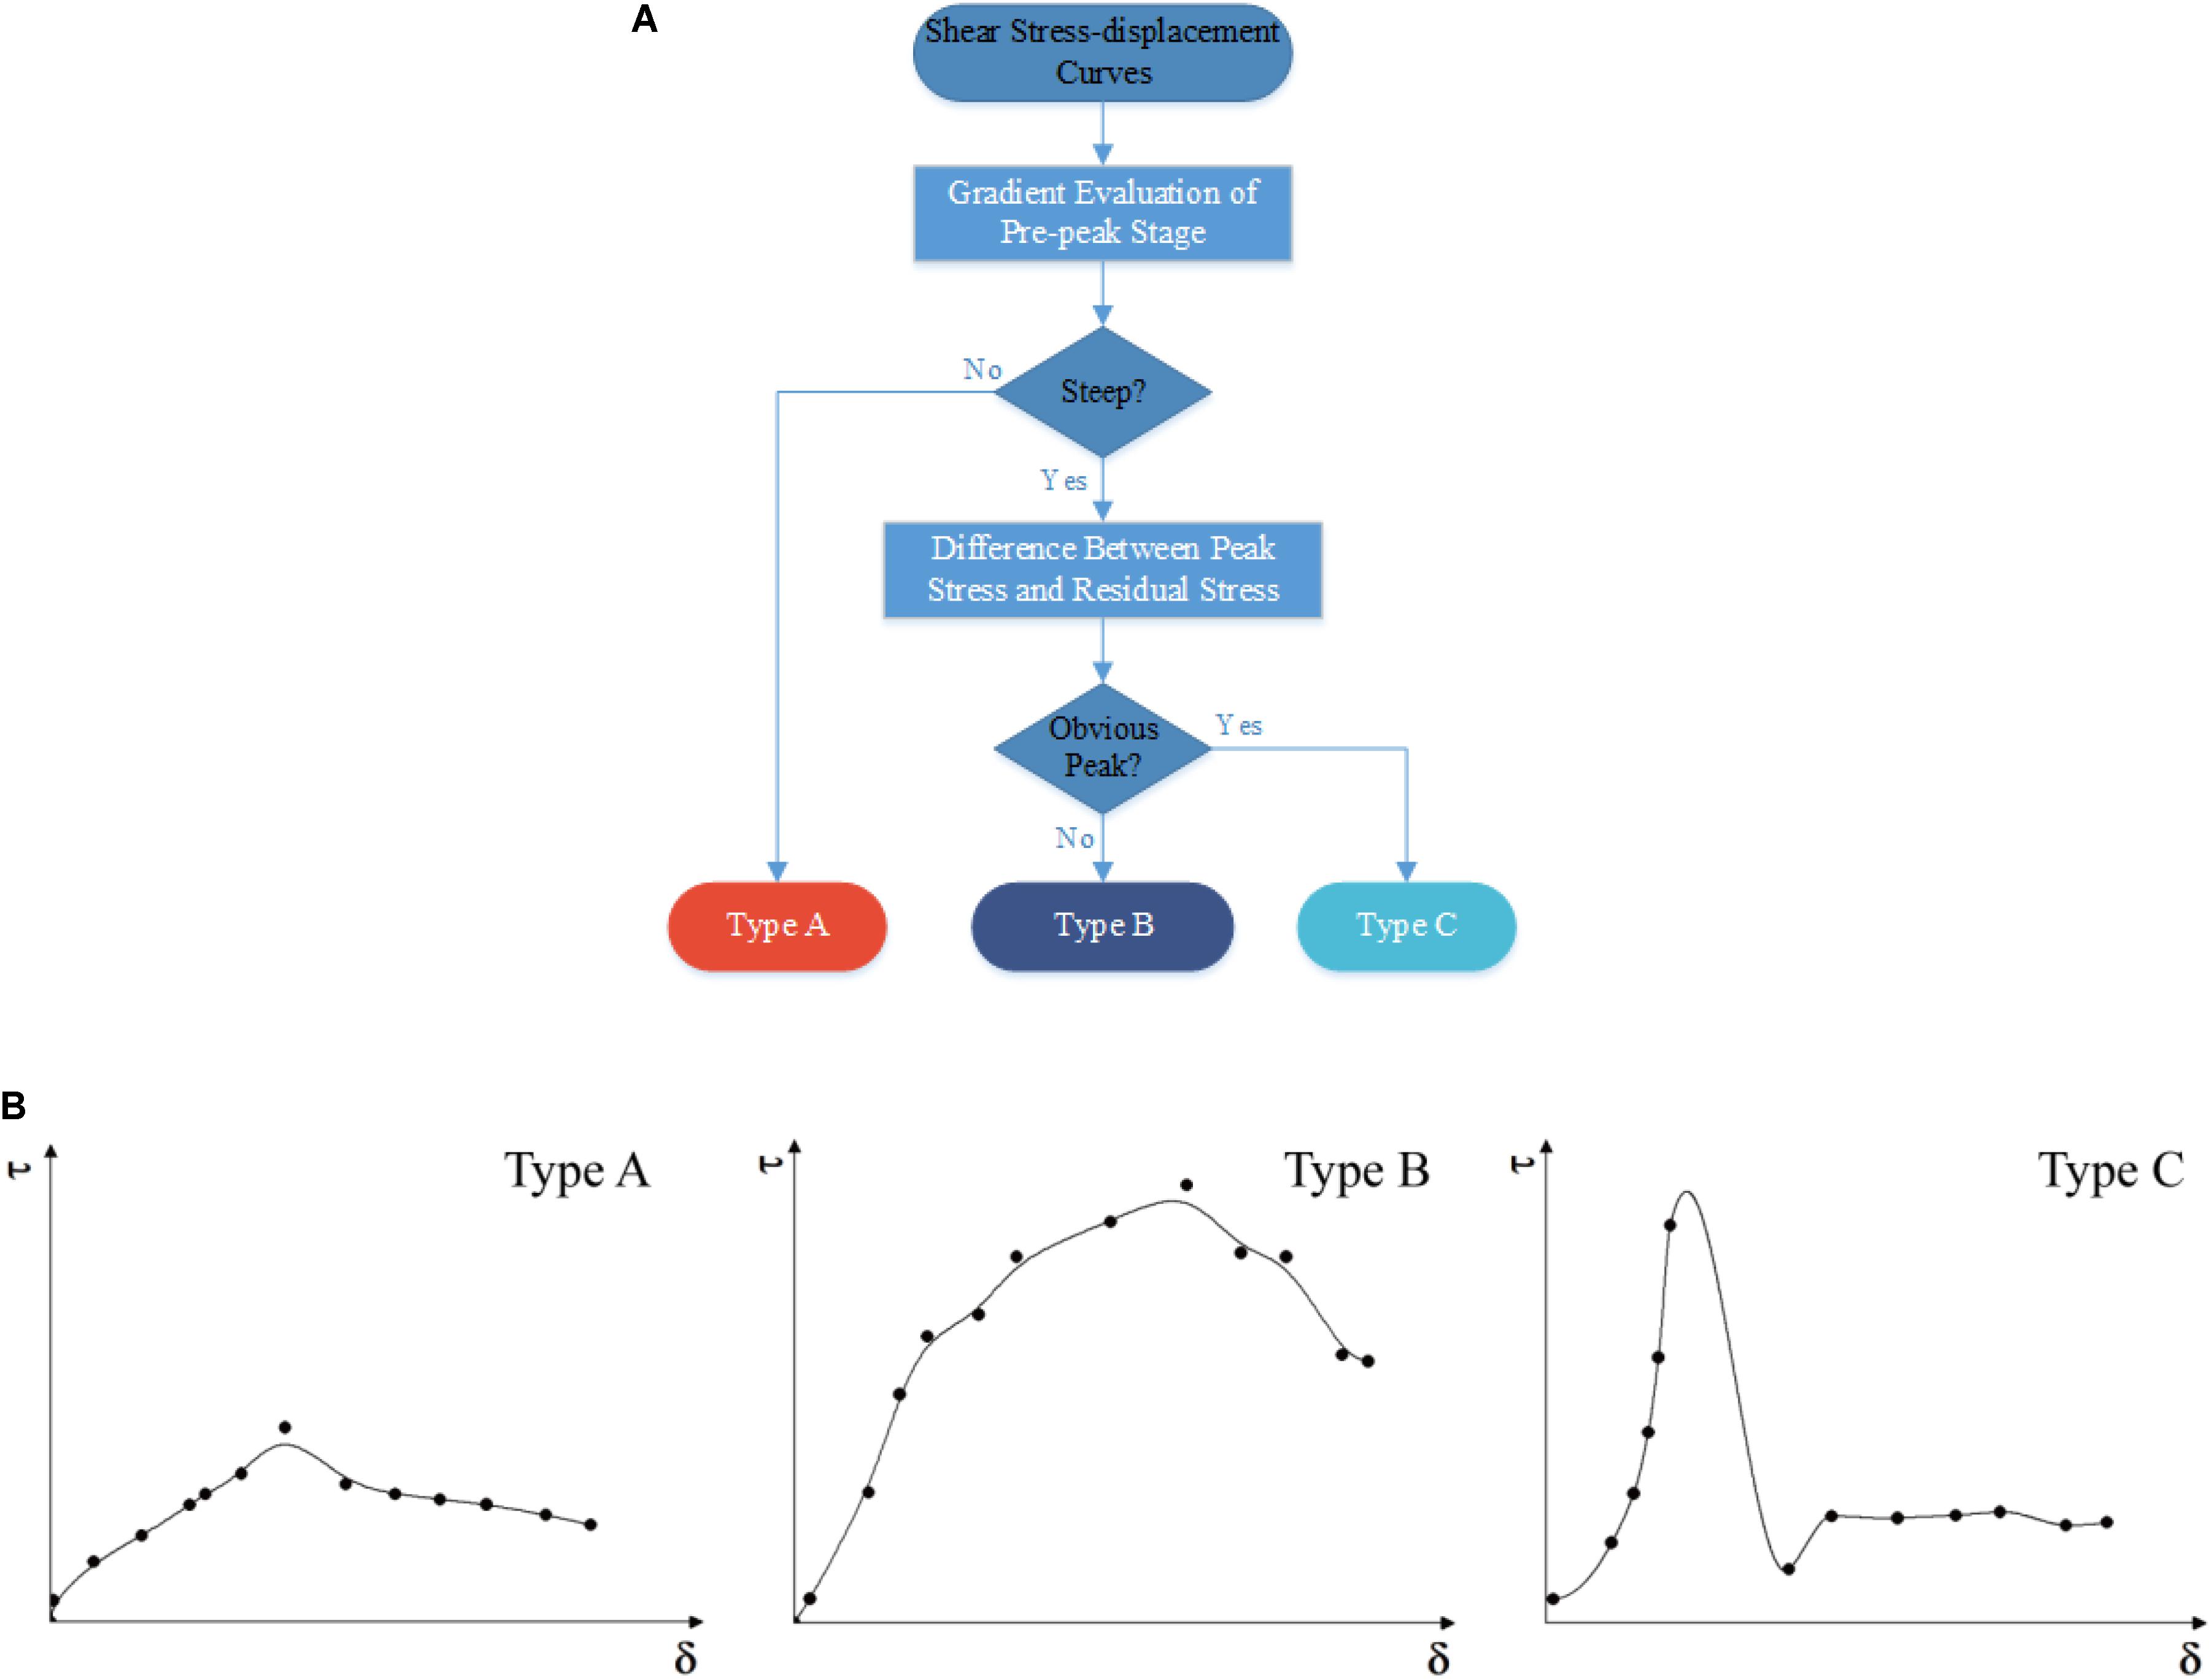
Figure 11. Classification of the shear stress–displacement curves. (A) Process for determining the type of curve. (B) Three types of the shear stress–displacement curve.
Figure 11A shows the process of determining the typical curves of the shear stress versus the shear displacement for the experimental tests and the numerical simulations. For the shear stress–displacement curve, there are three basic features. The first feature is the gradient of the pre-peak stage, which represents the modulus of the material. The second feature is the peak stress, which represents the shear strength of the rock. The third feature is the steepness of the descending portion of the curve, which is a measure of the brittleness. Based on the three features, the shear stress–displacement curves of the diorite-porphyrite samples with different degrees of weathering, under various normal stresses, can be divided into three types:
(1) Type A – As shown in Figure 11B, there is no obvious peak value in this type of curve. The significant curve of this type is observed from the strongly weathered samples when the normal stress is relatively low (as shown in Figures 5, 8). When the normal stress is 0.54 MPa, the whole curve is relatively smoother; the residual shear strength is similar to the peak shear strength.
(2) Type B – As shown in Figure 11B, there is a peak in this type of curve, but not as conspicuous as the one in type C. This type of curve can be defined as an inconspicuous peak curve due to the step curve after reaching the peak stress. The difference between the residual strength and the peak strength is bigger than type A but less than type C.
(3) Type C – This type of curve is a common one of the shear stress–displacement curve, which can be observed in the three types of weathering samples, especially in the weakly weathered and the moderately weathered samples. As shown in Figure 11B, a significant peak is observed in this type of curve as a consequence of shearing off; the shear stress reduced rapidly to the residual strength.
For the strongly weathered diorite-porphyrite samples, the shear stress–displacement curves are mostly of type A. When the normal stress is small, the shape of type A is typical. As the normal stress increases, the curve changes to type B. That is to say, when the strongly weathered sample is under a big normal stress, the decrease of the shear stress becomes bigger in the post-peak stage.
For the moderately weathered diorite-porphyrite samples, the shear stress–displacement curves are mostly of type B. The difference between the peak strength and the residual strength of the moderately weathered samples is larger than that of the strongly weathered samples, whether the normal stress is high or low. After the shear failure of the specimen, the shear stress decreases significantly, and the rate of decline is very large, especially in the case of the high normal stress.
For the weakly weathered diorite-porphyrite samples, most of the shear stress–displacement curves belong to type C. In the initial stage, the rock sample is in the elastic stage; with the increase in the shear displacement, the shear stress increases, and the increase rate gradually grows. The shear stress decreases obviously as the shear displacement increases in the post-peak stage. In the residual strength stage, the shear stress remains stable at a lower level.
Conclusion
The aim of the present study was to provide an analysis of the mechanical properties of the diorite-porphyrite samples with different degrees of weathering under the direct shear test. For that purpose, comparisons of mechanical properties and failure modes between the specimens with different degrees of weathering are made. The following conclusions were drawn from the experimental and the numerical results:
(1) At the micrometer scale, the diorite-porphyrite samples gathered from Jurong pumped storage power station are mainly constituted of quartz, feldspar, calcite, dolomite, chlorite, mica, and pyrite. Weathering has changed the chemical composition of the diorite-porphyrite samples. The unaltered diorite-porphyrite contains Na2O, while the altered diorite-porphyrite does not.
(2) The shear stress–displacement curve of the strongly weathered, the moderately weathered, and the weakly weathered samples can be summarized into three types: exponential curve (type A), non-obvious peak curve (type B), and obvious peak curve (type C). Moreover, the post-peak shear stress of type C falls faster to the residual stress than the shear stress of type B.
(3) With the same degree of weathering, the shear stress increases as the normal stress increases from 0.54 to 2.30 MPa. Moreover, there is a significant fluctuation in the shear stress–displacement curve when the normal stress is relatively high. For the strongly weathered diorite-porphyrite, the type of shear stress–displacement curve is the exponential curve (type A). The shear stress–displacement curve for the moderately weathered diorite-porphyrite can be divided into the non-obvious peak curve (type B) and the obvious peak curve (type C). Moreover, the obvious peak curve (type C) could effectively fit the shear stress–displacement curve of the weakly weathered diorite-porphyrite.
(4) Based on the experimental tests, the DEM model of the diorite-porphyrite specimen is established by the particle flow code 2D (PFC2D) to obtain a set of microparameters which can effectively simulate the weathering diorite-porphyrite. The simulation results show a good agreement with the experimental results. As the degree of weathering weakened, the cohesion and the internal friction angle became larger. Affected by rock mass heterogeneity, the fluctuation of the test results is more significant than the numerical results for the same samples under the same normal stress.
This experiment has yielded some conclusions on the mechanical response of diorite-porphyrite with different degrees of weathering, and a set of microparameters which can simulate the mechanical property of weathering diorite-porphyrite in PFC2D has been obtained; it would be useful when simulating the weathering diorite-porphyrite for engineering analysis in the future.
Data Availability Statement
All datasets generated for this study are included in the article/supplementary material.
Author Contributions
All authors listed have made a substantial, direct and intellectual contribution to the work, and approved it for publication.
Funding
This research was financially supported by the National Natural Science Foundation of China (Grant Nos. 41672258 and 41102162).
Conflict of Interest
The authors declare that the research was conducted in the absence of any commercial or financial relationships that could be construed as a potential conflict of interest.
Acknowledgments
The authors gratefully acknowledge M. S. Yinlong Han in School of Earth Sciences and Engineering, Hohai University, China, for his contribution to the experimental process.
References
Bons, P. D., Elburg, M. A., and Gomez-Rivas, E. (2012). A review of the formation of tectonic veins and their microstructures. J. Struct. Geol. 43, 33–62. doi: 10.1016/j.jsg.2012.07.005
Chen, Y. F., and Lin, H. (2019). Consistency analysis of Hoek–Brown and equivalent Mohr–Coulomb parameters in calculating slope safety factor. Bull. Eng. Geol. Environ. 78, 4349–4361. doi: 10.1007/s10064-018-1418-z
Colman, S. M. (1981). Rock-weathering rates as functions of time. Q. Res. 15, 250–264. doi: 10.1016/0033-5894(81)90029-90026
Cundall, P. A., and Strack, O. D. L. (1979). A discrete numerical model for granular assemblies. Géotechnique 29, 47–65. doi: 10.1680/geot.1979.29.1.47
Dai, F., Li, B., Xu, N., Fan, Y., and Zhang, C. (2016). Deformation forecasting and stability analysis of large-scale underground powerhouse caverns from microseismic monitoring. Int. J. Rock Mech. Min. Sci. 86, 269–281. doi: 10.1016/j.ijrmms.2016.05.001
Duan, S. Q., Feng, X. T., Jiang, Q., Liu, G. F., Pei, S. F., and Fan, Y. L. (2017). In situ observation of failure mechanisms controlled by rock masses with weak interlayer zones in large underground cavern excavations under high geostress. Rock Mech. Rock Eng. 50, 2465–2493. doi: 10.1007/s00603-017-1249-4
Espada, M., Muralha, J., Lemos, J. V., Jiang, Q., Feng, X. T., Fan, Q., et al. (2018). Safety analysis of the left bank excavation slopes of baihetan arch dam foundation using a discrete element model. Rock Mech. Rock Eng. 51, 1–19.
Fan, X., Li, K., Lai, H., Xie, Y., Cao, R., and Zheng, J. (2018). Internal stress distribution and cracking around flaws and openings of rock block under uniaxial compression: a particle mechanics approach. Comp. Geotech. 102, 28–38. doi: 10.1016/j.compgeo.2018.06.002
Fei, W. P., Zhang, L., and Zhang, R. (2010). Experimental study on a geo-mechanical model of a high arch dam. Int. J. Rock Mech. Min. Sci. 47, 299–306. doi: 10.1016/j.ijrmms.2009.12.005
Grgic, D., Giraud, A., and Auvray, C. (2013). Impact of chemical weathering on micro/macro-mechanical properties of oolithic iron ore. Int. J. Rock Mech. Min. Sci. 64, 236–245. doi: 10.1016/j.ijrmms.2013.09.005
Hu, Q., Cai, Q., He, L., Yang, X., Ye, T., and Shi, R. (2017). Determination of the peak and residual shear strengths of the sandwich material in slopes. Adv. Mater. Sci. Eng. 2017, 1–15. doi: 10.1155/2017/9641258
Le, H., Sun, S., Kulatilake, P. H. S. W., Asce, F., and Wei, J. (2018). Effect of grout on mechanical properties and cracking behavior of rock-like specimens containing a single flaw under uniaxial compression. Int. J. Geomech. 18, 1–16. doi: 10.1061/(ASCE)GM.1943-5622.0001225
Li, Z., Chen, L., and Wan, L. (2011). In situ test study on shear strength properties of weathered silty mudstone. Adv. Mater. Res. 147, 10–13. doi: 10.4028/www.scientific.net/amr.146-147.10
Lin, H., Ding, X. R., Yong, R., Xu, W. Z., and Du, S. G. (2019a). Effect of non-persistent joints distribution on shear behavior. Comptes Rendus - Mecanique 347, 477–489. doi: 10.1016/j.crme.2019.05.001
Lin, H., Xie, S. J., Yong, R., Chen, Y. F., and Du, S. G. (2019b). An empirical statistical constitutive relationship for rock joint shearing considering scale effect. Comptes Rendus - Mecanique 347, 561–575. doi: 10.1016/j.crme.2019.08.001
Liu, Y. R., Guan, F. H., Yang, Q., Yang, R. Q., and Zhou, W. Y. (2013). Geomechanical model test for stability analysis of high arch dam based on small blocks masonry technique. Int. J. Rock Mech. Min. Sci. 61, 231–243. doi: 10.1016/j.ijrmms.2013.03.003
Meng, T., Hu, Y., Fang, R., Fu, Q., and Yu, W. (2016). Weakening mechanisms of gypsum interlayers from yunying salt cavern subjected to a coupled thermo-hydro-chemical environment. J. Nat. Gas Sci. Eng. 30, 77–89. doi: 10.1016/j.jngse.2016.01.039
Ministry of Housing and Urban-Rural Development (2009). Code for Investigation of Geotechnical Engineering (GB50021-2001). Beijing: China Architecture & Building Press. doi: 10.1016/j.jngse.2016.01.039
Miščević, P., and Vlastelica, G. (2010). “Shear strength of weathered soft rock—proposal of test method additions. Rock Engineering in Difficult Ground Conditions - Soft Rocks and Karst,” in Proceedings of the Regional Symposium of the International Society for Rock Mechanics, EUROCK 2009 (January 2009), Eurock, 303–308.
Naiqi, S. W. Y. L. S., and Wei, K. H. L. M. W. (1991). Model study of intercalated shear zone in Gezhouba dam foundation. J. Wuhan University Hydraulic Electr. Eng. 5, 495–502.
Özbek, A. (1998). Investigation of the effects of wetting–drying and freezing–thawing cycles on some physical and mechanical properties of selected ignimbrites. Bull. Eng. Geol. Environ. 38, 109–109. doi: 10.1144/GSL.QJEG.1997.030.P3.04
Potyondy, D. O., and Cundall, P. A. (2004). A bonded-particle model for rock. Int. J. Rock Mech. Min. Sci. 41, 1329–1364. doi: 10.1016/j.ijrmms.2004.09.011
Shi, C., Yang, W. K., Yang, J. X., and Chen, X. (2019). Calibration of micro-scaled mechanical parameters of granite based on a bonded-particle model with 2D particle flow code. Granul. Matter 21, 21–38.
Sun, D. A., Matsuoka, H., Muramatsu, D., Hara, T., Kudo, A., Yoshida, Z., et al. (2004). Deformation and strength characteristics of weathered soft rock using triaxial tests. Int. J. Rock Mech. Min. Sci. 41, 1–6. doi: 10.1016/j.ijrmms.2004.03.024
Sun, S., Sun, H., Wang, Y., Wei, J., Liu, J., and Kanungo, D. P. (2014). Effect of the combination characteristics of rock structural plane on the stability of a rock-mass slope. Bull. Eng. Geol. Environ. 73, 987–995.
Vlastelica, G., Miščević, P., and Pavić, N. (2017). Testing the shear strength of soft rock at different stages of laboratory simulated weathering. J. Croat. Assoc. Civil Eng. 68, 955–965. doi: 10.14256/JCE.1878.2016
Wang, W., Sun, S., Le, H., Shu, Y., Zhu, F., Fan, H., et al. (2019a). Experimental and numerical study on failure modes and shear strength parameters of rock-like specimens containing two infilled flaws. Int. J. Civil Eng. 17, 1895–1908.
Wang, X., Kang, H., and Gao, F. (2019b). Numerical investigation on the shear behavior of jointed coal mass. Comp. Geotech. 106, 274–285. doi: 10.1016/j.compgeo.2018.11.005
Yoon, J. (2007). Application of experimental design and optimization to PFC model calibration in uniaxial compression simulation. Int. J. Rock Mech. Min. Sci. 44, 871–889. doi: 10.1016/j.ijrmms.2007.01.004
Zelin, D., Qianqian, W., and Jing, W. (2016). Analysis on stability of an arch dam with interlayer shear zones. KSCE J. Civil Eng. 20, 2262–2269.
Zeng, Z., Kong, L., Wang, M., and Sayem, H. M. (2018). Assessment of the engineering behaviour of an intensely weathered swelling mudstone under the full range of seasonal variation and the relationships among the measured parameters. Can. Geotech. J. 55, 1–33. doi: 10.1139/cgj-2017-2582
Zhang, S. L., Zhu, Z. H., Qi, S. C., Hu, Y. X., Du, Q., and Zhou, J. W. (2018). Deformation process and mechanism analyses for a planar sliding in the Mayanpo massive bedding rock slope at the xiangjiaba hydropower station. Landslides 15, 2061–2073. doi: 10.1007/s10346-018-1041-x
Zhao, L., Zuo, S., Deng, D., Han, Z., and Zhao, B. (2018a). Development mechanism for the landslide at Xinlu Village, Chongqing, China. Landslides 15, 2075–2081. doi: 10.1007/s10346-018-1051-1058
Zhao, Z., Liu, Z., Pu, H., and Li, X. (2018b). Effect of thermal treatment on Brazilian tensile strength of granites with different grain size distributions. Rock Mech. Rock Eng. 51, 1293–1303.
Keywords: diorite-porphyrite, degree of weathering, direct shear tests, strength properties, numerical simulation
Citation: Fan H, Sun S, Le H, Zhu F, Wang W, Liu Y and Wang J (2020) An Experimental and Numerical Study of Diorite-Porphyrites With Different Weathered Degree in the Direct Shear Test. Front. Earth Sci. 7:352. doi: 10.3389/feart.2019.00352
Received: 04 September 2019; Accepted: 18 December 2019;
Published: 24 January 2020.
Edited by:
Hang Lin, Central South University, ChinaReviewed by:
Martin Charles Wilding, Sheffield Hallam University, United KingdomMatthew Louis Whitaker, Stony Brook University, United States
Copyright © 2020 Fan, Sun, Le, Zhu, Wang, Liu and Wang. This is an open-access article distributed under the terms of the Creative Commons Attribution License (CC BY). The use, distribution or reproduction in other forums is permitted, provided the original author(s) and the copyright owner(s) are credited and that the original publication in this journal is cited, in accordance with accepted academic practice. No use, distribution or reproduction is permitted which does not comply with these terms.
*Correspondence: Shaorui Sun, ssrfish@hhu.edu.cn