Future Meteorological Droughts in Ecuador: Decreasing Trends and Associated Spatio-Temporal Features Derived From CMIP5 Models
 Lenin Campozano
 Daniela Ballari
 Martin Montenegro
 Alex Avilés
- 1Departamento de Ingeniería Civil y Ambiental, Escuela Politécnica Nacional, Quito, Ecuador
- 2IERSE, Facultad de Ciencia y Tecnología, Universidad del Azuay, Cuenca, Ecuador
- 3Facultad de Ciencias Químicas, Universidad de Cuenca, Cuenca, Ecuador
Droughts are one of the most spatially extensive disasters that are faced by societies. Despite the urgency to define mitigation strategies, little research has been done regarding droughts related to climate change. The challenges are due to the complexity of droughts and to future precipitation uncertainty from Global Climate Models (GCMs). It is well-known that climate change will have more impact on developing countries. This is the case for Ecuador, which also has the additional challenges of lacking meteorological drought studies covering its three main regions: Coast, Highlands, and Amazon, and of having an intricate orography. Thus, this study assesses the spatio-temporal characteristics of present and future droughts in Ecuador under Representative Concentrations Pathways (RCP) 4.5 and 8.5. The 10 km dynamically downscaled products (DGCMs) from Coupled Model Intercomparison Project 5 (CMIP5) was used. The Standardized Precipitation Index (SPI) for droughts was calculated pixel-wise for present time 1981–2005 and for future time 2041-2070. The results showed a slightly decreasing trend for future droughts for the whole country, with a larger reduction for moderate droughts, followed by severe and extreme drought events. In the Coast and Highland regions, the intra-annual analysis showed a reduction of moderate and severe future droughts for RCP 4.5 and for RCP 8.5 throughout the year. Extreme droughts showed small and statistically non-significant decreases. In the Amazon region, moderate droughts showed increases from May to October, and decreases for the rest of the year. Additionally, severe drought increases are expected from May to December, and decreases from January to April. Finally, extreme drought increases are expected from January to April, with larger increases in October and November. Thus, in the Amazon, the rainy period showed a decreasing trend of droughts, following the wetter in wet- and drier in dry paradigm. Climate change causes decision-making process and calls for adaptation strategies being more challenging. In this context, our study has contributed to better mapping the space-time evolution of future drought risk in Ecuador, thus providing valuable information for water management and decision making as Ecuador faces climate change.
Introduction
Droughts are a transitory climatic anomaly, where the water availability is below average during a prolonged period of time limiting its supply for human needs and ecosystems. Among the most significant impacts of droughts to the environment are the acceleration of desertification processes, the increase in the risk of forest fires, the reduction of the availability of water resources for domestic and industrial use and the damage done to animals and vegetation (Mishra and Singh, 2010). In addition, droughts in sensitive climate regions have world-wide effects, as it was the case for the 2005 and 2010 Amazon droughts (Espinoza et al., 2011), where the changes in net biomass and mortality of old rainforest affected the CO2 balance in the most important CO2 sink of the planet (Phillips et al., 2009). These facts made the complexity of this phenomenon explicit. For instance, droughts are initiated by a meteorological drought, then they generate a hydrological drought, which may produce an agricultural drought and, in cases of prolonged occurrence, may cause a socio-economic drought (Podestá et al., 2015). The final stage of a socio-economic drought may cause negative impacts, such as the loss of crops and livestock, a decrease in hydroelectric generation, migration, landscape degradation or social conflicts, among others (Wilhite et al., 2007).
The last century increase of the global mean temperature is unprecedented in scales from decades to centuries (Mora et al., 2014). Such a temperature increase has produced generalized changes in spatio-temporal precipitation patterns, sea salinity (Heuzé et al., 2015), wind patterns, heat waves, and more intensity in tropical cyclones and droughts (Dai, 2013); all these phenomena are attributed to climate change (CC) (Allen and Ingram, 2002; Mach et al., 2016). Despite that several studies link CC with the increase of droughts' severity and occurrence, it is acknowledged that the impacts of CC are diverse and even contrasting depending on the specific region of study. For instance, some studies (Dai, 2011; Sillmann et al., 2013; Wang and Chen, 2014; Huang et al., 2016) suggest that droughts will be more extreme and frequent, producing an increase of dryland by the end of the century. In addition, Dai (2011) and Sillmann et al. (2013) showed that extreme precipitation will become more frequent, with the Representative Concentrations Pathway (RCP) 8.5 presenting the most extreme changes in Central America, Australia, South Africa and in the Mediterranean region. In east China, Chen and Sun (2017) suggested that droughts could increase by the end of the century by ca. 31% for RCP 4.5 and almost double for RCP 8.5. Burke et al. (2006) reported that projections with the Palmer Drought Severity Index (PDSI) suggest that, compared to the current coverage, droughts may affect ca. 30% of the world land area by the year 2100, which is ~1% using the A2 scenario. In southern South America, Penalba and Rivera (2013) showed that the occurrence of droughts will be more frequent in the twenty-first century. Also, precipitation is expected to increase in high latitude regions of the northern hemisphere (Feng et al., 2014) under CC conditions.
The few studies conducted in north-western South America present contrasting projections in CC conditions, primarily due to the complex orography of the Andes and several climatic influences such as El Niño Southern Oscillation (ENSO), its tropical location, the Amazon rainforest producing high evapotranspiration rates, and the influence of the easterlies. For instance, for the eastern Amazon, Duffy et al. (2015) show an increase of meteorological droughts under RCP 8.5, while for the western Amazon the opposite was found. Steinhoff et al. (2015) show drier projections for Colombia and Central America and wetter conditions for southwestern Colombia, Ecuador and northern Peru in future CC conditions. Despite these results, no temporal trends are found for the last 50 to 100 years in droughts in the Amazon river. Contrarily, there is evidence that flooding events are becoming more frequent and severe (Barichivich et al., 2018).
More specifically in Ecuador, drought studies are scarce despite the potential impacts that CC and droughts may have on agriculture, energy, biodiversity, forest, marine and hydrologic resources (Fontaine et al., 2008). Identifying the potential spatio-temporal patterns of droughts in Ecuador has major relevance due to its high volume of crops production (Peralta et al., 2018) and due to the country's economy dependence on hydroelectricity. By the year 2000, the water deficit already affected several Ecuadorian river basins like Esmeraldas, Portoviejo, Chone, Jama, Briceño, Pastaza, Paute, Mira, Carchi, and Napo during the dry season. Such events produced losses of ca. 45% of transitory crops and of 11% of perennial crop (Ministerio del Ambiente, 2009). The complexity of drought events added to the conspicuous patterns of precipitation in the three natural regions in Ecuador, i.e., the Coast, the Highlands and the Amazon, makes the study of droughts necessary for an adequate water management in the country.
Studies about drought forecasting in the highlands of Ecuador were conducted by Avilés et al. (2015). They developed a drought index using first and second order Markov chains in the Chulco river sub-basin in the Andes. Additionally, Avilés et al. (2016) compared Markov chains and Bayesian network models for drought predictions. Domínguez-Castro et al. (2018) conducted an interesting study in the highlands in Quito, the capital of Ecuador, using 125 years (period 1891–2015) of precipitation observations from one ground station, and the registry of the rogation ceremonies in the Chapel Acts of Quito, from 1600 to 1822. They inferred that the most important drought periods were 1692–1701, 1718–1723, 1976–1980, 1990–1993, and 2001–2006, nevertheless no climatic evidence was linked to such events. In relation to the influence of ENSO on drought patterns, Vicente-Serrano et al. (2017) showed that drought influence has two patterns: (i) in the Andean mountains where there are no changes in trends of drought severity, linked to teleconnections with Sea Surface Temperature (SST) in El Niño 3.4 region, and (ii) in the coastal region showing trends to less severe and frequent droughts, linked to the local SST in the El Niño 1+2 region. In the same line of research, Zambrano Mera et al. (2018) used ENSO as a predictor of droughts for the coast of Ecuador. Nonetheless, important drought events need further study. For instance, the drought that occurred in 2005 showed anomalously negative precipitation in the coast and in the Amazon, and an above normal precipitation in the highlands, which was related to the anomalously warmed North Tropical Atlantic (Marengo et al., 2008) producing a northward displacement of the ITCZ and a strong drought in the Amazon. This event showed drought spatial patterns different to those caused by ENSO. Therefore, there is a clear gap of knowledge related to the climatologic characteristics of droughts in Ecuador, and furthermore, a country-wide evaluation of present and future drought projections in Ecuador by GCMs.
Therefore, the aim of this study is 2-fold: (i) assess the representation of droughts from dynamically downscaled GCMs in the present; and (ii) evaluate the spatio-temporal structure and variability of future meteorological droughts in Ecuador under RCP 4.5 and RCP 8.5 scenarios. This is done by using three products (GISS, CSIRO, and IPSL) from the Coupled Model Intercomparison Project 5 (CMIP5) of the Third National Communication on Climate Change. The Standardized Precipitation Index (SPI) was used to characterize extreme, severe and moderate droughts in the present (period 1981–2005) and the future (period 2041–2070). This study contributes to the spatial and temporal characterization of present and future droughts, and offers a contrasting analysis between them.
Study Area
The study area is the continental region of Ecuador (ca. 256.370 km2), located over the equatorial line in South America (Figure 1A). Continental Ecuador presents three natural regions (Figure 1B), i.e., the Coastal region which is ca. 100 km wide, located on the western side of the Andes and next to the Pacific Ocean; the inter-Andean region (up to 6,300 m a.s.l.) which acts as a weather divide between the coast and the Amazon; and on the eastern plains of the Andes, the Amazon region, with heights below 300 m a.s.l. (Naranjo, 1981). Around 60% of Ecuador's population (ca. 16.5 million people in total) is dedicated to agriculture, mainly cultivating bananas, flowers, cacao and fruits. Ecuador is one of the 10 biggest producers of bananas in the world, representing ca. 30% of the world's total production (Orozco, 2017). Thus, an increment in the inter-annual variability of precipitation can produce losses in agrobusiness, making it necessary to implement mitigation strategies.
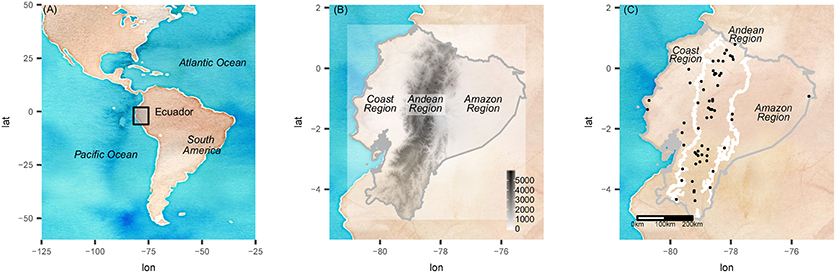
Figure 1. Study area. (A) Ecuador is located in South America (left). (B) The Highlands are a weather divide between the coast and the Amazon (center). (C) Ground rainfall stations (black points) used for this study (right). Due to logistical limitation very few stations are located in the Amazon.
Ecuador's hydroelectric potential is high. Especially in the last two decades, several hydroelectric projects were constructed, such as Coca Codo Sinclair, Sopladora, Manduriaco, Toachi Pilatón among others, producing ca. 90% of the total demand for electricity (Ministerio de Electricidad y Energía Renovable, 2018).
The three main climatic regions of Ecuador (Coast, Highlands and Amazon) have their own climatic characteristics. The large-scale signal of precipitation is regulated by the Inter-Tropical Convergence Zone (ITCZ) producing two rainy seasons, March-April and October-November (Bendix and Lauer, 1992; Campozano et al., 2016b). During these seasons, the influence of the ITCZ enhances convection, producing strong precipitation, especially during afternoons. This regime of precipitation is characteristic for the inter-Andean valleys in the highlands. However, in the coast of Ecuador, the south Pacific anticyclone (Bendix and Lauer, 1992) produces an important modification to the bi-modal influence of the ITCZ, creating a unimodal regime. The inhibition of precipitation during October-November is due to the seasonality of the south Pacific Anticyclone, bringing dry air and stability from the coasts of Chile to the coasts of Ecuador. With respect to the Amazon, in addition to the bi-modal regime of precipitation related to the ITCZ, precipitation is enhanced from June to August due to the increment of the easterlies (Campozano et al., 2016b).
Materials
Precipitation in-situ Observations
Monthly observations of precipitation belonging to 172 ground stations were obtained from the Instituto Nacional de Meteorología e Hidrología de Ecuador (INAMHI). Quality control was done in four steps. Firstly, missing data was quantified, selecting stations with <10% of gaps. Despite a recommended bound of 5% (WMO—World Meteorological Organization, 2009), a 10% threshold was applied to keep a useful amount of stations for analysis. Secondly, outliers were identified using interquartile criteria (Campozano et al., 2015). Then, data homogeneity was checked to identify variability due to external factors, such as equipment or location changes for the ground stations. In this case, the analysis developed by Xiaolan et al. (2013) and by Wang and Feng (2013) was applied. Finally, the infilling of missing data was done following Ureña Mora et al. (2016). After a quality control, the observational data was reduced to 60 stations across the whole country, with a temporal period of 25 years from January 1981 to December 2005. Figure 1C shows the location of the stations.
Global Climate Models
The Third National Communication of Climate Change project of Ecuador (TCN), before the Intergovernmental Panel on Climate Change (IPCC), provided GCMs data from three selected models among all GCMs of CMIP5. These three GCMs were selected among the 42 available from CMIP5 in present and future periods, by using statistical metrics evaluated in 137 precipitation stations in the whole country. They were Pearson correlation, bias and RMSE. For details about the GCM selection, see Armenta et al. (2016). The selected GCMs were CSIRO-Mk36, GISS-E2, and IPSL-CM5A-MR. The present study considered the base period from 1981 to 2005 and the future period from 2041 to 2070, analyzing RCP 4.5 and 8.5.
CSIRO
The dynamic/thermodynamic CSIRO-MK3-6-0 (MK36) model was developed by the Commonwealth Scientific and Industrial Research Organization in collaboration with the Queensland Climate Change Centre of Excellence. It presents a horizontal resolution of 1.9° × 1.9°. The marine ice is added in the atmospheric model. MK36 has 31 vertical levels and each atmospheric grid is associated to two oceanic layers. MK36 has shown improvements compared to MK35, for example interactive aerosol, actualized radiation, and a layer with properties are included now (Collier et al., 2013).
GISS
The Goddard Institute for Space Studies model (GISS E2) has a horizontal resolution of 2.5° × 2°, nine atmosphere layers, and two ground hydrological layers. The radiation scheme includes cloud particles, aerosol, and trace gases. The convective cloud cover is predicted and the calculation of temperature includes both seasonal and diurnal solar cycles. The radiation scheme includes integrated cloud particles, aerosols and radioactive important trace gases. The precipitation occurs whenever supersaturated conditions appear. Surface fluxes change the ocean water and the sea ice temperature in proportion to the covered area for a grid cell (Schmidt et al., 2014).
IPSL
The IPSL-CM5A climate model was developed in the Institute Pierre Simon Laplace and presents a refined horizontal and vertical grid of the atmospheric component. This is the major difference related to the last version IPSL-CM4A. The grid resolution is 2.5° × 1.25°. These changes reduce the mean biases in the tropospheric structure. The extended stratosphere scheme, with new parametrization, was increased by adding layer numbers from 19 to 39. This version captures the stratospheric variability and shows stratospheric sudden warmings (Hourdin et al., 2013).
Downscaled Global Climate Models
The TCN published the 10 km dynamically downscaled products of CSIRO-Mk36, GISS-E2, IPSL-CM5A-MR for the base period (1981–2005) and for the future period (2041–2070), analyzing RCP 4.5 and RCP 8.5. For the downscaling, the Weather Research and Forecasting model (WRF) version 3.6.1 was used with the following parameterizations: Microphysics WSM 3-class simple ice; Short Wave Radiation, rrtm; Long Wave Radiation, Dudhia; Surface layer, Monin-Obukhov; Land Surface model, Unified Noah land-surface model; Boundary layer, YSU (Yonsei University) and Kain-Fritsch (new Eta) for cumulus parameterization (Armenta et al., 2016). The downscaled GCMs products will be called from now on: DGCMs. After dynamically downscaling, precipitation data was extracted from NetCDF files with a spatial resolution of 10 Km and with a 6 h temporal resolution. All these products were aggregated to the monthly temporal scale and stored as rasterbrick of the raster library in R (Hijmans, 2017).
Methods
Four analyses were performed. First, the standardized precipitation index was computed for precipitation data; second, precipitation data and the standardized precipitation index were validated. Then the present and future drought intensities and their probability of occurrence were computed, and finally present and future probability of drought intensities were compared following spatial and temporal approaches. The validation of the precipitation data and of the standardized precipitation index were computed for the ground rain gauge locations. Meanwhile, the following analyses were performed for the whole study area.
The Standardized Precipitation Index
The Standardized Precipitation Index (SPI) is one the most widely used drought indices due to its robustness and versatility for drought monitoring (Morid et al., 2006). The SPI is globally accepted due to its standardized nature (WMO—World Meteorological Organization, 2012), which allows to compare places with different precipitation characteristics, and to make calculations across diverse time scales (Morid et al., 2006). It helps to identify for instance short-term droughts, affecting the agricultural sector through the reduction of soil moisture, as well as large-term droughts affecting hydric balance in rivers and water reservoirs (Rivera, 2014). Even if other variables like temperature, evapotranspiration, atmospheric humidity, and wind, are also related to droughts, SPI only takes into account precipitation. The reason is because precipitation mainly determines the duration, magnitude, and intensity of droughts (Chang and Kleopa, 1991). Thus SPI is applicable to meteorological droughts because it only uses precipitation, and it does not account for interactions with the land surface or temperature (Taylor et al., 2013).
The SPI was calculated in four steps (Paulo et al., 2003). Firstly, cumulative precipitation for each month and each location was calculated using a k-month time scale. In our case, k was 3. The short-term SPI-3 was used, calculated as the 3 months' precipitation moving window. For instance, the cumulative precipitation for March is computed as the sum of the precipitation of January, February and March. We chose this time scale to account for a seasonal estimation of precipitation. The total precipitation for the month j of the year i and the k−1 past consecutive months, with k ≤ 3, is (Equation 1) (Paulo et al., 2003; Vicente-Serrano, 2006):
Secondly, a two-parameter gamma probability distribution (Equation 2) was fitted, since it well-models the frequencies of accumulated precipitation (Vicente-Serrano et al., 2010). The unbiased Probability Weighted Moments was used as a fitting method, as it was already available in the SPEI R library (Beguería et al., 2014), resulting in the following equation:
With α and β being the shape and scale parameters, x the precipitation and Γ(α) the gamma function.
Thirdly, after α and β were estimated, they were used to calculate the distribution function values for the cumulative precipitation.
Fourthly, with the obtained value of F(x), the SPI values were computed by transforming the gamma distribution function values into standard normal variable values (Equation 4). In other words, the SPI values were normalized, i.e., standardized with a median of 0 and a standard deviation of 1.
As a result, SPI is a dimensionless value that represents the number of standard deviations above or below the median precipitation at a defined location (WMO—World Meteorological Organization, 2012). A positive SPI indicates a greater value than the median precipitation, and a negative one indicates a lower value than the median precipitation. Droughts are considered as SPI values ≤ −1. Additionally, the SPI values can be categorized in different drought severities (McKee et al., 1993) as shown in Table 1. For more details on the calculation of SPI we refer the reader to McKee et al. (1993), Lloyd-Hughes and Saunders (2002), Vicente-Serrano et al. (2010), WMO—World Meteorological Organization (2012).
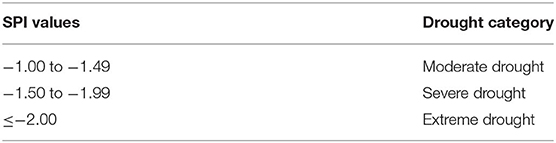
Table 1. Drought categories for SPI (WMO—World Meteorological Organization, 2012).
The computation was performed pixel-wise using the SPI function from the SPEI library in R (Beguería and Vicente-Serrano, 2017), considering the 1981–2005 period as the reference which helped to highlight changes between present and future droughts.
Validation of Present Time Precipitation and SPI-3
The present time DGCMs were validated against in-situ observations, i.e., 60 stations. This validation was done for monthly precipitation, as well as for the SPI-3 time series. Statistical metrics such as the Root Mean Square Error (RMSE), Pearson correlation (r) and Percentage of Bias (PBIAS %) were calculated for the time series at each specific location corresponding to the meteorological stations; median and Interquartile Range (IQR) were reported. The best present time DGCM models for precipitation and SPI-3 were identified based on the lower median RMSE, the higher median r, and the median PBIAS% closest to 0. The results were also disaggregated for the Coast, Highlands and Amazon regions. This was useful to give insights about the performance of the models for the whole country and for each natural region.
Probability of Present and Future Drought Intensities
Pixel-wise time series of SPI-3 were categorized as moderate, severe or extreme droughts. Then, the probability of the detected drought intensity was calculated as the frequency divided by the time series length (i.e., 298 months because the first 2 months were not computed in SPI-3). This showed the probability of different drought intensity occurrences at the different locations. Afterwards, maps of probability of occurrence were made for present and for future RCPs 4.5 and 8.5. SPI-3 time series of observations were calculated likewise.
In order to compare the present time probability of droughts between observations and DGCMs, the non-parametric Kruskal Wallis test for multiple median comparison was applied. If significant median differences were detected, the post-hoc Pairwise Wilcoxon rank sum hypothesis test with Bonferroni correction for adjusting p-values, was calculated. If ties were found, exact p-values were computed by adding a small amount of noise in the data (jitter). P < 0.05 showed significant differences between DGCMs and observations. The same criterion was applied to future 4.5 and 8.5 DGCMs, as two samples Wilcoxon test. Additionally, the climatological probability of present and future drought intensities was computed. This allowed us to describe the temporal behavior of the different drought intensities within the different regions of the country.
Comparison of Present and Future Probability of Drought Intensities
Present and future probabilities of moderate, severe or extreme droughts were compared through the map difference at each pixel. A positive result represented future increment of droughts, while negative results represented future decrement of droughts. This was presented in maps as well as summarized in tables with median values for the entire country and for the three regions. Significant differences from zero were evaluated with the one-sample Wilcoxon test and with a significance level of 0.05. Medians that were non-significantly different from zero were interpreted as no changes in future drought occurrence. Additionally, the difference between future and present monthly probabilities was computed.
Results
Evaluating the Present Time Representation of Precipitation and SPI-3
Evaluating Inter-model Uncertainties
In Table 2 RMSE, Pearson correlation coefficient, and PBIAS are shown for the period 1981-2005 for precipitation and for SPI-3, comparing observations and DGCMs evaluated over ground stations. In general, the three DGCMs showed a similar performance of monthly precipitation estimates, although the GISS model slightly outperformed the other two. Regarding median RMSE values, the three models showed relatively high median RMSE values, with the lowest median RMSE for GISS with 77.56 mm/month and an IQR of 38.27 mm/month. Correlation coefficients were acceptable, with the highest coefficient for GISS (0.42). Finally, the PBIAS showed overestimation for all DGCMs. CSIRO showed the lowest overestimation with 8.95% while the highest one was GISS with 12.10%. The dispersion from median values measured with interquartile range (IQR) were high with 67.78% for CSIRO and 61.40% for IPSL.
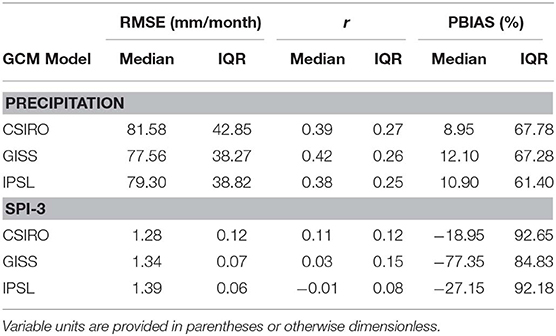
Table 2. Validation of present time precipitation and SPI-3.
Regarding SPI-3, the three DGCMs showed similar performances, although decreases in the correlation and PBIAS performances were observed. For CSIRO, RMSE and PBIAS showed the lowest values, 1.28 and −18.95%, respectively. As it was observed for precipitation, the high PBIAS's IQR represented variations of models' performance from site to site. PBIAS showed underestimation for the three DGCMs, with low underestimation for CSIRO, medium for IPSL and large for GISS. The lack of agreement in correlation for both precipitation and SPI-3, can be attributed to the smooth in DGCM's extreme values. This will be shown in next section with larger dispersion for observations and smaller for the models.
Spatial Patterns of Present Time Droughts
The probability of moderate, severe and extreme drought occurrence for in-situ observations and DGCMs is presented in Figure A1 (Supplementary Material). They showed similar behavior displaying larger probabilities of drought occurrence for moderate than for severe and extreme intensities. Nevertheless, probabilities were low with a maximum of 0.13, which means that droughts were not persistent in time, and instead, they occurred as extraordinary events.
Although, the three models showed similar values among the moderate, severe and extreme droughts evaluated in ground stations, the spatial patterns varied among products. For moderate drought, CSIRO in the Amazon and central-south Highlands, GISS in the north Coast and central Highlands and Amazon, and IPSL in central Coast and central-south Highlands, showed larger probabilities of occurrence. However, for moderate drought, the spatial patterns of GISS and IPSL were more similar one to the other than compared with CSIRO. For severe drought, CSIRO showed larger probabilities in the north and south Highlands; GISS in the Highlands and Amazon; while IPSL in the central-south Highlands. Finally, for extreme drought, CSIRO showed larger probabilities in the north and central Highlands; GISS in the Amazon and central and northern Highlands; while IPSL in the Amazon and north Highlands. In Figure A1, it is observed that extreme droughts showed similar spatial structure for GISS and IPSL.
When comparing the probability of observations and DGCMs for moderate, severe and extreme drought at observations points (i.e., meteorological stations), similar values were obtained. In Table 3, the median of the probability and the IQR of such probabilities are shown. The general dispersion of probabilities for the whole country is shown in Figure 2A. It is interesting to note that observations showed a larger dispersion than DGCMs, as such it can be concluded that DGCMs underrepresented extreme precipitation values. Additionally, models tended to overestimate probabilities of occurrence for moderate and severe droughts, while for extreme droughts, they were slightly underestimated. Among DGCMs, for moderate drought, GISS had the closest median to the observation and IPSL the largest overestimation; for severe drought, IPSL had the closest median to the observation and GISS the largest overestimation; and for extreme drought, IPSL had the closest median to the observation, CSIRO the largest overestimation and GISS the largest underestimation.
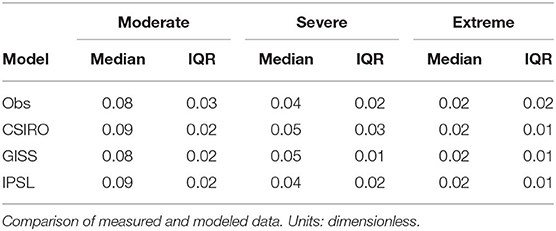
Table 3. Probability of occurrence of SPI-3, at observation points.
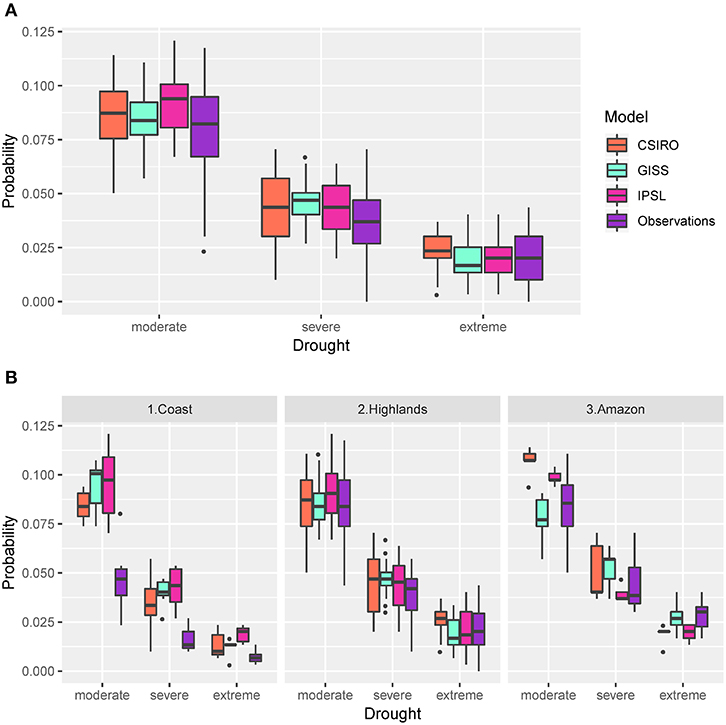
Figure 2. Present time probability of drought occurrence by category for observations and DGCMs evaluated at ground stations. (A) for the whole country, (B) for each region.
The post-hoc test for pairwise comparison of observation and models (Pairwise Wilcoxon test with Bonferroni p-values adjustment) only showed significant median differences (p < 0.05) between observations and IPSL for moderate droughts, between observations and GISS for severe droughts, and there were no significant differences noted for extreme droughts. Similarly, as it was obtained for the monthly precipitation and SPI-3 comparison, there was not a single model that outperformed in any of the situations. Given the lack of significant median differences, it can be concluded that different GCMs are suitable to be used in the different drought intensities. This is, for moderate droughts CSIRO and IPSL are suitable to be used; for severe droughts, CSIRO and GISS; and for extreme droughts, CSIRO, GISS, and IPSL. Therefore, CSIRO was the only model suitable in all three drought intensities.
Regarding the climatic regions of the country, the models at observation points showed different behaviors (Figure 2B). In the Coast, represented by seven observation points, the three models largely overestimated the probability of occurrence for moderate, severe and extreme droughts. The post-hoc pairwise test for moderate drought showed significant median differences (p < 0.05) between observations and the three models. For severe droughts, significant median differences were found for GISS and IPSL, non-significant differences for CSIRO. For extreme drought, significant differences for IPSL and non-significant differences for CSIRO and GISS were found. This means that CSIRO was the most suitable model with non-significant median differences for severe and extreme droughts.
In the Highlands, represented by 46 observation points, the three models performed similar to the observations at the meteorological stations. The behavior was similar to that for the whole country (Figure 2A) because 46 of the 60 total points were located in the Andes. The Kruskal-Wallis test for moderate drought did not show significant median differences for any of the three DGCMs. For severe droughts, the post-hoc test showed significant median differences of probability regarding observations and GISS, and non-significant for CSIRO and IPSL. For extreme droughts, significant differences were found only for CSIRO. This means that IPSL, followed by CSIRO, were the most suitable models; with non-significant median differences for moderate, severe and extreme droughts.
Finally, in the Amazon, represented by only six observation points, for moderate droughts, GISS performed better while for severe droughts the ISPL was better. For extreme droughts, the GISS model outperformed the others. The Kruskal-Wallis test did not show significant median differences for the three droughts categories for any of the three DGCMs. Despite the small validation data size, it can be concluded that the three models are suitable.
Spatio-Temporal Structure of Future Meteorological Droughts Under RCPs 4.5 and 8.5
Future Droughts Trends for RCPs 4.5 and 8.5
The overall future probabilities of occurrence for moderate, severe and extreme drought for all DGCMs and RCPs 4.5 and 8.5 at observation stations for the whole country, are presented in Figure 3A. Additionally, they are compared to present observations. In all cases, future probabilities are lower than present ones, meaning that an overall reduction of drought is expected in the future. Regarding RCPs 4.5 and 8.5 comparison, in most cases it is observed that droughts are less frequent in RCP 8.5 than in RCP 4.5. For moderate and severe droughts, CSIRO and GISS 4.5 showed larger probability of occurrence than RCP 8.5, however IPSL showed smaller probability for RCP 4.5 than for RCP 8.5. For severe and extreme drought, GISS and IPSL showed the same behavior, however CSIRO showed greater probability for RCP 8.5 than for RCP 4.5. In all cases, there are significant median differences with p < 0.05 according to the Wilcoxon test.
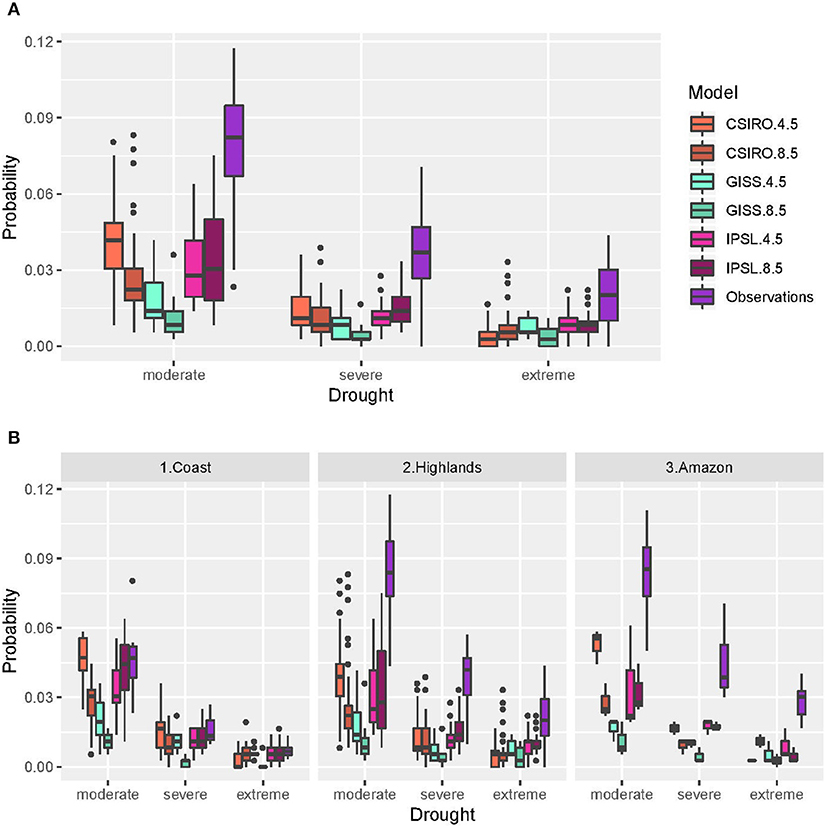
Figure 3. Future probability of drought occurrence at observations points. (A) for the whole country, (B) for each region.
Regarding the climatic regions of the country, the models and scenarios at observation points show different behaviors (Figure 3B). In the Coast, similar probabilities of occurrence with 4.5 were observed, while with 8.5 there was a clear reduction. In the Highlands and Amazon, a clear reduction was also observed. The previous trend that droughts tend to be less frequent in 8.5 than in 4.5 RCP, is also observed here.
In the Coast, the three drought categories for CSIRO showed significant differences (p < 0.05) between RCPs 4.5 and 8.5. Moderate GISS did not show significant differences, while severe and extreme did. Finally, IPSL did not show significant differences between RCPs for any of the three drought intensities. In the Highlands, moderate drought for CSIRO showed significant differences RCPs, while no significant differences were observed for severe and extreme droughts. For GISS, all three drought intensities showed significant differences. IPSL showed significant differences for severe, but not for moderate and extreme droughts. Finally, in the Amazon, the six models did not show significant differences between RCPs.
Spatial Structure of Future Droughts in Ecuador
The spatial distribution of future drought probability is shown in Figure A2 (Supplementary Material), for the three GCMs and for moderate, severe and extreme intensities. CSIRO showed higher probability in the Amazon for all intensities and both RCPs. IPSL displayed greater probability in the Amazon also, but with lower probability values than CSIRO. GISS showed similar probability of drought occurrence in the whole country.
In order to evaluate the spatial structure and trends of droughts in Ecuador, the change of the drought probability was computed as the difference of probability maps between future and present DGCMs for moderate, severe and extreme drought for RCPs 4.5 and 8.5 (see Figures 4–6). The results revealed a mix of future increments and reductions of droughts in a complex spatial structure. Such variations depended on the region of the country, the DGCM and the RCP. Red/Blue-colored cells represented future drought increments/decrements different from zero (statistically significant, one-sample Wilcoxon tests, p < 0.05), understanding zero as no changes in future drought occurrence. Finally, white cells were non-significantly different from zero. Additionally, in Table 4, the median differences for the whole country, and by regions are reported. The overall tendency for the whole country was a slight reduction of moderate and severe droughts.
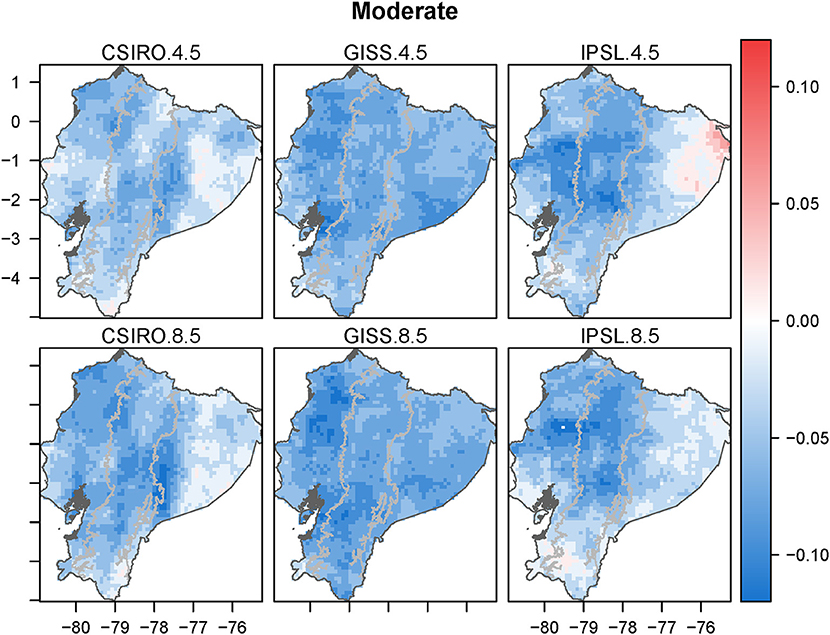
Figure 4. Spatial distribution of change for moderate drought probability. RCP (rows) and GCM (columns). White pixels indicate no change.
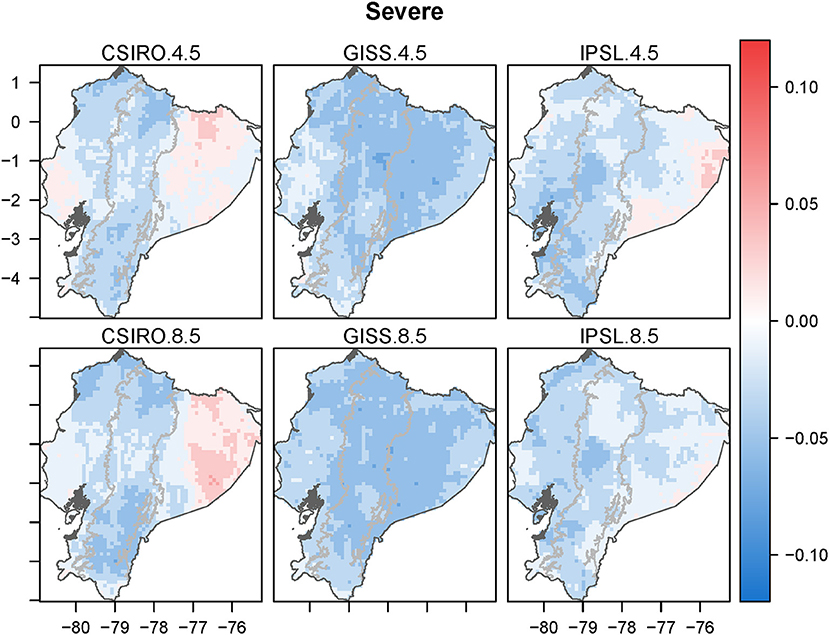
Figure 5. Spatial distribution of change for severe drought probability. RCP (rows) and GCM (columns). White pixels indicate no change.
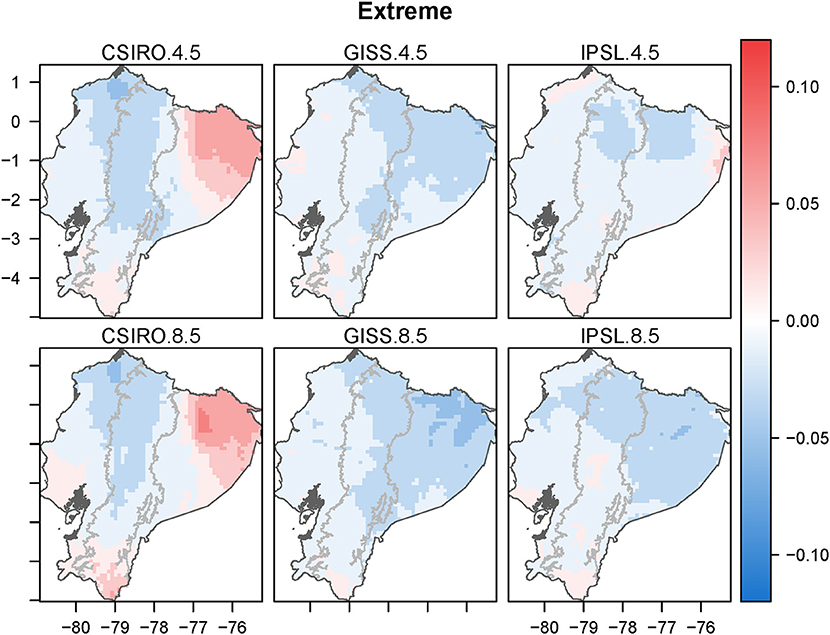
Figure 6. Spatial distribution of change for extreme drought probability. RCP (rows) and GCM (columns). White pixels indicate no change.
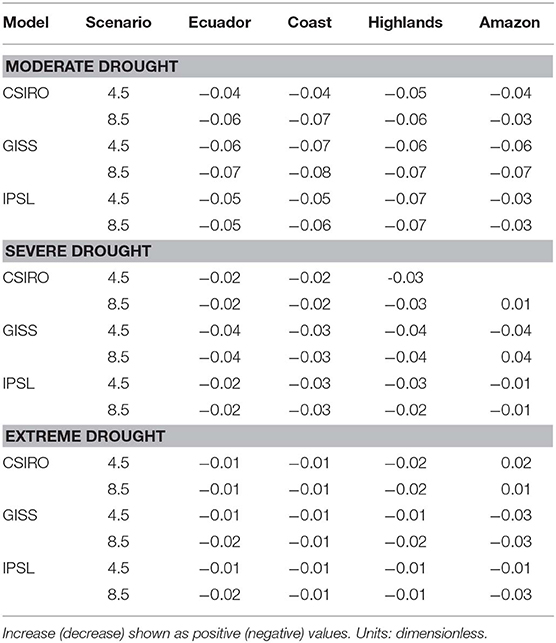
Table 4. Change of drought probabilities.
More in detail, the probability change maps for moderate drought (Figure 4) show a country-wide downward trend (more blue-colored cells than red-colored ones). DGCMs CSIRO, GISS and IPSL showed reductions of moderate drought especially in the coast and the Andes for RCPs 4.5 and 8.5. In the Amazon, IPSL for RCP 4.5 showed some increase of moderate droughts whereas for RCP 8.5 there was a slight decrease. For CSIRO under both RCPs, there was little to no change in moderate drought tendency, whereas for GISS under RCPs 4.5 and 8.5 there was a clear reduction in moderate drought tendency.
For severe droughts (Figure 5), GISS showed a decreasing tendency in the whole country, especially in the Highlands and in the western Ecuadorian Amazon for both RCPs. CSIRO and IPSL showed a slight decrease in the Highlands and Coast region, whereas in the Amazon region CSIRO showed a greater increase in the probability of droughts than IPSL. IPSL showed none to some increasing trend of droughts for RCP 4.5, while almost no trend changes were observed for RCP 8.5.
For extreme droughts (Figure 6), GISS showed a small decrease in the Amazon and the eastern regions of the Highlands for both RCPs, and no changes in the Coast. CSIRO showed a clear increasing trend of droughts in the Amazon and the south of the country for both RCPs. The same DGCM showed a decreasing trend of droughts in the Highlands for RCPs 4.5 and 8.5 and almost no changes in the coast for both RCPs. IPSL showed some decreasing trend in the north of the country for RCP 4.5, while for RCP 8.5 a decreasing trend was noted for the Amazon and the northern Highlands. Almost no changes are expected in the coast.
Monthly Trends of Future Droughts Under RCPs 4.5 and 8.5
Previous sections showed the spatial analysis of future droughts in Ecuador, however in this section the results of the difference between future and present monthly probability of droughts in Ecuador is shown for moderate, severe and extreme droughts in the Coast, Highlands and Amazon, for RCPs 4.5 and 8.5 using CSIRO, GISS and IPSL DGCMs. This information is synthetized in Tables 5–7.

Table 5. Monthly changes of drought probablity for moderate droughts.
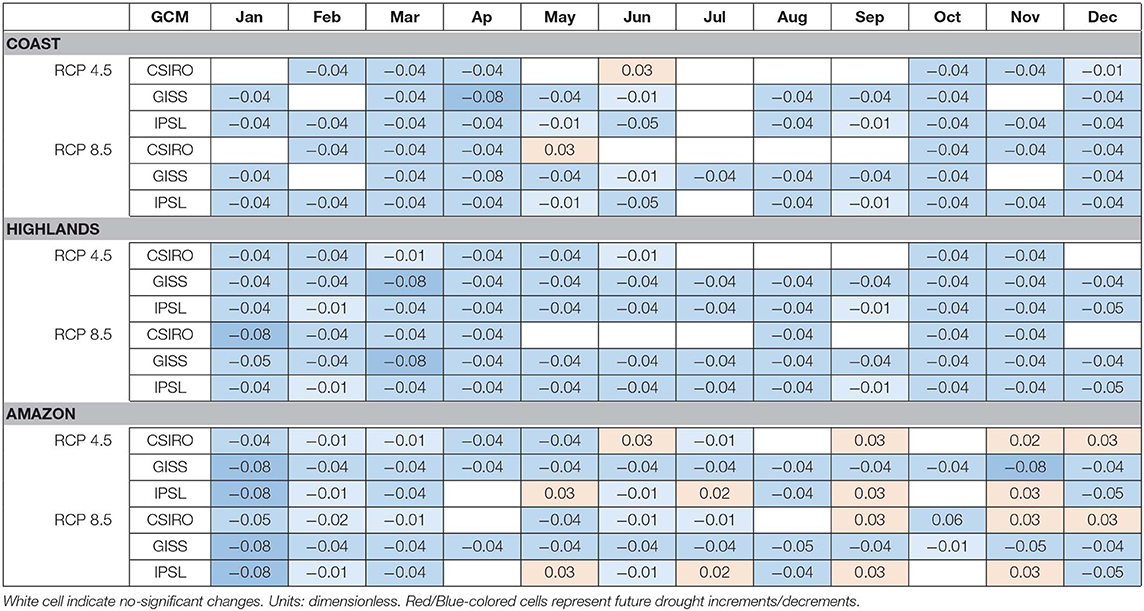
Table 6. Monthly changes of drought probablity for severe droughts.
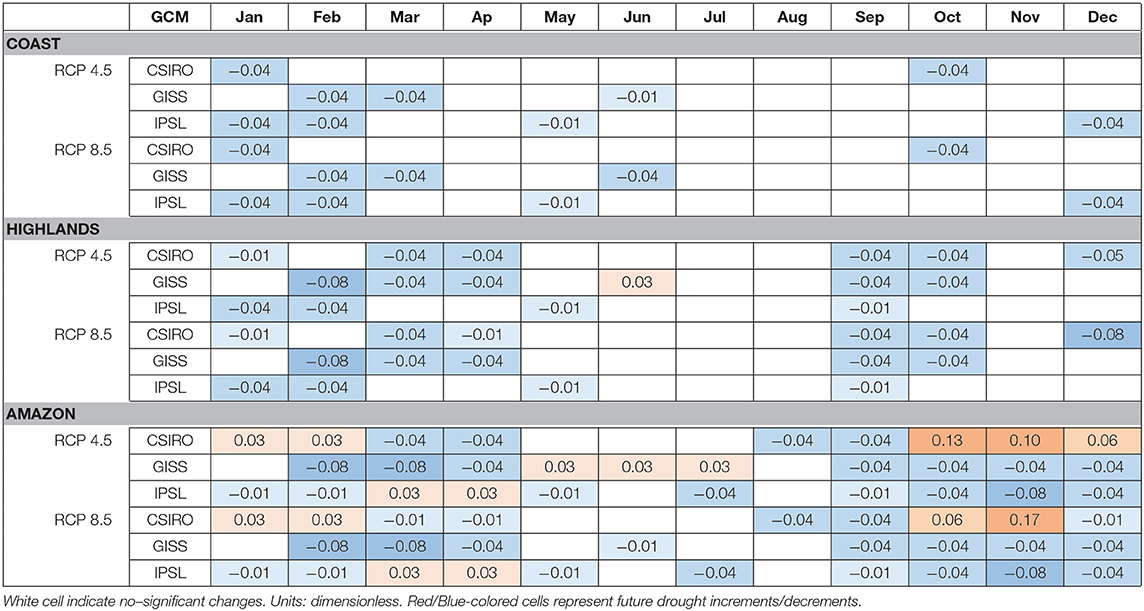
Table 7. Monthly changes of drought probablity for extreme droughts.
The analysis of monthly trends of future droughts is valuable information for decision makers and water resource management in general. It is important to highlight that changes in drought trends are dependent on the climatic forcing at synoptic scales which can affect several processes. For instance, on one hand, the wet season in Ecuador is mainly dominated by the ITCZ influence (Goldberg et al., 1987). On the other hand, during the dry season, strong easterlies prevail which may respond differently to the ITCZ (Sulca et al., 2018) in CC conditions, producing an intra-annual differentiated response to CC in addition to spatial variations.
Monthly changes of moderate droughts are shown in Table 5. In the Coast region, GISS and IPSL presented very similar trends for RCPs 4.5 and 8.5, showing that less moderate droughts are expected. For CSIRO, similar trends to GISS and IPSL are expected with the exception of July and October, which showed non-significant differences between future and present droughts. In the Highlands, all DGCMs showed a decrease of probability between future and present probabilities of severe droughts for the entire year, for both RCPs, with the exception of CSIRO in August for RCP 4.5 where is non-significant changes are expected. This model showed very low differences from zero in September and October, thus changes were not too evident during the dry season. For the Amazon region, CSIRO showed a slight decrease in the probability of droughts throughout the year, with the exception of August and September for RCP 4.5 which showed a slight increase. For RCP 8.5, all months showed a decrease of probability with the exception of August and October which showed a slight increase. GISS showed a consistent decrease of probability of moderate drought occurrence for RCPs 4.5 and 8.5. IPSL showed a consistent decrease of probability throughout the year with the exception of May and October which showed a slightly increase. For July and October, non-significant differences were found for both RCPs. Thus, moderate droughts in the Coast and in the Highlands are expected to occur less. However, for the Amazon, some models showed a slight increase, especially in boreal summer when the ITCZ is located to the north.
For severe droughts (Table 6), in the coast region, CSIRO showed a small decrease of probability from October to April. From May to September, non-significant or slight increases of probability were shown for both RCPs. For GISS, for both RCPs, the whole year showed a slight decrease of probability with the exception of February and November, which showed non-significant changes. For IPSL, the whole year showed a small decrease of probability with the exception of July. In the Highlands, CSIRO showed a decrease of probability from January to April and October and November, and non-significant probability changes from May to September and for December. IPSL and GISS showed a consistent decrease in probability throughout the year for both RCPs. It is interesting to observe that for the Amazon region, a less uniform pattern was displayed. GISS showed a consistent decrease of probability for both RCPs, however, IPSL and CSIRO showed a consistent decrease of probability from January to March, and a mixed occurrence of non-significant, increasing and decreasing probabilities was shown for the rest of the year.
For extreme droughts in the Coast under RCPs 4.5 and 8.5, CSIRO showed a decreasing probability in January and in October, whereas GISS showed an extreme drought probability decrease for February, March and June for both RCPs (Table 7). For IPSL, a decreased probability was shown from December to February and for October. Overall, for the coast region, the three DGCMs showed a decreased probability of extreme drought occurrence during the first rainy season. In the Highlands, all DGCMs in both RCPs showed a clear trend of decreasing probability of extreme drought occurrence from December to April and during September and October. These periods are clearly related to the two rainy seasons of the Highlands along the inter-Andean valleys. In the Amazon the patterns of intra-annual variability are more complex. CSIRO showed an increase of probability of extreme drought in October, November, January and February. For May, June, and July, no change is expected, where a lower probability was shown for the rest of the year. GISS under RCP 4.5 showed a decrease of probability from February to April, and from September to December, and an increase from May to July. GISS for RCP 8.5 showed a decrease in extreme drought probability from February to April and from September to December. IPSL showed a decrease in probability of extreme drought from September to February for both RCPs, and an increase in March and April, also for both RCPs.
In general, for extreme droughts it is interesting to observe that the first rainy season, from February to April, showed a decrease in probability of extreme drought occurrence across the country. The second rainy season, from October to December, also showed a decrease in the Highlands and the Amazon. The period from May to August showed less variation in the occurrence of extreme drought probability. These results highlight that CC's impact on droughts has an important intra-annual variability, which is related to a different response of several processes toward CC.
Discussion and Concluding Remarks
Intra-Model Uncertainties in Future Droughts Projections in Ecuador
The strong differences in present time and projected precipitation among CMIP5 GCMs in the tropical regions is well-known (Hirota and Takayabu, 2013; Mehran et al., 2014). Such differences are still present after dynamically downscaling the results, because downscaled results inherit the main features from the driving GCMs (Di Luca et al., 2015). In order to reduce such intra-model uncertainty, the three downscaled results of CMIP5 GCMs were used (i.e., GISS, IPSL, CSIRO) to study drought representation in Ecuador.
The present time representation of moderate, severe and extreme droughts in Ecuador was better captured for the Highlands and the Amazon, and strongly overestimated in the Coast, especially for moderate and severe droughts. Such difference in the ability of the DGCMs to represent droughts among regions is intrinsically related to the capabilities of the DGCMs to represent the climatic processes in those specific regions (Schiermeier, 2010). For instance, the Eastern Pacific SST is influenced by the eastern Pacific cold tongue and the El Niño and La Niña phenomena, thus modulating the climate in the coastal region (Bendix et al., 2011). However, GCMs underestimate El Niño related precipitation (Steinhoff et al., 2015) which might be responsible for the DGCMs' droughts overestimation. It is important to highlight that the limited representation of precipitation in the Coast of Ecuador might be more related to the limitation of the DGCMs to represent atmospheric processes and teleconnections, than to the low representation of SST in the Eastern Pacific as pointed out by Tedeschi and Collins (2016).
The precipitation in the Coast of Ecuador has two inner regions. One toward the south that is dry and more related to the drying effect of the cold Humboldt current, similar to the climate in the coastal region of northern Perú. The other region is situated toward the north and is wetter due to the influence of the Chocó low level Jet (LLJ) (Poveda and Mesa, 2000; Sierra et al., 2015, 2018). This wetter region is one of the most important climatic features in northern South America, related to the Lloró climate, and one of the rainiest regions on Earth (Poveda and Mesa, 2000). The representation of the Chocó LLJ by 26 Atmosphere-Ocean General Circulation Models (AOGCMs) and 11 atmospheric climate models was evaluated by Sierra et al. (2018), attributing less skill to models unable to represent the ITCZ strength and location in addition to poor resolution and limited representation of complex orographic features. Such limitations might explain the overestimation of droughts in the Coast of Ecuador.
Present time droughts were better represented by the DGCMs in the Amazon region than in the Coast region. This is remarkable because the climate of Ecuadorian Amazon (78°W−75°11'W) located in the westernmost region of the Amazon basin, shows a complex interaction with the Andes. Along the Andean-Amazon transition region, there is a rainy period during boreal summer (Campozano et al., 2016b), which differs from the typical more uniform precipitation regime toward the east, into the Amazon basin. The increment of precipitation during boreal summer in this region might be related to the Andean Occurrence System, AOS (Bendix et al., 2006). Additionally, using a Lagrangian back trajectory method, Esquivel-Hernández et al. (2019), showed that water vapor is brought from the Caribbean as an influence from the northeastern trade winds to the eastern escarpments of the Andes. Likewise, in the Peruvian Andes-Amazonian transition, Chavez and Takahashi (2017) used reanalysis data to study the physical drivers for precipitation, pointing to the influence of the South American Low-Level Jet, SALLJ. Thus, although the influence of the SALLJ in Ecuador seems plausible, further research is necessary. It is relevant to evaluate GCMs along this region in the Amazon because the rainfall hotspots contribute to ca. 35% of the hydroelectricity generation in Ecuador. Additionally, several cities are located in this region (e.g., Zamora Chinchipe, Morona Santiago, Napo, Sucumbíos, Orellana, Pastaza with a total of population of ca. 750.000 inhabitants), which are vulnerable to extreme precipitation events.
Contrarily, in the central and eastern Amazon region, mostly corresponding to Colombia, Peru and Brazil, there are many studies evaluating GCMs representation of droughts. Regarding to the Amazon basin over all, the droughts are affected by ENSO events and by SST anomalies in the Tropical North Atlantic (Barichivich et al., 2018), which show a good representation in CMIP5 models (Duffy et al., 2015). This agrees with our findings of present time representation of droughts from DGCMs. However, in the Amazon region, an overestimation of total precipitation and an underestimation of consecutive dry days was reported by Sillmann et al. (2013), which might be related to the misrepresentation of atmospheric processes rather than a poor SST representation (Tedeschi and Collins, 2016).
Present time representation of droughts in the Ecuadorian Andes by DGCMs was adequate despite the complex orography. A slight reduction of droughts is expected for RCPs 4.5 and 8.5 in the future. Few studies on the future precipitation evaluation by GCMs have been conducted in the Ecuadorian Andes. For CMIP3 GCMs after applying statistical downscaling in an Inter-Andean basin (Paute basin), Mora et al. (2014) showed that the mean annual rainfall will increase as well as rainfall rates in the period 2045–2065 for A1B, A2, B1 scenarios, in addition to wetter conditions in rainy seasons. These conclusions can be related to our findings of a slight reduction on future droughts in the Andes derived from CMIP5 DGCMs. These results agree with the recent findings of Zhiña et al. (2019), in the same region, where they find a reduction of duration and magnitude using the SPEI drought index for RCPs 4.5 and 8.5.
Buytaert et al. (2010) analyzed the uncertainty between ensembled precipitation projections of several GCMs from the IPCC Third and Fourth Assessment Report, and PRECIS (0.5° resolution) regional climate model results driven by HadAM3p for A2 and B2 scenarios in the Paute basin. They show that biases of GCM ensembled precipitation projections are as large as PRECIS results, however, gradients are better captured by PRECIS. It is important to note that the PRECIS RCM limitations are reduced in the present study due to: i) the use of a better regional climate model, in this case WRF using parameterizations adapted to the study region at a higher resolution (ca. 0.1°); and ii) WRF was driven by GCMs with the best representation among all GCMs from CMIP5 models. Thus, the limitations coming from a cascade of uncertainties involved in climate projections will be present (e.g., intra-model, scenario, downscaling techniques, initial conditions, etc.), and it is highly advisable to try to reduce or at least quantify them when possible.
The findings in the present study that showed the overall future tendency for the Coast and the Highlands as a slight reduction of moderate and severe droughts for both RCPs in the three DGCMs, might be related to the increase in precipitation projections for this region found in other studies (Palomino-Lemus et al., 2015; Steinhoff et al., 2015). On a monthly scale, this reduction is less evident for extreme droughts, whereas for moderate and severe droughts, the decrease is similar throughout the year. In the Amazon region, the projection of droughts is more complex. IPSL and CSIRO for moderate droughts showed some increase in the probability of occurrence from May to October, for severe droughts the increase is expected from May to December, and for extreme droughts increases are expected from January to April and to a greater extent during October and November. Contrarily, for GISS, in the Amazon region, the projections for moderate and severe droughts showed a slight decrease throughout the year for both RCPs, whereas for extreme drought some increase is expected from May to July for RCP 4.5 and no change is projected for RCP 8.5. Thus, for some DGCMs there is some evidence that wet seasons will have less probability of droughts than present time, which may be linked to the results of Barichivich et al. (2018) that wet seasons will be wetter and dry seasons drier.
Future Climatic Processes Affecting Droughts in Ecuador
To better interpret the plausibility of these results, an analysis of the future changes in the climatic processes may be helpful. The increase of future precipitation in Ecuador and southern Colombia might be due to the colder mean state of the Tropical Pacific SST produced by a downward shift of the ITCZ (Karmalkar et al., 2011; Steinhoff et al., 2015). Contrarily, the southward shift of the ITCZ will produce a decrease of precipitation along the coast of Central America during the wet season (Karmalkar et al., 2011). With respect to the western part of the Amazon basin, the projections show increased precipitation especially after 2040, and decreases in future droughts (Duffy et al., 2015), which agrees with our findings. These results might be explained by the colder mean state of the eastern Pacific, producing more rainfall in the Ecuadorian Andes and Amazon, but may affect the Coast through the dipolar response of rainfall in Ecuador to ENSO (Rossel and Cadier, 2009; Bendix et al., 2011; Campozano et al., 2016a).
Several factors may be determinant for the occurrence of future droughts, highlighting the uncertainty of this complex phenomenon. For instance, despite the fact that GCMs have varying degrees of ENSO representation, Power et al. (2013) claim that robust changes in projected precipitation are expected, with drying- on the western Pacific and increasing trends in the eastern Pacific. Along similar lines, Steinhoff et al. (2015) argue that, despite the underestimation of ENSO related precipitation, GCMs show the same sign anomalies. In addition, the precipitation in the Amazon is highly dependent on regional evapotranspiration, which might be affected under unfavorable land use change conditions increasing the probability of droughts occurrence (Duffy et al., 2015). Other factors such as the weakening and lowering of the south Pacific Anticyclone (Urrutia and Vuille, 2009) might also affect the occurrence of droughts, especially along the western coasts of South-America.
In relation to GCMs uncertainty, Yeh et al. (2014) showed that the representation of Tropical Pacific SST during the second half of the twentieth century shifted from La Niña-like pattern in CMIP3 models to El Niño-like patterns in the CMIP5 models. A plausible explanation of the eastward shift of the SST positive anomalies relies on an increased Bjerknes feedback with SST in the CMIP5 models with respect to CMIP3 counterparts (Yeh et al., 2012). Although such uncertainties affect drought predictability, there are world-wide statistically significant increasing trends in drought hazard in future projections (Carrao et al., 2018), which demands immediate action for adaptation measures and CC mitigation efforts to limit greenhouse gas emissions.
Climate change has important societal implications for both extremes (i.e., droughts and floods) because they produce similar economic losses on an annual basis (Trenberth, 2008). Floods produce higher damage to property, loss of life, and infrastructure, whereas droughts pose tremendous threats to society by negatively impacting agriculture and increasing risks of wildfires and heat waves. Furthermore, Trenberth (2008) reported cases where the impact of floods were more severe after droughts, thus in climate change conditions a more robust assessment for decision making is necessary. This aspect of a changing climate is more challenging for decision-making and adaptation strategies (Lawrence et al., 2013), and implies more dynamical risks for the future. In this context, our study has contributed to better mapping the space-time evolution of future drought risk in Ecuador, thus providing valuable information for water management and decision making as Ecuador faces climate change.
Data Availability Statement
The datasets generated for this study are available on request to the corresponding author.
Author Contributions
LC, DB, and MM: conceptual design. DB: scripts development. LC, DB, MM, and AA: article development.
Conflict of Interest
The authors declare that the research was conducted in the absence of any commercial or financial relationships that could be construed as a potential conflict of interest.
Acknowledgments
The authors would like to thank INAMHI for providing ground stations data and MAE for sharing downscaled results from the Third National Communication project. AA would like to thank the Direction of Investigation of the University of Cuenca for their support of the project: “Evaluación del riesgo de sequias en cuencas andinas reguladas influenciadas por la variabilidad climática y cambio climático. Caso de estudio en la cuenca del rio Machángara.” The authors would also like to thank Freek Everaert from the University of Azuay for the careful English revision.
Supplementary Material
The Supplementary Material for this article can be found online at: https://www.frontiersin.org/articles/10.3389/feart.2020.00017/full#supplementary-material
References
Allen, M. R., and Ingram, W. J. (2002). Constraints on future changes in climate and the hydrologic cycle. Nature 419, 228–232. doi: 10.1038/nature01092
Armenta, G., Villa, J., and Jácome, P. (2016). Proyección Climática de Precipitación y Temperatura Para Ecuador Bajo Distintos Escenarios de Cambio Climático. Quito: Ministerio del Ambiente. Available online at: https://info.undp.org/docs/pdc/Documents/ECU/14 Proyecciones de Clima Futuro para Ecuador en base a IPCC-AR5.pdf (accessed February 14, 2020)
Avilés, A., Célleri, R., Paredes, J., and Solera, A. (2015). Evaluation of markov chain based drought forecasts in an andean regulated river basin using the skill scores RPS and GMSS. Water Resour. Manage 29, 1949–1963. doi: 10.1007/s11269-015-0921-2
Avilés, A., Célleri, R., Solera, A., and Paredes, J. (2016). Probabilistic forecasting of drought events using markov chain-and bayesian network-based models: a case study of an andean regulated river basin. Water 8:37. doi: 10.3390/w8020037
Barichivich, J., Gloor, E., Peylin, P., Brienen, R. J. W., Espinoza, J. C., Pattnayak, K. C., et al. (2018). Recent intensification of Amazon flooding extremes driven by strengthened Walker circulation. Sci. Adv. 4:eaat8785. doi: 10.1126/sciadv.aat8785
Beguería, S., and Vicente-Serrano, S. M. (2017). SPEI: Calculation of the Standardised Precipitation-Evapotranspiration Index. R package version 1.7. Available online at: https://CRAN.R-project.org/package=SPEI. (accessed December 13, 2019).
Beguería, S., Vicente-Serrano, S. M., Reig, F., and Latorre, B. (2014). Standardized precipitation evapotranspiration index (SPEI) revisited: parameter fitting, evapotranspiration models, tools, datasets and drought monitoring. Int. J. Climatol. 34, 3001–3023. doi: 10.1002/joc.3887
Bendix, J., and Lauer, W. (1992). Die niederschlagsjahreszeiten in Ecuador und ihreklimadynamische interpretation. Erdkunde 46, 118–134. doi: 10.3112/erdkunde.1992.02.04
Bendix, J., Rollenbeck, R., Göttlicher, D., and Cermak, J. (2006). Cloud occurrence and cloud properties in Ecuador. Climate Res. 30, 133–147. doi: 10.3354/cr030133
Bendix, J., Trachte, K., Palacios, E., Rollenbeck, R., Göttlicher, D., Nauss, T., et al. (2011). El Niño meets la Niña—anomalous rainfall patterns in the “Traditional” el Niño region of Southern Ecuador. Erdkunde 65, 151–167. doi: 10.3112/erdkunde.2011.02.04
Burke, E. J., Brown, S. J., and Christidis, N. (2006). Modeling the recent evolution of global drought and projections for the twenty-first century with the hadley centre climate model. J. Hydrometeorol. 7, 1113–1125. doi: 10.1175/JHM544.1
Buytaert, W., Vuille, M., Dewulf, A., Urrutia, R., Karmalkar, A., and Célleri, R. (2010). Uncertainties in climate change projections and regional downscaling in the tropical Andes: implications for water resources management. Hydrol. Earth Syst. Sci. 14, 1247–1258. doi: 10.5194/hess-14-1247-2010
Campozano, L., Ballari, D., and Celleri, R. (2016a). Imágenes TRMM para identificar patrones de precipitación e índices ENSO en Ecuador. Maskana, 185–191. Available online at: http://dspace.ucuenca.edu.ec/handle/123456789/21368 (accessed February 14, 2020).
Campozano, L., Célleri, R., Trachte, K., Bendix, J., and Samaniego, E. (2016b). Rainfall and cloud dynamics in the andes: a Southern Ecuador Case Study. Adv. Meteorol. 2016:15. doi: 10.1155/2016/3192765
Campozano, L., Sánchez, E., Aviles, A., and Samaniego, E. (2015). Evaluation of Infilling Methods for Time Series of Daily Precipitation and Temperature: The Case of the Ecuadorian Andes. Maskana, 99–115. Available online at: http://dspace.ucuenca.edu.ec/handle/123456789/5586 (accessed February 14, 2020).
Carrao, H., Naumann, G., and Barbosa, P. (2018). Global projections of drought hazard in a warming climate: a prime for disaster risk management. Climate Dyn. 50, 2137–2155. doi: 10.1007/s00382-017-3740-8
Chang, T. J., and Kleopa, X. A. (1991). A proposed method for drought monitoring. JAWRA 27, 275–281. doi: 10.1111/j.1752-1688.1991.tb03132.x
Chavez, S. P., and Takahashi, K. (2017). Orographic rainfall hot spots in the Andes-Amazon transition according to the TRMM precipitation radar and in situ data. J. Geophys. Res. Atmos. 122, 5870–5882. doi: 10.1002/2016JD026282
Chen, H., and Sun, J. (2017). Characterizing present and future drought changes over eastern China. Int. J. Climatol. 37, 138–156. doi: 10.1002/joc.4987
Collier, M. A., Rotstayn, L. D., Kim, K.-Y., Hirst, A. C., and Jeffrey, S. J. (2013). Ocean circulation response to anthropogenic-aerosol and greenhouse gas forcing in the CSIRO-Mk3. 6 coupled climate model. Aust. Meteorol. Oceanogr. J. 63, 27–39. doi: 10.22499/2.6301.003
Dai, A. (2011). Characteristics and trends in various forms of the Palmer Drought Severity Index during 1900–2008. J. Geophys. Res. 116:D12115. doi: 10.1029/2010JD015541
Dai, A. (2013). Increasing drought under global warming in observations and models. Nat. Clim. Chang. 3, 52–58. doi: 10.1038/nclimate1633
Di Luca, A., de Elía, R., and Laprise, R. (2015). Challenges in the quest for added value of regional climate dynamical downscaling. Curr Climate Change Rep. 1, 10–21. doi: 10.1007/s40641-015-0003-9
Domínguez-Castro, F., García-Herrera, R., and Vicente-Serrano, S. M. (2018). Wet and dry extremes in Quito (Ecuador) since the 17th century. Int. J. Climatol. 38, 2006–2014. doi: 10.1002/joc.5312
Duffy, P. B., Brando, P., Asner, G. P., and Field, C. B. (2015). Projections of future meteorological drought and wet periods in the Amazon. PNAS. 112, 13172–13177. doi: 10.1073/pnas.1421010112
Espinoza, J. C., Ronchail, J., Guyot, J. L., Junquas, C., Vauchel, P., Lavado, W., et al. (2011). Climate variability and extreme drought in the upper Solimões River (western Amazon Basin): understanding the exceptional 2010 drought. Geophys. Res. Lett. 38:L13406. doi: 10.1029/2011GL047862
Esquivel-Hernández, G., Mosquera, G. M., Sánchez-Murillo, R., Quesada-Román, A., Birkel, C., Crespo, P., et al. (2019). Moisture transport and seasonal variations in the stable isotopic composition of rainfall in Central American and Andean Páramo during El Niño conditions (2015–2016). Hydrol. Proces. 33, 1802–1817. doi: 10.1002/hyp.13438
Feng, S., Hu, Q., Huang, W., Ho, C.-H., Li, R., and Tang, Z. (2014). Projected climate regime shift under future global warming from multi-model, multi-scenario CMIP5 simulations. Glob. Planet. Change 112, 41–52. doi: 10.1016/j.gloplacha.2013.11.002
Fontaine, G., Narváez, I., and Cisneros, P. (2008). Geo Ecuador 2008: Informe Sobre el Estado del Medio Ambiente. FLACSO. Quito, Ecuador. Available online at: https://biblio.flacsoandes.edu.ec/libros/digital/41444.pdf (accessed December 13, 2019).
Goldberg, R. A., Tisnado, M. G, and Scofield, R. A. (1987). Characteristics of extreme rainfall events in Northwestern Peru during the 1982–1983 El Nino period. J. Geophys. Res. 92, 14225–14241. doi: 10.1029/JC092iC13p14225
Heuzé, C., Heywood, K. J., Stevens, D. P., and Ridley, J. K. (2015). Southern Ocean bottom water characteristics in CMIP5 models. Geophys. Res. Lett. 40, 1409–1414. doi: 10.1002/grl.50287
Hijmans, R. (2017). Raster: Geographic Data Analysis and Modeling. R package version 2.6-7. Available online at: https://CRAN.R-project.org/package=raster. (accessed December 13, 2019).
Hirota, N., and Takayabu, Y. N. (2013). Reproducibility of precipitation distribution over the tropical oceans in CMIP5 multi-climate models compared to CMIP3. Climate Dyn. 41, 2909–2920. doi: 10.1007/s00382-013-1839-0
Hourdin, F., Foujols, M.-A., Codron, F., Guemas, V., Dufresne, J.-L., Bony, S., et al. (2013). Impact of the LMDZ atmospheric grid configuration on the climate and sensitivity of the IPSL-CM5A coupled model. Climate Dyn. 40, 2167–2192. doi: 10.1007/s00382-012-1411-3
Huang, J., Yu, H., Guan, X., Wang, G., and Guo, R. (2016). Accelerated dryland expansion under climate change. Nat. Clim. Chang. 6, 166–171. doi: 10.1038/nclimate2837
Karmalkar, A. V., Bradley, R. S., and Diaz, H. F. (2011). Climate change in Central America and Mexico: regional climate model validation and climate change projections. Clim Dyn. 37:605–629. doi: 10.1007/s00382-011-1099-9
Lawrence, J., Reisinger, A., Mullan, B., and Jackson, B. (2013). Exploring climate change uncertainties to support adaptive management of changing flood-risk. Environ. Sci. Policy 33, 133–142. doi: 10.1016/j.envsci.2013.05.008
Lloyd-Hughes, B., and Saunders, M. A. (2002). A drought climatology for Europe. Int. J. Climatol. 22, 1571–1592. doi: 10.1002/joc.846
Mach, K. J., Mastrandrea, M. D., Bilir, T. E., and Field, C. B. (2016). Understanding and responding to danger from climate change: the role of key risks in the IPCC AR5. Climatic Change 136, 427–444. doi: 10.1007/s10584-016-1645-x
Marengo, J. A., Nobre, C. A., Tomasella, J., Oyama, M. D., de Oliveira, G. S., de Oliveira, R., et al. (2008). The drought of Amazonia in 2005. J. Clim. 21, 495–516. doi: 10.1175/2007JCLI1600.1
McKee, T. B., Doesken, N. J., and Kleist, J. (1993). “The relationship of drought frequency and duration to time scales,” in Proceedings of the 8th Conference on Applied Climatology (Boston, MA: American Meteorological Society), 179–183.
Mehran, A., AghaKouchak, A, and Phillips, T. J. (2014). Evaluation of CMIP5 continental precipitation simulations relative to satellite-based gauge-adjusted observations. J. Geophys. Res. Atmos. 119, 1695–1707. doi: 10.1002/2013JD021152
Ministerio de Electricidad y Energía Renovable (2018). Ministra de Electricidad resaltó los logros energéticos alcanzados en el 2017. Ministerio de Electricidad y Energía Renovable: Quito. Available online at: http://historico.energia.gob.ec/13685-2/. (accessed December 13, 2019).
Ministerio del Ambiente (2009). Estudio de vulnerabilidad actual a los riesgos climáticos en el sector de los recursos hídricos en las cuencas de los ríos Paute, Jubones, Catamayo, Chone, Portoviejo y Babahoyo. Ministerio del Ambiente: Quito. Available online at: https://www.researchgate.net/publication/261798786_Estudio_de_vulnerabilidad_actual_a_los_riesgos_climaticos_en_el_sector_de_los_recursos_hidricos_en_las_cuencas_de_los_Rios_Paute_Jubones_Catamayo_Chone_Portoviejo_y_Babahoyo (accessed December 13, 2019).
Mishra, A. K., and Singh, V. P. (2010). A review of drought concepts. J. Hydrol. 391, 202–216. doi: 10.1016/j.jhydrol.2010.07.012
Mora, D., Campozano, L., Cisneros, F., Wyseure, G., and Willems, P. (2014). Climate changes of hydrometeorological and hydrological extremes in the Paute basin, Ecuadorean Andes. Hydrol. Earth Syst. Sci. 18, 631–648. doi: 10.5194/hess-18-631-2014
Morid, S., Smakhtin, V., and Moghaddasi, M. (2006). Comparison of seven meteorological indices for drought monitoring in Iran. Int. J. Climatolol. 26, 971–985. doi: 10.1002/joc.1264
Orozco, R. V. (2017). El impacto del comercio del Banano en el desarrollo del Ecuador. Revista AFESE, 53. Available online at: https://afese.com/img/revistas/revista53/comerbanano.pdf. (accessed December 13, 2019).
Palomino-Lemus, R., Córdoba-Machado, S., Gámiz-Fortis, S. R., Castro-Díez, Y., and Esteban-Parra, M. J. (2015). Summer precipitation projections over northwestern South America from CMIP5 models. Glob. Planet. Change 131, 11–23. doi: 10.1016/j.gloplacha.2015.05.004
Paulo, A. A., Pereira, L. S., and Matias, P. G. (2003). “Analysis of local and regional droughts in southern Portugal using the theory of runs and the Standardised Precipitation Index,” in Tools for Drought Mitigation in Mediterranean Regions. Water Science and Technology Library, eds G. Rossi, A. Cancelliere, L. S. Pereira, T. Oweis, M. Shatanawi, A. Zairi (Dordrecht: Springer), 55–78. doi: 10.1007/978-94-010-0129-8_4
Penalba, O. C., and Rivera, J. A. (2013). Future changes in drought characteristics over southern South America projected by a CMIP5 multi-model ensemble. Am. J. Climate Change 2, 173–182. doi: 10.4236/ajcc.2013.23017
Peralta, S. L. P., Aguilar, H. R., Loayza, A. G. E. A., and Morejón, L. A. S. (2018). Aporte del sector agropecuario a la economía del Ecuador. Análisis crítico de su evolución en el período de dolarización. Años 2000–2016. Available online at: https://www.revistaespacios.com/a18v39n32/a18v39n32p07.pdf (accessed December 13, 2019).
Phillips, O. L., Aragão, L. E., Lewis, S. L., Fisher, J. B., Lloyd, J., López-González, G., et al. (2009). Drought sensitivity of the Amazon rainforest. Science 323:1344–1347. doi: 10.1126/science.1164033
Podestá, G., Skansi, M. M., Herrera, N., and Veiga, H. (2015). Descripción de índices para el monitoreo de sequía meteorológica implementados por el Centro Regional del Clima para el Sur de América del Sur. Reporte Técnico CRC-SAS-2015-001. Buenos Aires: Centro Regional del Clima para el Sur de América del Sur. Available online at: http://www.crc-sas.org/es/content/monitoreo/reporte_sequias.pdf (accessed December 13, 2019).
Poveda, G., and Mesa, O. J. (2000). On the existence of Lloró (the rainiest locality on earth): enhanced ocean-land-atmosphere interaction by a low-level jet. Geophys. Res. Lett. 27, 1675–1678. doi: 10.1029/1999GL006091
Power, S., Delage, F., Chung, C., Kociuba, G., and Keay, K. (2013). Robust twenty-first-century projections of El Nin o and related precipitation variability. Nature 502, 541–5. doi: 10.1038/nature12580
Rivera, J. A. (2014). Aspectos climatológicos de las sequías meteorológicas en el sur de Sudamérica. Análisis regional y proyecciones futuras (PhD Thesis). Facultad de Ciencias Exactas y Naturales. Universidad de Buenos Aires, Buenos Aires, Argentina. Available online at: http://hdl.handle.net/20.500.12110/tesis_n5504_Rivera (accessed December 13, 2019).
Rossel, F., and Cadier, E. (2009). El Niño and prediction of anomalous monthly rainfalls in Ecuador. Hydrol. Process. 23, 3253–3260. doi: 10.1002/hyp.7401
Schiermeier, Q. (2010). The real holes in climate science. Nature 463, 284–287. doi: 10.1038/463284a
Schmidt, G. A., Kelley, M., Nazarenko, L., Ruedy, R., Russell, G. L., Aleinov, I., et al. (2014). Configuration and assessment of the GISS ModelE2 contributions to the CMIP5 archive. J. Adv. Model. Earth Syst. 6, 141–184. doi: 10.1002/2013MS000265
Sierra, J. P., Arias, P. A., and Vieira, S. C. (2015). Precipitation over Northern South America and its seasonal variability as simulated by the CMIP5 models. Adv. Meteorol. 2015, 1–22. doi: 10.1155/2015/634720
Sierra, J. P., Arias, P. A., Vieira, S. C., and Agudelo, J. (2018). How well do CMIP5 models simulate the low-level jet in western Colombia? Climate Dyn. 51, 2247–2265. doi: 10.1007/s00382-017-4010-5
Sillmann, J., Kharin, V. V., Zwiers, F. W., Zhang, X., and Bronaugh, D. (2013). Climate extremes indices in the CMIP5 multimodel ensemble: part 2. Future climate projections. J. Geophys. Res. 118, 2473–2493. doi: 10.1002/jgrd.50188
Steinhoff, D. F., Monaghan, A. J., and Clark, M. P. (2015). Projected impact of twenty-first century ENSO changes on rainfall over Central America and northwest South America from CMIP5 AOGCMs Climate Dynamics 44, 1329–1349. doi: 10.1007/s00382-014-2196-3
Sulca, J., Takahashi, K., Espinoza, J.-C., Vuille, M., and Lavado-Casimiro, W. (2018). Impacts of different ENSO flavors and tropical Pacific convection variability (ITCZ, SPCZ) on austral summer rainfall in South America, with a focus on Peru. Int. J. Climatol. 38, 420–435. doi: 10.1002/joc.5185
Taylor, I. H., Burke, E., McColl, L., Falloon, P. D., Harris, G. R., and McNeall, D. (2013). The impact of climate mitigation on projections of future drought, hydrology and earth system. Science 17, 2339–2358. doi: 10.5194/hess-17-2339-2013
Tedeschi, R. G., and Collins, M. (2016). The influence of ENSO on South American precipitation during austral summer and autumn in observations and models. Int. J. Climatol. 36, 618–635. doi: 10.1002/joc.4371
Trenberth, K. E. (2008). “The impact of climate change and variability on heavy precipitation, floods, and droughts,” in Encyclopedia of Hydrological Sciences. eds M. G. Anderson and J. J. McDonnells (New York, NY: John Wiley and Sons), 2–11. doi: 10.1002/0470848944.hsa211
Ureña Mora, P., Alfaro Martínez, E. J., Alfaro, S., and Javier, F. (2016). Propuestas metodológicas para el rellenado de datos ausentes en series de tiempo geofísicas. Guía Práctica de uso. Available online at: http://www.kerwa.ucr.ac.cr/handle/10669/28888. (accessed December 13, 2019).
Urrutia, R., and Vuille, M. (2009). Climate change projections for the tropical Andes using a regional climate model: temperature and precipitation simulations for the end of the 21st century. J. Geophys. Res. Atmos. 114, 1–15. doi: 10.1029/2008JD011021
Vicente-Serrano, S. M. (2006). Differences in spatial patterns of drought on different time scales: an analysis of the Iberian Peninsula. Water Resourc. Manage. 20, 37–60. doi: 10.1007/s11269-006-2974-8
Vicente-Serrano, S. M., Aguilar, E., Martínez, R., Martín-Hernández, N., Azorin-Molina, C., Sanchez-Lorenzo, A., et al. (2017). The complex influence of ENSO on droughts in Ecuador. Climate Dyn. 48, 405–427. doi: 10.1007/s00382-016-3082-y
Vicente-Serrano, S. M., Beguería, S., and López-Moreno, J. I. (2010). A Multiscalar drought index sensitive to global warming: the standardized precipitation evapotranspiration index. J. Climate 23, 1696–1718. doi: 10.1175/2009JCLI2909.1
Wang, L., and Chen, W. A. (2014). CMIP5 multimodel projection of future temperature, precipitation, and climatological drought in China. Int. J. Climatol. 34, 2059–2078. doi: 10.1002/joc.3822
Wang, X. L., and Feng, Y. (2013). RHtestsV3_UserManual. Climate Research Division Atmospheric Science and Technology Directorate Science and Technology Branch. Environment Canada Toronto, Ontario, Canada. Available online at: http://etccdi.pacificclimate.org/RHtest/RHtestsV3_UserManual.doc. (accessed December 13, 2019).
Wilhite, D. A., Svoboda, M. D., and Hayes, M. J. (2007). Understanding the complex impacts of drought: a key to enhancing drought mitigation and preparedness. Water Resour Manage 21, 763–774. doi: 10.1007/s,11269-006-9076-5
WMO—World Meteorological Organization (2009). WCDMP, 68. Climate observations and climate data management guidelines, WMO/TD. Available online at: https://library.wmo.int/index.php?lvl=notice_display&id=16666#.XfTiXWRKhPY. (accessed December 13, 2019).
WMO—World Meteorological Organization (2012). Standardized Precipitation Index User Guide. Available online at: http://www.wamis.org/agm/pubs/SPI/WMO_1090_EN.pdf. (accessed December 13, 2019).
Xiaolan, L., Wang, X., and Feng, Y. (2013). RHtestsV4 User Manual. Climate Research Division Atmospheric Science and Technology Directorate Science and Technology Branch, Environment Canada Toronto, Ontario, Canada. Available online at: http://etccdi.pacificclimate.org/software.shtml (accessed December 13, 2019).
Yeh, S. W., Ham, Y. G., and Kirtman, B. P. (2014). A possible explanation on the changes in the spatial structure of ENSO from CMIP3 to CMIP5. Geophys. Res. Lett. 41, 140–145. doi: 10.1002/2013GL058478
Yeh, S. W., Ham, Y. G., and Lee, J. Y. (2012). Changes in the tropical pacific SST trend from CMIP3 to CMIP5 and its implication of ENSO. J. Clim. 25, 7764–7771. doi: 10.1175/JCLI-D-12-00304.1
Zambrano Mera, Y. E., Rivadeneira Vera, J. F., and Pérez-Martín, M. Á. (2018). Linking El Niño Southern Oscillation for early drought detection in tropical climates: the Ecuadorian coast. Sci. Total Environ. 643, 193–207. doi: 10.1016/j.scitotenv.2018.06.160
Keywords: climate change, weather research, forecasting models, climate extremes, spatial-temporal projections, tropical region
Citation: Campozano L, Ballari D, Montenegro M and Avilés A (2020) Future Meteorological Droughts in Ecuador: Decreasing Trends and Associated Spatio-Temporal Features Derived From CMIP5 Models. Front. Earth Sci. 8:17. doi: 10.3389/feart.2020.00017
Received: 15 August 2019; Accepted: 20 January 2020;
Published: 28 February 2020.
Edited by:
Bryan G. Mark, The Ohio State University, United StatesReviewed by:
Chenghai Wang, Lanzhou University, ChinaAna Cristina Russo, University of Lisbon, Portugal
Copyright © 2020 Campozano, Ballari, Montenegro and Avilés. This is an open-access article distributed under the terms of the Creative Commons Attribution License (CC BY). The use, distribution or reproduction in other forums is permitted, provided the original author(s) and the copyright owner(s) are credited and that the original publication in this journal is cited, in accordance with accepted academic practice. No use, distribution or reproduction is permitted which does not comply with these terms.
*Correspondence: Lenin Campozano, lenin.campozano@epn.edu.ec