Control of Subduction Zone Age and Size on Flat Slab Subduction
 Wouter Pieter Schellart
- Department of Earth Sciences, Vrije Universiteit Amsterdam, Amsterdam, Netherlands
Flat slab subduction is an enigmatic style of subduction where the slab attains a horizontal orientation for up to several hundred kilometers below the base of the overriding plate. It has been linked to the subduction of buoyant aseismic ridges or plateaus, but the spatial correlation is problematic, as there are subducting aseismic ridges and plateaus that do not produce a flat slab, most notably in the Western Pacific, and there are flat slabs without an aseismic ridge or plateau. In this paper an alternative hypothesis is investigated which poses that flat slab subduction is associated with subduction zones that are both old (active for a long time) and wide (large trench-parallel extent). A global subduction zone compilation is presented showing that flat slabs preferentially occur at old (>∼80–100 Myr) and wide (≥∼6000 km) subduction zones. This is explained by the tendency for wide subduction zones to decrease their dip angle in the uppermost mantle with progressive time, especially in the center. A set of numerical subduction models confirms this behavior, showing that only the central parts of wide slabs progressively reduce their slab dip, such that slab flattening, and ultimately flat slab subduction, can occur. The models further show that a progressive decrease in slab dip angle for wide slabs leads to increased vertical deviatoric tensional stresses at the top surface of the slab (mantle wedge suction), facilitating flat slab subduction, while narrow slabs retain steep dip angles and low vertical deviatoric tensional stresses. The results provide a potential explanation why present-day flat slabs only occur in the Eastern Pacific, as only here subduction zones were old and wide enough to initiate flat slab subduction, and why Laramide flat slab subduction and South China flat slab subduction were possible in the geological past.
Introduction
The cross-sectional geometry of upper mantle slabs varies considerably on Earth, with variations in slab dip angle, bending curvature and potential deflection of the slab in the mantle transition zone (e.g., Jarrard, 1986; Lallemand et al., 2005). For most active subduction zones on Earth, the uppermost ∼200 km of the slab is defined by one convex-upward slab hinge located close to the trench (Figures 1A,B) (e.g., Kuril-Kamchatka, Izu-Bonin-Mariana, Sunda, Tonga-Kermadec-Hikurangi, New Hebrides). Some subduction segments, however, show two or three slab hinges in the uppermost 200 km. The former generally has a very gentle, convex upward, slab hinge near the trench and a second, more pronounced, convex upward hinge several hundred kilometers downdip, with a very low angle slab segment in between (Figure 1C) (e.g., Alaska, Nankai, Cascadia). The latter, with three slab hinges, has one convex-upward hinge near the trench, one concave upward hinge that marks the start of a flat slab segment dipping ≤10°, and one convex-upward hinge that marks the end of the flat slab segment (Figure 1D). It is this subduction geometry, with three slab hinges that is most enigmatic and that is the subject of this study. In this contribution, only the subduction geometry with three slab hinges will be referred to as flat slab subduction. There are only a few current cases of such flat slab subduction, including central Chile, southern Peru, central Peru and Mexico, as has been discussed recently (Manea et al., 2017) and as can be seen in global slab models (e.g., Hayes et al., 2012). Several examples have also been proposed for the geological past, such as western North America, Central Andes and South China (Henderson et al., 1984; Li and Li, 2007; Ramos and Folguera, 2009).
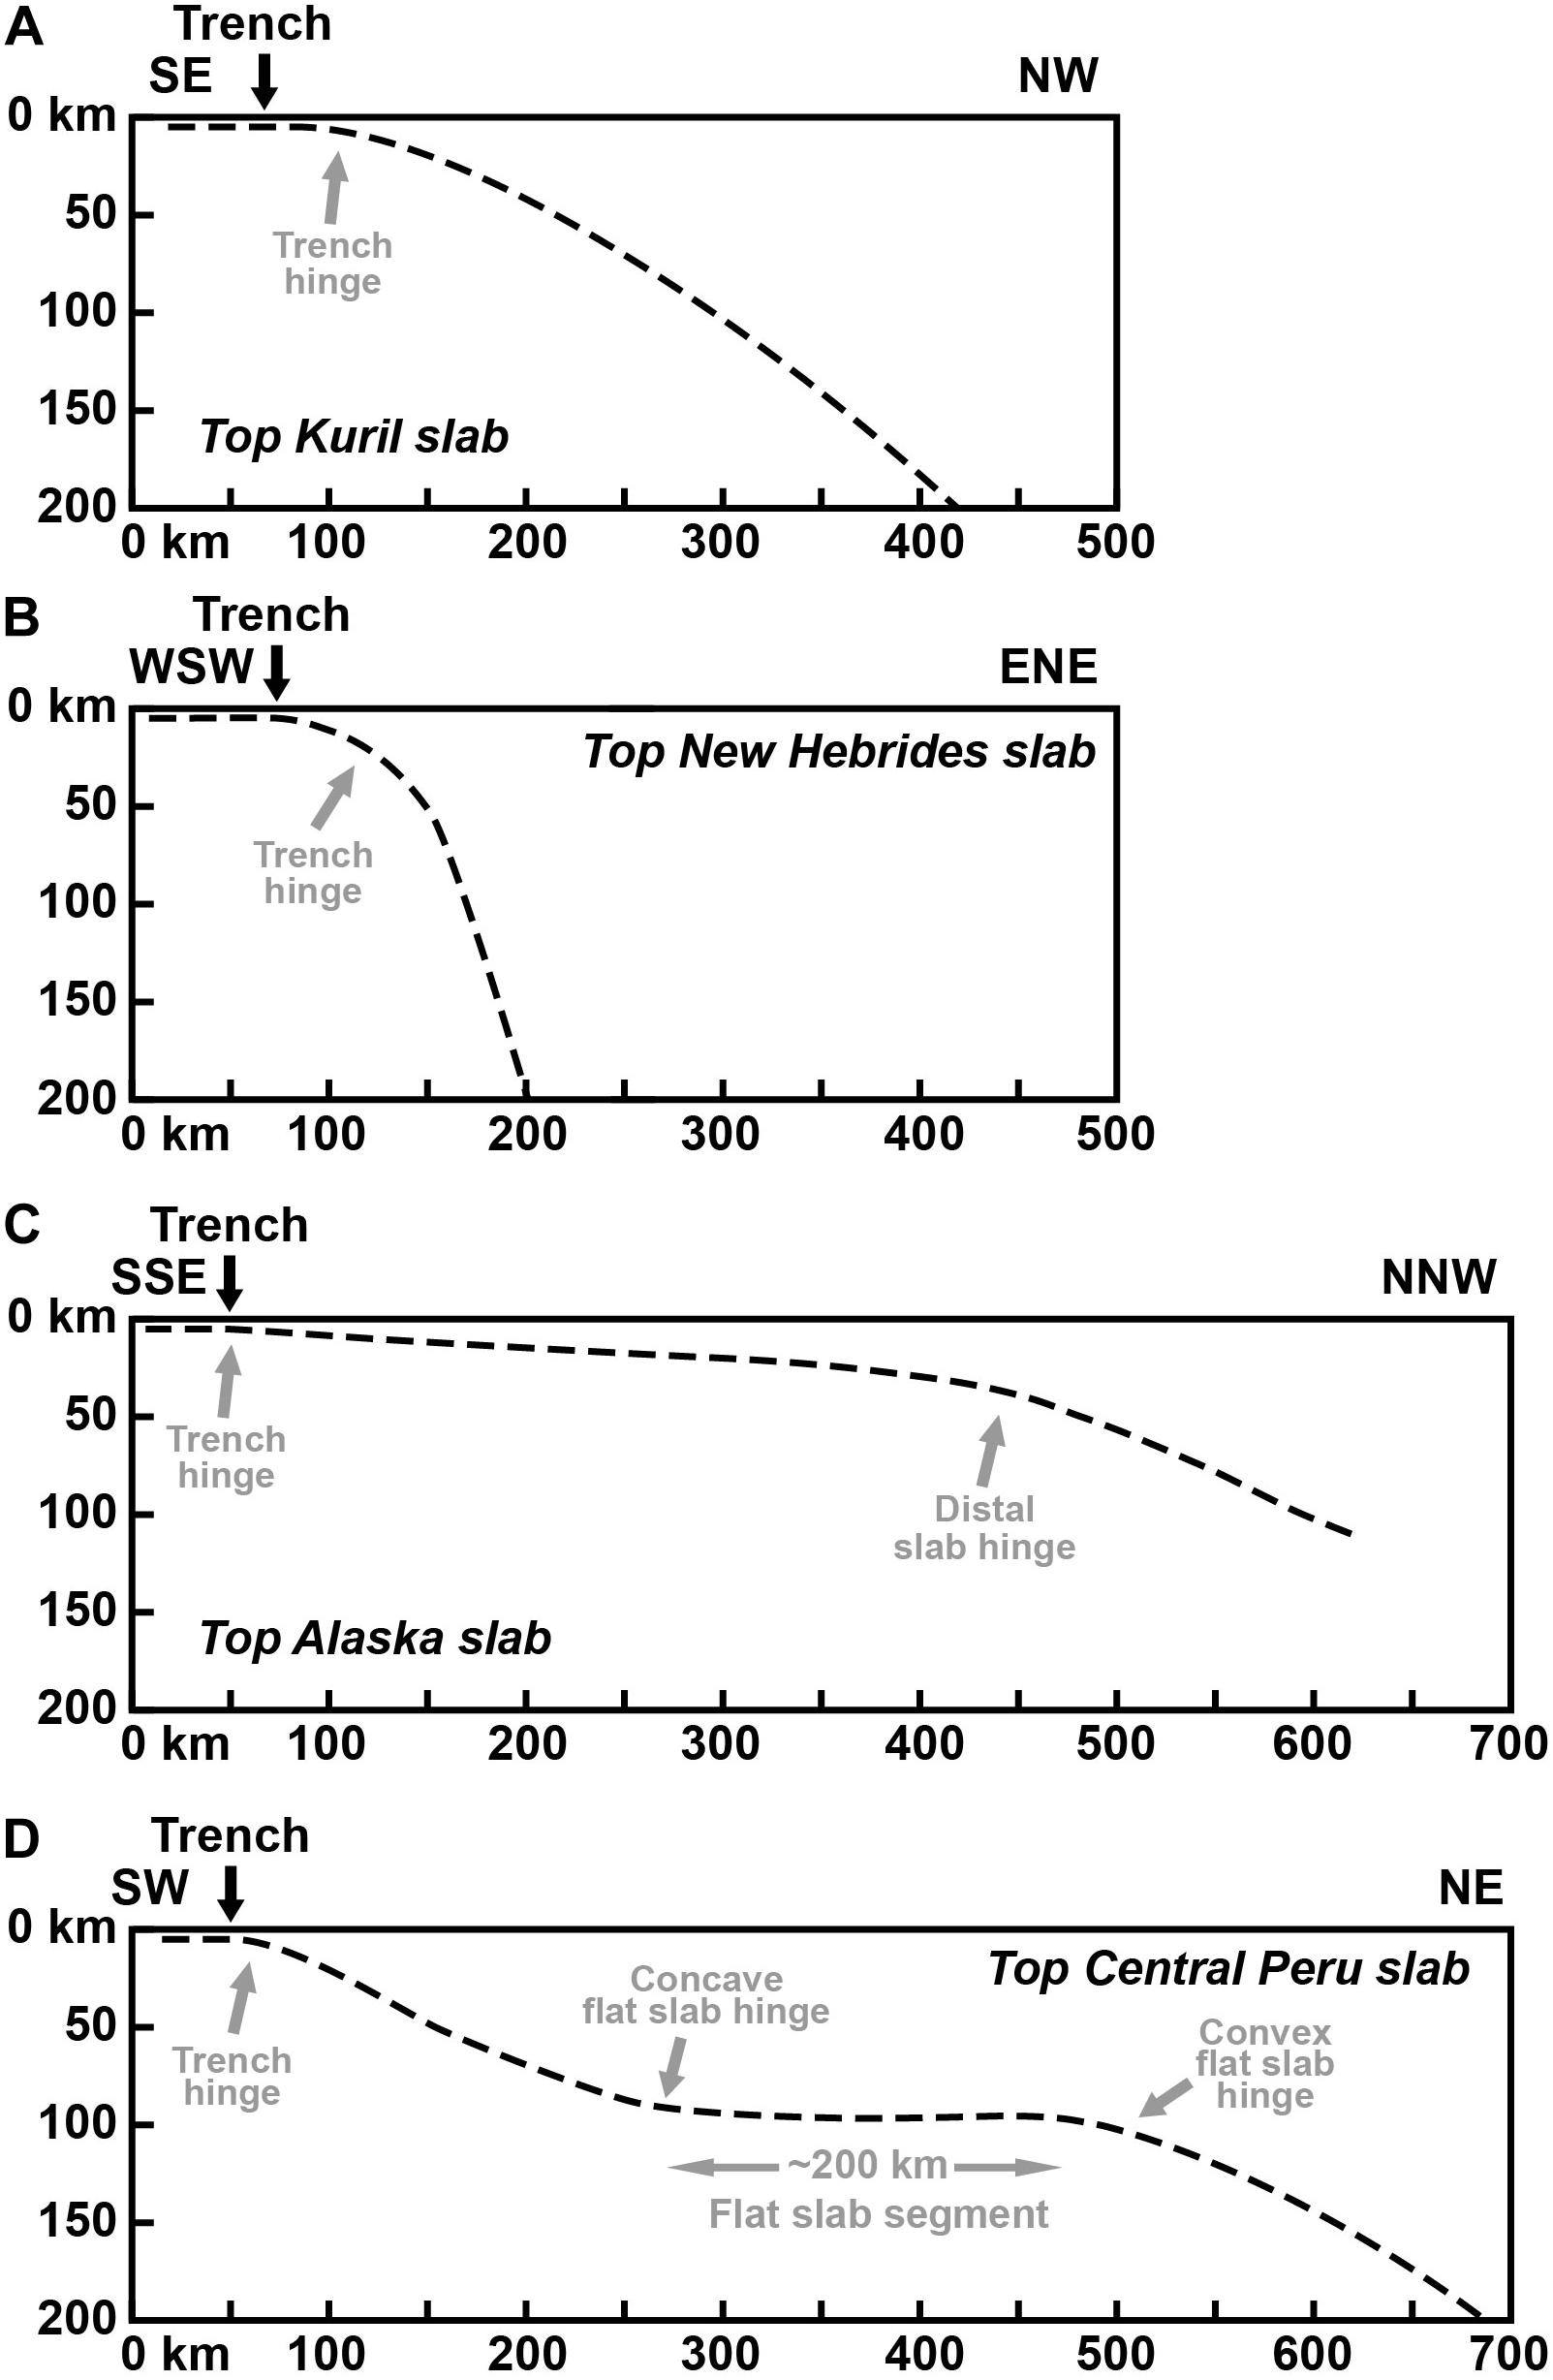
Figure 1. Variability in geometry and dip angle of the uppermost ∼200 km of slabs in nature, as shown by four examples. (A) The southern Kuril slab segment as an example of normal subduction with one convex-upward slab hinge and a normal slab dip angle [geometry derived from Slab1.0 model (Hayes et al., 2012)]. (B) The southern New Hebrides slab segment as an example of normal subduction with one convex-upward slab hinge and a steep slab dip angle [geometry from Slab1.0 model (Hayes et al., 2012)]. (C) The Alaska slab segment as an example of unusual subduction with two convex-upward slab hinges and a low-dip-angle slab segment in between [geometry derived from Ohta et al. (2006)]. (D) The Central Peru slab segment as an example of unusual subduction with two convex-upward slab hinges (trench hinge and convex flat slab hinge) and one concave upward slab hinge (concave flat slab hinge) in between [geometry derived from Phillips and Clayton (2014)]. A (sub)horizontal slab segment is located between the concave and convex flat slab hinges. It is only this slab geometry with three hinges that is referred to as flat slab subduction in this work and that is the focus of this study. Note that all images show the geometry of the top of the slab.
The origin of flat slab subduction remains enigmatic. Previous work proposed that flat slabs occur through subduction of buoyant ridges or plateaus such as the Juan Fernandez Ridge and Nazca Ridge at the South American subduction zone (e.g., Pilger, 1981; Gutscher et al., 2000; van Hunen et al., 2002). But the spatial correlation between ridge/plateau subduction and flat slab subduction has many exceptions, with regions of aseismic ridge subduction lacking flat slab subduction (e.g., Tonga with Louisville Ridge, New Hebrides with d’Entrecasteaux Ridge, Mariana with Marcus-Necker Ridge, Kamchatka with Emperor Ridge) and some flat slab subduction segments lacking an aseismic ridge/plateau (e.g., Mexico) (Skinner and Clayton, 2011, 2013; Manea et al., 2017). Others have proposed that flat slab subduction might result from forced trench retreat (e.g., van Hunen et al., 2004; Schepers et al., 2017), strong suction forces in the mantle wedge (e.g., Tovish et al., 1978), or slab-plume interaction (e.g., Betts et al., 2009). The latter mechanism has not generally been applied to Cenozoic examples of flat slab subduction, and recent geodynamic models of slab-plume interaction for present-day Earth-like settings indicate that plumes generally do not affect slab geometry as their upward buoyancy flux can be more than two orders of magnitude smaller than the downward slab buoyancy flux (Mériaux et al., 2016). Wedge suction forces are generally considered to play a role in enhancing flat slab subduction (Tovish et al., 1978; van Hunen et al., 2004), but the question is, what might enhance wedge suction? A number of recent modeling works indicate that a relatively thick or far-field cratonic overriding plate will enhance wedge suction and thus facilitate flat slab subduction (Manea et al., 2012; O’Driscoll et al., 2012; Taramón et al., 2015). Forced trench retreat can also reproduce flat slab subduction in geodynamic models (van Hunen et al., 2004), but this forcing is generally externally imposed (mostly as a velocity boundary condition on the overriding plate) and so the question remains what the source of this forcing is and if sufficient forcing can arise in a buoyancy-driven geodynamic environment in nature (and model).
A number of relatively recent works argue that flat slab subduction requires a combination of physical ingredients. Proposed combinations include forced trench retreat and enhanced suction due to a thick cratonic overriding plate (Manea et al., 2012), buoyant plateau subduction with forced trench and plate motion (Liu and Currie, 2016), buoyant ridge/plateau subduction, enhanced suction, young oceanic plate subduction, and forced trench and plate motion (Hu et al., 2016), or ridge/plateau subduction, suction and forced trench retreat (van Hunen et al., 2004; Antonijevic et al., 2015).
Here I build on these earlier findings and investigate the hypothesis that flat slab subduction (with three slab hinges as in Figure 1D) preferentially occurs at old subduction zones (those that have been active for a long time) that are very wide (large trench-parallel extent), because long-term subduction facilitates lower mantle slab penetration, which – through deep-mantle return flow – forces trenchward overriding plate motion, overriding plate thickening, upper mantle slab dip reduction and trench retreat (Schellart, 2017), with trench retreat being slow due to the wide-slab setting (Schellart et al., 2007), while wide-slab subduction enhances wedge suction, especially in the center (Dvorkin et al., 1993). A compilation from geological data of subduction zones in nature is presented, as well as results from buoyancy-driven geodynamic subduction models, that both provide support for the hypothesis that subduction zone width and age play an important role in flat slab subduction.
Materials and Methods
Data Sources for Subduction Zones in Nature
A major compilation of subduction zone age and size of the active subduction zones on Earth has been constructed, either with or without flat slab subduction, as well as a number of subduction settings from the geological past for which flat slab subduction has been reported (Figure 2). The data sources that have been used are listed in Tables 1, 2, and consist of previous works on the geological and tectonic evolution of subduction zones. Table 1 lists those subduction zones that have a present-day flat slab or a flat slab in the geological past as defined in Figure 1D in the paper (i.e., a subduction zone with a trench hinge and two flat slab hinges). Table 2 lists those subduction zones that have no reported flat slab and subduction segments of relatively large subduction zones for which that particular segment itself currently has no flat slab. For both tables, slab widths are listed. For Table 1 these are the slab widths during (or close to) subduction zone formation and the slab widths at the time when flat slab subduction commenced. For Table 2 these are the slab widths during (or close to) subduction zone formation and the present-day slab widths. All the present-day slab widths have been derived from Schellart et al. (2007). For slab width values during the geological past, a variety of published plate tectonic reconstructions have been used. Both tables also list the age of the subduction zone (the time of subduction initiation), while Table 1 also lists the time of flat slab inception and the subduction zone age at the time of flat slab inception. Details and justifications for data selection and uncertainties associated with the data are listed in the Appendix.
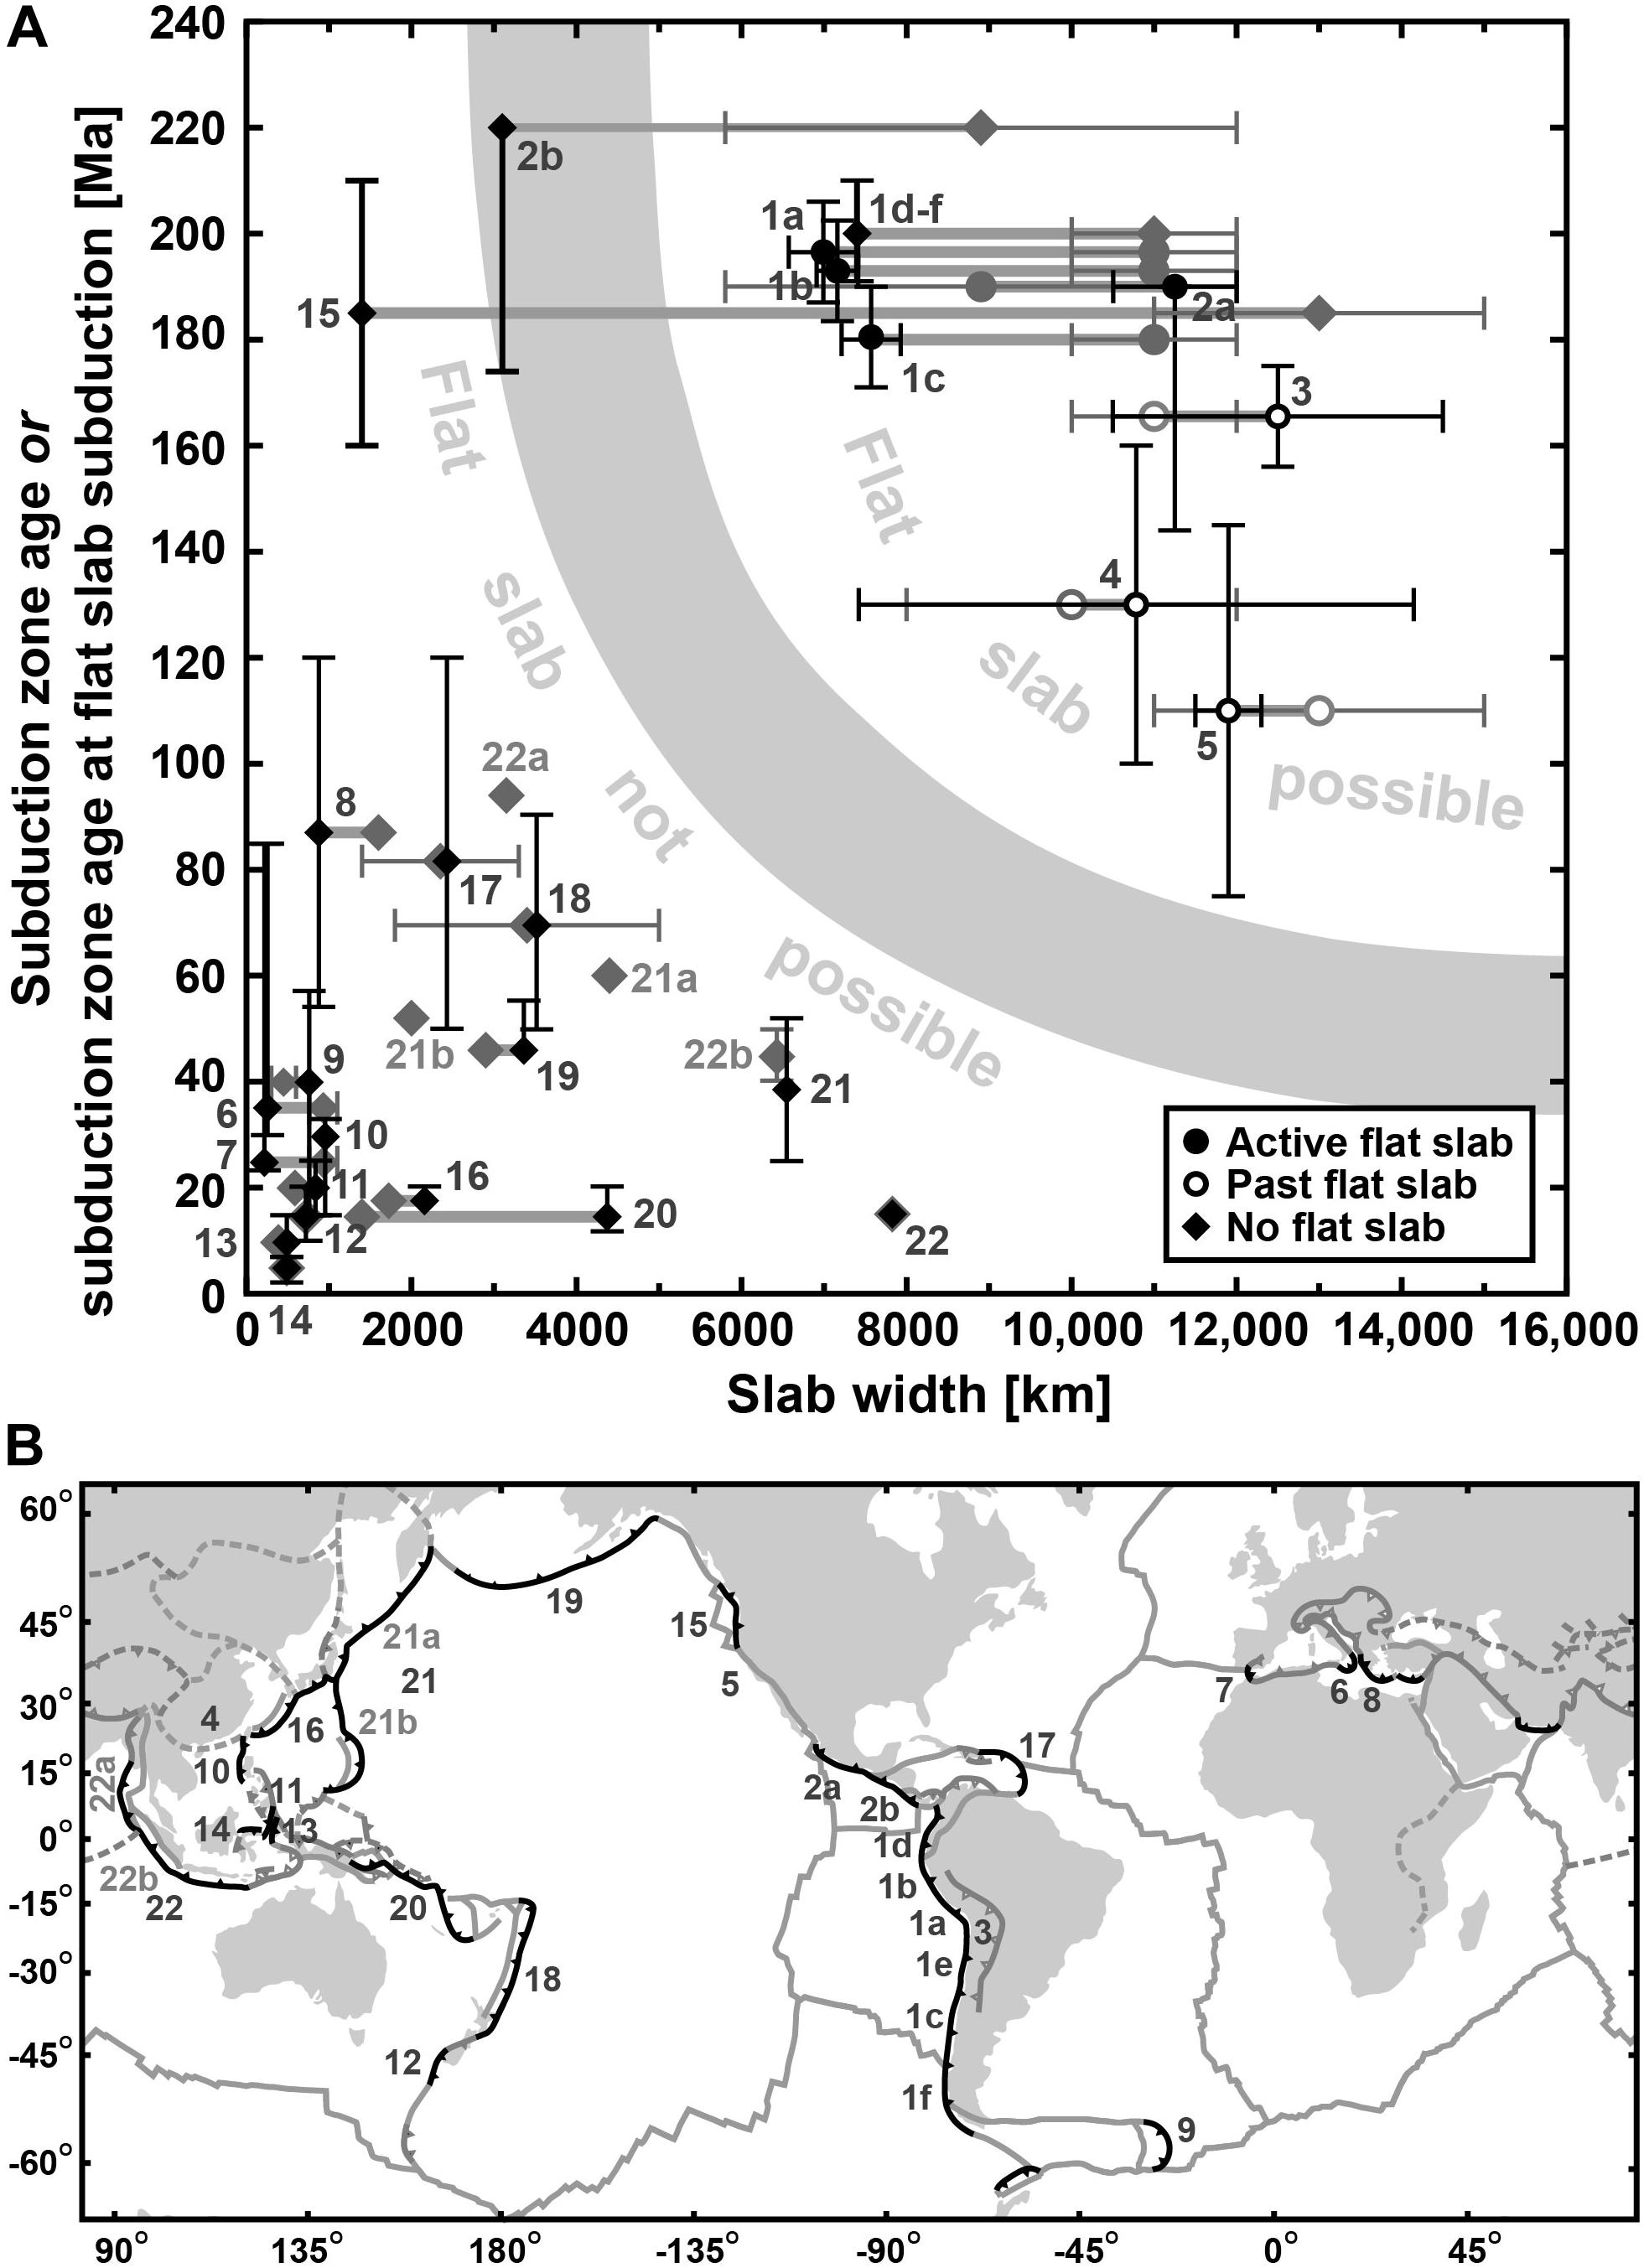
Figure 2. (A) Diagram showing the dependence of flat slab subduction in nature on slab width (trench-parallel extent) and subduction zone age. Diamonds represent subduction zones/segments without a flat slab. Filled circles and white circles with an outline represent subduction zones with a present-day flat slab and flat slab in the geological past, respectively. For the black circles and white circles with black outline subduction zone age and slab width represent the age and width at the time of flat slab inception. For the black diamonds subduction zone age and slab width represents their age and width at present. For the gray circles, white circles with a gray outline and gray diamonds slab width represents the width at subduction initiation. See Appendix and Tables 1, 2 for data choices, justification and uncertainties. Black bars and gray bars are not error bars but indicate range of age estimates and slab width estimates, where data point location represents the average or the best estimate (see Appendix and Tables 1, 2). Thick horizontal gray lines connect subduction initiation data point with present-day subduction zone data point (diamonds) or flat slab subduction initiation data point (circles) of the same subduction zone (segment). Subduction zone data points: 1–South America with 1a–Southern Peru segment (Nazca ridge), 1b–Central Peru segment, 1c–Central Chile segment (Juan Fernandez ridge), 1d–Colombia segment, 1e–Northern Chile segment, 1f–Southern Chile segment; 2–Mexico-Central America with 2a–Mexico segment, 2b–Central America segment; 3–South America (Central Andes segment); 4–South China; 5–Farallon (Laramide segment); 6–Calabria; 7–Gibraltar; 8–Hellenic; 9–Scotia; 10–Manila; 11–Sangihe; 12–Puysegur; 13–Halmahera; 14–North Sulawesi; 15–Cascadia; 16–Nankai-Ryukyu; 17–Lesser Antilles-Puerto Rico; 18–Tonga-Kermadec-Hikurangi; 19–Aleutians-Alaska; 20–Melanesia (New Britain-San Cristobal-New Hebrides); 21–Northwest Pacific (Kamchatka-Kuril-Japan-Izu-Bonin-Mariana) with 21a–Kamchatka-Kuril-Japan segment, 21b–Izu-Bonin-Mariana segment; 22–Sunda (Burma-Andaman-Sumatra-Java-Banda) with 22a–Burma-Andaman segment, 22b–Burma-Andaman-Sumatra-Java segment. The light gray zone indicates the approximate location of the boundary separating the domains where flat slab subduction is not possible (lower left) and possible (upper right). Note that for the individual subduction zone segments (1a-f and 2a-b) the entire width of the slab that these segments form part of has been plotted. (B) Map showing the location of those subduction zones and segments plotted in panel (A).
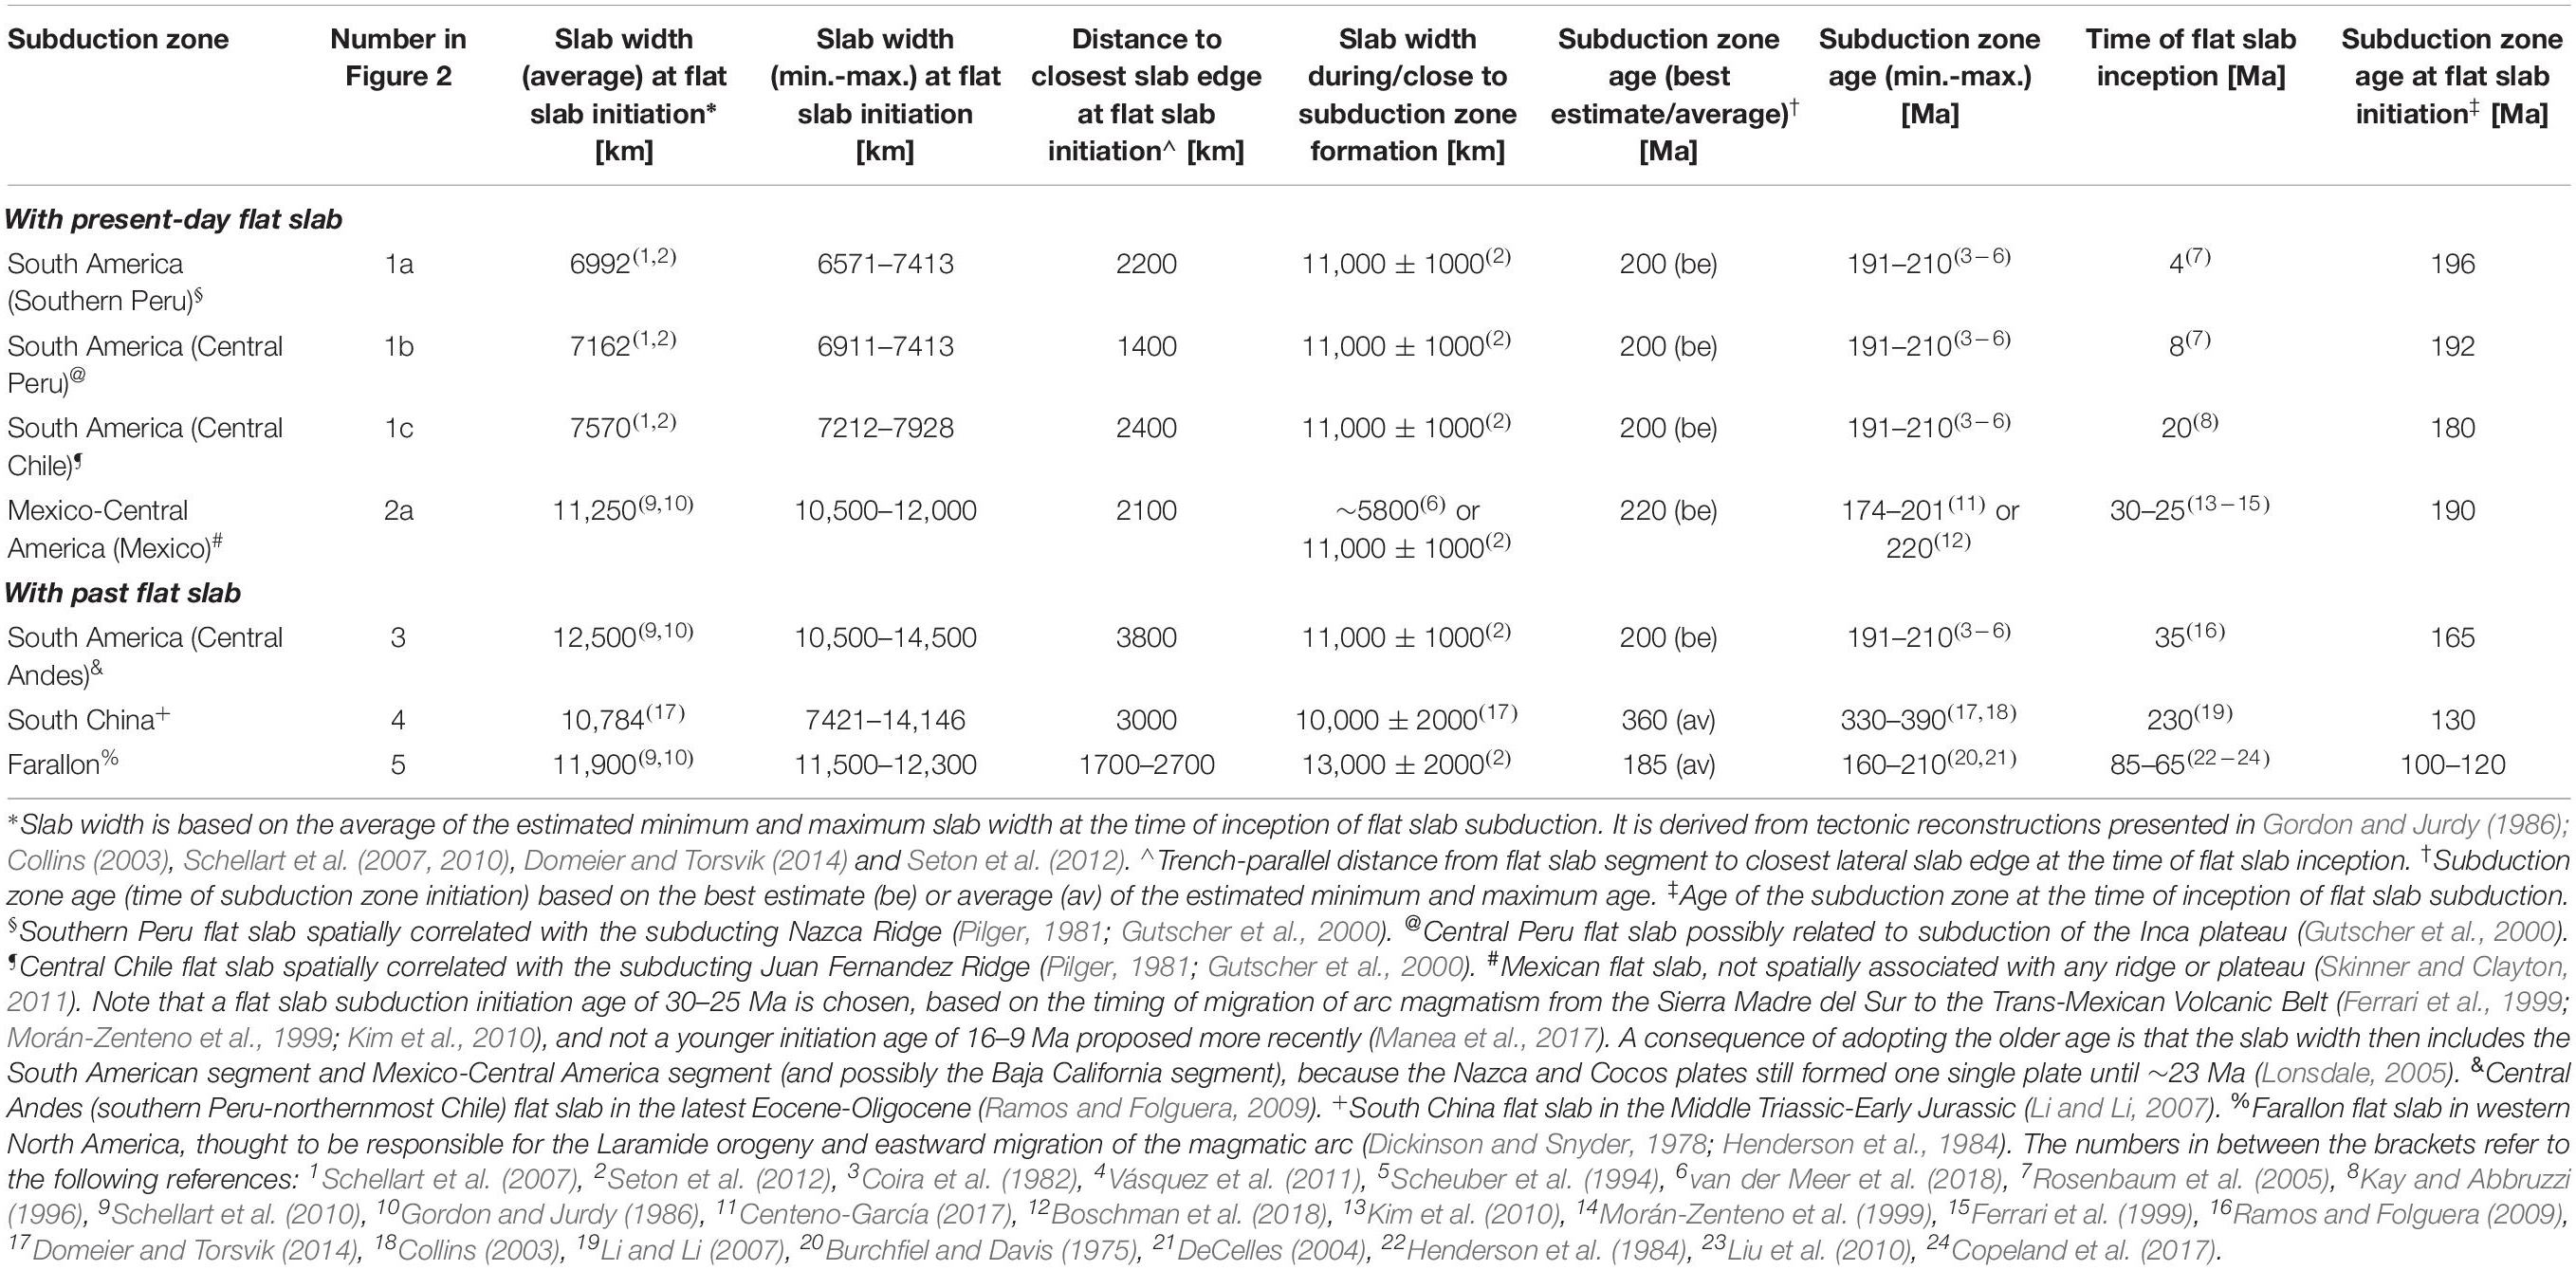
Table 1. Subduction zones with a flat slab.
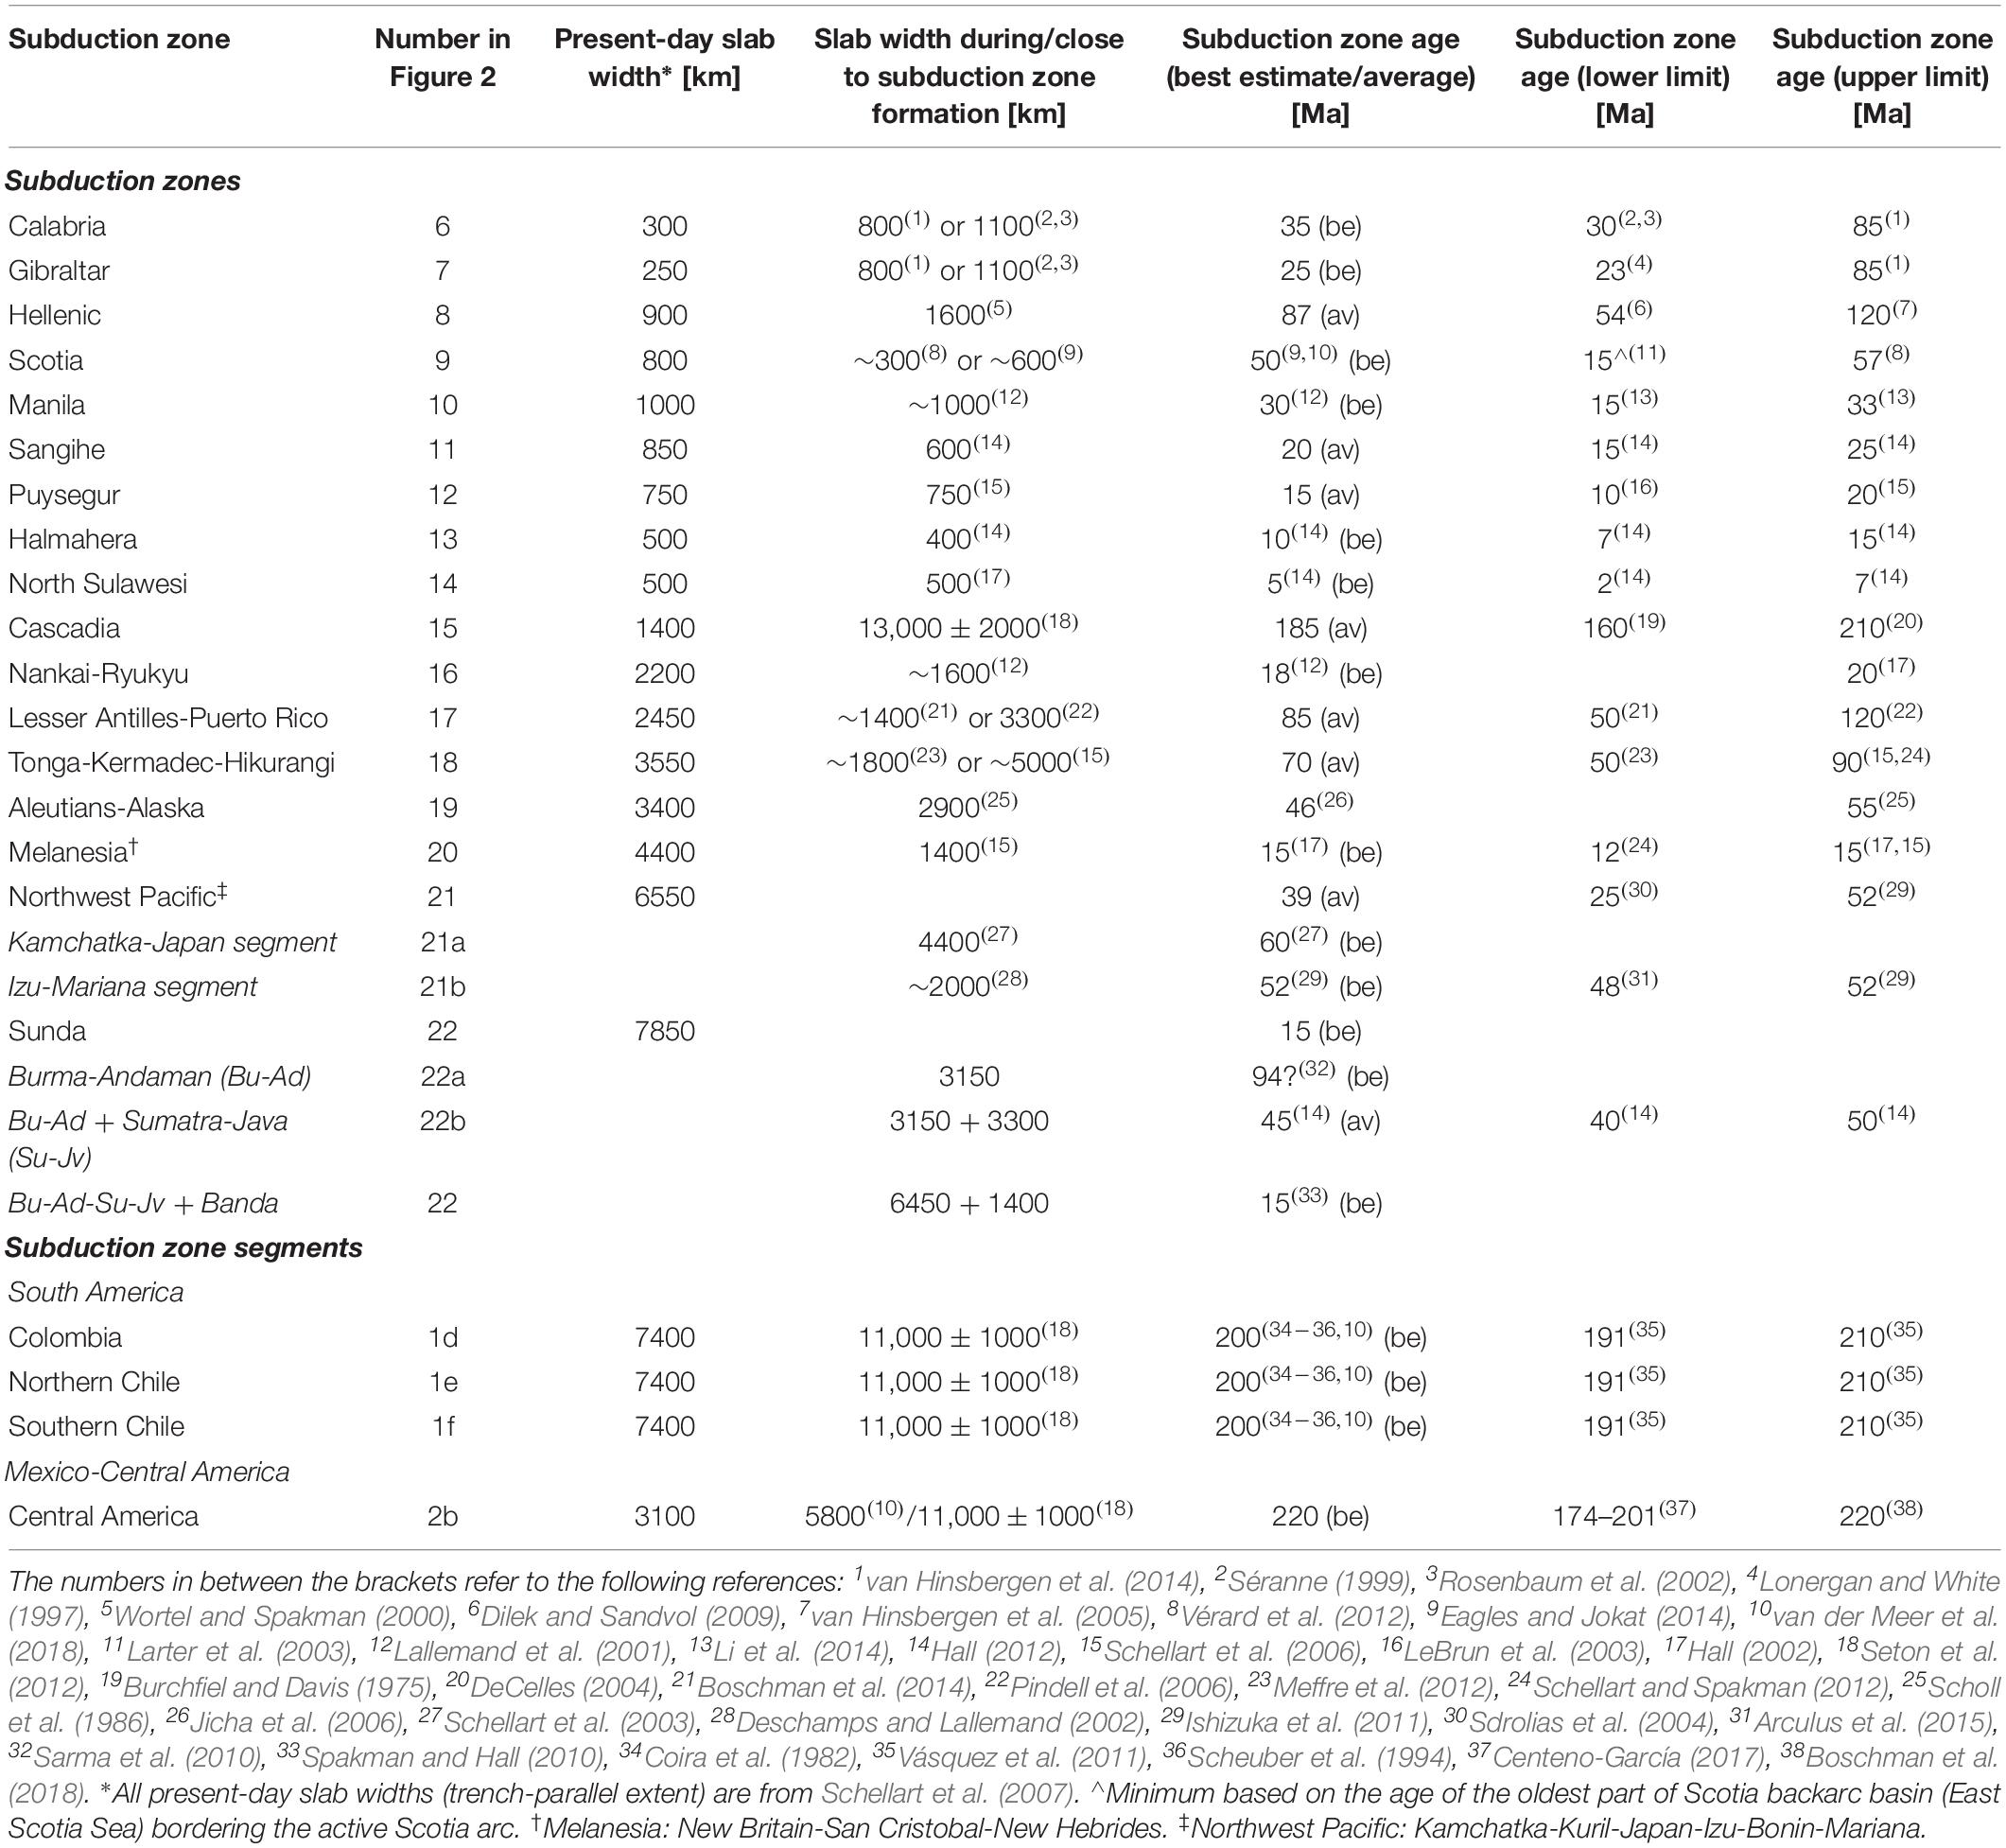
Table 2. Active subduction zones and active subduction zone segments without a flat slab.
Numerical Modeling Method
The hypothesis that flat slab subduction occurs for old and wide subduction zones is tested with geodynamic models of long-lived, buoyancy-driven, progressive subduction in which slab width is varied. The models use the Underworld numerical modeling code (Stegman et al., 2006; Moresi et al., 2007) and the model approach is the same as discussed in Schellart (2017). The models are run non-dimensionally and are later scaled to natural values. The reader is referred to the earlier works for details on the numerical method and approach. The model set-up involves buoyancy-driven subduction of a higher-density, viscously stratified, subducting plate below an overriding plate into a lower density, lower viscosity, stratified mantle that extends down to the core-mantle boundary (Figure 3). Each model has free-slip conditions along all its boundaries and starts with a short, 206-km-long slab perturbation dipping at 29° that triggers buoyancy-driven subduction. The model domain is 10,000 km long and 2900 km deep. Four models are presented that are all exactly the same except for their subduction zone width (W) and box width (BW): a narrow slab model (W600 with W = 600 km, BW = 4000 km), an intermediate-width slab model (W2000 with W = 2000 km, BW = 6000 km), a wide slab model (W6000 with W = 6000 km, BW = 12,000 km), and a very wide slab model (W-infinite, a model with a 2D spatial set-up, so W = infinite, BW = infinite). The models do not contain lateral side plates, assuming that the transform faults along the sides of the plates are very weak. Furthermore, the trailing edges of the plates are free, mimicking spreading ridges, offering minimal resistance to lateral motion, following earlier works on free subduction (e.g., Kincaid and Olson, 1987; Chen et al., 2016).
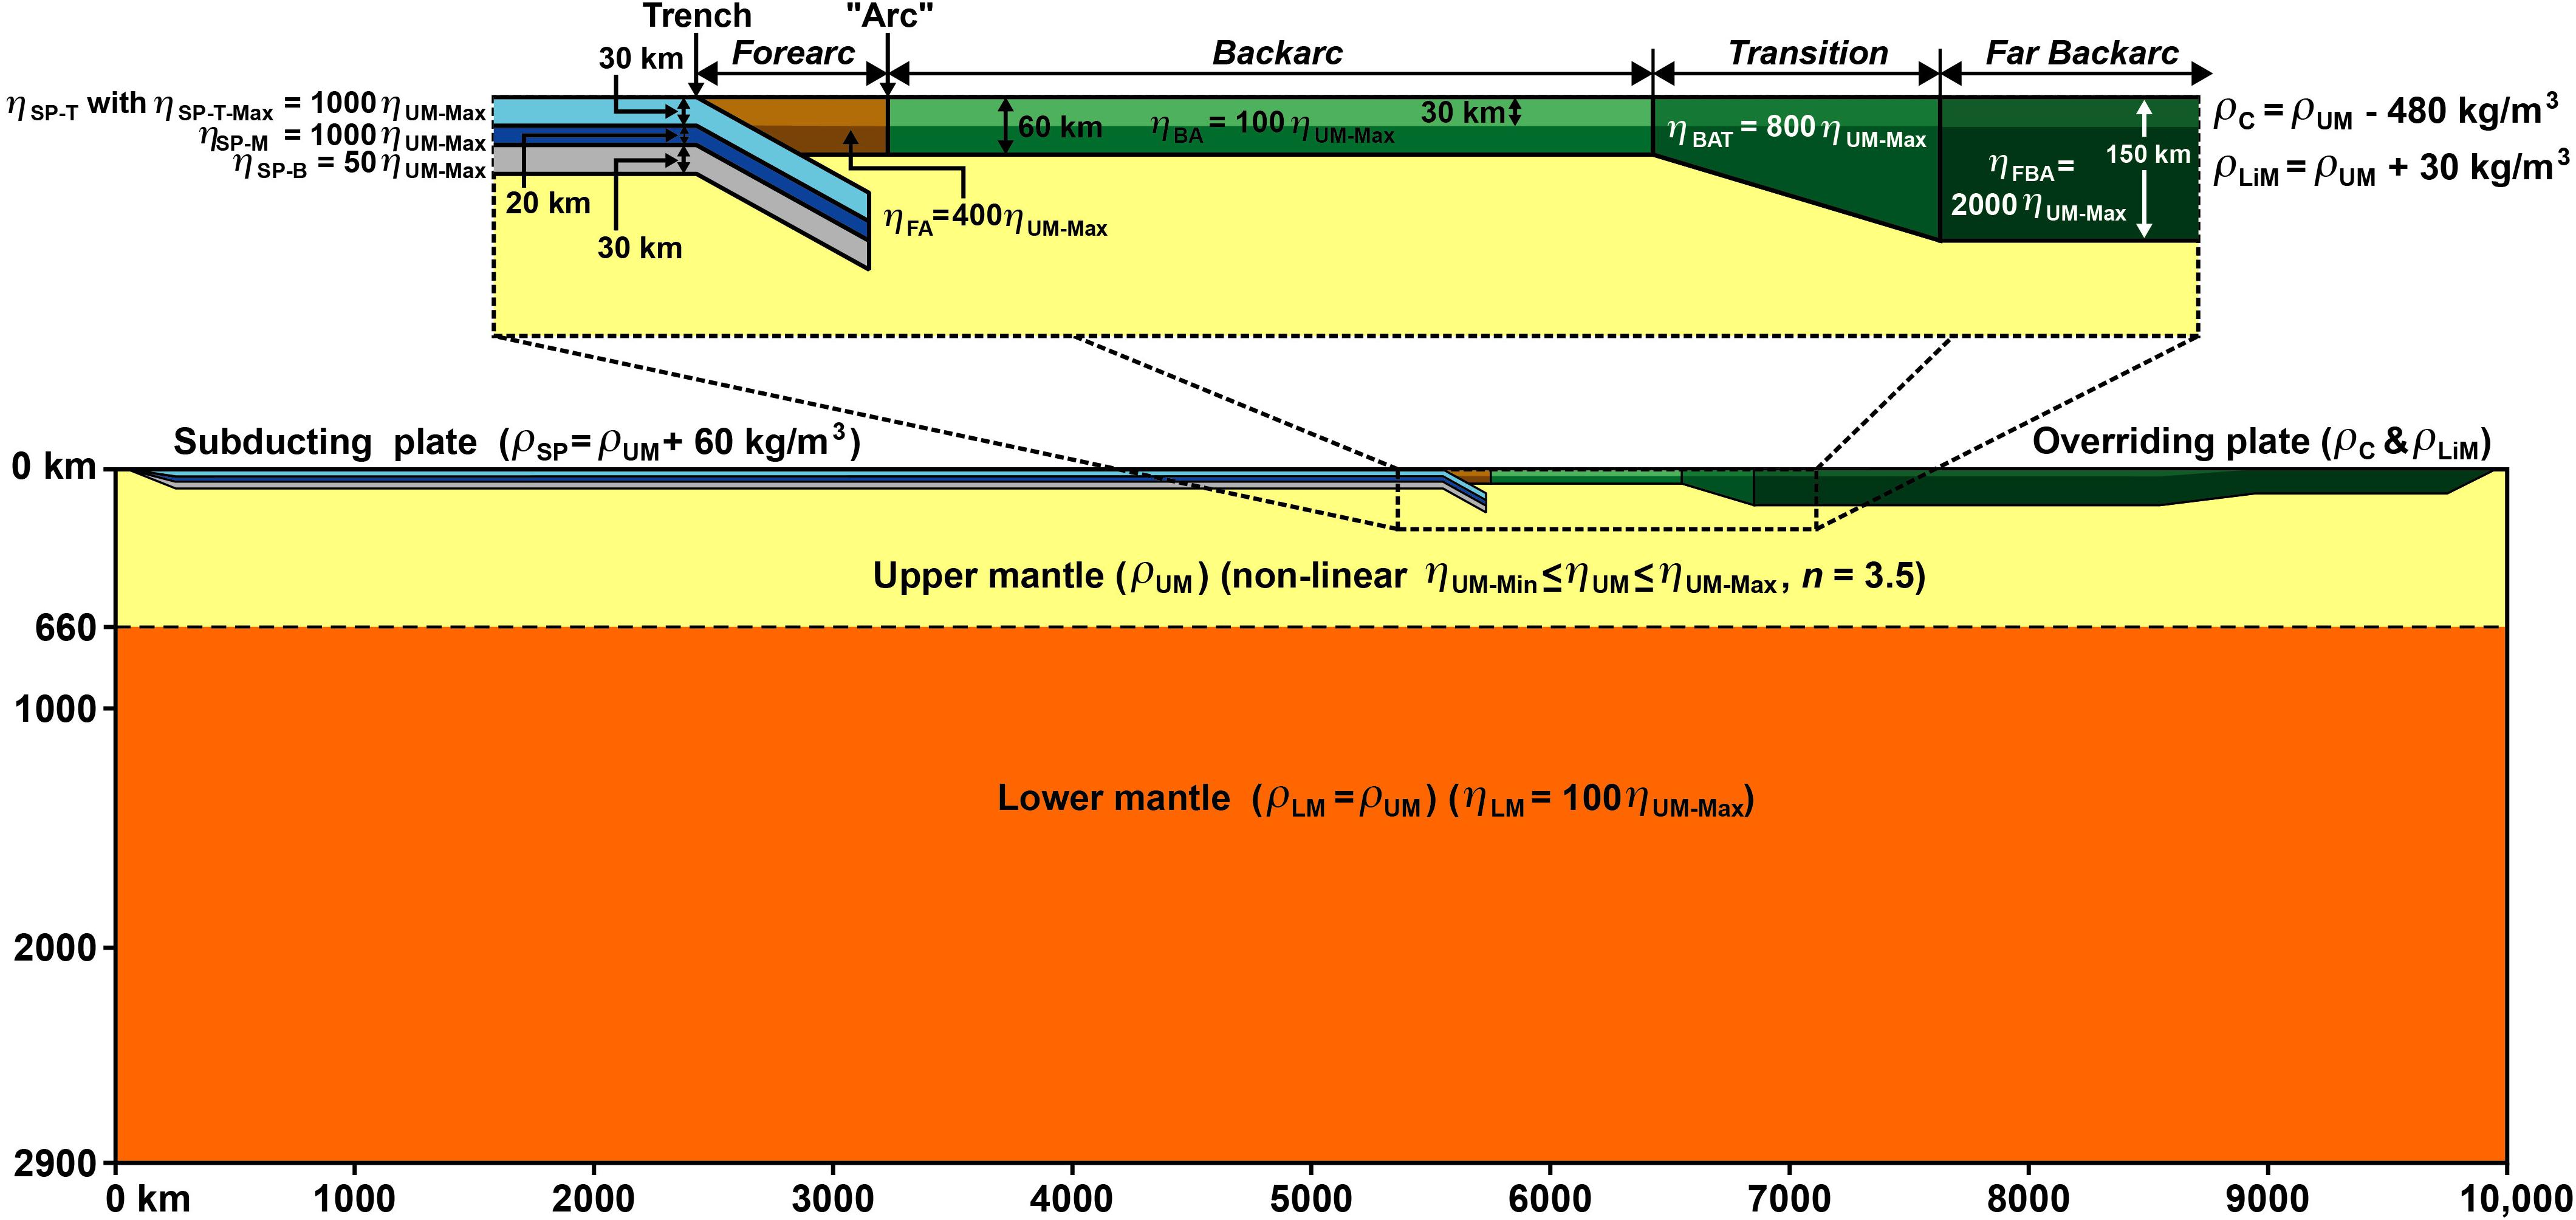
Figure 3. Cross-section through the center of the numerical domain showing the model set-up to investigate buoyancy-driven time-evolving subduction in a very large domain with a layered whole mantle reservoir. The four models reported in the paper are all the same in cross-section but differ in trench-parallel extent with a different box width (BW) and slab width (W): the narrow slab model with BW = 4000 km and W = 600 km; the intermediate-width slab model with BW = 6000 km and W = 2000 km; the wide slab model with BW = 12,000 km and W = 6000 km; and the very wide slab model with BW = infinite and W = infinite (2D model set-up). The geodynamic models include a layered negatively buoyant subducting plate with three layers with different viscosity (top, middle and bottom) and a layered overriding plate with two layers with the same viscosity but different density (crustal layer and lithospheric mantle layer). ηSP–T = subducting plate top layer viscosity, ηSP–T–Max = subducting plate top layer maximum viscosity, ηSP–M = subducting plate middle layer viscosity, ηSP–B = subducting plate bottom layer viscosity, ηFA = forearc viscosity, ηBA = backarc viscosity, ηBAT = backarc transition zone viscosity, ηFBA = far backarc viscosity, ηUM = sub-lithospheric upper mantle viscosity, ηUM–Min = minimum sub-lithospheric upper mantle viscosity, ηUM–Max = maximum sub-lithospheric upper mantle viscosity, ηLM = lower mantle viscosity, ρUM = sub-lithospheric upper mantle density, ρLM = lower mantle density, ρSP = subducting plate density, ρC = continental crustal density, and ρLiM = continental lithospheric mantle density. All the box boundaries have a free-slip condition.
The subducting plate has a homogeneous density that is 60 kg/m3 higher than that of the sub-lithospheric mantle, and is viscously stratified into three layers, including a viscoplastic top layer with a von Mises rheology to allow for decoupling of the subducting plate from the top surface, a high-viscosity Newtonian central layer and a low-viscosity Newtonian bottom layer (Figure 3). The effective viscosity averaged over the thickness of the slab falls within the range 270–640ηUM–Max (with ηUM–Max being the maximum sub-lithospheric upper mantle viscosity), which is very comparable to viscosity estimates from earlier works, such as Ribe (2010) with an estimated slab/upper mantle viscosity ratio of 140–510, and Schellart (2008) with an estimated ratio of 100–700. The overriding plate has several lateral domains with each domain having a constant viscosity. It further has a vertical density stratification with a 30-km-thick top layer with a density that is 480 kg/m3 less than that of the sub-lithospheric upper mantle, mimicking the density contrast between continental crust and sub-lithospheric upper mantle, while the density of the lithospheric mantle is 30 kg/m3 higher, mimicking continental lithospheric mantle with a density that is moderately higher than that of the sub-lithospheric mantle.
The models include a sub-lithospheric upper mantle domain with a non-linear stress-dependent viscosity ηUM down to a depth of 660 km, with a stress exponent n = 3.5 (Mackwell et al., 1990), a minimum viscosity ηUM–Min and maximum viscosity ηUM–Max, such that ηUM–Min = 0.1 ηUM–Max. The variation in sub-lithospheric upper mantle viscosity is therefore limited to one order of magnitude to facilitate reasonable convergence rates in the numerical calculations and to ensure that the scaled time of individual time steps does not drop significantly below the average scaled time. The dimensionalized ηUM–Min = 5 × 10¹⁹ Pa s and ηUM–Max = 5 × 10²⁰ Pa s. Such values are within the estimated range of values for the sub-lithospheric upper mantle (1019–1021 Pa s) in nature (Artyushkov, 1983; Ranalli, 1995). Note, however, that uncertainty in mantle viscosity values in nature directly affect dimensionalized velocity values in the models.
The 2240 km thick lower mantle domain has a Newtonian viscosity ηLM = 100 ηUM–Max. As such, a minimum viscosity jump of a factor of 102 was applied between the upper and lower mantle. This viscosity step implementation represents all the effects of the 660 km discontinuity (viscosity changes, density changes, phase transitions) and captures the discontinuity’s geodynamic essence through reducing the slab velocity in the lower mantle, as implied by earlier studies on mineral physics and phase transitions in the deep mantle (Torii and Yoshioka, 2007; Ganguly et al., 2009). The choice for this simple implementation is further supported by results from recent subduction modeling, which show that, unless a complete treatment of compositional layers and phase transitions is implemented, large-scale deformation of slabs is better approximated by a model with no phase transitions rather than including an incomplete approximation that over-predicts slab folding (Arredondo and Billen, 2016).
The isothermal conditions in the model, and thereby the absence of slab warming, will not affect the slab morphology, slab viscosity and slab-mantle density contrast in the upper mantle significantly due to the relatively rapid rate of subduction (up to 7.5 cm yr–1) and the slow rate of conductive slab warming. Lower mantle slab warming is likely more significant, producing a weaker lower mantle slab, which would thereby likely result in stronger slab folding and tighter slab folds. However, the density contrast of the lower mantle folded slab pile is not significantly affected, because it sinks as a whole and includes the entrained mantle material enclosed within the folds. Considering that warming of the folded slab segment coincides with the cooling of the entrained ambient mantle in the folds (Schellart, 2017), the thermal buoyancy contrast between folded slab pile and ambient mantle does not diminish and disappear on a timescale representing the duration of the numerical models. Therefore, the driving mechanism of the lower mantle slab is not significantly affected.
The model resolution in cross-section is 512 (horizontal) × 192 (vertical) elements with 20 particles per element. A mesh refinement has been implemented such that a 3,000 km (length) by 290 km (depth) domain around the subduction zone has a maximum resolution with cells that are 9.8 km long and 7.6 km deep. This spatial refinement is required for properly resolving the subduction zone interface. The model resolution in the trench-parallel direction is 48 (W600), 80 (W2000), and 160 (W6000) elements. The models with a 3D spatial set-up were run on the Australian national supercomputer (Raijin) using 240–496 cores and individual models took between 3 months (W600) and more than 2 years (W6000) to complete, the latter model requiring more than 90 restarts to complete a total of more than 5000 time steps (with one time step scaling to, on average, ∼0.04 Myr, so about 40,000 years). Considering the large amount of time and computational resources required to complete these models, it has not been possible to do an extensive parametric investigation other than investigating the influence of slab width. A detailed parametric study is beyond the scope of this work but is part of future studies using models with a 2D spatial set-up, in which the effect of various parameters and boundary conditions on flat slab subduction are investigated, including the subducting plate thickness, subducting plate viscosity, overriding plate viscosity, viscous stratification of the sub-lithospheric mantle, temperature-dependent viscosity and temperature-dependent density, as well as free-slip, no-slip and periodic boundary conditions.
The numerical models use Cartesian geometry. It could be conceived that the usage of (more realistic) spherical geometry would facilitate the formation of flat slabs, especially for wide slabs, because the reduction in spherical surface area with increasing depth requires a sinking slab to accommodate horizontal shortening strains and compressive stresses during progressive sinking, while the total required horizontal shortening increases linearly with slab width. The slab resistance to such strains and the associated in-plane stress arching would provide an additional lifting force to the slab that would promote slab flattening. However, the slab strain magnitude associated with the subduction of a spherical cap in spherical geometry (in contrast to a flat plate in Cartesian geometry which lacks such strain) is independent of the width of the slab, as it merely depends on the vertical sinking distance (with respect to the surface) and the radius of the sphere. Furthermore, it can be shown that strain rates in nature associated with such strains are relatively low. For example, if one considers a subducting plate that sinks from the surface down to 100 km depth at a vertical sinking rate of 5 cm/yr, this would amount to a trench-parallel shortening strain and strain rate of ∼0.016 and ∼2.5 × 10⁻¹⁶ s–1, respectively, due to the decreased radial distance to the Earth’s center and the associated reduction in trench-parallel line length. If we compare such a shortening strain rate with strain rates within subducting plates near the trench in nature resulting from plate convergence and bending, which reach values up to ∼10–14 s–1 (e.g., Kreemer et al., 2003; Stadler et al., 2010), then it is clear that the trench-parallel strain rates are subordinate, being up to 40 times smaller than the convergence/bending related strain rates. Considering these relatively low trench-parallel strain rates in spherical geometry, implying low trench-parallel within-slab compressive stresses, it is here argued that the simplification of using Cartesian geometry does not have a significant effect on flat slab subduction formation and evolution.
Results
Flat Slab Subduction Relation With Subduction Zone Age and Width in Nature
Figure 2 shows a compilation of the active subduction zones on Earth, either with or without flat slab subduction, and a number of subduction settings from the geological past for which flat slab subduction has been reported. Age since subduction initiation has been plotted against slab width. For those subduction zones without a flat slab (e.g., Scotia, Tonga-Kermadec-Hikurangi, Sunda, Nankai-Ryukyu, Aleutians-Alaska, Hellenic), their current age and width (their trench-parallel extent) have been plotted. Note again that, following the definition outlined in the introduction, Nankai, Alaska and Cascadia are not counted as flat slab settings because their uppermost slab geometry is not defined by three slab hinges (as in Figure 1D with one concave-upward hinge) but only by two convex-upward hinges (as in Figure 1C). For those subduction zones with a flat slab (as in Figure 1D), their age and width have been plotted as it was at the onset of flat slab subduction. For all zones, their width at or close to the time of subduction initiation has also been plotted. The data generally plot in two clusters: (1) One cluster that plots toward the bottom left where most subduction zones are relatively narrow and young (e.g., Scotia, Manila, North Sulawesi, Nankai-Ryukyu, Puysegur), some are older but narrow (e.g., Hellenic, Cascadia, Lesser Antilles-Puerto Rico) and some are wide but young (e.g., Melanesia, Sunda, Northwest Pacific); and (2) Another cluster that is located toward the top right where subduction zones are both old and wide (e.g., South America). Those subduction zones that plot in the first domain all lack flat slab subduction as defined in Figure 1D (but note that low angle subduction as in Figure 1C can occur). Those subduction zones that plot in the second domain in the upper right region do have one or more segments that are characterized by flat slab subduction (e.g., segments 1a–c) but also segments that are not (e.g., segments 1d–f).
Geodynamic Model Results
Geodynamic Model Evolution
The four models all show subduction through trenchward subducting plate motion and through trench retreat. The first 35–40 Myr of the model runs are characterized by upper mantle subduction, which are followed by whole mantle subduction as the deepest part of the slab sinks into the lower mantle. Each of the models shows a similar, relatively steep, slab geometry during upper mantle subduction (Figure 4). During whole mantle subduction the different models develop variability in slab geometry.
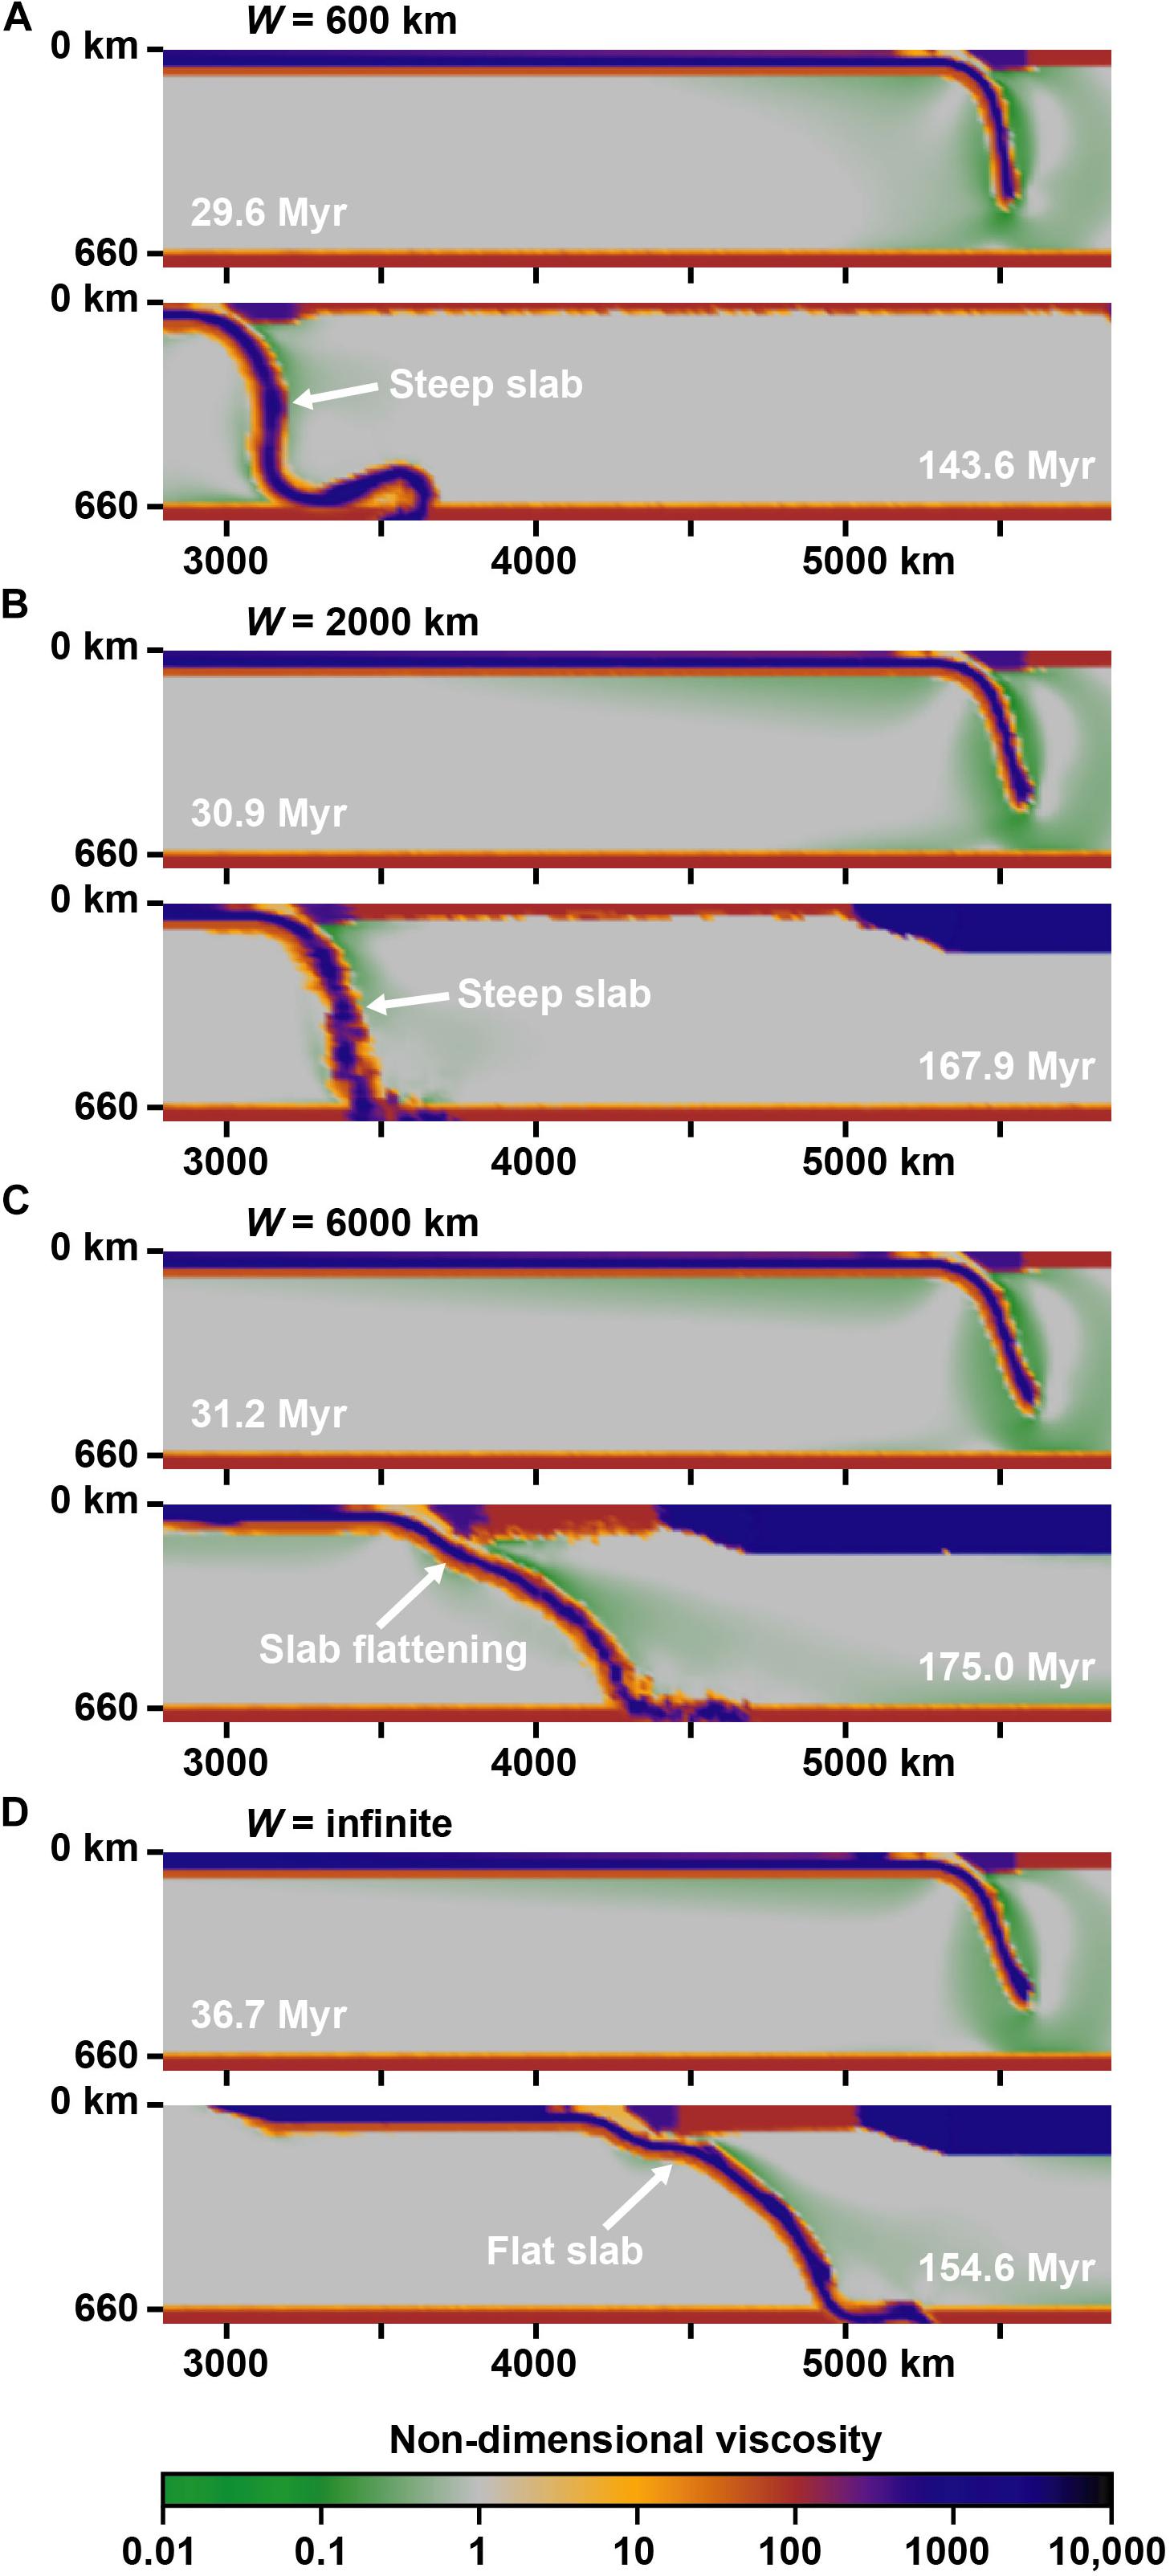
Figure 4. Cross-sections through the center of four numerical subduction models with a different slab width showing two stages in the subduction process (early and late stage). (A) Narrow slab width model (W = 600 km) showing a steep upper mantle slab. (B) Intermediate-width slab model (W = 2000 km) showing a steep upper mantle slab. (C) Wide slab model (W = 6000 km) showing upper mantle slab flattening in a late stage of subduction. (D) Very wide slab model (W = infinite, 2D set-up) showing flat slab subduction in a late stage of the model evolution. Colors indicate the non-dimensional effective viscosity field. Note that the somewhat fuzzy-blocky appearance of the slab in the lower part of the upper mantle in the bottom panels of (B,C) is the result of the implemented spatial adaptive mesh, which gives a lower resolution in the lower part of the upper mantle compared to the upper part, and the many times that repopulation of cells with particles was required to avoid the occurrence of empty cells. The high number of repopulation exercises, in particular for W = 2000 and W = 6000, caused the boundaries between different particle fields to become progressively fuzzier.
The minimum slab dip angle in the depth range 100–200 km is tracked to identify flat slab subduction. This minimum dip angle is comparable for the four experiments in the early subduction stage and of the order 60–70° (Figure 5A). Once the slab tip approaches the 660 km discontinuity at ∼35 Ma, the minimum dip angles for the different experiments start to diverge. All models show an overall, long-term, decrease in dip angle, but the magnitude of decrease depends on the slab width, with the largest decrease occurring for the widest slab. The narrow and intermediate-width slabs only show a moderate decrease in slab dip (with slab dip minima of 48 and 38°, respectively), while the wide and very wide slabs show a large decrease (with minima of 21 and 2°, respectively). For the wide slab model, slab flattening starts in a late stage at ∼171 Myr (Figures 4C, 5A). Here, the start of slab flattening is defined as the onset of formation of the concave-upward slab hinge between ∼50–150 km depth in between the two convex-upward hinges. This slab flattening only occurs in the central part of the wide subduction zone (central ∼700 km) and does not occur in segments closer toward the lateral slab edges. Indeed, the local slab dip angle near the lateral slab edges is consistently steeper than in the center with observed differences in dip angle up to 27° toward the end of the model run (Figure 5B).
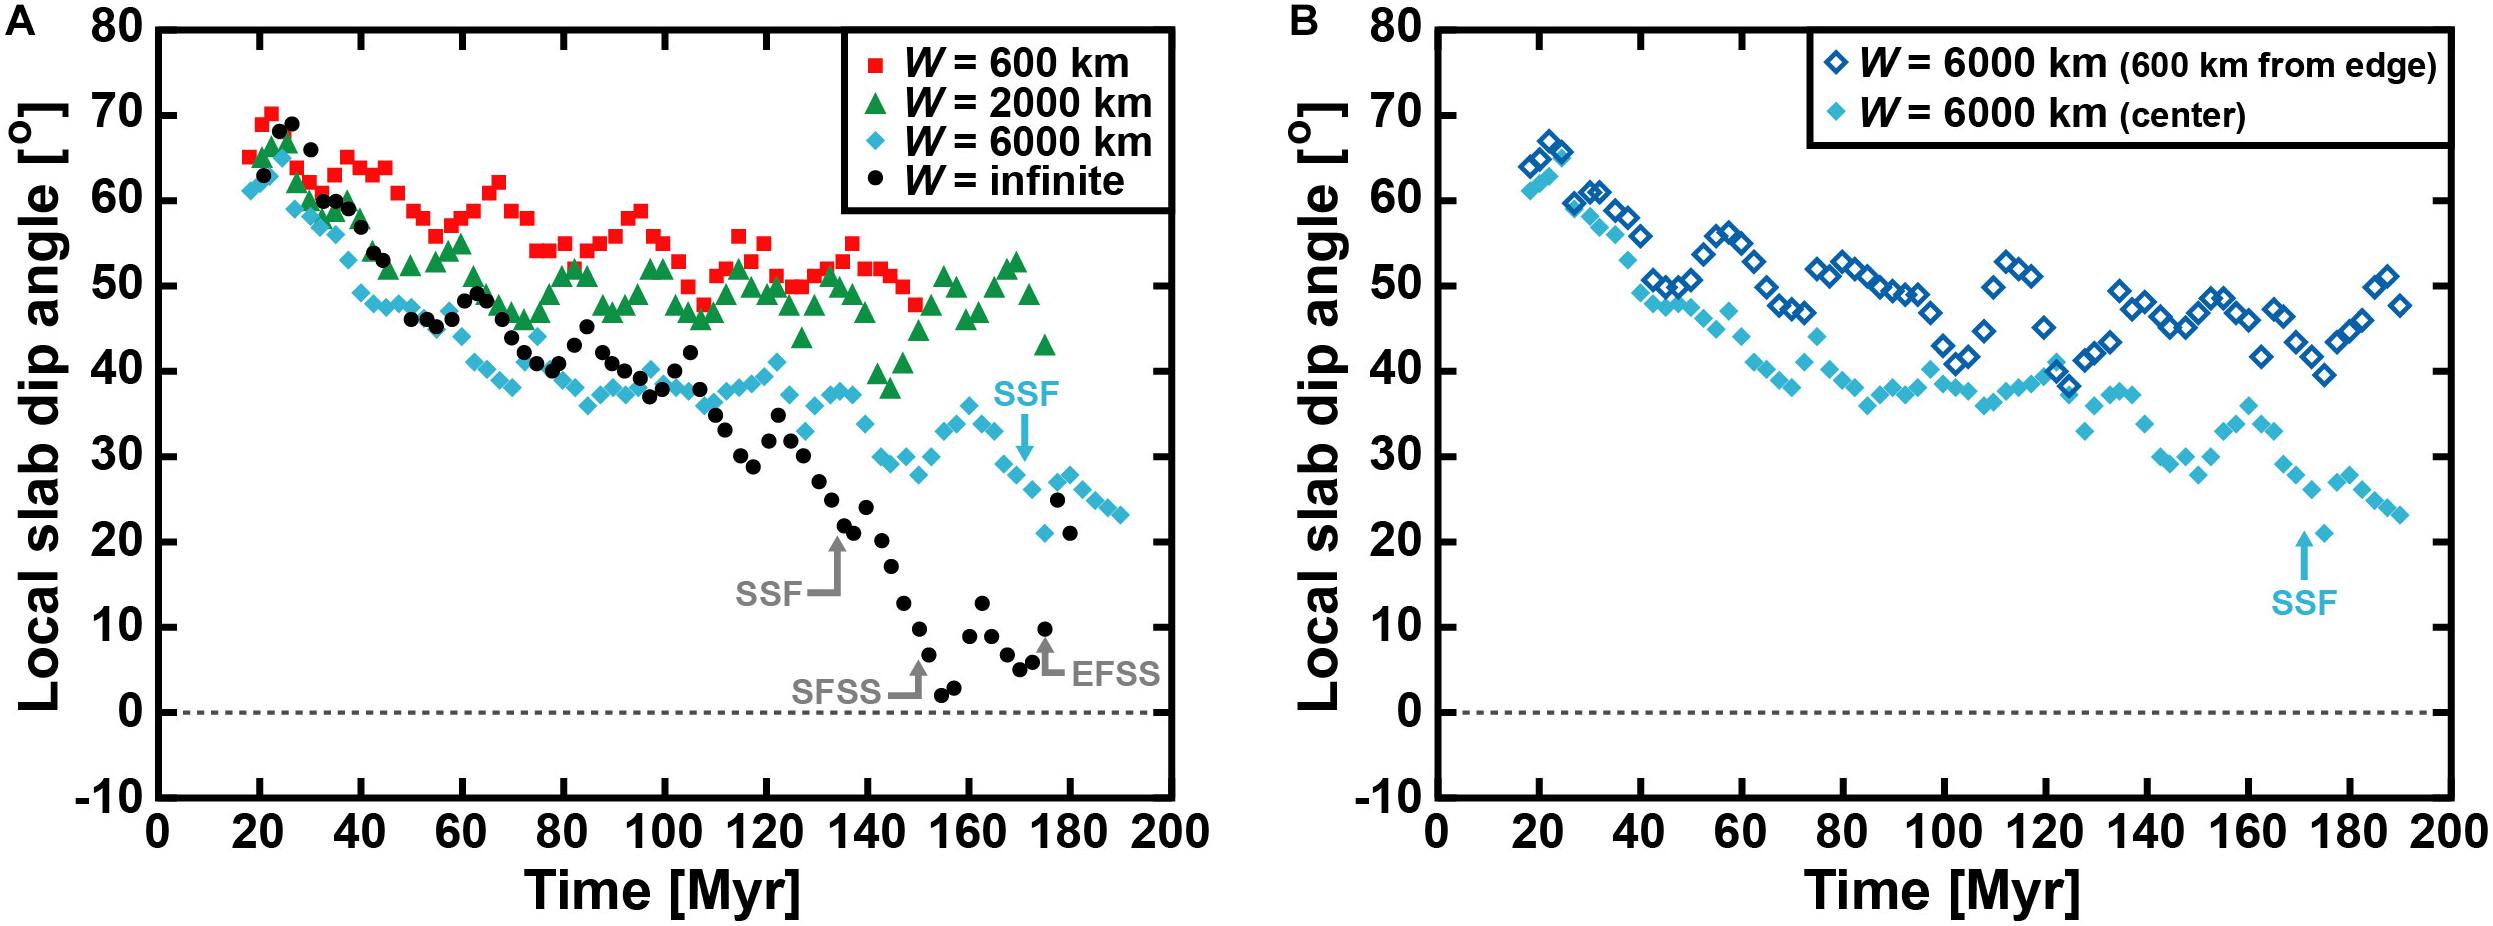
Figure 5. Slab dip angle evolution of geodynamic models of progressive subduction in which the width (W) of the subduction zone is varied [narrow slab model with W = 600 km, intermediate-width slab model with W = 2000 km, wide slab model with W = 6000 km, and very wide slab model with W = infinite (2D set-up)]. The diagrams show the temporal evolution of the minimum slab dip angle for a local, 100-km-long, slab segment within the depth range 100–200 km to determine the flat slab subduction stage, which is defined as the time when the local slab dip is ≤10°. (A) Model results for the four different models for sections located in the center of the subduction zone. The narrow and intermediate-width slab models show no flat slab development. The wide slab model shows the onset of slab flattening in a late stage of the subduction process (∼171 Myr), with the development of a concave-upward hinge in the slab at ∼100–150 km depth. For the very wide slab model, the onset of slab flattening occurs earlier (∼134 Myr) and flat slab subduction occurs in a late stage of subduction at 150–175 Myr with a brief intermittent period of ∼4 Myr where the local slab dip exceeds 10°. (B) Model results of the wide slab model for one section located at 600 km from the nearest lateral slab edge and one section through the center of the subduction zone (3000 km from the lateral slab edges). The section near the lateral slab edge retains a relatively steep slab dip angle and shows no sign of slab flattening, in contrast to the central section. SSF-Start of slab flattening; SFSS-Start of flat slab subduction; EFSS-End of flat slab subduction.
For the very wide slab model slab flattening starts at ∼134 Myr and flat slab subduction starts at ∼150 Myr, lasting ∼25 Myr (Figures 4D, 5), although briefly interrupted by a ∼4 Myr period where the local dip angle exceeds 10°. Flat slab subduction is followed by approximately normal subduction with dip angles of ∼20–30° until the end of the model run at ∼185 Myr. Note again that flat slab subduction is defined as the moment when the flat slab segment downdip of the concave hinge has a dip angle ≤10°. Also note that time in the models depends on the scaling of viscosity and velocity. Average subduction rates in the models (3–4 cm/yr) are somewhat slower than the average present-day subduction rate on Earth (5.5 cm/yr, Schellart et al., 2007). If we scale the average subduction velocities in the models to those in nature (implying a ηUM–Max = 2.7–3.6 × 10²⁰ Pa s in nature rather than ηUM–Max = 5 × 10²⁰ Pa s, with all values falling within the natural range), then flat slab subduction in the very wide slab model would be reached earlier, at ∼80–110 Myr rather than ∼150 Myr. But note that stresses are not affected by any rescaling of velocities.
Stress in the Mantle Wedge and Sub-Slab Domain
The vertical deviatoric normal stress (σYY) in the mantle wedge and in the sub-slab domain has been plotted in Figure 6 for models W600, W6000 and W-infinite. For all models it can be observed that σYY is mostly tensile in the mantle wedge near the top of the slab and compressive in the sub-slab domain near the base of the slab. Furthermore, σYY values are relatively small for the narrow slab model (Figures 6A,B), in particular in an advanced stage of subduction. Here, σYY is in the range −1.0 to 2.7 MPa at the slab top from the tip of the wedge down to 200 km depth and in the range −1.2 to 0.4 MPa at the base of the slab within the 100–200 km depth range. At an early stage of subduction σYY values are somewhat higher, with a maximum of ∼4.0 MPa (tension) at the slab top and a minimum of about −1.9 MPa (compression) at the base of the slab.
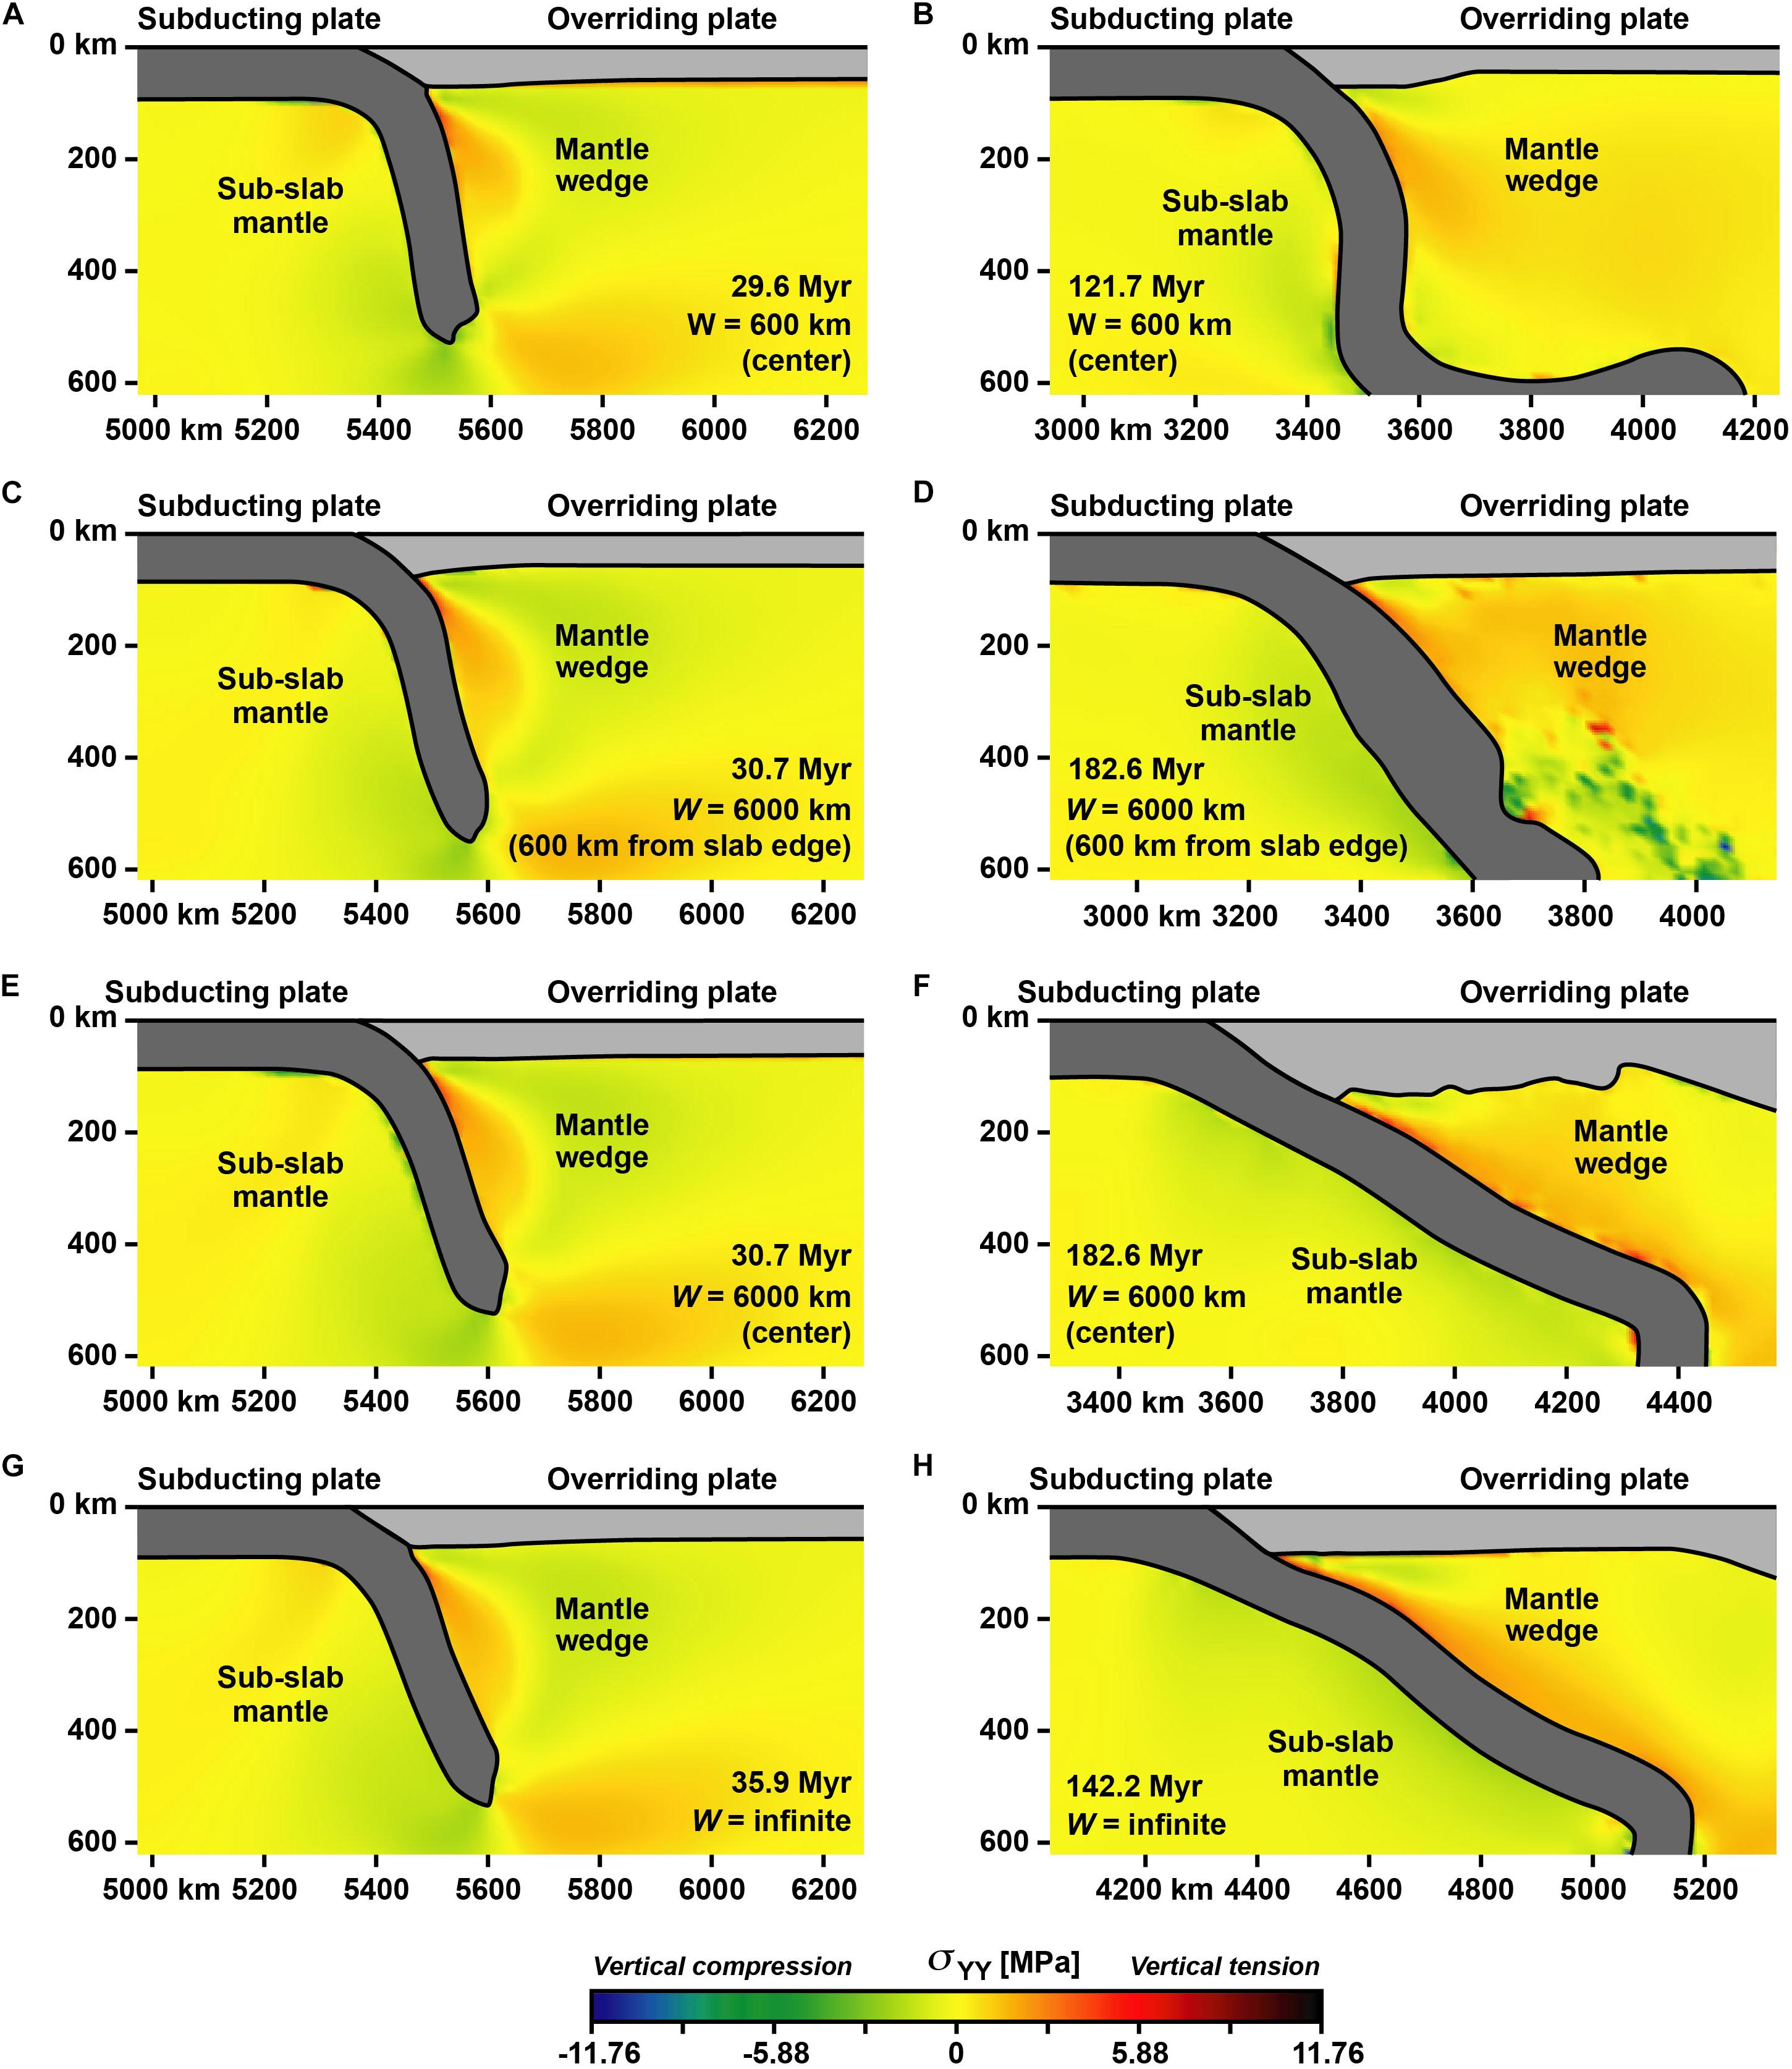
Figure 6. Cross-sections through three numerical subduction models with a different slab width showing the vertical deviatoric normal stress (σYY) in the mantle wedge and sub-slab region at two stages during the subduction process (early and late stage). (A,B) Cross sections through the center of the narrow slab width model (W = 600 km) showing relatively low stresses at all times. (C–F) Wide slab model (W = 6000 km) with panels C,D for a section located 600 km from the closest lateral slab edge and panels E,F for a section located in the center of the subduction zone (3000 km from the lateral slab edges). Low stresses are observed in the early subduction stage (C,E), intermediate stresses during a late stage near the lateral slab edge (D) and high stresses during a late stage in the center (F). (G,H) Very wide slab model (W = infinite, 2D set-up) showing relatively low stresses in the early subduction stage (G) but high stresses in a late subduction stage (H). Note that the short-wavelength structures in panel (D) (the dark green and red blobs at ∼300–600 km depth in the mantle wedge and just below the base of the overriding plate) are formed by slab material from the lateral slab edge that has been advected into the mantle wedge by the rollback-induced toroidal upper mantle return flow. This toroidal flow, which is directed from the sub-slab and around the lateral slab edge into the mantle wedge (e.g., Schellart et al., 2007), has curved and sheared the slab edge into the mantle wedge and has also sheared off small fragments from the slab edge. Additionally, a consequence of the curvature is that the local trench orientation strikes at an oblique angle with respect to cross-section (D). The slab edge material has a higher viscosity than the ambient upper mantle material and therefore shows higher deviatoric stresses than the ambient upper mantle material.
For the very wide slab model, σYY values at an early subduction stage (Figure 6G) are comparable to those of the narrow slab model at the slab top with a maximum of ∼4.0 MPa (tension), and are close to neutral (minimum of −0.2 MPa) at the base of the slab above 200 km depth. At an advanced subduction stage, however, σYY is generally much higher compared to the narrow slab model, with a maximum of ∼7.5 MPa (tension) at the slab top and a minimum of about −2.0 MPa (compression) at the base (Figure 6H). For the wide slab model W6000, the stresses in the central section (Figures 6E,F) are comparable to those of W-infinite (Figures 6G,H), but the stresses in the section close to the lateral slab edge in a late stage of subduction (Figure 6D) are smaller.
Discussion
Mechanism of Flat Slab Subduction in the Geodynamic Models
The major dip angle decrease for the wide and very wide slab models results from the large-scale whole mantle circulation they produce once the slabs enter the lower mantle. This flow drags the overriding plate trenchward, pushing the subduction hinge backward and forcing the overriding plate to thicken (Schellart, 2017) (forced hinge rollback or pushback, Figures 4C,D), while the slab itself resists rollback due to its great width (Schellart et al., 2007) and its partial anchoring in the lower mantle, thus attaining a progressively lower dip angle. The slab flattening that occurs in both models is facilitated by a relatively high effective suction force in the tip of the mantle wedge in a late stage of subduction. The very wide slab model with the 2D set-up, and thus an implied infinitely wide slab, develops the highest suction force in the tip that increases with time (Figures 6G,H), because lateral mantle inflow is absent, thereby facilitating flat slab formation. The wide slab model, despite its 6000 km width, allows for (minor) lateral mantle inflow around its lateral slab edges, reducing the wedge suction, and thus slab flattening develops more slowly (Figure 5A).
In case the slab is narrow or intermediate in width, slab rollback is directly driven by the negative buoyancy of the slab (slab-driven hinge rollback or pullback, Figures 4A,B) rather than being forced by the trenchward motion of the overriding plate, as is evident by the absence of overriding plate thickening but the presence of overriding plate thinning in these models. Rollback is facilitated by the presence of nearby lateral slab edges, which allow for efficient toroidal return flow from the sub-slab region toward the mantle wedge region (Dvorkin et al., 1993; Schellart et al., 2007), sustaining a relatively steep slab dip angle and lowering the suction in the mantle wedge. Indeed, σYY just above the top surface of the slab is significantly lower for a narrow slab (Figure 6B), which has two nearby lateral slab edges, than for the center of a wide slab (Figure 6F), which has two distant lateral slab edges, and for an infinitely wide slab (Figure 6H), which has no lateral slab edges. Furthermore, for trench segments of wide subduction zones located close to lateral slab edges, which only have one nearby lateral slab edge, σYY is intermediate to that of narrow slabs and wide slabs (Figure 6). What is more, the vertical slab lifting force (FL) that results from σYY is about an order of magnitude larger for a very wide slab than for a narrow slab. For W600, this lifting force, calculated from the tip of the mantle wedge down to 200 km depth, is ∼1.5 × 10¹¹ N per meter trench length. Here, ∼66% results from the vertical suction at the top of the slab, while ∼34% results from vertical compressive stresses at the base of the slab. For the very wide slab model the vertical lifting force is ∼1.4 × 10¹² N per meter trench length, with ∼76% resulting from the vertical suction at the slab top and ∼24% from the vertical compressive stress at the base of the slab. FL is also more significant for wide slabs when compared with the negative buoyancy force (FBu) of the same slab segment for which the lifting force has been calculated. For the very wide slab model FL/FBu = ∼8.7%, while for the narrow slab model FL/FBu = ∼1.7%.
The proposed important role of subduction zone size and age, and the proposed mechanism of slab-induced whole-mantle return flow in driving trenchward overriding plate motion, slab dip angle decrease and eventually slab flattening at wide subduction zones, can be reconciled with earlier modeling studies. Indeed, a number of earlier modeling works have advocated the important role of forced trench retreat (e.g., van Hunen et al., 2004; Manea et al., 2012), large wedge suction (e.g., Tovish et al., 1978; van Hunen et al., 2004; Manea et al., 2012; Rodríguez-González et al., 2012) and a thick overriding plate (e.g., Rodríguez-González et al., 2012) or far-field thick craton in the overriding plate (e.g., Manea et al., 2012; O’Driscoll et al., 2012; Taramón et al., 2015) in promoting flat slab subduction. The current work shows that, in a buoyancy-driven environment, forced trench retreat, large wedge suction and a thick overriding plate will develop in a wide subduction zone setting after a long period of subduction (of the order 100 Myr) once the slab tip has reached a significant depth in the lower mantle. The current work also shows that such features will not develop in a narrow or intermediate-width subduction zone setting, or close to lateral slab edges.
The mechanism for flat slab generation as proposed above requires a slab in nature to behave as a strong entity that is generally continuous from the surface to the lower mantle without major holes or tears in the upper mantle part of the slab. Indeed, it is generally thought that slab tearing can facilitate the collapse and removal of a flat slab (e.g., Hu and Liu, 2016; Schepers et al., 2017). For a strong and continuous slab, this requires natural slabs to have a greater viscosity than the ambient upper mantle, which is generally thought to be the case with slabs that are, on average, about 140–510 times (Ribe, 2010) or 100–700 times (Schellart, 2008) more viscous than the ambient mantle. The current models adopt comparable average viscosity ratios and slab deformation is accommodated through stretching, thickening, bending and buckling, not by slab tearing, thereby facilitating flat slab subduction. Another requirement is for slabs to be continuous from the surface down to the lower mantle, which is the case for a number of slabs in nature that include flat slab segments, as implied by mantle tomography studies. In particular, several tomography studies indicate that part of the Nazca slab subducting below South America continues down to ∼2400 km (e.g., van der Meer et al., 2018), and that part of the Cocos slab subducting along the Mexico-Central America subduction zone continues down to ∼2600–2800 km (e.g., Boschman et al., 2018).
Present-Day Flat Slabs in the Eastern Pacific
Flat slab subduction occurs in the Eastern Pacific in Peru, Central Chile, and Mexico and the proposed flat slab mechanism, involving a wide subduction zone (≥∼6000 km) and prolonged (>∼80–110 Myr) subduction, applies to these examples (Figure 2). Indeed, they formed at the Farallon/South American subduction zone at a time when it had been active for a long period (since the Middle Triassic-Early Jurassic) (Burchfiel and Davis, 1975; Coira et al., 1982; Boschman et al., 2018) and when it was extremely wide (7000–13,000 km). The Altiplano flat slab that formed in the central Andes at ∼35 Ma and terminated at ∼25 Ma (Ramos and Folguera, 2009) can also be explained in this manner. Although the Mexico flat slab is currently part of an intermediate-width subduction zone (Mexico-Central America), at the time when this flat slab formed at 30–25 Ma, as implied by the inboard migration of arc magmatism (Ferrari et al., 1999; Morán-Zenteno et al., 1999; Kim et al., 2010), the subduction zone was very wide (∼11,000 km) (Table 1).
There are also several subduction segments of the South American subduction zone and Mexico-Central America subduction zone that do not contain a flat slab, including the Colombia, Northern Chile, Southern Chile and Central America segments. This observation implies that an old and wide subduction zone is a requirement for flat slab subduction to occur, but it is not a guarantee that a flat slab will always be present. The observation is consistent with the geodynamic modeling results, which show that for the very wide slab model flat slab subduction is a transient phenomenon, for this model lasting some 25 Myr, and is preceded and succeeded by normal subduction. The transient nature of flat slab subduction is at least partly explained by the periodic folding of the slab at the 660 km discontinuity and the initiation of flat slab subduction is likely triggered by a new slab folding phase. Such folding is also responsible for the periodic dip angle changes (Schellart, 2017) that characterize each model (Figure 5). In nature, flat slab subduction at an old and wide subduction zone could also be triggered by a slab folding phase at the 660 km discontinuity, or it could be triggered by another process such as the initiation of subduction of an aseismic ridge or plateau.
Past Flat Slab Subduction
Latest Cretaceous-Early Cenozoic Flat Slab Subduction in Western North America
Flat slab subduction has been proposed for Western North America to explain the eastward migration of the magmatic arc and the eastward migration of the deformation front during cordilleran mountain building in the Late Cretaceous and Early Cenozoic (Henderson et al., 1984; DeCelles, 2004). Formation of the flat slab has been ascribed to the trenchward motion of the overriding North American plate and the subduction of aseismic ridges or oceanic plateaus (Henderson et al., 1984; Liu and Currie, 2016). The current work implies that flat slab subduction would not have been possible in the first place were it not for the extreme width (∼12,000 km) and longevity (∼110 Myr) of the subduction zone (Figure 2), and the large separation of the flat slab segment from lateral slab edges (Table 1).
Mid Triassic-Early Jurassic Flat Slab Subduction in South China
A model of flat slab subduction has been proposed to explain the broad intracontinental Mesozoic orogen in South China and the postorogenic magmatism in the region (Li and Li, 2007), with flat slab subduction starting in the mid Triassic (∼230 Ma) (Li and Li, 2007) along a subduction zone in the paleo Western Pacific. Reconstructions indicate that the subduction zone has been active since the mid Carboniferous (330 Ma) (Domeier and Torsvik, 2014) or Middle Devonian-Early Carboniferous (390–356 Ma) (Collins, 2003; Domeier and Torsvik, 2014). As such, the subduction zone had been active for 100–160 Myr when the flat slab developed along a subduction zone that was likely very wide (Figure 2 and Table 1), which is consistent with the proposed mechanism.
Absence of Present-Day Flat Slabs in the Western Pacific and Elsewhere
The general absence of current flat slabs (i.e., with a slab geometry as in Figure 1D) in the Western Pacific, Indian Ocean, Atlantic Ocean, and Mediterranean can be explained by the lack of at least one of two crucial ingredients, namely subduction zone longevity and large slab width (Figure 2). There are three large subduction zones (W ≥ 4000 km) in these regions, Sunda, Northwest Pacific and Melanesia (Schellart et al., 2007), but Sunda has been active only since the Middle Eocene (Hall, 2012), Northwest Pacific came into existence only after the Izu-Bonin-Mariana segment formed in the Early Eocene (Arculus et al., 2015), while Melanesia only formed in the Miocene (Hall, 2002; Table 2). Apart from these three subduction zones, the remaining ones in the Western Pacific, Atlantic, Indian Ocean and Mediterranean all have small or intermediate widths (Schellart et al., 2007). The lack of subduction zone longevity and/or large width did not allow for a significant decrease in slab dip angle (Figure 5) nor did it enhance suction forces (Figures 6A–C,E), thereby preventing subduction zones in these regions to form a flat slab. The lack of subduction zone longevity and/or large width also prevented those Western Pacific subduction zones subducting an aseismic ridge or plateau (e.g., d’Entrecasteaux Ridge at the New Hebrides subduction segment, Marcus-Necker Ridge at the Mariana-Bonin segment) to form a flat slab. This implies that buoyant ridge/plateau subduction is not sufficient on its own to cause flat slab subduction, in agreement with earlier work on Nazca Ridge subduction (Antonijevic et al., 2015). It is also consistent with recent geodynamic experiments of buoyancy-driven subduction with an aseismic ridge, indicating that subduction of a large ridge (e.g., Carnegie Ridge or Nazca Ridge) reduces the slab dip angle in the shallow part of the upper mantle by a mere ∼10° and does not produce flat slab subduction on its own (Flórez-Rodríguez et al., 2019).
Conclusion
The observational constraints (Figure 2) and models (Figures 4–6) imply that flat slab subduction dominantly initiates at wide subduction zones (≥ ∼6000 km) and only after a prolonged period of subduction (≥ ∼80–110 Myr). This finding is consistent with earlier works advocating the role of forced trench retreat, large wedge suction and a thick or cratonic overriding plate in promoting flat slab subduction (e.g., van Hunen et al., 2004; Manea et al., 2012, 2017; O’Driscoll et al., 2012; Rodríguez-González et al., 2012; Taramón et al., 2015; Schepers et al., 2017), because only in the center of wide subduction zones do forced trench retreat and overriding plate thickening develop in a late subduction stage, and is the effective wedge suction high. The conceptual model works for the proposed Laramide flat slab in western North America (Henderson et al., 1984; DeCelles, 2004), the Early Mesozoic South China flat slab (Li and Li, 2007), and the current flat slabs in the Eastern Pacific, as they developed at old and wide subduction zones (Figure 2). The finding can also explain the absence of present-day flat slabs in the Western Pacific, Indian Ocean, Atlantic Ocean and Mediterranean, because subduction zones here are either relatively young (< ∼80–110 Ma), less than ∼6000 km wide, or both. Subduction of a buoyant aseismic ridge or plateau in these regions will not induce flat slab subduction, as slabs in these regions will not have had sufficient time to reduce their dip angle at shallow depth and/or will not have a significant mantle wedge suction force due to the limited slab width. It thereby solves a longstanding debate on the lack of spatial correlation between ridge subduction and flat slab subduction in regions outside the Eastern Pacific.
Data Availability Statement
All data and methods necessary to understand, evaluate, replicate, and build upon the reported research are presented in this article.
Author Contributions
The author confirms being the sole contributor of this work and has approved it for publication.
Funding
This work has been funded by a Vici Fellowship (016.VICI.170.110) from the Dutch National Science Foundation (NWO), and has been supported by computational resources from the NCI National Facility in Australia through the National Computational Merit Allocation Scheme (project qk0).
Conflict of Interest
The author declares that the research was conducted in the absence of any commercial or financial relationships that could be construed as a potential conflict of interest.
Acknowledgments
Discussions with and/or comments from Vincent Strak, Joao Duarte, Marc-Andre Gutscher, Douwe van Hinsbergen, Filipe Rosas, and Mélanie Gérault on subduction dynamics, subduction geology and flat slab subduction are greatly appreciated. I would like to thank the two reviewers for their constructive comments and suggestions, which have improved the contents and clarity of this paper. I would also like to thank Louis Moresi, Mirko Velic, Julian Giordani, John Mansour, and Owen Kaluza for technical support with, and development of, the Underworld code.
References
Advokaat, E. L., Bongers, M. L. M., Rudyawan, A., BouDagher-Fadel, M. K., Langereis, C. G., and van Hinsbergen, D. J. J. (2018). Early Cretaceous origin of the Woyla arc (Sumatra, Indonesia) on the Australian plate. Earth Planet. Sci. Lett. 498, 348–361. doi: 10.1016/j.epsl.2018.07.001
Antonijevic, S. K., Wagner, L. S., Kumar, A., Beck, S. L., Long, M. D., Zandt, G., et al. (2015). The role of ridges in the formation and longevity of flat slabs. Nature 524, 212–215. doi: 10.1038/nature14648
Arculus, R. J., Ishizuka, O., Bogus, K. A., Gurnis, M., Hickey-Vargas, R., Aljahdali, M. H., et al. (2015). A record of spontaneous subduction initiation in the Izu–Bonin–Mariana arc. Nat. Geosci. 8, 728–733. doi: 10.1038/NGEO2515
Arredondo, K. M., and Billen, M. I. (2016). The effects of phase transitions and compositional layering in two-dimensional kinematic models of subduction. J. Geodyn. 100, 159–174. doi: 10.1016/j.jog.2016.05.009
Betts, P. G., Giles, D., Foden, J., Schaefer, B. F., Mark, G., Pankhurst, M. J., et al. (2009). Mesoproterozoic plume-modified orogenesis in eastern Precambrian Australia. Tectonics 28:TC3006. doi: 10.1029/2008TC002325
Boschman, L. M., van Hinsbergen, D. J. J., Kimbrough, D. L., Langereis, C. G., and Spakman, W. (2018). The dynamic history of 220 million years of subduction below Mexico: a correlation between slab geometry and overriding plate deformation based on geology, paleomagnetism, and seismic tomography. Geochem. Geophys. Geosyst. 19, 4649–4672. doi: 10.1029/2018GC007739
Boschman, L. M., van Hinsbergen, D. J. J., Torsvik, T. H., Spakman, W., and Pindell, J. L. (2014). Kinematic reconstruction of the Caribbean region since the Early Jurassic. Earth Sci. Rev. 138, 102–136. doi: 10.1016/j.earscirev.2014.08.007
Burchfiel, B. C., and Davis, G. A. (1975). Nature and controls of cordilleran orogenesis, western United States: extensions of an earlier synthesis. Am. J. Sci. 275, 363–396.
Burke, K. (1988). Tectonic evolution of the Caribbean. Ann. Rev. Earth Planet. Sci. 16, 201–230. doi: 10.1146/annurev.ea.16.050188.001221
Centeno-García, E. (2017). Mesozoic tectono-magmatic evolution of Mexico: an overview. Ore Geol. Rev. 81, 1035–1052. doi: 10.1016/j.oregeorev.2016.10.010
Chen, Y. W., Wu, J., and Suppe, J. (2019). Southward propagation of Nazca subduction along the Andes. Nature 565, 441–447. doi: 10.1038/s41586-018-0860-861
Chen, Z., Schellart, W. P., Strak, V., and Duarte, J. C. (2016). Does subduction-induced mantle flow drive backarc extension? Earth Planet. Sci. Lett. 441, 200–210. doi: 10.1016/j.epsl.2016.02.027
Coira, B., Davidson, J., Mpodozis, C., and Ramos, V. (1982). Tectonic and magmatic evolution of the Andes of northern Argentina and Chile. Earth Sci. Rev. 18, 303–332. doi: 10.1016/0012-8252(82)90042-3
Collins, W. J. (2003). Slab pull, mantle convection, and Pangaean assembly and dispersal. Earth Planet. Sci. Lett. 205, 225–237. doi: 10.1016/s0012-821x(02)01043-9
Copeland, P., Currie, C. A., Lawton, T. F., and Murphy, M. A. (2017). Location, location, location: the variable lifespan of the Laramide orogeny. Geology 45, 223–226. doi: 10.1130/G38810.1
DeCelles, P. G. (2004). Late Jurassic to Eocene evolution of the Cordilleran thrust belt and foreland basin system Western U.S.A. Am. J. Sci. 304, 105–168. doi: 10.2475/ajs.304.2.105
Deschamps, A., and Lallemand, S. (2002). The West Philippine Basin: an Eocene to early Oligocene back arc basin opened between two opposed subduction zones. J. Geophys. Res. 107:2322. doi: 10.1029/2001JB001706
Dickinson, W. R., and Snyder, W. S. (1978). Plate tectonics of the Laramide orogeny. Geol. Soc. Am. Mem. 151, 355–366. doi: 10.1130/mem151-p355
Dilek, Y., and Sandvol, E. (2009). “Seismic structure, crustal architecture and tectonic evolution of the Anatolian–African Plate Boundary and the Cenozoic Orogenic Belts in the Eastern Mediterranean Region,” in Ancient Orogens and Modern Analogues, eds J. B. Murphy, J. D. Keppie, and A. J. Hynes (Bath: The Geological Society of London), 127–160. doi: 10.1144/SP327.8
Domeier, M., and Torsvik, T. H. (2014). Plate tectonics in the Late Paleozoic. Geosci. Front. 5, 303–350. doi: 10.1016/j.gsf.2014.01.002
Dvorkin, J., Nur, A., Mavko, G., and Ben-Avraham, Z. (1993). Narrow subducting slabs and the origin of backarc basins. Tectonophysics 227, 63–79. doi: 10.1016/0040-1951(93)90087-z
Eagles, G., and Jokat, W. (2014). Tectonic reconstructions for paleobathymetry in Drake Passage. Tectonophysics 611, 28–50. doi: 10.1016/j.tecto.2013.11.021
Ferrari, L., López-Martínez, M., Aguirre-Díaz, G., and Carrasco-Núñez, G. (1999). Space-time patterns of Cenozoic arc volcanism in central Mexico: from the Sierra Madre Occidental to the Mexican Volcanic Belt. Geology 27, 303–306.
Flórez-Rodríguez, A. G., Schellart, W. P., and Strak, V. (2019). Impact of aseismic ridges on subduction systems: insights from analog modeling. J. Geophys. Res. Solid Earth 124, 5951–5969. doi: 10.1029/2019JB017488
Ganguly, J., Freed, A. M., and Saxena, S. K. (2009). Density profiles of oceanic slabs and surrounding mantle: integrated thermodynamic and thermal modeling, and implications for the fate of slabs at the 660 km discontinuity. Phys. Earth Planet. Inter. 172, 257–267. doi: 10.1016/j.pepi.2008.10.005
Gordon, R. G., and Jurdy, D. M. (1986). Cenozoic global plate motions. J. Geophys. Res. 91, 12389–12406. doi: 10.1029/jb091ib12p12389
Gutscher, M. A., Spakman, W., Bijwaard, H., and Engdahl, E. R. (2000). Geodynamics of flat subduction: seismicity and tomographic constraints from the Andean margin. Tectonics 19, 814–833. doi: 10.1029/1999tc001152
Hall, R. (2002). Cenozoic geological and plate tectonic evolution of SE Asia and the SW Pacific; computer-based reconstructions, model and animations. J. Asian Earth Sci. 20, 353–431. doi: 10.1016/s1367-9120(01)00069-4
Hall, R. (2012). Late Jurassic–Cenozoic reconstructions of the Indonesian region and the Indian Ocean. Tectonophysics. 570-571, 1–41. doi: 10.1016/j.tecto.2012.04.021
Hastie, A. R., Mitchell, S. F., Treloar, P. J., Kerr, A. C., Neill, I., and Barfod, D. N. (2013). Geochemical components in a Cretaceous island arc: the Th/La–(Ce/Ce∗)Nd diagram and implications for subduction initiation in the inter-American region. Lithos 162, 57–69. doi: 10.1016/j.lithos.2012.12.001
Hayes, G. P., Wald, D. J., and Johnson, R. L. (2012). Slab1.0: a three-dimensional model of global subduction zone geometries. J. Geophys. Res. 117:B01302. doi: 10.1029/2011JB008524
Henderson, L. J., Gordon, R. G., and Engebretson, D. C. (1984). Mesozoic aseismic ridges on the Farallon plate and southward migration of shallow subduction during the Laramide orogeny. Tectonics 3, 121–132. doi: 10.1029/tc003i002p00121
Hu, J., and Liu, L. (2016). Abnormal seismological and magmatic processes controlled by the tearing South American flat slabs. Earth Planet. Sci. Lett. 450, 40–51. doi: 10.1016/j.epsl.2016.06.019
Hu, J., Liu, L., Hermosillo, A., and Zhou, Q. (2016). Simulation of Late Cenozoic South American flat-slab subduction using geodynamic models with data assimilation. Earth Planet. Sci. Lett. 438, 1–13. doi: 10.1016/j.epsl.2016.01.011
Ishizuka, O., Tani, K., Reagan, M. K., Kanayama, K., Umino, S., Harigane, Y., et al. (2011). The timescales of subduction initiation and subsequent evolution of an oceanic island arc. Earth Planet. Sci. Lett. 306, 229–240. doi: 10.1016/j.epsl.2011.04.006
Jicha, B. R., Scholl, D. W., Singer, B. S., and Yogodzinski, G. M. (2006). Revised age of Aleutian Island Arc formation implies high rate of magma production. Geology 34, 661–664. doi: 10.1130/G22433.1
Kay, S. M., and Abbruzzi, J. M. (1996). Magmatic evidence for Neogene lithospheric evolution of the Central Andean “flat-slab” between 30°S and 32°S. Tectonophysics 259, 15–28. doi: 10.1016/0040-1951(96)00032-7
Kim, Y., Clayton, R. W., and Jackson, J. M. (2010). Geometry and seismic properties of the subducting cocos plate in Central Mexico. J. Geophys. Res. 115:B06310. doi: 10.1029/2009JB006942
Kincaid, C., and Olson, P. (1987). An experimental study of subduction and slab migration. J. Geophys. Res. 92, 812–813.
Kreemer, C., Holt, W. E., and Haines, A. J. (2003). An integrated global model of present-day plate motions and plate boundary deformation. Geophys. J. Inter. 154, 8–34. doi: 10.1046/j.1365-246x.2003.01917.x
Lallemand, S., Font, Y., Bijwaard, H., and Kao, H. (2001). New insights on 3-D plates interaction near Taiwan from tomography and tectonic implications. Tectonophysics 335, 229–253. doi: 10.1016/s0040-1951(01)00071-3
Lallemand, S., Heuret, A., and Boutelier, D. (2005). On the relationship between slab dip, back-arc stress, upper plate absolute motion, and crustal nature in subduction zones. Geochem. Geophys. Geosyst. 6:Q09006. doi: 10.1029/2005GC000917
Larter, R. D., Vanneste, L. E., Morris, P., and Smythe, D. K. (2003). “Structure and tectonic evolution of the South Sandwich arc,” in Intra-Oceanic Subduction Systems: Tectonic and Magmatic Processes, eds R. D. Larter, and P. T. Leat (Bath: The Geological Society of London), 255–284. doi: 10.1144/gsl.sp.2003.219.01.13
LeBrun, J. F., Lamarche, G., and Collot, J. Y. (2003). Subduction initiation at a strike-slip plate boundary: the Cenozoic Pacific-Australian plate boundary, south of New Zealand. J. Geophys. Res. 108:2453. doi: 10.1029/2002JB002041
Li, C. F., Xu, X., Lin, J., Sun, Z., Zhu, J., Yao, Y., et al. (2014). Ages and magnetic structures of the South China Sea constrained by deep tow magnetic surveys and IODP Expedition 349. Geochem. Geophys. Geosyst. 15, 4958–4983. doi: 10.1002/2014GC005567
Li, Z. X., and Li, X. H. (2007). Formation of the 1300-km-wide intracontinental orogen and postorogenic magmatic province in Mesozoic South China: a flat-slab subduction model. Geology 35, 179–182. doi: 10.1130/G23193A.1
Liu, L., Gurnis, M., Seton, M., Saleeby, J., Muller, R. D., and Jackson, J. M. (2010). The role of oceanic plateau subduction in the Laramide orogeny. Nat. Geosci. 3, 353–357. doi: 10.1038/NGEO829
Liu, S., and Currie, C. A. (2016). Farallon plate dynamics prior to the Laramide orogeny: numerical models of flat subduction. Tectonophysics 666, 33–47. doi: 10.1016/j.tecto.2015.10.010
Lonergan, L., and White, N. (1997). Origin of the Betic-Rif mountain belt. Tectonics 16, 504–522. doi: 10.1029/96tc03937
Lonsdale, P. (2005). Creation of the Cocos and Nazca plates by fission of the Farallon plate. Tectonophysics 404, 237–264. doi: 10.1016/j.tecto.2005.05.011
Mackaman-Lofland, C., Horton, B. K., Fuentes, F., Constenius, K. N., and Stockli, D. F. (2019). Mesozoic to Cenozoic retroarc basin evolution during changes in tectonic regime, southern Central Andes (31–33°S): insights from zircon U-Pb geochronology. J. South Am. Earth Sci. 89, 299–318. doi: 10.1016/j.jsames.2018.10.004
Mackwell, S. J., Bai, Q., and Kohlstedt, D. L. (1990). Rheology of olivine and the strength of the lithosphere. Geophys. Res. Lett. 17, 9–12. doi: 10.1029/gl017i001p00009
Maloney, K. T., Clarke, G. L., Klepeis, K. A., and Quevedo, L. (2013). The Late Jurassic to present evolution of the Andean margin: drivers and the geological record. Tectonics 32, 1049–1065. doi: 10.1002/tect.20067
Manea, V. C., Manea, M., Ferrari, L., Orozco-Esquivel, T., Valenzuela, R. W., Husker, A., et al. (2017). A review of the geodynamic evolution of flat slab subduction in Mexico, Peru, and Chile. Tectonophysics 695, 27–52. doi: 10.1016/j.tecto.2016.11.037
Manea, V. C., Pérez-Gussinyé, M., and Manea, M. (2012). Chilean flat slab subduction controlled by overriding plate thickness and trench rollback. Geology 40, 35–38. doi: 10.1130/G32543.1
Meffre, S., Falloon, T. J., Crawford, T. J., Hoernle, K., Hauff, F., Duncan, R. A., et al. (2012). Basalts erupted along the Tongan fore arc during subduction initiation: evidence from geochronology of dredged rocks from the Tonga fore arc and trench. Geochem. Geophys. Geosyst. 13:Q12003. doi: 10.1029/2012GC004335
Mériaux, C. A., Mériaux, A. S., Schellart, W. P., Duarte, J. C., Duarte, S. S., and Chen, Z. (2016). Mantle plumes in the vicinity of subduction zones. Earth Planet. Sci. Lett. 454, 166–177. doi: 10.1016/j.epsl.2016.09.001
Morán-Zenteno, D. J., Tolson, G., Martínez-Serrano, R. G., Martiny, B., Schaaf, P., Silva-Romo, G., et al. (1999). Tertiary arc-magmatism of the Sierra Madre del Sur, Mexico, and its transition to the volcanic activity of the trans-Mexican Volcanic Belt. J. South Am. Earth Sci. 12, 513–535. doi: 10.1016/s0895-9811(99)00036-x
Moresi, L., Quenette, S., Lemiale, V., Mériaux, C., Appelbe, B., and Mühlhaus, H. B. (2007). Computational approaches to studying non-linear dynamics of the crust and mantle. Phys. Earth Planet. Inter. 163, 69–82. doi: 10.1016/j.pepi.2007.06.009
Müller, R. D., Seton, M., Zahirovic, S., Williams, S. E., Matthews, K. J., Wright, N. M., et al. (2016). Ocean basin evolution and global-scale plate reorganization events since Pangea breakup. Ann. Rev. Earth Planet. Sci. 44, 107–138. doi: 10.1146/annurev-earth-060115-12211
O’Driscoll, L. J., Richards, M. A., and Humphreys, E. D. (2012). Nazca–South America interactions and the late Eocene–late Oligocene flat-slab episode in the Central Andes. Tectonics 31:TC2013. doi: 10.1029/2011TC003036
Ohta, Y., Freymueller, J. T., Hreinsdóttir, S., and Suito, H. (2006). A large slow slip event and the depth of the seismogenic zone in the south central Alaska subduction zone. Earth Planet. Sci. Lett. 247, 108–116. doi: 10.1016/j.epsl.2006.05.013
Phillips, K., and Clayton, R. W. (2014). Structure of the subduction transition region from seismic array data in southern Peru. Geophys. J. Inter. 196, 1889–1905. doi: 10.1093/gji/ggt504
Pilger, R. H. (1981). Plate reconstructions, aseismic ridges, and low-angle subduction beneath the Andes. Geol. Soc. Am. Bull. 92, 448–456.
Pindell, J., Kennan, L., Stanek, K. P., Maresch, W. V., and Draper, G. (2006). Foundations of Gulf of Mexico and Caribbean evolution: eight controversies resolved. Geol. Acta 4, 303–341.
Ramos, V. A., and Folguera, A. (2009). “Andean flat-slab subduction through time,” in Ancient Orogens and Modern Analogues, eds J. B. Murphy, J. D. Keppie, and A. J. Hynes (Bath: The Geological Society of London), 31–54. doi: 10.1144/SP327.3
Ribe, N. M. (2010). Bending mechanics and mode selection in free subduction: a thin-sheet analysis. Geophys. J. Inter. 180, 559–576. doi: 10.1111/j.1365-246X.2009.04460.x
Richards, S., Holm, R., and Barber, G. (2011). When slabs collide: a tectonic assessment of deep earthquakes in the Tonga-Vanuatu region. Geology 39, 787–790. doi: 10.1130/G31937.1
Rodríguez-González, J., Negredo, A. M., and Billen, M. I. (2012). The role of the overriding plate thermal state on slab dip variability and on the occurrence of flat subduction. Geochem. Geophys. Geosyst. 13:Q01002. doi: 10.1029/2011GC003859
Rosenbaum, G., Giles, D., Saxon, M., Betts, P. G., Weinberg, R. F., and Duboz, C. (2005). Subduction of the Nazca Ridge and the Inca Plateau: insights into the formation of ore deposits in Peru. Earth Planet. Sci. Lett. 239, 18–32. doi: 10.1016/j.epsl.2005.08.003
Rosenbaum, G., Lister, G. S., and Duboz, C. (2002). Reconstruction of the tectonic evolution of the Western Mediterranean since the Oligocene. J. Virt. Explor. 8, 107–130.
Sarma, D. S., Jafri, S. H., Fletcher, I. R., and McNaughton, N. J. (2010). Constraints on the tectonic setting of the Andaman ophiolites, Bay of Bengal, India, from SHRIMP U-Pb zircon geochronology of plagiogranite. J. Geol. 118, 691–697. doi: 10.1086/656354
Schellart, W. P. (2008). Kinematics and flow patterns in deep mantle and upper mantle subduction models: influence of the mantle depth and slab to mantle viscosity ratio. Geochem. Geophys. Geosyst. 9:Q03014. doi: 10.1029/2007GC001656
Schellart, W. P. (2017). Andean mountain building and magmatic arc migration driven by subduction-induced whole mantle flow. Nat. Commun. 8:2010. doi: 10.1038/s41467-017-01847-z
Schellart, W. P., Freeman, J., Stegman, D. R., Moresi, L., and May, D. (2007). Evolution and diversity of subduction zones controlled by slab width. Nature 446, 308–311. doi: 10.1038/nature05615
Schellart, W. P., Jessell, M. W., and Lister, G. S. (2003). Asymmetric deformation in the backarc region of the Kuril arc, northwest Pacific: new insights from analogue modeling. Tectonics 22:1047. doi: 10.1029/2002TC001473
Schellart, W. P., Lister, G. S., and Toy, V. G. (2006). A Late Cretaceous and Cenozoic reconstruction of the Southwest Pacific region: tectonics controlled by subduction and slab rollback processes. Earth Sci. Rev. 76, 191–233. doi: 10.1016/j.earscirev.2006.01.002
Schellart, W. P., and Spakman, W. (2012). Mantle constraints on the plate tectonic evolution of the Tonga-Kermadec-Hikurangi subduction zone and the South Fiji Basin. Austr. J. Earth Sci. 59, 933–952. doi: 10.1080/08120099.2012.679692
Schellart, W. P., Stegman, D. R., Farrington, R. J., Freeman, J., and Moresi, L. (2010). Cenozoic tectonics of western North America controlled by evolving width of Farallon slab. Science 329, 316–319. doi: 10.1126/science.1190366
Schepers, G., van Hinsbergen, D. J. J., Spakman, W., Kosters, M. E., Boschman, L. M., and McQuarrie, N. (2017). South-American plate advance and forced Andean trench retreat as drivers for transient flat subduction episodes. Nat. Commun. 8:15249. doi: 10.1038/ncomms15249
Scheuber, E., Bogdanic, T., Jensen, A., and Reutter, K. J. (1994). “Tectonic development of the North Chilean Andes in relation to plate convergence and magmatism since the Jurassic,” in Tectonics of the Southern Central Andes, eds K.-J. Reutter, E. Scheuber, and P. J. Wigger (Berlin: Springer), 121–139. doi: 10.1007/978-3-642-77353-2_9
Scholl, D. W., Vallier, T. L., and Stevenson, A. J. (1986). Terrane accretion, production, and continental growth: a perspective based on the origin and tectonic fate of the Aleutian-Bering Sea region. Geology 14, 43–47.
Sdrolias, M., Roest, W. R., and Muller, R. D. (2004). An expression of Philippine Sea plate rotation: the Parece Vela and Shikoku Basins. Tectonophysics 394, 69–86. doi: 10.1016/j.tecto.2004.07.061
Séranne, M. (1999). “The gulf of Lion continental margin (NW Mediterranean) revisited by IBS: an overview,” in The Mediterranean Basins: Tertiary Extension Within the Alpine Orogen, eds B. Durand, L. Jolivet, F. Horváth, and M. Séranne (London: Geological Society), 15–36. doi: 10.1144/gsl.sp.1999.156.01.03
Seton, M., Müller, R. D., Zahirovic, S., Gaina, C., Torsvik, T., Shephard, G., et al. (2012). Global continental and ocean basin reconstructions since 200 Ma. Earth Sci. Rev. 113, 212–270. doi: 10.1016/j.earscirev.2012.03.002
Skinner, S. M., and Clayton, R. W. (2011). An evaluation of proposed mechanisms of slab flattening in central Mexico. Pure Appl. Geophys. 168, 1461–1474. doi: 10.1007/s00024-010-0200-203
Skinner, S. M., and Clayton, R. W. (2013). The lack of correlation between flat slabs and bathymetric impactors in South America. Earth Planet. Sci. Lett. 37, 1–5. doi: 10.1016/j.epsl.2013.04.013
Spakman, W., and Hall, R. (2010). Surface deformation and slab–mantle interaction during Banda arc subduction rollback. Nat. Geosci. 3, 562–566. doi: 10.1038/NGEO917
Stadler, G., Gurnis, M., Burstedde, C., Wilcox, L. C., Alisic, L., and Ghattas, O. (2010). The dynamics of plate tectonics and mantle flow: from local to global scales. Science 329, 1033–1038. doi: 10.1126/science.1191223
Stegman, D. R., Freeman, J., Schellart, W. P., Moresi, L., and May, D. (2006). Influence of trench width on subduction hinge retreat rates in 3-D models of slab rollback. Geochem. Geophys. Geosyst. 7:Q03012. doi: 10.1029/2005GC001056
Taramón, J. M., Rodríguez-González, J., Negredo, A. M., and Billen, M. I. (2015). Influence of cratonic lithosphere on the formation and evolution of flat slabs: insights from 3-D time-dependent modeling. Geochem. Geophys. Geosyst. 16, 2933–2948. doi: 10.1002/2015GC005940
Torii, Y., and Yoshioka, S. (2007). Physical conditions producing slab stagnation: constraints of the Clapeyron slope, mantle viscosity, trench retreat, and dip angles. Tectonophysics 445, 200–209. doi: 10.1016/j.tecto.2007.08.003
Tovish, A., Schubert, G., and Luyendyk, B. P. (1978). Mantle flow pressure and the angle of subduction: non-Newtonian corner flows. J. Geophys. Res. 83, 5892–5898. doi: 10.1029/jb083ib12p05892
van de Lagemaat, S. H. A., van Hinsbergen, D. J. J., Boschman, L. M., Kamp, P. J. J., and Spakman, W. (2018). Southwest Pacific absolute plate kinematic reconstruction reveals major Cenozoic Tonga-Kermadec slab dragging. Tectonics 37, 2647–2674. doi: 10.1029/2017TC004901
van der Meer, D. G., van Hinsbergen, D. J. J., and Spakman, W. (2018). Atlas of the underworld: slab remnants in the mantle, their sinking history, and a new outlook on lower mantle viscosity. Tectonophysics 723, 309–448. doi: 10.1016/j.tecto.2017.10.004
van Hinsbergen, D. J. J., Hafkenscheid, E., Spakman, W., Meulenkamp, J. E., and Wortel, R. (2005). Nappe stacking resulting from subduction of oceanic and continental lithosphere below Greece. Geology 33, 325–328.
van Hinsbergen, D. J. J., Vissers, R. L. M., and Spakman, W. (2014). Origin and consequences of Western Mediterranean subduction, rollback, and slab segmentation. Tectonics 33, 393–419. doi: 10.1002/tect.20125
van Hunen, J., Van Den Berg, A. P., and Vlaar, N. J. (2002). On the role of subducting oceanic plateaus in the development of shallow flat subduction. Tectonophysics 352, 317–333. doi: 10.1016/s0040-1951(02)00263-9
van Hunen, J., van den Berg, A. P., and Vlaar, N. J. (2004). Various mechanisms to induce present-day shallow flat subduction and implications for the younger earth: a numerical parameter study. Phys. Earth Planet. Inter. 146, 179–194. doi: 10.1016/j.pepi.2003.07.027
Vásquez, P., Glodny, J., Franz, G., Frei, D., and Romer, R. L. (2011). Early Mesozoic plutonism of the Cordillera de la Costa (34°–37°S), Chile: constraints on the onset of the Andean orogeny. J. Geol. 119, 159–184. doi: 10.1086/658296
Vérard, C., Flores, K., and Stampfli, G. (2012). Geodynamic reconstructions of the South America–Antarctica plate system. J. Geodyn. 53, 43–60. doi: 10.1016/j.jog.2011.07.007
Appendix
Justification for Data Selection and Uncertainties Associated With the Data
There are uncertainties associated with the data presented in Tables 1, 2 that are used as a basis for Figure 2. For the present-day slab width values listed in Table 2, the uncertainties are relatively small, in general less than 5–10%, which will therefore have no discernable impact on the data distribution as shown in Figure 2A. Uncertainties with estimated slab width values for the geological past will be larger and are generally hard to quantify, as they mostly result from differences in plate tectonic configurations in the published literature. For the relatively narrow subduction zones listed in Table 2 (numbers 6–14) the uncertainties can be up to several hundred kilometers, but this will have no discernable impact on the general distribution of data points in Figure 2A. For the slab width data of the other subduction zones, which have a moderate to very large width (numbers 1–5 and 15–22) there are larger uncertainties. These subduction zones generally also have a larger associated uncertainty in subduction zone age, or a subduction zone age that is more controversial. Below, each of these subduction zones will be briefly discussed and a justification for the choice of subduction zone age and width is provided.
South American Subduction Zone (Points 1a-f and 3 in Figure 2 and Tables 1, 2)
The age of the South American subduction zone has long been interpreted as very old, around 200 Ma, and thus dating from the Late Triassic/Early Jurassic (e.g., Coira et al., 1982; Vásquez et al., 2011; Maloney et al., 2013). This old age has very recently been contested by Chen et al. (2019), who argue for an 80 Ma subduction zone in the north, becoming progressively younger southward. The young age for the South American subduction zone proposed by Chen et al. (2019) is in contradiction with geological data showing a continuous arc magmatic record from the Jurassic to the present (∼200–0 Ma), such as reported for northern Chile (Scheuber et al., 1994). It is also in contradiction with seismic tomographic data presented in van der Meer et al. (2018), which show a continuous slab from the trench down to 2400 ± 200 km depth in the Peru segment of the South American subduction zone, which they interpreted as subduction being active from 200–173 Ma (Jurassic) to the present. Recent work on sedimentary systems in the retroarc and arc region in the southern Central Andes also imply continuous subduction activity since the Late Triassic/Early Jurassic (e.g., Mackaman-Lofland et al., 2019). Based on these different lines of evidence, I adopt an old age (∼200 Ma) for the South American subduction zone.
Tectonic reconstructions show that at ∼200 Ma the entire western margin of the South American continent was an east-dipping subduction zone and generally also show it to be continuous with the Mexico-Central America segment (e.g., Seton et al., 2012). This gives a subduction zone width of the order 11,000 ± 1000 km.
For data points 1a, 1b and 1c, the flat slab formed at ∼4, ∼8, and ∼20 Ma and so formed when the Nazca plate had already separated from the Cocos plate, which occurred at ∼23 Ma (Lonsdale, 2005). Thus the width of the subduction zone was roughly the north-south length of the western margin of South America, which is of the order 7000 km. The flat slab for data point 3 formed at ∼35 Ma, so before Nazca-Cocos separation, and so the slab width at that time was roughly the sum of the South American subduction zone width and the width of the Baja California-Mexico-Central America segment.
Mexico-Central America Subduction Zone (Points 2a and 2b in Figure 2 and Tables 1, 2)
The Mexican flat slab formed at ∼30–25 Ma (Ferrari et al., 1999; Morán-Zenteno et al., 1999; Kim et al., 2010), and the Cocos spreading ridge separating the Cocos plate from the Nazca plate formed only at ∼23 Ma (Lonsdale, 2005). Thus, the Nazca + Cocos single plate subducted eastward as one very large slab, most likely along one continuous subduction zone at 30–25 Ma that would be ∼10,500–12,000 km wide (some 7000 km for the South American subduction segment and some 3000–5000 km for the Mexico-Central America segment). This is consistent with tectonic reconstructions (e.g., Gordon and Jurdy, 1986; Seton et al., 2012; Müller et al., 2016).
Recent work indicates that at least the Mexico-Central America subduction segment has been active for a very long time. Indeed, according to Boschman et al. (2018) there is a continuous record of subduction since 220 Ma along the Mexico-Central America subduction zone, as indicated by a continuous slab geometry from the surface down to 2500–2800 km depth in seismic tomography models. According to van der Meer et al. (2018) this old subduction zone had a large lateral extent, stretching from the Cocos ridge in the south to the Mendocino triple junction in the north (their page 351), which would imply a subduction zone extent of ∼5800 km. This width is used as a lower limit of the slab width of the subduction zone during its formation. As an upper limit the reconstruction of Seton et al. (2012) is used, which shows a continuous subduction zone from Mexico in the north to Patagonia in the south at 200 Ma, which would thus imply an ∼11,000 km wide subduction zone at a time close to its inception.
Another reconstruction, that of Müller et al. (2016), shows a different tectonic setting in the Mexico-Central America-Caribbean region with a subduction flip and ∼west-dipping subduction at ∼130–90 Ma, which would not be consistent with the current work and that of Seton et al. (2012). The recent work of Boschman et al. (2018), however, can be used to refute the proposed tectonic scenario from Müller et al. (2016), as it shows a long and continuous subducted slab, from the surface down to ∼2500–2800 km depth, which implies long-lived continuous east-dipping subduction along the Central America-Mexico subduction zone.
South China Subduction Zone (Point 4 in Figure 2 and Table 1)
The age of inception and the width of the South China subduction zone have been derived from the reconstruction papers of Collins (2003) and Domeier and Torsvik (2014). It is clear that there are large uncertainties associated with the estimated age and width, because we are concerned with subduction that was active in the Paleozoic and Triassic, and flat slab subduction that started in the Triassic (Li and Li, 2007). Despite these large uncertainties, the results are consistent with the conceptual model proposed in the paper (Figure 2A).
Farallon Subduction Zone (Points 5 and 15 in Figure 2 and Tables 1, 2)
The Farallon subduction zone is generally thought to have been a very large, east-dipping subduction zone along the west coast of the Americas that subducted the Farallon oceanic plate during part of the Mesozoic and the Early Cenozoic (Burchfiel and Davis, 1975; Gordon and Jurdy, 1986; DeCelles, 2004). Earlier work indicates that the subduction zone is very old and formed in the Triassic or Jurassic (160–210 Ma) (Burchfiel and Davis, 1975; DeCelles, 2004), and relatively recent reconstructions imply a comparably old age (e.g., Seton et al., 2012). Such reconstructions also imply a very large subduction zone extent during subduction zone infancy exceeding 10,000 km (Seton et al., 2012). Only at ∼45–30 Ma, significantly after the inception of Farallon flat slab formation at ∼85–65 Ma (Henderson et al., 1984; Liu et al., 2010; Copeland et al., 2017), do reconstructions show that the Farallon plate, slab and subduction zone segment due to the formation of slab windows (Gordon and Jurdy, 1986; Schellart et al., 2010), resulting in the formation of a relatively small Farallon/Juan de Fuca plate subducting along the Cascadia subduction zone and a much larger Nazca-Cocos plate.
Nankai-Ryukyu Subduction Zone (Point 16 in Figure 2 and Table 2)
The Nankai-Ryukyu subduction zone likely formed in the earliest Miocene (∼18 Ma) through subduction of the Philippine Sea plate below Eurasia (Lallemand et al., 2001). When the subduction zone formed, it was initially narrower (∼1600 km) and from ∼8 Ma it grew southwestward to include the southern Ryukyu subduction segment (Lallemand et al., 2001).
Lesser Antilles-Puerto Rico Subduction Zone (Point 17 in Figure 2 and Table 2)
The age and the subduction zone width at the time of subduction zone formation of the Lesser Antilles subduction zone are somewhat controversial. The minimum age of 45 Ma is based on the oldest ages of Lesser Antilles arc magmatism (Burke, 1988). There is a ∼50 Ma age based on a reconstruction of Boschman et al. (2014), a 71–94 Ma age based on reported ages of arc magmatism from Hispaniola (Hastie et al., 2013), and a ∼120 Ma age as argued and shown in a reconstruction in Pindell et al. (2006). van der Meer et al. (2018) estimate the age using tomography and geological data and propose subduction initiation at 45–55 Ma for the lesser Antilles. Estimates of subduction zone width at subduction initiation vary significantly, as shown in tectonic reconstructions, including ∼1400 km (Boschman et al., 2014) and ∼3300 km (Pindell et al., 2006). Considering the controversy, the average is taken for both the subduction zone age and width.
Tonga-Kermadec-Hikurangi Subduction Zone (Point 18 in Figure 2 and Table 2)
The subduction zone age and the width at the time of the Tonga-Kermadec-Hikurangi subduction zone formation are somewhat controversial as well. The minimum age is generally based on the oldest ages of fore-arc magmatism in the Tonga arc (49–51 Ma) (Meffre et al., 2012) and reconstructions that adhere to this relatively young formation age imply that the subduction zone width during initiation was relatively small (1800 ± 800 km) (Meffre et al., 2012). More recently, an even younger minimum age has been suggested for the formation of the subduction zone (∼30 Ma) based on the termination of the New Caledonia subduction zone around that time (van de Lagemaat et al., 2018). This very young age is not likely, though, as backarc spreading in the North Loyalty Basin and South Fiji Basin was already active before 30 Ma. Reconstructions from Schellart et al. (2006) show a subduction zone that was already active at 90 Ma, as implied by convergence between the Australian plate and the Pacific plate, with a large width (∼5000 km) that incorporates the Tonga-Kermadec-Hikurangi segment and the Vitiaz-Solomon segment. Due to the uncertainty and controversy regarding the slab width at subduction initiation and time of subduction initiation, an average between that of Meffre et al. (2012) and Schellart et al. (2006) has been taken.
Aleutians-Alaska Subduction Zone (Point 19 in Figure 2 and Table 2)
It is generally agreed upon that the Aleutians-Alaska subduction zone formed sometime in the Early Cenozoic as based on ages of the oldest arc magmatic rocks in the Aleutian Islands, with an older age of ∼55 Ma suggested earlier (Scholl et al., 1986) and a younger age (∼46 Ma) suggested more recently (Jicha et al., 2006). The younger age is here taken as the best estimate of the true age. The Aleutians segment is thought to have formed in an intra-oceanic setting and was limited in the west by the Shirshov Ridge, after which the subduction zone grew westward to form a cusp with the Kuril-Kamchatka arc (Schellart et al., 2003). Hence, the subduction zone had a smaller width (by ∼500 km) at subduction initiation than its present width.
Melanesia Subduction Zone (Point 20 in Figure 2 and Table 2)
It is generally agreed upon that the Melanesia subduction zone is very young and formed in the Late Cenozoic, around 10–15 Ma (Hall, 2002; Schellart et al., 2006; Richards et al., 2011). In the short time since 15 Ma it has grown to a relatively wide subduction zone with a width of ∼4400 km (Schellart et al., 2007).
Northwest Pacific Subduction Zone (Points 21, 21a, and 21b in Figure 2 and Table 2)
The width of the Northwest Pacific subduction zone, or Kamchatka-Kuril-Japan-Izu-Bonin-Mariana subduction zone, is very large, ∼6550 km, but it formed rather recently due to the conjoining of the Izu-Bonin-Mariana segment and the Kamchatka-Kuril-Japan segment. The former segment formed around 52 Ma, as implied by dated forearc magmatic rocks (Ishizuka et al., 2011), while the latter segment formed at ∼60 Ma, after accretion of the Okhotsk terrane to Eurasia (Schellart et al., 2003). A maximum age of subduction zone formation is thus 52 Ma (assuming that the two segments conjoined immediately, which is not very likely due to the difference in strike of the two segments at that time), while a minimum age of subduction zone formation is based on a reconstruction of Sdrolias et al. (2004), who show that the two segments connected at ∼25 Ma.
Sunda Subduction Zone (Points 22, 22a, and 22b in Figure 2 and Table 2)
The width of the slab subducting at the Sunda subduction zone is very large, ∼7850 km, as it includes the Burma-Andaman segment, the Sumatra-Java-Bali-Nusa segment and the Timor-Banda segment (Schellart et al., 2007). These individual segments, however, formed at different times. The Andaman subduction segment likely started around 94 Ma based on supra-subduction-zone ophiolites of this age, as dated by Sarma et al. (2010) and interpreted as such by Advokaat et al. (2018), but this subduction segment is only ∼1400 km wide (∼3150 km if one includes the Burma segment). The central segment of the Sunda subduction zone (Sumatra-Java-Bali-Nusa), which is ∼3300 km wide, formed at ∼50–45 Ma (Hall, 2012), while the easternmost segment (Banda segment), which is ∼1400 km wide, formed only at ∼15 Ma (Spakman and Hall, 2010). So from ∼94–50 Ma the slab was ∼3150 km wide, from ∼50–15 Ma it was ∼6450 km wide, and from ∼15–0 Ma it was ∼7850 km wide. As such, it acquired its large width only very recently.
Keywords: subduction, flat slab, suction, mantle wedge, slab dip, geodynamics, numerical model, aseismic ridge
Citation: Schellart WP (2020) Control of Subduction Zone Age and Size on Flat Slab Subduction. Front. Earth Sci. 8:26. doi: 10.3389/feart.2020.00026
Received: 16 October 2019; Accepted: 27 January 2020;
Published: 19 February 2020.
Edited by:
Jeroen Van Hunen, Durham University, United KingdomReviewed by:
Claire Currie, University of Alberta, CanadaBernhard Maximilian Steinberger, German Research Centre for Geosciences, Helmholtz Centre Potsdam, Germany
Copyright © 2020 Schellart. This is an open-access article distributed under the terms of the Creative Commons Attribution License (CC BY). The use, distribution or reproduction in other forums is permitted, provided the original author(s) and the copyright owner(s) are credited and that the original publication in this journal is cited, in accordance with accepted academic practice. No use, distribution or reproduction is permitted which does not comply with these terms.
*Correspondence: Wouter Pieter Schellart, w.p.schellart@vu.nl
†ORCID: Wouter Pieter Schellart, orcid.org/0000-0002-9802-0143