Mass Balance and Climate History of a High-Altitude Glacier, Desert Andes of Chile
 Christophe Kinnard1*
  Patrick Ginot2
  Arzhan Surazakov3 Shelley MacDonell3
  Lindsey Nicholson4
  Nicolas Patris5
  Antoine Rabatel2
  Andres Rivera6
  Francisco A. Squeo3,7
- 1Département des Sciences de l’Environnement, Canada Research Chair in Cryosphere Hydrology, Université du Québec à Trois-Rivières, Trois-Rivières, QC, Canada
- 2Univ-Grenoble-Alpes, IRD, CNRS, Grenoble-INP, Institut des Géosciences de l’Environnement, Grenoble, France
- 3Centro de Estudios Avanzados en Zonas Áridas, La Serena, Chile
- 4Institute of Atmospheric and Cryospheric Sciences, Innsbruck, Austria
- 5HydroSciences Montpellier (HSM), IRD, CNRS, Université de Montpellier, Montpellier, France
- 6Departamento de Geografía, Universidad de Chile, Santiago, Chile
- 7Instituto de Ecología y Biodiversidad, Universidad de La Serena, La Serena, Chile
Glaciers in the dry Chilean Andes provide important ecological services, yet their mass balance response to past and ongoing climate change has been little studied. This study examines the recent (2002–2015), historical (1955–2005), and past (<1900) mass balance history of the high-altitude Guanaco Glacier (29.34°S, >5000 m), using a combination of glaciological, geodetic, and ice core observations. Mass balance has been predominantly negative since 2002. Analysis of mass balance and meteorological data since 2002 suggests that mass balance is currently mostly sensitive to precipitation variations, while low temperatures, aridity and high solar radiation and wind speeds cause large sublimation losses and limited melting. Mass balance reconstructed by geodetic methods shows that Guanaco Glacier has been losing mass since at least 1955, and that mass loss has increased over time until present. An ice core recovered from the deepest part of the glacier in 2008 revealed that the glacier is cold-based with a −5.5°C basal temperature and a warm reversal of the temperature profile above 60-m depth attributed to the recent atmospheric warming trend. Detailed stratigraphic and stable isotope analyses of the upper 20 m of the core revealed seasonal cycles in the δ18O and δ2H records with periods varying between 0.5 and 3 m. w.e. a–1. Deuterium excess values larger than 10‰ suggest limited post-depositional sublimation, while the presence of numerous refrozen ice layers indicate significant summer melt. Tritium concentration in the upper 20 m of the core was very low, while 210Pb was undetected, indicating that the glacier surface in 2008 was at least 100 years old. Taken together, these results suggest that Guanaco Glacier formed under drastically different climate conditions than today, with humid conditions causing high accumulation rates, reduced sublimation and increased melting. Reconstruction of mass balance based on correlations with precipitation and streamflow records show periods of sustained mass gain in the early 20th century and the 1980s, separated by periods of mass loss. The southern migration of the South Pacific Subtropical High over the course of the 20th and 21st centuries is proposed as the main mechanism explaining the progressive precipitation starvation of glaciers in this area.
Introduction
Glaciers are important freshwater sources and key regulators of the water cycle (Fountain and Tangborn, 1985; Jansson et al., 2003). This is especially true in arid and semi-arid climates where water availability is limited due to low precipitation rates. In addition, the bulk of surface runoff and groundwater recharge is generated in the high mountains, far from the coastal population centers and cultivated lowland valleys where the water is needed (e.g., Viviroli et al., 2007). As snow and ice melt play such an important role in the hydrology of arid zones, these regions are considered very sensitive to future temperature changes (Barnett et al., 2005). This situation is striking in the Norte-Chico region (26°S–32°S, Figure 1), which is the southernmost region of the Desert Andes of Chile (18–32°S, Barcaza et al., 2017). The semi-arid climate of Norte-Chico, combined with the marked climate variability arising from coupled atmosphere-ocean oscillations [El Niño Southern Oscillation (ENSO), Madden-Julian Oscillation (MJO)], induces a hydric stress on populations (Montecinos and Aceituno, 2003; Garreaud et al., 2009; Juliá et al., 2012). Nonetheless, and owing to efficient irrigation techniques, a productive agriculture sector exists and constitutes the economic pillar of the region. The existence and development of several mining projects near the headwaters of the main transverse valleys in the region also contribute to the reginal economy but raises environmental and resource equity disputes (Oyarzún and Oyarzún, 2011; Kronenberg, 2013). There is a strong concern that the observed (Falvey and Garreaud, 2009) and predicted (Cabré et al., 2016; Bozkurt et al., 2017) warming trend in the high Andes together with the apparent decreasing precipitation over recent decades (Fiebig-Wittmaack et al., 2012; Quintana and Aceituno, 2012; Schulz et al., 2012) could result in aggravated water stress in the Norte-Chico region. This in turn could exacerbate inter-sector conflicts about water usage and limit future development (Young et al., 2010; Valdés-Pineda et al., 2014).
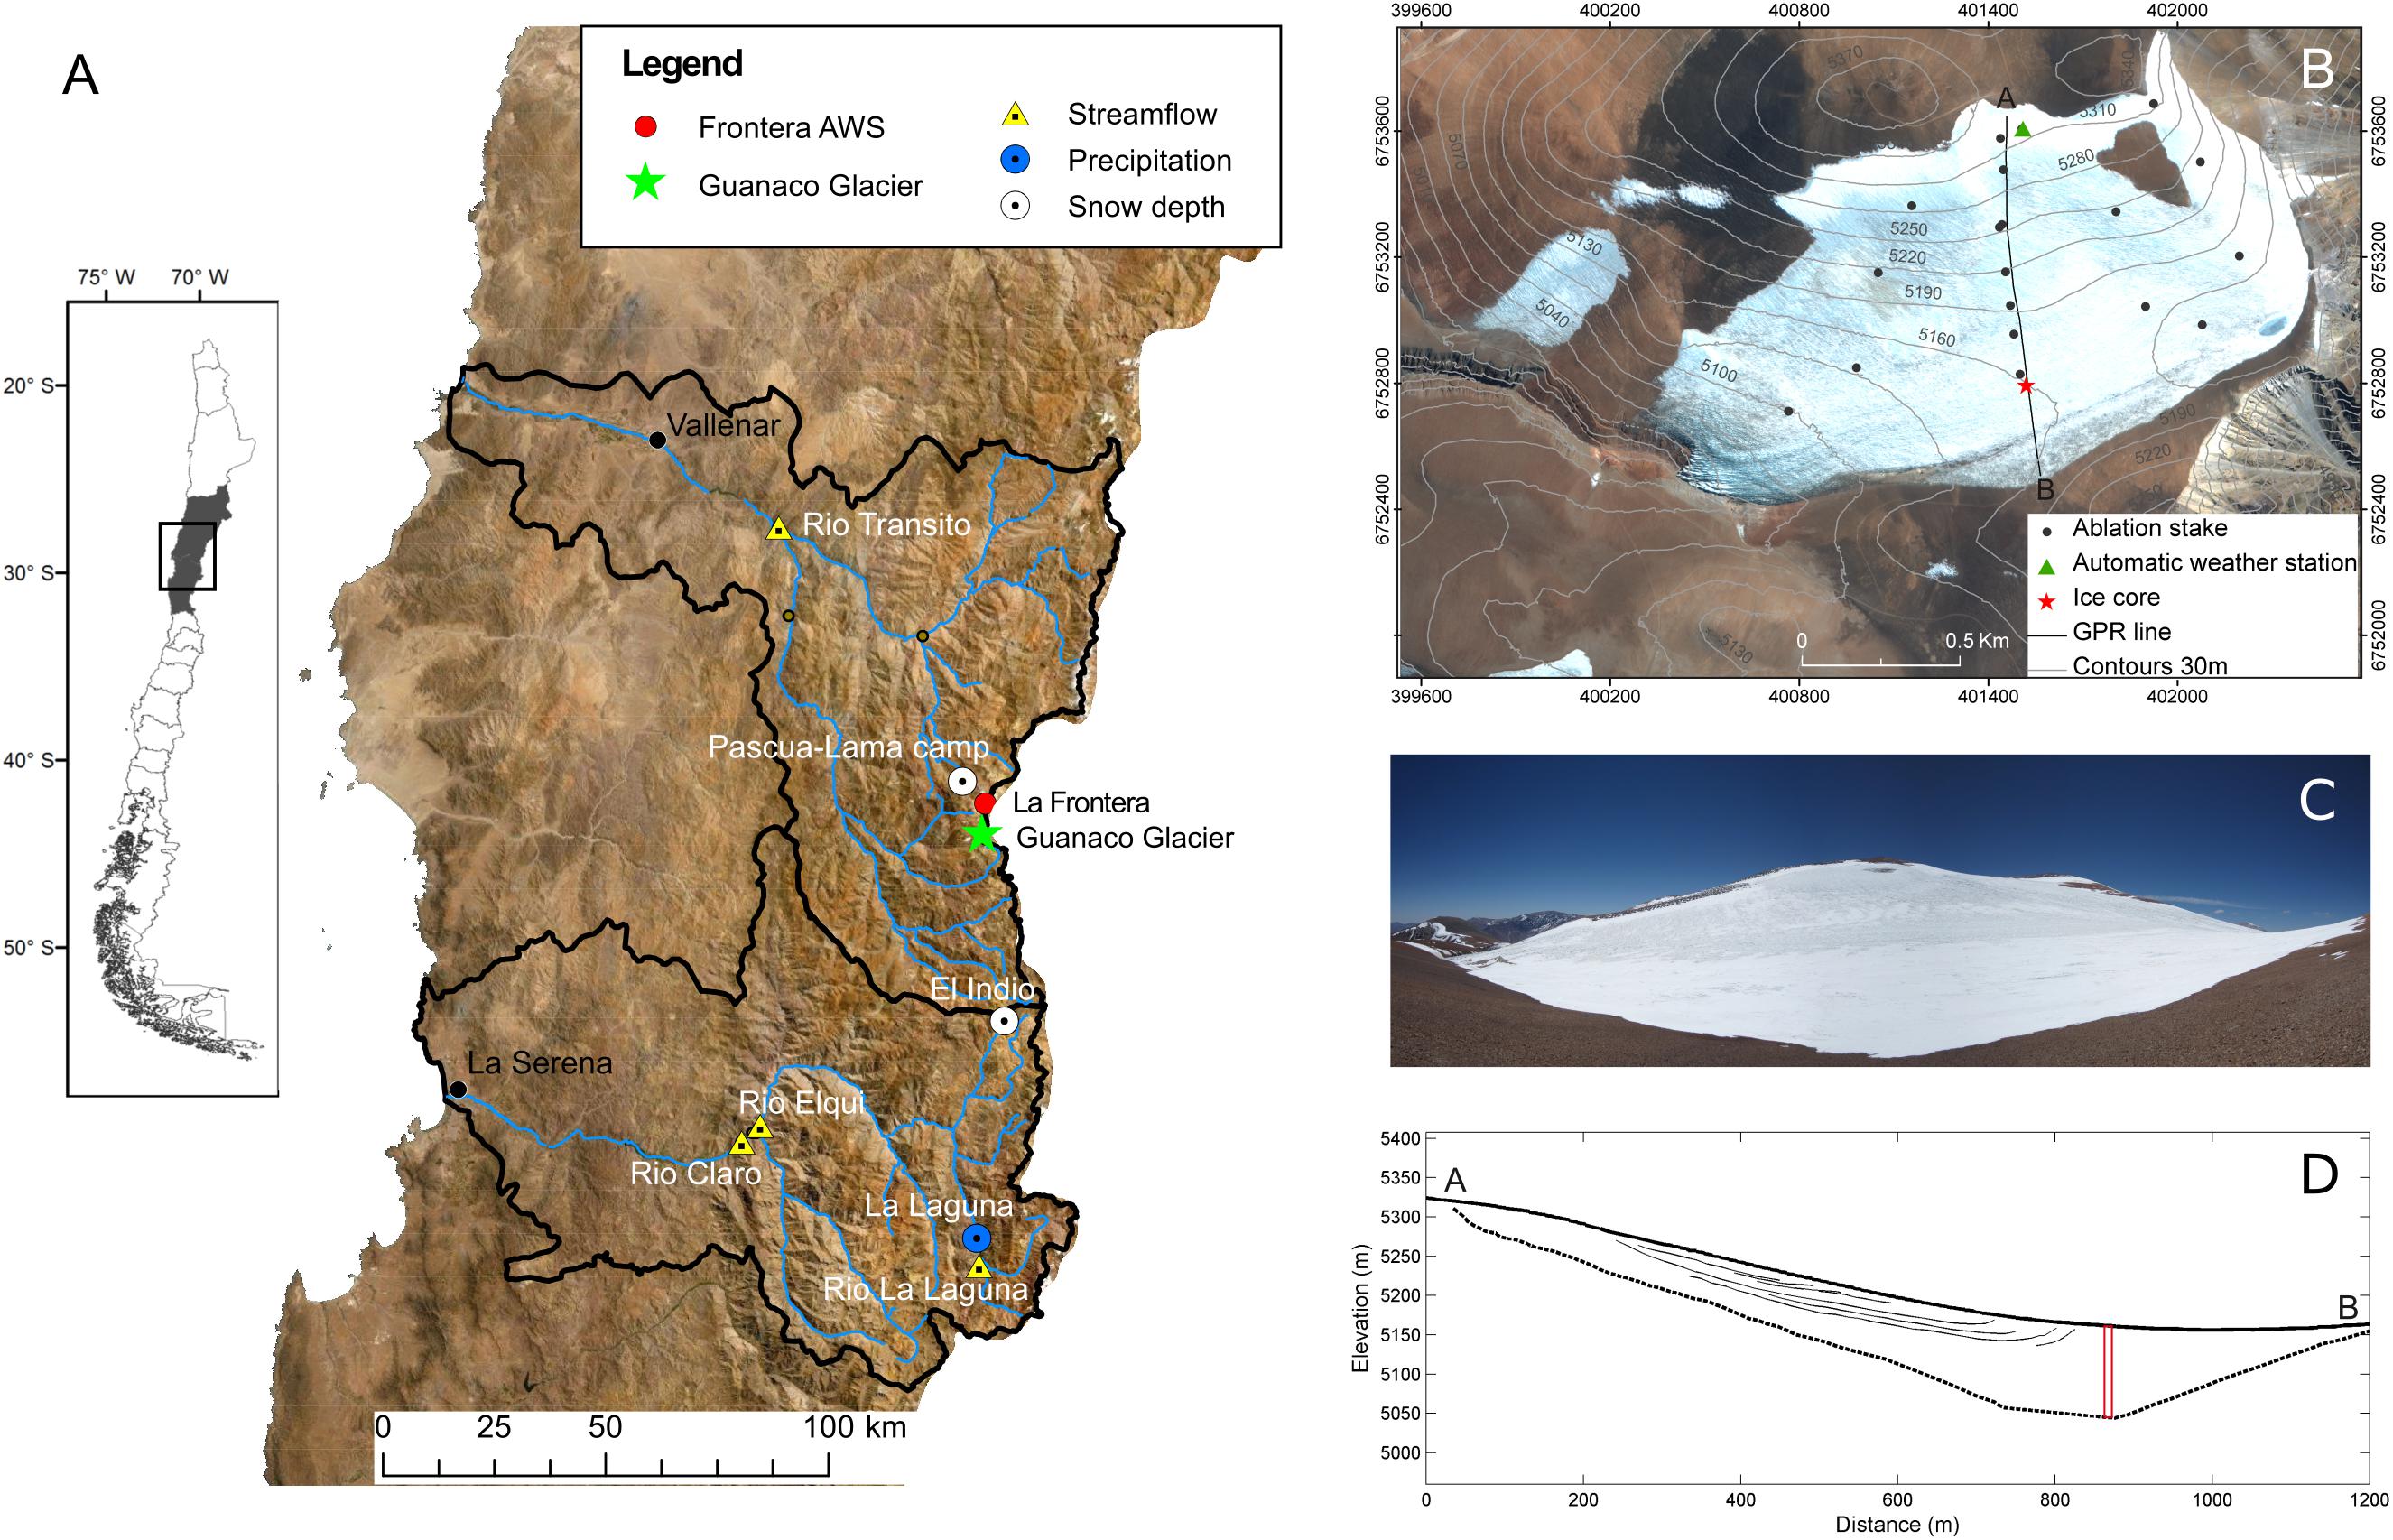
Figure 1. Study area and sites. (A) region map showing the location of Guanaco Glacier and the hydroclimatic records used in this study. (B) Map of Guanaco Glacier showing mass balance stakes, automatic weather station and ice coring site; satellite image: Ikonos, March 26, 2007. (C) photograph of Guanaco Glacier taken from point B, looking North. (D) Surface and subglacial topography along GPR profile shown in (C) with mapped reflectors and ice core location shown in red.
Glaciers are sparsely distributed and relatively small in Norte Chico. Barcaza et al. (2017) inventoried 1334 glaciers and rock glaciers, covering a total area of 126.6 km2. Nicholson et al. (2009) inventoried 112 glaciers covering 16.86 km2 and 40 rock glaciers covering 6.30 km2 in the upper Huasco River catchment. Despite their relatively small surface coverage, the hydrological contribution of an even limited glacier storage can become significant during drought periods and very dry summers (Bown et al., 2008; Gascoin et al., 2011; Huss, 2011; Rabatel et al., 2011). However, our understanding of recent glacier-climate interactions in the regions remains limited, hampering our ability to accurately predict future glacier contributions. The main limiting factor has been a dearth of glacier mass balance data. Within the Norte Chico, there is only one published study of glacier mass balance (Rabatel et al., 2011). Rabatel et al. (2011) presented 6 years of glaciological surface mass balance data from four ice bodies in the upper Huasco River catchments, as well as historical changes in surface area for 20 ice bodies, mapped form aerial photos and satellite images since 1955. They showed that the glacier cover decreased by ∼29% over the 1955–2007 period, and that glacier mass balance was negative over the 6-year monitoring period. Using these data combined with continuous streamflow measurements, Gascoin et al. (2011) evaluated the mean hydrological contribution of glacier melt in the upper Huasco River catchments which was found to vary between 3 and 24%.
Glaciological mass balance measurements records can be extended, or complemented, by calculating geodetic mass balance from historical satellite and aerial stereoscopic images (Cogley, 2009; Zemp et al., 2013), while longer mass balance reconstructions can be derived from ice core records (Ginot et al., 2006). While ice cores have greatly contributed to our knowledge of past hydroclimatic variability in the tropical Andes (Thompson, 2000; Vimeux et al., 2009), ice core records are almost non-existent in the subtropical region of South America. In arid zones, ice cores may represent the only source of high resolution (<decadal) paleoclimate information, as the scarcity of vegetation and lakes limits the use of tree-ring and lake sediment proxy records (Neukom and Gergis, 2012; Flantua et al., 2016). In addition, ice core records from high-altitude glaciers can also supply valuable climate information in otherwise data-scarce regions, as high-altitude weather stations are rare in the Desert Andes. To date, only one ‘deep’ (36 m, surface-to-bedrock) ice core paleoclimate record from the South American subtropics has been published, from the Cerro Tapado Glacier in the upper Elqui Valley of Norte-Chico (30°08′ S, 69°55′W, 5550 m a.s.l.) (Ginot et al., 2006). Additionally, preliminary analyses of a 104 m-long ice core form the Cerro Mercedario Glacier (31°58′ S, 70°07′W, 6100 m a.s.l.) are available (Bolius et al., 2006; Vimeux et al., 2009; Ciric et al., 2010). Given the recent persistent drought conditions observed in the region (Garreaud et al., 2017) and the anticipated aridification and warming trend (Boisier et al., 2018), there is a need for more information on the response of glaciers to climate change both under present and past climate conditions, in order to better assess the sensitivity of glaciers and related meltwater resources to climate change. The paleoclimate archive contained in high-altitude glaciers may also provide the best information source on past precipitation at high altitudes, which would give precious insights into natural climate variability and provide a comparative framework for the recent and ongoing drought experienced in the region.
This study presents a comprehensive assessment of the mass balance and climate history of a cold, high-altitude (>5000 m a.s.l.) glacier in the Desert Andes, using a combination of field, remote-sensing, and shallow ice core data. Our primary aims are (i) to provide an observation-based interpretation of glacier-climate relationships in the southern Desert Andes, (ii) to place recent glacier mass balance observations into a historical perspective, and (iii) to provide a first assessment of the paleoclimate information contained in such glaciers.
Study Site
Guanaco Glacier is one of the largest glaciers (1.8 km2) of the Huasco River basin (Figure 1). It drains predominantly into the Potrerillos River, a headwater tributary of the Huasco River basin (Atacama Region), but also contributes to the Argentinian de las Taguas River basin as it straddles the Chile-Argentina divide (29.34°S, 70.01°W, 4990–5350 m a.s.l). The climate in the area is semi-arid, with predominantly clear sky and strong solar radiation, and precipitation is almost exclusively snowfall from westerly circulation during the austral winter. Easterly convective precipitation events also occur episodically during the so-called Altiplano, or Bolivian winter, between December and February. While these events do not contribute much to annual totals, they can reduce glacier ablation by blanketing the surface with fresh snow and elevating the albedo (MacDonell et al., 2013; Abermann et al., 2014). The average snow precipitation measured at the Pascua-Lama mining camp at 3737 m a.s.l. was 240 mm w.e. a–1 for 2002–2015. In comparison, the long-term total annual precipitation was 173 mm w.e. a–1 for 1980–2004 at the El Indio Mine, 45 km south of the study area and at an altitude of 3869 m a.s.l., with 81% occurring in winter, between May and August.
Guanaco Glacier is located within the former Pascua-Lama bi-national mining project, which aimed to exploit an open-pit gold and silver mine straddling the Chile-Argentina Border. The project raised concerns regarding possible adverse impacts of mining activities, especially dust emissions, on nearby glaciers and glacierets (small glaciers with little or no sign of movement) (Fields, 2006; Brenning, 2008; Kronenberg, 2013; Arenson et al., 2015). These concerns led to the development and implementation of a vast program to monitor the state of the cryosphere in the vicinity of the project, which has been carried out by various private consulting companies as well as Chilean research institutes. This context explains the unique wealth of meteorological, hydrological and glaciological data in the area (Gascoin et al., 2011; Rabatel et al., 2011).
The glacier surface is smooth in its upper half and predominantly terraced at lower elevations. Ice penitents, which are vertical blades of ice up to ∼3 m high (e.g., Lhermitte et al., 2014) occur in the southwestern portion of the glacier, near the discharge outlet. An automatic weather station (AWS) was installed in 2008 on the uppermost part of the glacier (Figure 1). Air temperature varied between −25°C in winter to 5°C in summer (annual average = −9.3°C) over a 2.5 years period (November 2008 – April 2011) (MacDonell et al., 2013). Over the same period the relative humidity was low (mean ± standard deviation = 40 ± 26%) and wind speeds high (mean = 9.2 ± 4.2 m s–1). The existence and surface mass balance of Guanaco Glacier is, at least partly, linked to snow redistribution by the wind as the glacier lies in the lee of a ridge (Gascoin et al., 2013). The current energy balance at the AWS shows that the net solar radiation is by far the dominant energy source, predominantly balanced by surface radiative cooling (negative longwave radiation) and strong negative latent heat (MacDonell et al., 2013). Hence ablation occurs mainly by sublimation there while melt is restricted to summer days with favorable conditions (high incoming solar radiation and air temperature, low winds and high relative humidity). Reduced sublimation is thus one key condition for melting to occur on the upper glacier. Further down glacier, higher air temperature and the presence of penitents allow for more frequent melting there. Between 1955 and 2007 the glacier shrank by 0.334 km2 or 15 ± 4% (Rabatel et al., 2011).
Data and Methods
Mass Balance
Surface mass balance measurements using the glaciological method and the combined stratigraphic and floating-date system (Østrem and Brugman, 1991) have been initiated in 2002/2003 by Golder Associates S.A and continued by the Centro de Estudios Avanzados en Zonas Áridas (CEAZA) from 2007 to 2011 and by the Centro de Estudios Científicos (CECS) up to 2015 (WGMS, 2017). The winter mass balance is measured in late October/early November, using a combination of snowpits and probing to the previous summer surface. The summer balance is measured in late March/early April at a network of ablation stakes (Figure 1). The mean glacier mass balance (B) is calculated by averaging individual seasonal point mass balance values (bw,s) weighted by their representative area. The (net) annual balance (Ba) is calculated by summing the winter (Bw) and summer balance (Bs). In 2009/10 and 2014/15 the glacier was inaccessible in winter so that only the annual balance was measured. The 2002/03 hydrological year was a wet year and glaciers were still snow-covered at the end of summer (Golder Associates, 2005). The snow thickness was measured in March 2003 at the stakes, supplemented by thickness estimates along a ground penetrating radar (GPR) survey (Figure 1), using the previous summer ice surface reflector as a stratigraphic reference (Golder Associates, 2005). Random mass balance errors arise for multiple causes and are notoriously difficult to quantify. Intrinsic errors may arise from imprecise stake readings, snow density determination, snow depth soundings, and from the sinking of stakes in firn and spatial sampling errors (Østrem and Haakensen, 1999). All stakes on Guanaco Glacier were drilled in ice so stake sinking is not considered to be an issue and averaging of nine snow probe measurements within a 2 m radius around stakes reduces the spatial sampling errors in local accumulation measurements. The mean annual error for the glacier-wide annual balance, Ba, is estimated to be ±0.09 m w.e and the error on the cumulative balance in 2014/15 is ±0.32 m w.e assuming independent errors between years (see Supplementary Material). However, unquantified systematic errors in glaciological mass balance can increase linearly over time (Thibert et al., 2008). The cumulative glaciological mass balance data was thus compared with independent geodetic balance estimates (c.f. section Geodetic Mass Balance), which allows detection of possible systematic errors (Østrem and Haakensen, 1999).
Meteorological Data
We make use of continuous meteorological measurements available since 1999 from a permanent automatic weather station at La Frontera (4927 m a.s.l.), 2 km north of Guanaco Glacier (Figure 1). Snow precipitation data is available since 1999 at the Pascua-Lama mining camp (3737 m a.s.l.), 10 km northwest of Guanaco Glacier (Figure 1). Snow thickness was measured manually by a meteorologist at a 3-h interval during snowfall events. The longest nearby high-altitude precipitation records are those from the former El Indio mining site (3869 m, 1980–2004) and La Laguna dam (3200 m, continuous since 1964), respectively located 45 km and 97 km south of the study area (Figure 1).
Geodetic Mass Balance
Historical elevation changes were estimated from digital elevation models (DEMs) of the glacier and surrounding areas. DEMs were constructed from stereo aerial photographs available in 1955 and 1978, and from two stereo pairs of Ikonos satellite images for 2005. The Ikonos images were acquired on March 1, 2005 as pan-sharpened multispectral products with 1 m resolution. The 2005 images were first triangulated using the Rational Polynomial Camera model supplied by the data provider. The exterior orientation solution was refined using a single ground control point (GCP) well visible near the center of the images. The two stereo pairs were triangulated in a single block solution, using 152 tie points representing ground features mutually visible between images in the stereo pairs. A set of three-dimensional (3D) points was extracted based on image correlation using the Automatic Terrain Extraction (ATE) module of the Leica Photogrammetric Suite Version 11 (Hexagon®) and manually edited to remove errors during the ATE procedure. The resulting sets of matched points from the two stereo pairs were merged and rasterized to a 5 m grid using bilinear interpolation.
In 1978 an aerial survey flight over Pascua-Lama area was performed by the Servicio Aerofotogramétrico de Chile using a Wild RC10 camera. The average scale of the photographs is about 1: 50,000. A stripe of four photographs with 60% end overlap was used in this study. The snow conditions on the photographs were favorable, showing good contrast and texture over most of the glacier surface. The original negatives were scanned at 16 μm resolution and provided with full camera calibration report. Prior to data processing, the photographs were radiometrically balanced to enhance brightness contrast. A Wallis adaptive filter was further applied to highlight local variation in brightness and enhance the accuracy of feature matching in the ATE procedure. Ten ground control points (GCPs) distributed over the whole Pascua-Lama area were collected from the 2005 Ikonos stereo pairs. The 10 GCPs were complemented with 45 tie points manually chosen on the overlapping parts of the images to strengthen the geometry of the image block. Image correlation was used to generate automatic tie points on the stereo image pairs. Aerial triangulation of all four images was performed in a single solution, so-called Bundle Block Adjustment. Image correlation on the 1978 aerial photographs resulted in much lower matching density than for the 2005 Ikonos imagery, despite the presence of visible features (crevasses, boundaries of snow facies, etc.). Mismatches also resulted in large clusters of erroneous points on the 1978 glacier surface. These errors were removed, and additional 3D points were manually digitized for the 1978 DEM. The two images were matched between each other through parallax adjustment using a 3D digitizing cursor that “floats” in the vertical (Z) dimension. The 3D digitizing was performed in a quad buffered stereo environment facilitated by Nvidia 3D vision stereo glasses and a LG Flatron W2363D stereo.
Two aerial photographs from the Instituto Geográfico Militar (IGM) 1955 Hycon flight were acquired in a single flight line with approximately 60% end overlap. The overlap between photographs allowed triangulation of the images in a single bundle block adjustment. Photographs were scanned by the IGM at resolution of 1200 dpi (about 21-micron dot size) as 8-bit gray scale images. The overall quality of photographs is good, however the contrast over the glacier surface is rather poor. The same pre-processing, triangulation and terrain extraction procedures used for the 1978 photographs were applied to the 1955 pair. As the full calibration report was not available for the 1955 photographs, the internal frame coordinate system for each image was determined using the distances between the four center fiducials. Ten GCPs and 16 tie points were used for the bundle block adjustment.
The absolute vertical accuracy of the 2005 DEM was checked against 42 elevation points measured in situ at a reference geodetic network, yielding a bias of −0.42 m and standard deviation (std) of 1.19 m (Supplementary Table 1). Trend analysis of DEM residuals also did not reveal any spatial trends. Given the pixel size of Ikonos stereo imagery (1 m) the achieved vertical accuracy is considered as excellent. Changes in thickness, area and volume of Guanaco Glacier were estimated by comparing the 2005 DEM with those of 1978 and 1955. Elevation changes are typically calculated by differentiating glacier DEMs interpolated from 3D point clouds (e.g., Nuth and Kääb, 2011). This approach, however, assumes a comparable spatial density of the 3D point sets. Since the 1955 point cloud was sparser than in 1978, especially in the upper part of the glacier, this could lead to unrealistic surface change patterns. Therefore an approach was used that involves estimating elevation changes at locations of the 1978 point cloud (ΔZ) followed by the interpolation of a continuous ΔZ surface using the 1978 point cloud and the 1978 glacier boundary as zero change constraint (Surazakov and Aizen, 2006). The same approach was used for 1955. Systematic and random errors in glacier elevation changes were derived from elevation changes over stable surfaces surrounding the glacier, with slopes < 25°. Trend analysis of errors revealed a significant spatial trend in the east-west direction for both the 1955 and 1978 data. As the spatial error trend is practically linear, it is most probably related to vertical instability of the external orientation of the aerial stereo pairs (east-west “roll” of the stereo model relative to the reference coordinate system). The systematic spatial error trends were modeled with a first order polynomial surface and then removed (see Supplementary Material), and the remaining bias was subtracted from the DEMs. Uncertainties on mean elevation change were calculated from errors on stable ground, following Rolstad et al. (2009) (see Supplementary Material).
In October 2011 dual frequency Trimble 5700 GPS receivers were used to conduct kinematic surface profiling with a total length of 6 km on Guanaco Glacier. The base antenna was placed during the 6-h survey on a reference geodetic point 1.7 km north of Guanaco Glacier. Post-processing using the Automatic Precise Positioning Service (APPP) by JPL NASA resulted in a fixed solution with estimated errors of the coordinates of the base less than 3 cm (1 sigma). GPS kinematic data for Guanaco Glacier were post-processed to precision of less than 0.03 m and referenced to WGS84/EGM96 datum using the APPP solutions for the base station. Recent (2005–2011) surface elevation and volume changes for Guanaco Glacier were estimated by comparing the DGPS kinematic profiles with the 2005 DEM. To ensure the absence of systematic bias between DGPS data and the 2005 DEM, their elevation differences was estimated over stable terrain (off glacier) surveyed along 500 and 800 m profiles in proximity of the glacier. The results showed a very low random error (0.37 m) and a systematic error of −0.47 m. The bias was removed from the 2005 DEM before calculating elevation changes from DGPS values. The point estimations of glacier elevation changes were interpolated using Ordinary Kriging with a spherical function previously fitted to the empirical variogram. Cross-validation showed standardized RMS prediction error of 0.37 m. All elevation changes were converted to mass balance assuming a glacier wide average density of 900 kg m–3 and converted to volume changes using the mean glacier area over the considered time interval (Cogley, 2009).
Ice Core
During 9–20 November 2008 a 113 m-long, surface-to-bedrock ice core was retrieved from Guanaco Glacier (29.350°S, 70.014°W, 5161 m, Figure 1). The initial goal of the drilling was to confirm previous thickness estimates from GPR measurements and to check the possible accumulation of subglacial water and associated risk for catastrophic glacier collapse on nearby mining activities, a phenomenon documented in the region (Peña and Escobar, 1987; Iribarren Anacona et al., 2015). Other objectives included reconstructing the recent climate history of the area from ice core climate proxies. Hence the drilling location was chosen where the glacier is thickest (Figure 1D) and relatively planar – to ease drilling operations, and above the subglacial depression where subglacial lakes could potentially form. This implies that the ice core is located midway down a flowline running south from the glacier top to the drilling location, then deflecting southwest toward the Chilean outlet of the glacier (Figure 1). Analysis of previous GPR surveys (Golder Associates, 2005) shows that the main visible reflectors are tilted toward the surface near the drilling site in concordance with the sub-glacial bed, which occurs because glacier flow is constrained by the topographic depression. Drilling was done using the FELICS electro-mechanical drill specially designed for high-altitude drilling campaigns (Ginot et al., 2002). All recovered core segments were cut in 70 cm sections, placed in polyethylene tubes and stored in insulated boxes kept in a snow trench. Ice core boxes were delivered by refrigerated truck to Santiago Airport and shipped to the Laboratoire de Glaciologie et Géophysique de l’Environnement (LGGE) in Grenoble, France. Thermistors placed in the box revealed no melting during transport. A 15-thermistor chain with a ±0.1°C accuracy was installed in the borehole to monitor englacial temperatures and measured in November 2008, March 2010, April 2011, and October 2011. Ice core processing and chemical analyses were conducted at LGGE, France. The ice core density was calculated by weighting individual core segments divided by the respective core volumes. Stratigraphic observations were conducted by placing each core segment on a backlit table, rotating the core to best see any visible features and related dip angle. The fraction of bubble-rich and bubble-poor ice, respectively representing glacier (compaction) and recongelation ice, was mapped from digital photographs of the backlit cores (Kinnard et al., 2008), and the dip angles of melt features was recorded. The core was then cut into separate longitudinal sections for analyses of stable water isotopes, radiogenic isotopes, major ion chemistry and insoluble particles and archives. Analyses of radiogenic isotopes were used to gain a first insight of the ice core age. Tritium (3H) activity was measured for replicate samples of fresh surface snow as well the first 3 m of the ice core by U. Schotterer at the University of Bern, Switzerland, by direct liquid scintillation counting procedure (Schotterer et al., 1998). Cesium (137Cs) and Lead 210 (210Pb) activity was measured continuously along the first 20 m of the core at a 70 cm sampling interval at LGGE. Stable water isotope ratios (δ18O and δ2H) were analyzed continuously along the first 20 m of the core with a maximum sampling interval of 2 cm. Analyses were conducted at the LAMA laboratory (HSM, Montpellier, France) on an Elementar Isoprime mass spectrometer, coupled with an Aquaprep module using the classical water-CO2 equilibration technique for δ18O, and with a Eurovector PyrOH Elemental Analyzer in continuous-flow mode for δ2H. Analytical errors were ±0.8‰ for δ2H, and ±0.10‰ for δ18O. Results from major ion chemistry analyses will be presented elsewhere.
Mass Balance Climate Interactions and Reconstructions
Glacier-climate interactions were investigated by correlating Ba with mean annual air temperature (Ta), wind speed (W) and vapor pressure deficit (VPD) recorded at the nearby La Frontera weather station and with winter (April to September) precipitation (P) recorded at La Laguna station. The annual and cumulative mass balance of Guanaco Glacier was reconstructed back to the mid-20th century based on linear regressions models between Ba and climate records and validated against geodetic estimates. Masiokas et al. (2016) also successfully reconstructed glacier mass balance from historical streamflow records in central Chile. Four long streamflow records are available for headwater catchments near Guanaco Glacier (Figure 1A), where discharge is strongly conditioned by snow accumulation, melt and sublimation (Favier et al., 2009). Mass balance was reconstructed back to the early 20th century by regressing Ba on a composite streamflow record, i.e., after averaging the four standardized streamflow series. 95% confidence uncertainty intervals on annually reconstructed Ba [εreco(t)] were taken as twice the cross-validated root-mean-squared error of predictions (RMSECV) (Wilks, 2011). Following Masiokas et al. (2016), the standard error on mean streamflow (SEmean(t)) was also considered when estimating uncertainties for the reconstruction based on the composite streamflow record, using:
where σ is the standard deviation of the composite record and n the number of records available at time t. SEmean(t) = 0 for the climate-based reconstruction. Uncertainties on the reconstructed cumulative Ba series were derived by propagating (summing) the annual errors backward in time assuming independent errors between years, following Masiokas et al. (2016):
Results and Discussion
Recent Mass Balance
The mean mass balance of Guanaco Glacier was −0.85 m w.e. a–1 between hydrological years 2002/2003 and 2014/2015, with a maximum of 1.23 m w.e in 2002/2003 and a minimum of −1.13 m w.e. in 2014/15 (Figure 2A). Apart for the 2002/03 and 2005/06 years, the annual balance was negative, and the cumulative annual balance was −7.64 m w.e over the 2002–2015 period. The winter mass balance (Figure 2B) shows more pronounced variability (coefficient of variation = 1.2) than the summer balance (coefficient of variation = 0.3), in line with the other glaciers in the Pascua-Lama area (Rabatel et al., 2011). There is no direct relationship visible between the mass balance series and air temperature at the site (Figure 2C). Conversely, a positive relationship between winter and annual mass balance and precipitation measured at the two closest high-altitude weather stations is more striking. At first glance, interannual variability in glacier mass balance appears to be mostly controlled by interannual changes in precipitation, with changes in ablation playing a minor role.
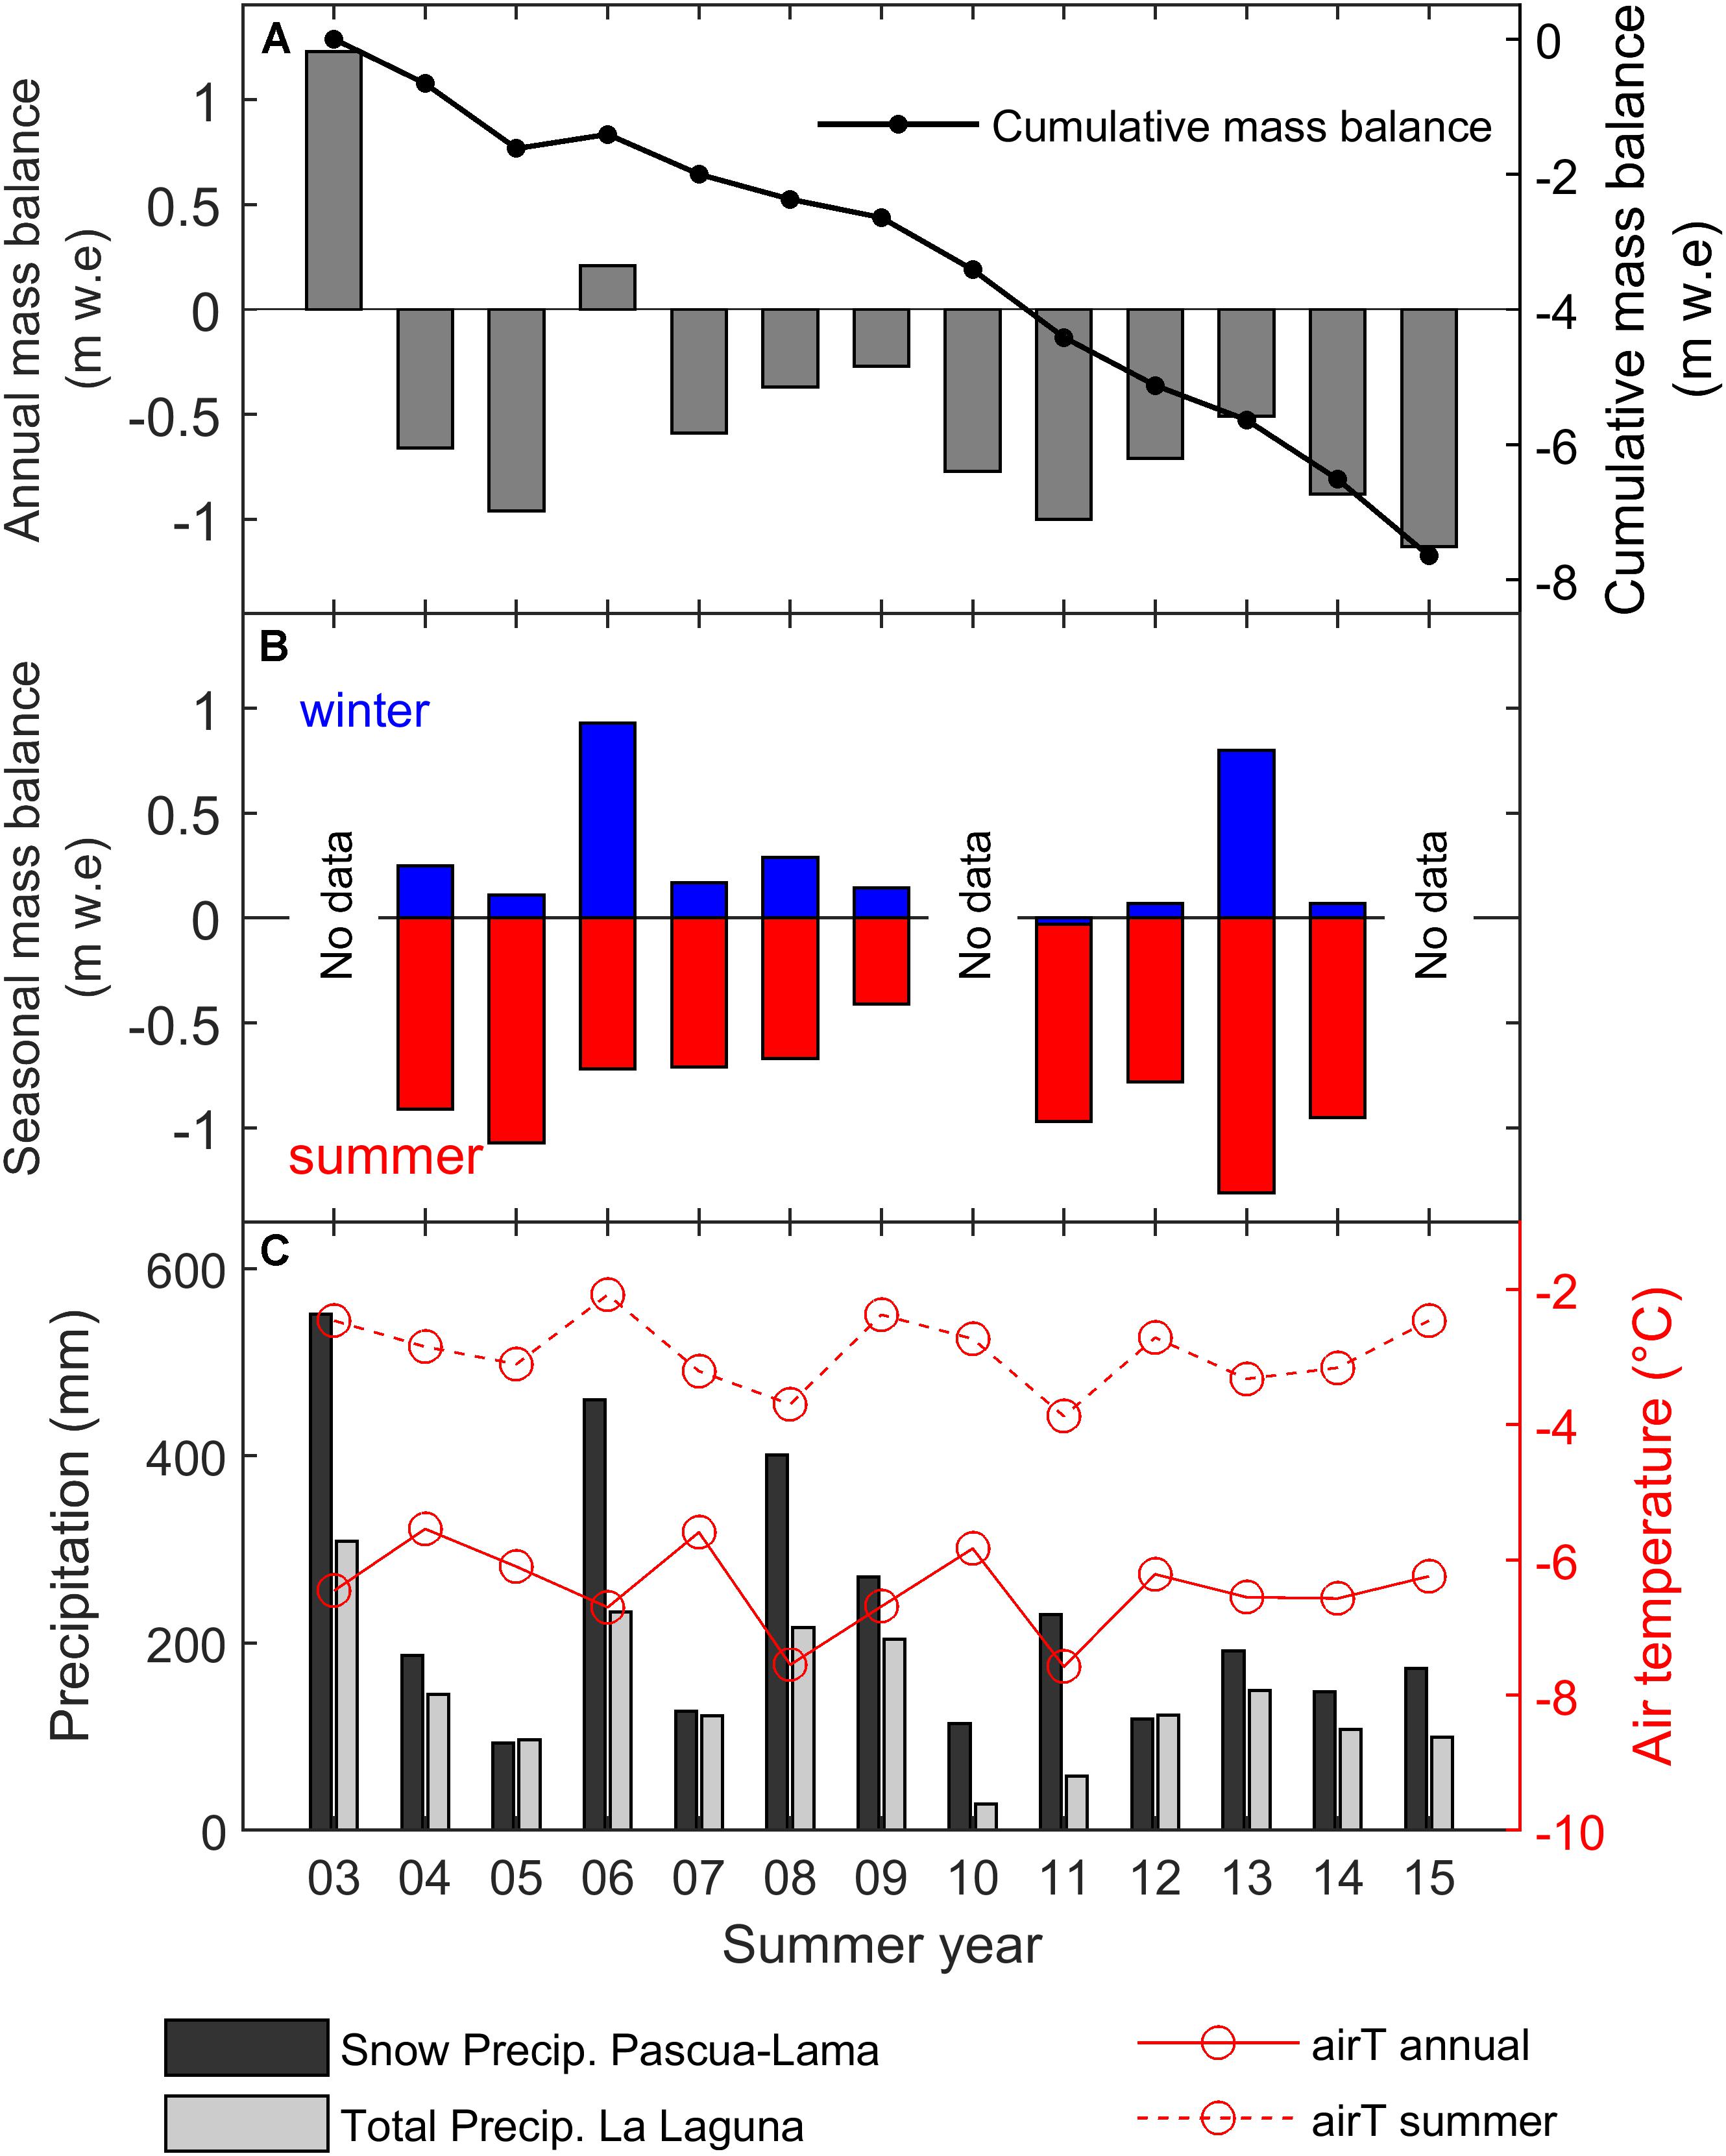
Figure 2. Annual mass balance of Guanaco Glacier. (A) Annual (gray bars) and cumulative (black line) mass balance; (B) winter (blue) and summer (red) mass balance. Only the annual balance (Ba) was measured during the hydrological years 2002–2003, 2009–2010, and 2014–2015. (C) Annual precipitation (bars) at Pascua-Lama camp and La Laguna reference station and air temperature at La Frontera AWS (red lines).
In 2008 the stake network was expanded from 5 to 19 stakes, providing increased spatial coverage and enabling a more detailed analysis of the relationship between elevation and point mass balance at individual stakes (available up to 2013/14 only). The mass balance pattern of Guanaco Glacier is quite heterogeneous and shows only a weak relationship with elevation (Figure 3). From Figure 3C it is evident that winter mass balance, which is dominated by snow accumulation, is weakly but inversely related to elevation, opposite to common winter balance gradients which show positive increases with elevation due to orographic enhancement of precipitation and colder temperatures enhancing snowfall (e.g., Cuffey and Paterson, 2010). Strong spatial heterogeneity is also seen in summer mass balance, with positive, albeit weak, summer balance gradients (Figure 3D). Spatial correlations between seasonal mass balance components show that the pattern of annual mass balance is more influenced by summer conditions than by winter conditions (Table 1A). As a result, the annual mass balance gradient is weakly but positively related with elevation (Figure 3A).
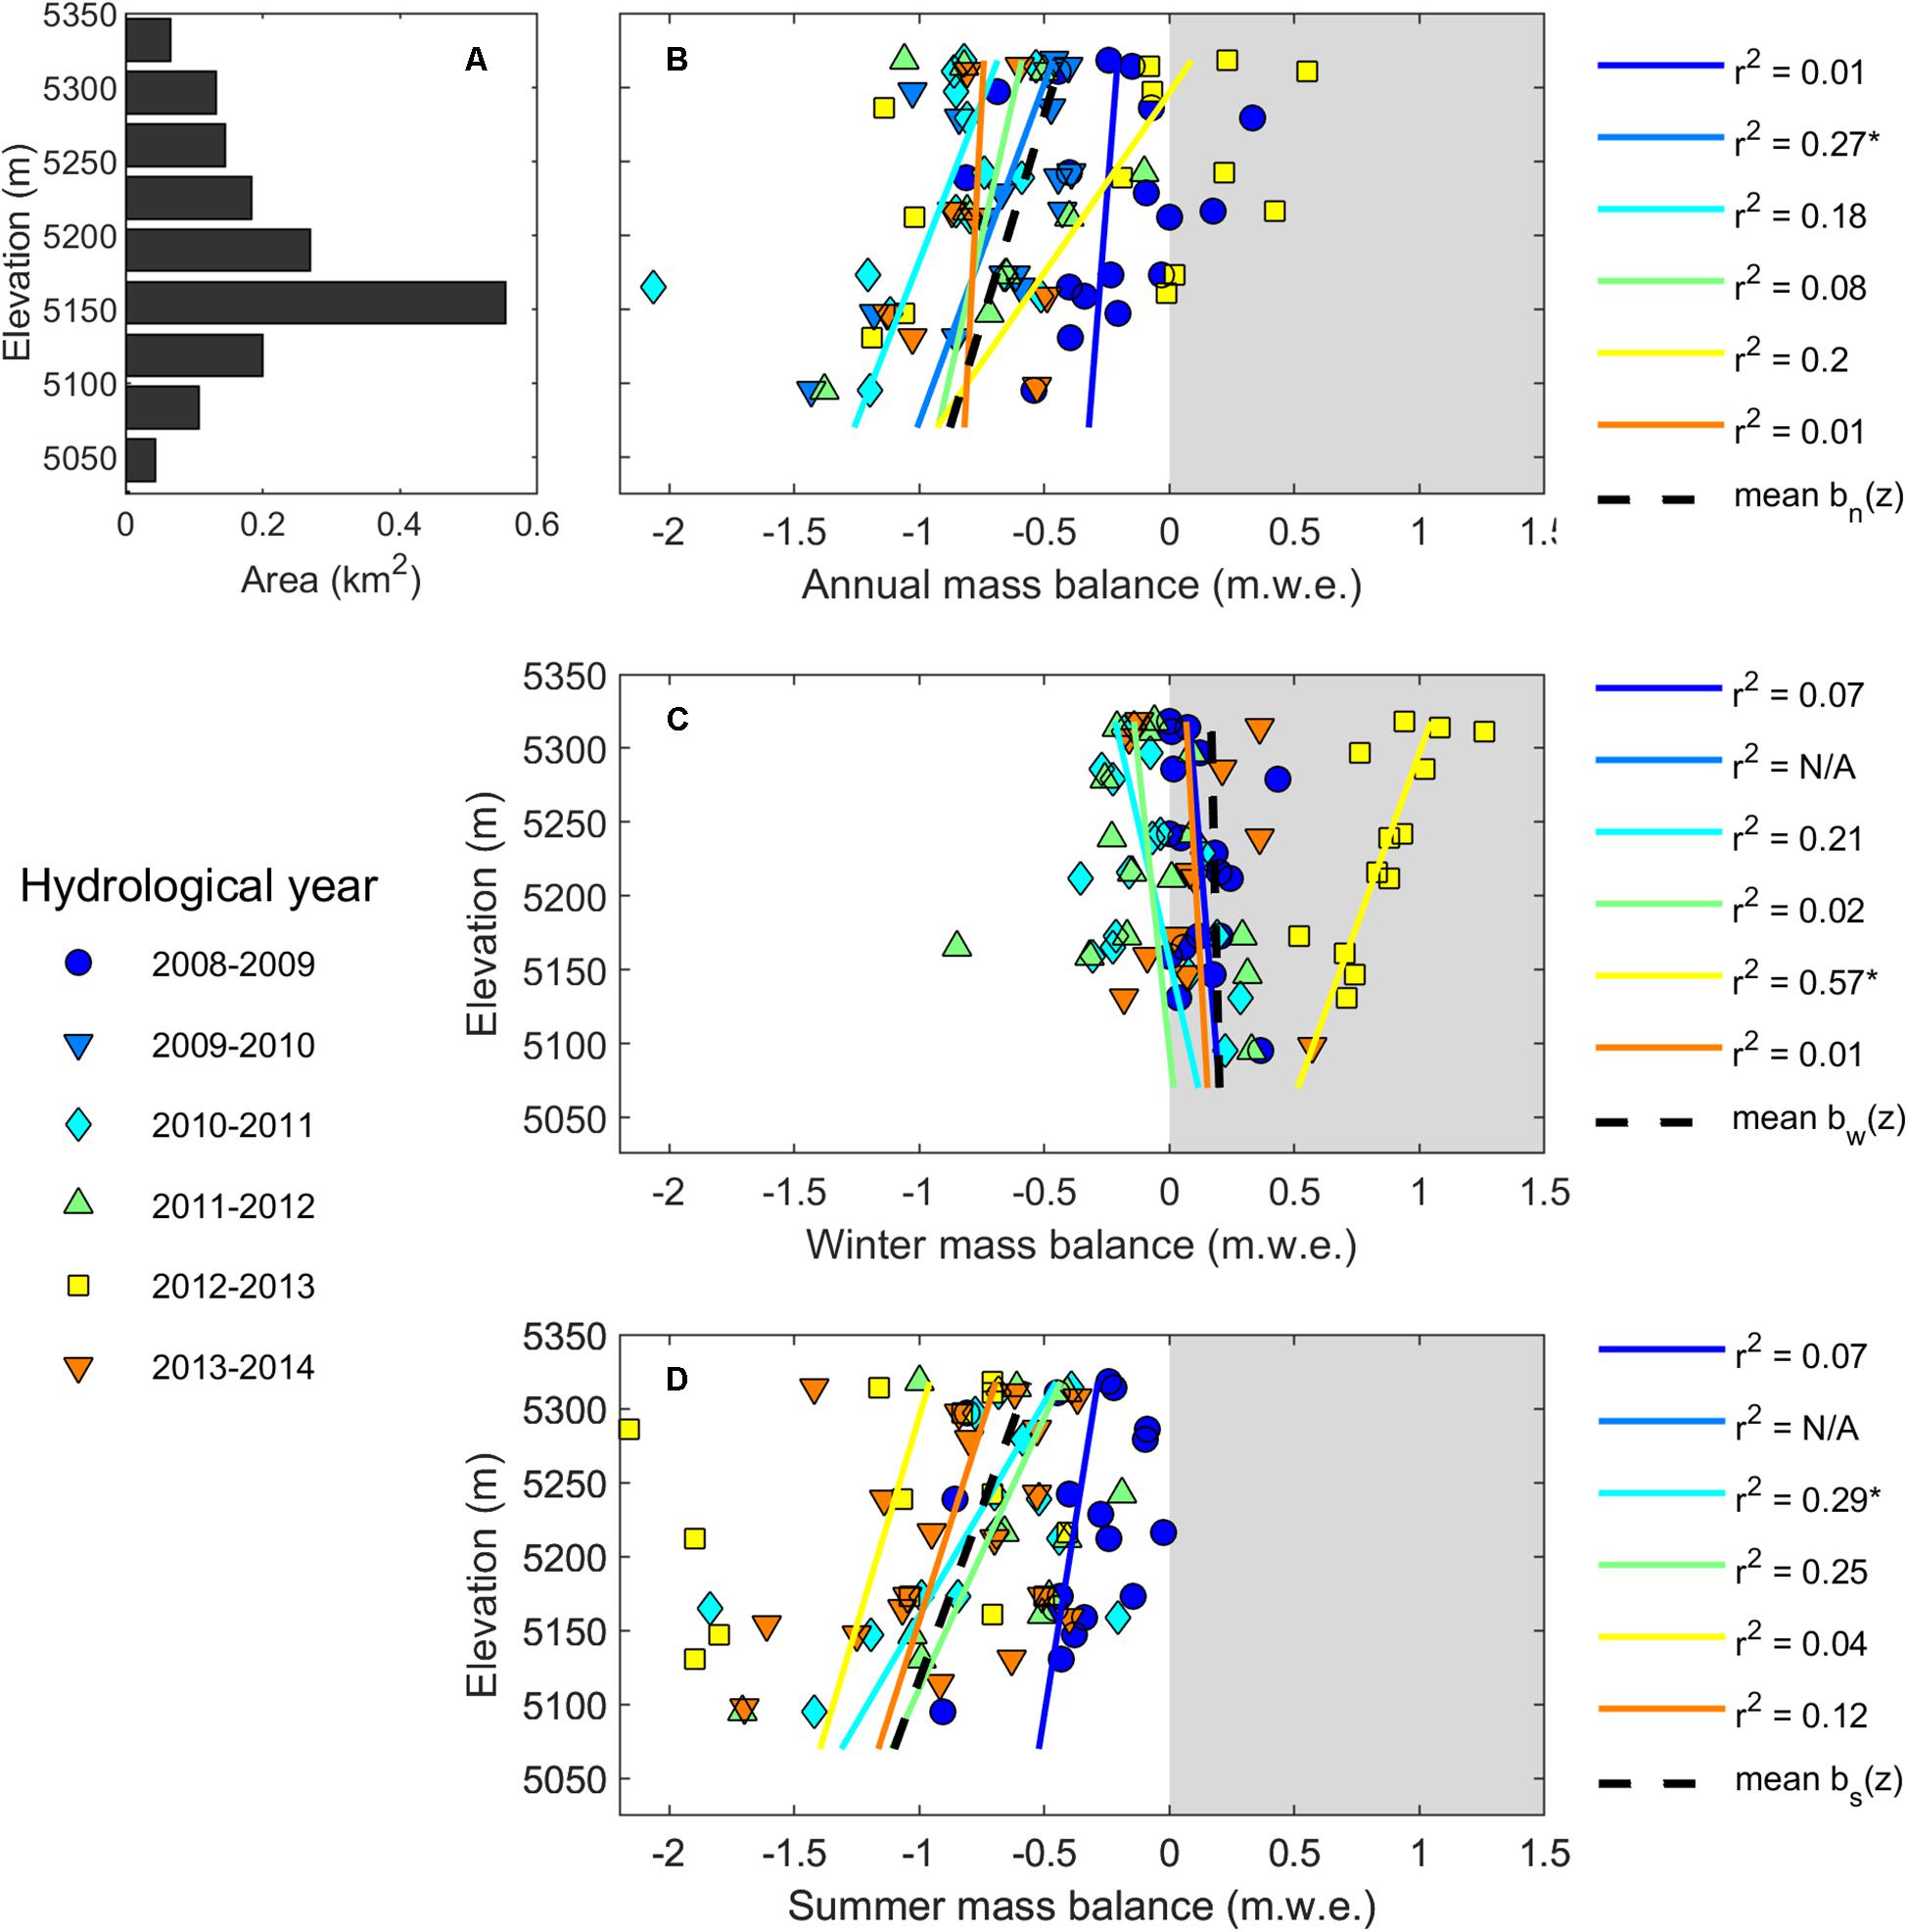
Figure 3. Guanaco Glacier mass balance gradients. (A) Hypsometry; Mass balance – elevation relationships for (B) annual mass balance; (C) winter mass balance; (D) summer mass balance. The variance explained by each linear regression model (r2) is shown in legend. Significant regression models are marked with an asterisk (p < 0.05). N/A: missing seasonal balance observations.
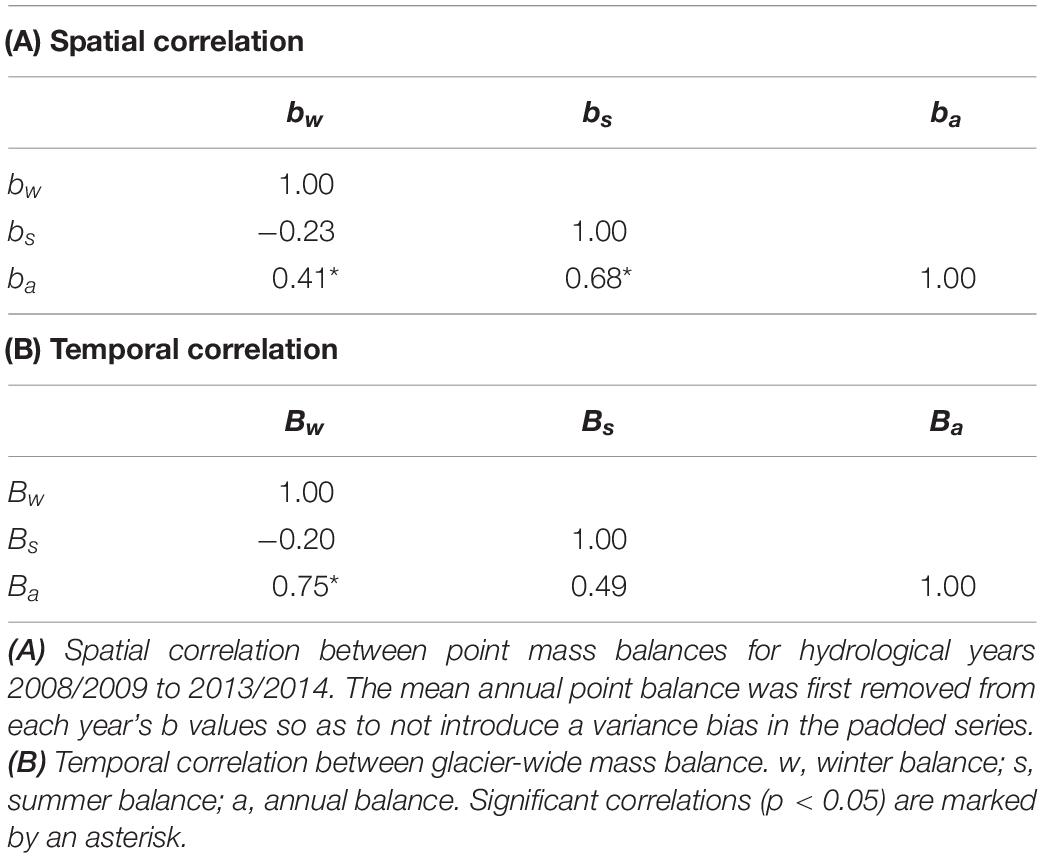
Table 1. Pearson correlation coefficients between mass balance components.
The absence of any obvious mass balance gradients shows that there is no clear demarcation between accumulation and ablation zones on Guanaco Glacier, which was noted previously by Rabatel et al. (2011) for several glaciers in this catchment. This is in part caused by irregular snow accumulation patterns, which are strongly conditioned by blowing snow transport (Gascoin et al., 2013). The upper part of the glacier is exposed to strong winds, which redistributes snow to the lower glacier, and even sometimes causes a weak but noticeable downslope increase in winter mass balance (e.g., in 2010/2011). Interestingly, the higher than normal accumulation in 2012/2013 resulted in a positive and much better-defined (r2 = 0.57) winter balance gradient. Given the small size and restricted altitudinal range of the glacier, this positive gradient may have been caused by a downslope increase in winter ablation rather than orographic enhancement of precipitation. The weak mass balance gradients are also consistent with the decreased sensitivity of mass balance to temperature in cold and dry climates (Kaser, 2001; Oerlemans, 2001; Cuffey and Paterson, 2010).
Results from the dynamic DGPS survey and the calculated elevation changes for 2005–2011 are presented in Figure 4. The mean geodetic mass balance calculated from elevation changes was −2.36 ± 0.33 m w.e. for 2005–2011. Considering that the DGPS survey was done in October 2011, i.e., at the end of winter, winter accumulation must be considered. The winter of 2011 was very dry, with a mean accumulation of only 0.07 m w.e. in October. Subtracting this value from the geodetic estimates yields a value of −2.43 ± 0.33 m w.e, which compares well with the cumulative Ba measured by the glaciological method over the same period, −2.80 ± 0.22 m w.e. (Table 2). The precision of the geodetic estimate is especially good given the small changes involved. The good correspondence between the geodetic and glaciological estimates suggests that the glaciological mass balance surveys do not suffer from large systematic errors. The spatial pattern of elevation changes for 2005–2011 shows that almost the entire glacier surface has lowered since 2005 (Figure 4B). The contribution of ice flow to elevation changes is unknown, but surface horizontal velocities measured on Guanaco Glacier are low, in the order of 2 m a–1 (Golder Associates, 2005), which suggests small vertical velocity components. The lowest, southwest portion of the glacier shows the most pronounced surface lowering since 2005 with up to ca. 5 m ice loss since 2005 (Figure 4B).
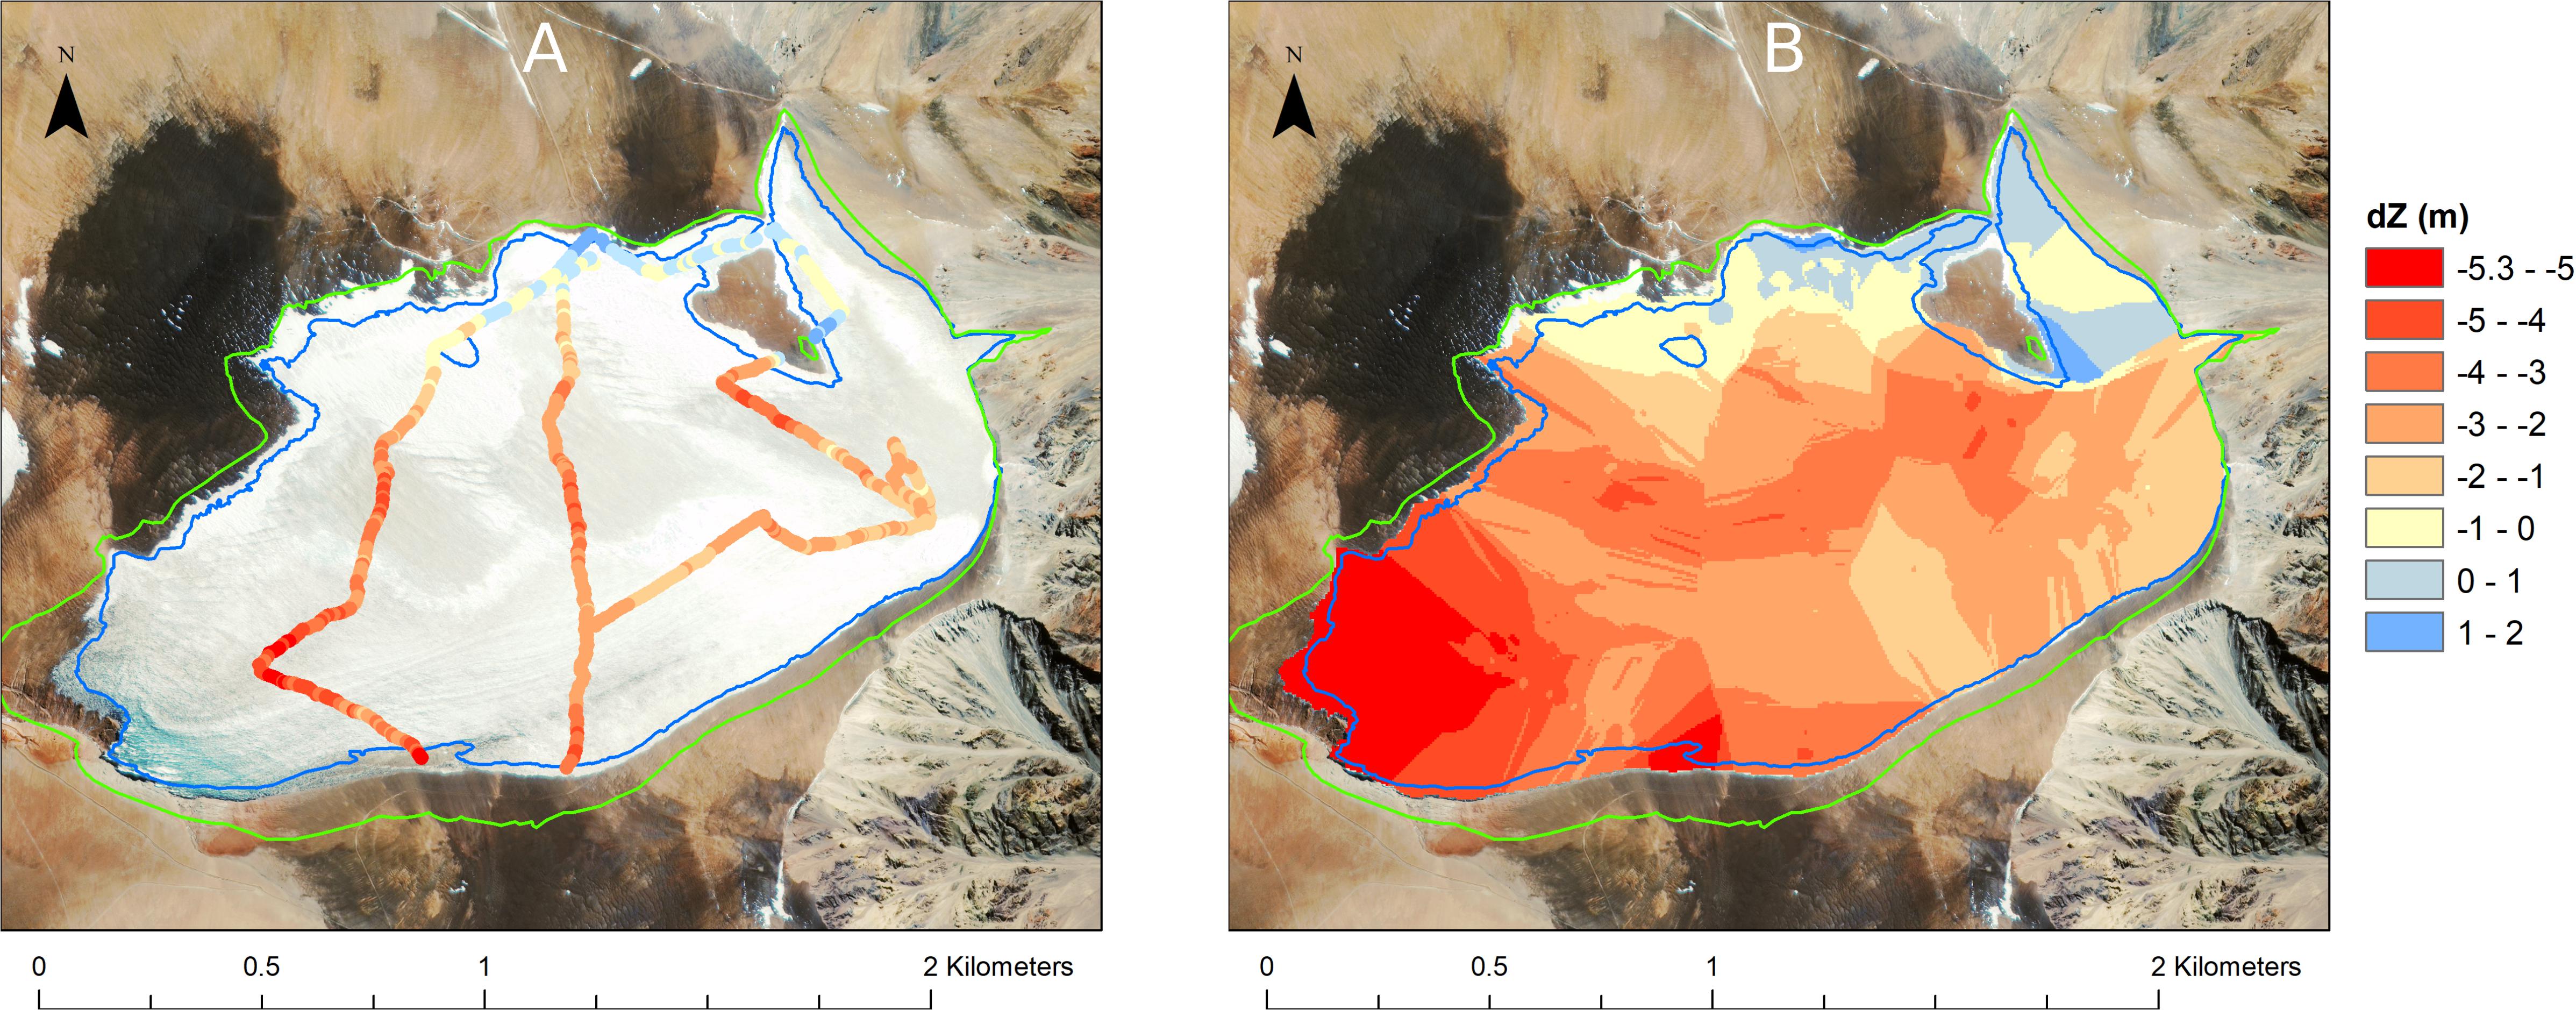
Figure 4. Recent elevation changes on Guanaco Glacier, 2005–2011. (A) Satellite image of Guanaco Glacier (Ikonos, March 2005) showing DGPS tracks in October 2011 and measured elevation changes (dZ). Digitized glacier outlines in 1955 (green) and 2011 (blue) are shown. (B) Interpolated elevation changes using Ordinary Kriging.
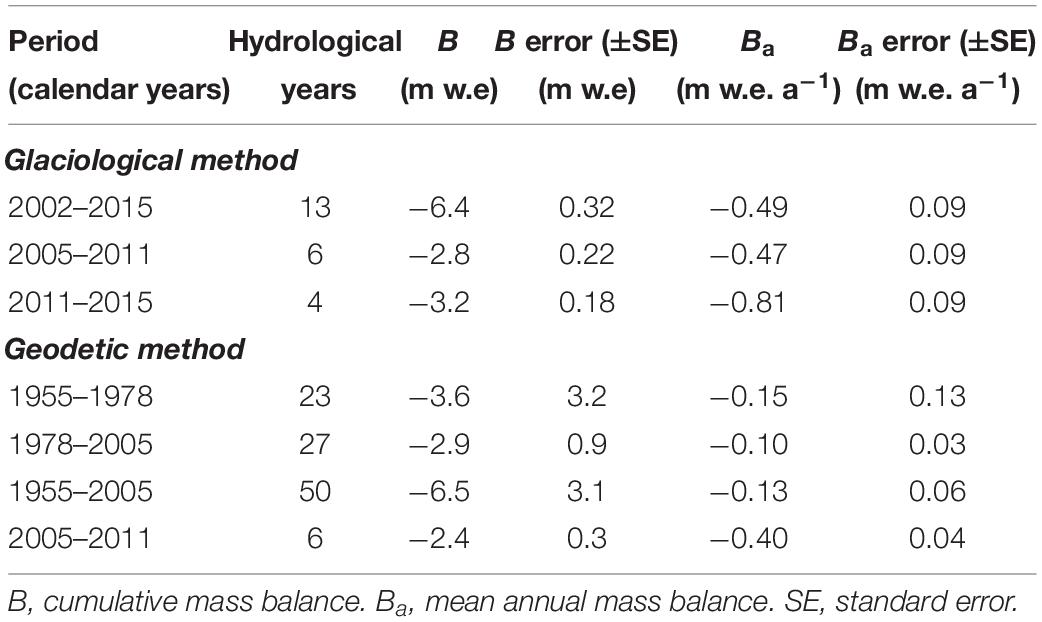
Table 2. Comparison between glaciological and geodetic mass balance estimates of Guanaco Glacier.
Historical elevation changes (ΔZ) derived from aerial photographs show that the surface has lowered everywhere on the glacier since 1955, with an evident increase in ΔZ downslope (Figure 5). Maximum thinning of ca. −40 m is observed in the southwest end of the glacier since 1955. The pattern for 1978–2005 is similar, albeit of lesser magnitude given the shorter time period (28 years). Estimates of cumulative and mean annual geodetic mass balance are compared to recent mass balance measured since 2005 by both the glaciological and geodetic methods (Table 2). Mean annual Ba has been more negative in recent years than in the past, being −0.15 ± 0.13 m w.e. a–1 for 1955–1978, −0.10 ± 0.03 m w.e. a–1 for 1978–2005, and −0.64 ± 0.09 m w.e a–1 for 2005–2015 (glaciological Ba).
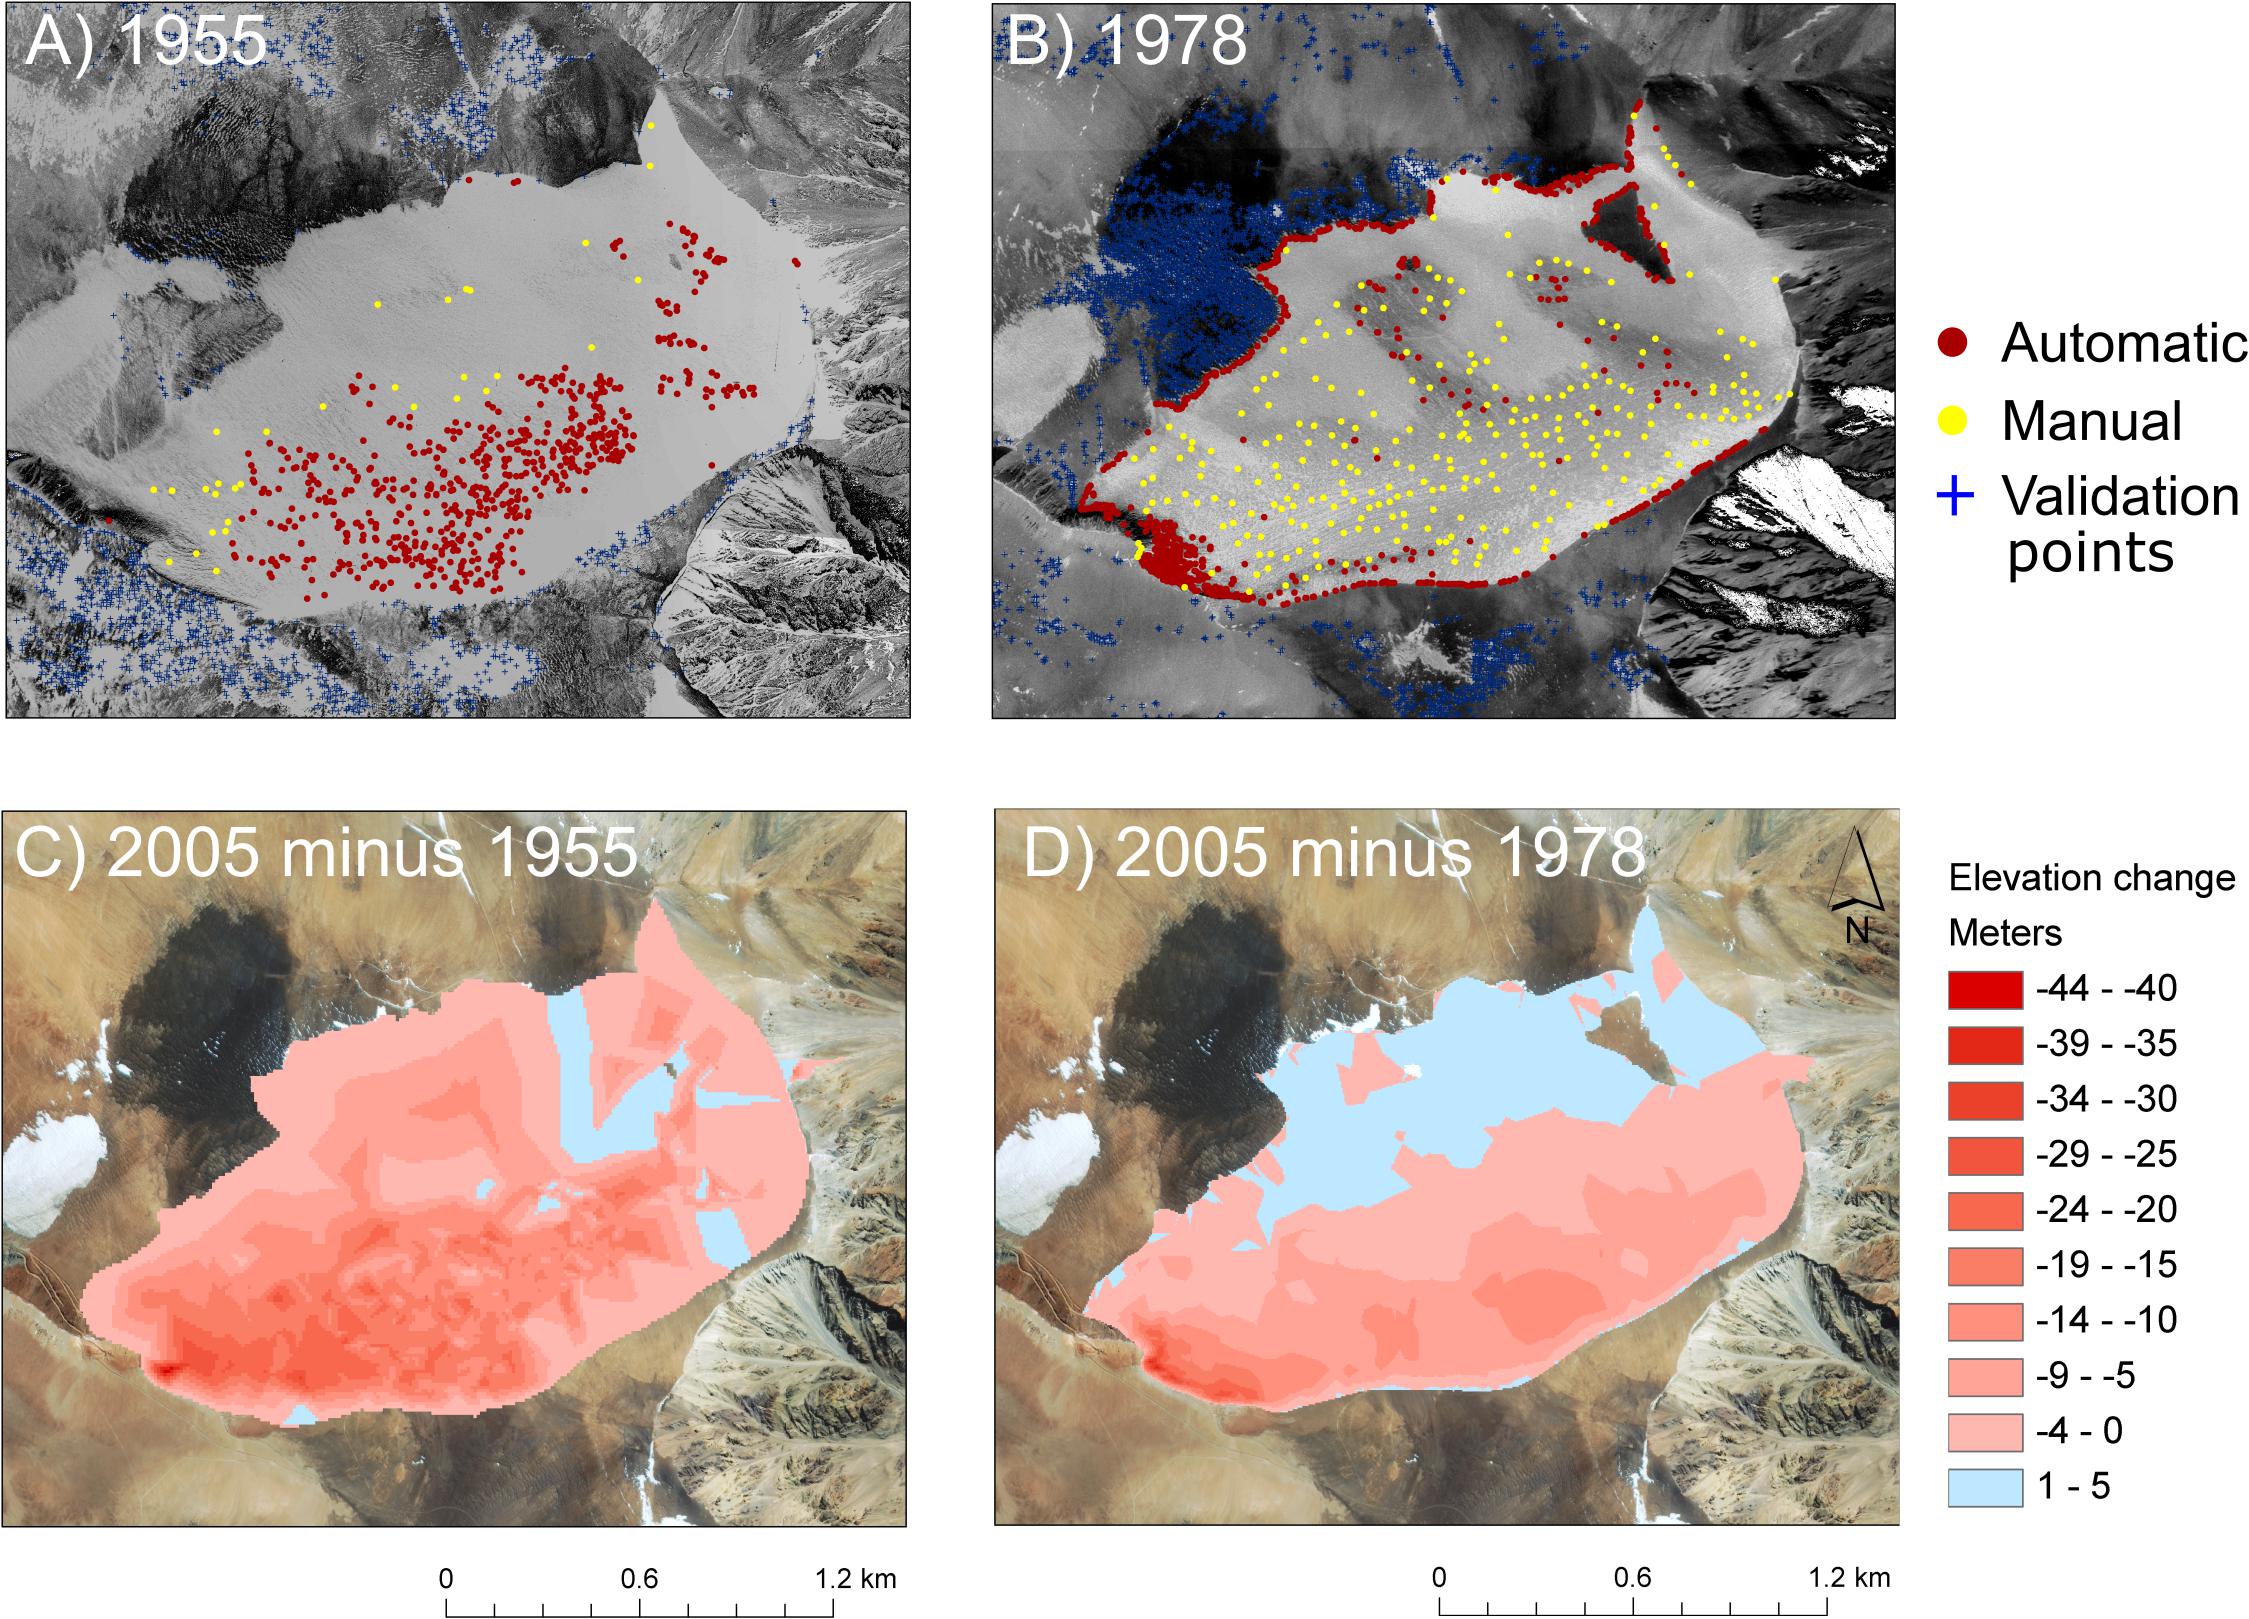
Figure 5. Historical elevation changes on Guanaco Glacier for 1955-2005. (A) 1955 air photo showing elevation values extracted automatically (red dots) and manually (yellow dots), as well as validation points outside the glacier (blue crosses). (B) Same as (A) but for the 1978 aerial photo. (C) Elevation changes between 1955 and 2005. (D) Elevation changes between 1978 and 2005.
Ice Core Stratigraphy
The 113-m long ice core recovered from the lower Guanaco Glacier confirmed previous GPR thickness estimates and the absence of liquid water within, or at the base of the glacier. Temperature profiles measured in the borehole show that Guanaco Glacier is a cold glacier which had a basal temperature of ca. −5.5°C in 2008 (Figure 6). The profile is negative from the base up to a depth of 60 m, in accordance with typical borehole temperature profiles, which is related to the geothermal flux (Cuffey and Paterson, 2010). The ‘warm reversal’ above 60 m has been observed in other Andean glaciers and may be related to recent atmospheric warming (Vimeux et al., 2009). Seasonal temperature fluctuations are apparent down to ca. 20 m, where the average ice temperature is −6.3°C. However further interpretation of the temperature profile is complicated by the fact that the borehole intersects inclined isochrones (Figure 1D), so that the ice may have been deposited at different locations up-glacier and then advected down-glacier. The temperature profile thus likely contains flow-inherited temperature effects related to the varying elevation of snow deposition and melt-refreeze cycles.
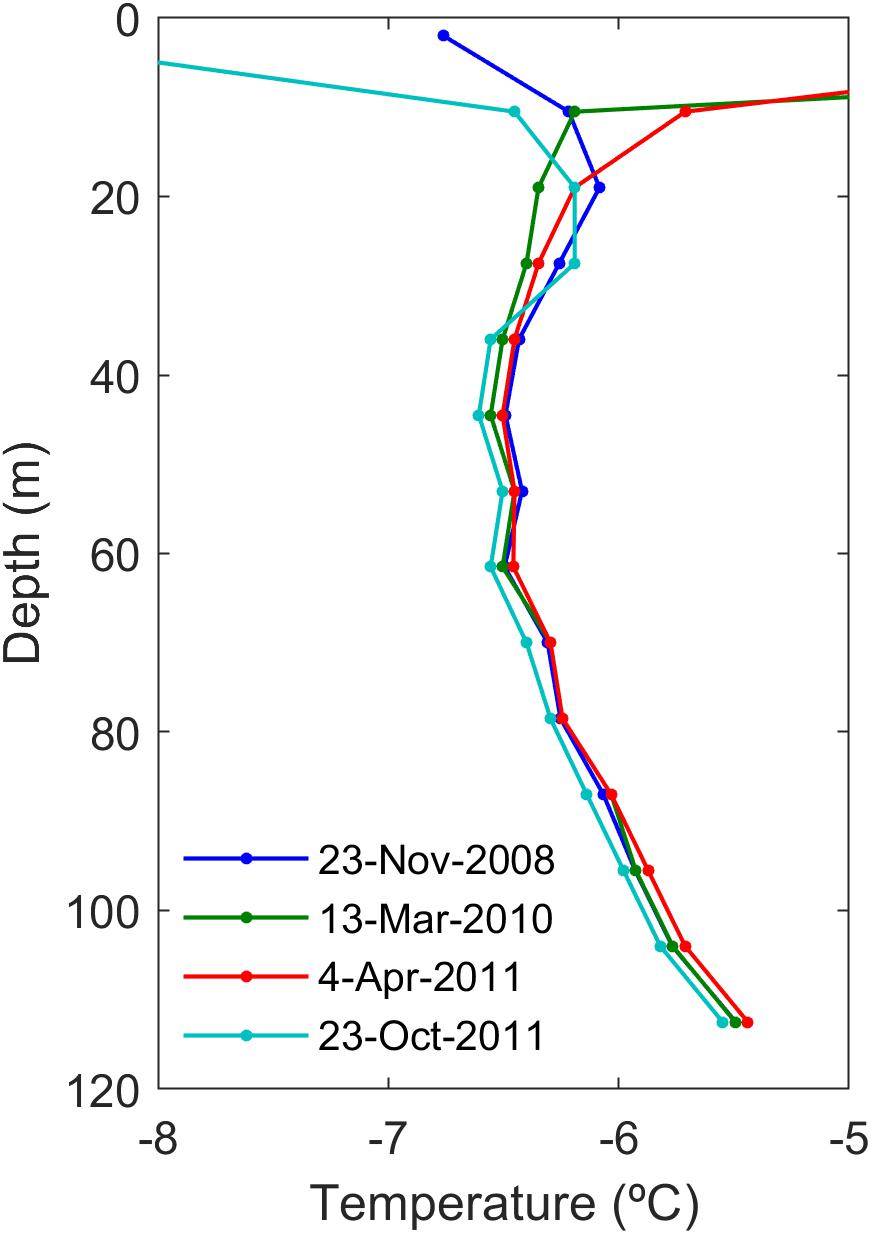
Figure 6. Temperature profiles measured in the Guanaco Glacier borehole.
The ice core stratigraphy for the uppermost 20 m is presented in Figure 7. The density varies between 0.86 at the surface to 0.89 at 20 m. Several melt features were observed throughout the top 20 m of the core. Interestingly, the dip angle of the best visible features varies significantly, between 40 and 73° (median = 61°). The fact that the range of dip angles is much larger than the maximum dip angles (20°) of the GPR isochrones near the drill site, which follow the bedrock topography (Figure 1D), and the significant scatter in dip angle values suggest that the angles are not depositional features. Instead, we interpret them to represent penitents developed at the glacier surface and succinctly buried. An example of these ‘paleo penitents’ is shown in Figure 7D. Penitents up to 50 cm-high are commonly found today around the drill site (Figure 8). Penitents form by differential ablation caused by the concentration of solar radiation in depressions, enhanced by the accumulation of debris, reduced wind and increased humidity between the penitent blades (Lliboutry, 1954; Bergeron et al., 2006; Lhermitte et al., 2014). Melting occurs in the penitent troughs, and we have observed that much of the meltwater refreezes there at the end of summer. Penitents are broadly aligned east-west and are inclined toward the sun at zenith. Naruse and Leiva (1997) measured slopes between 60 and 85° for the southern face of penitents on Piloto Glacier in Argentina. These values are consistent with the dip angles observed in the Guanaco ice core. The melt fraction is quite high (0–0.90, mean = 0.28), and variable (std = 0.29) and a broad increase in melt fraction with depth is noted. This trend parallels that seen in the density, but both variables are otherwise uncorrelated (r = 0.16 after applying a first-difference filter).
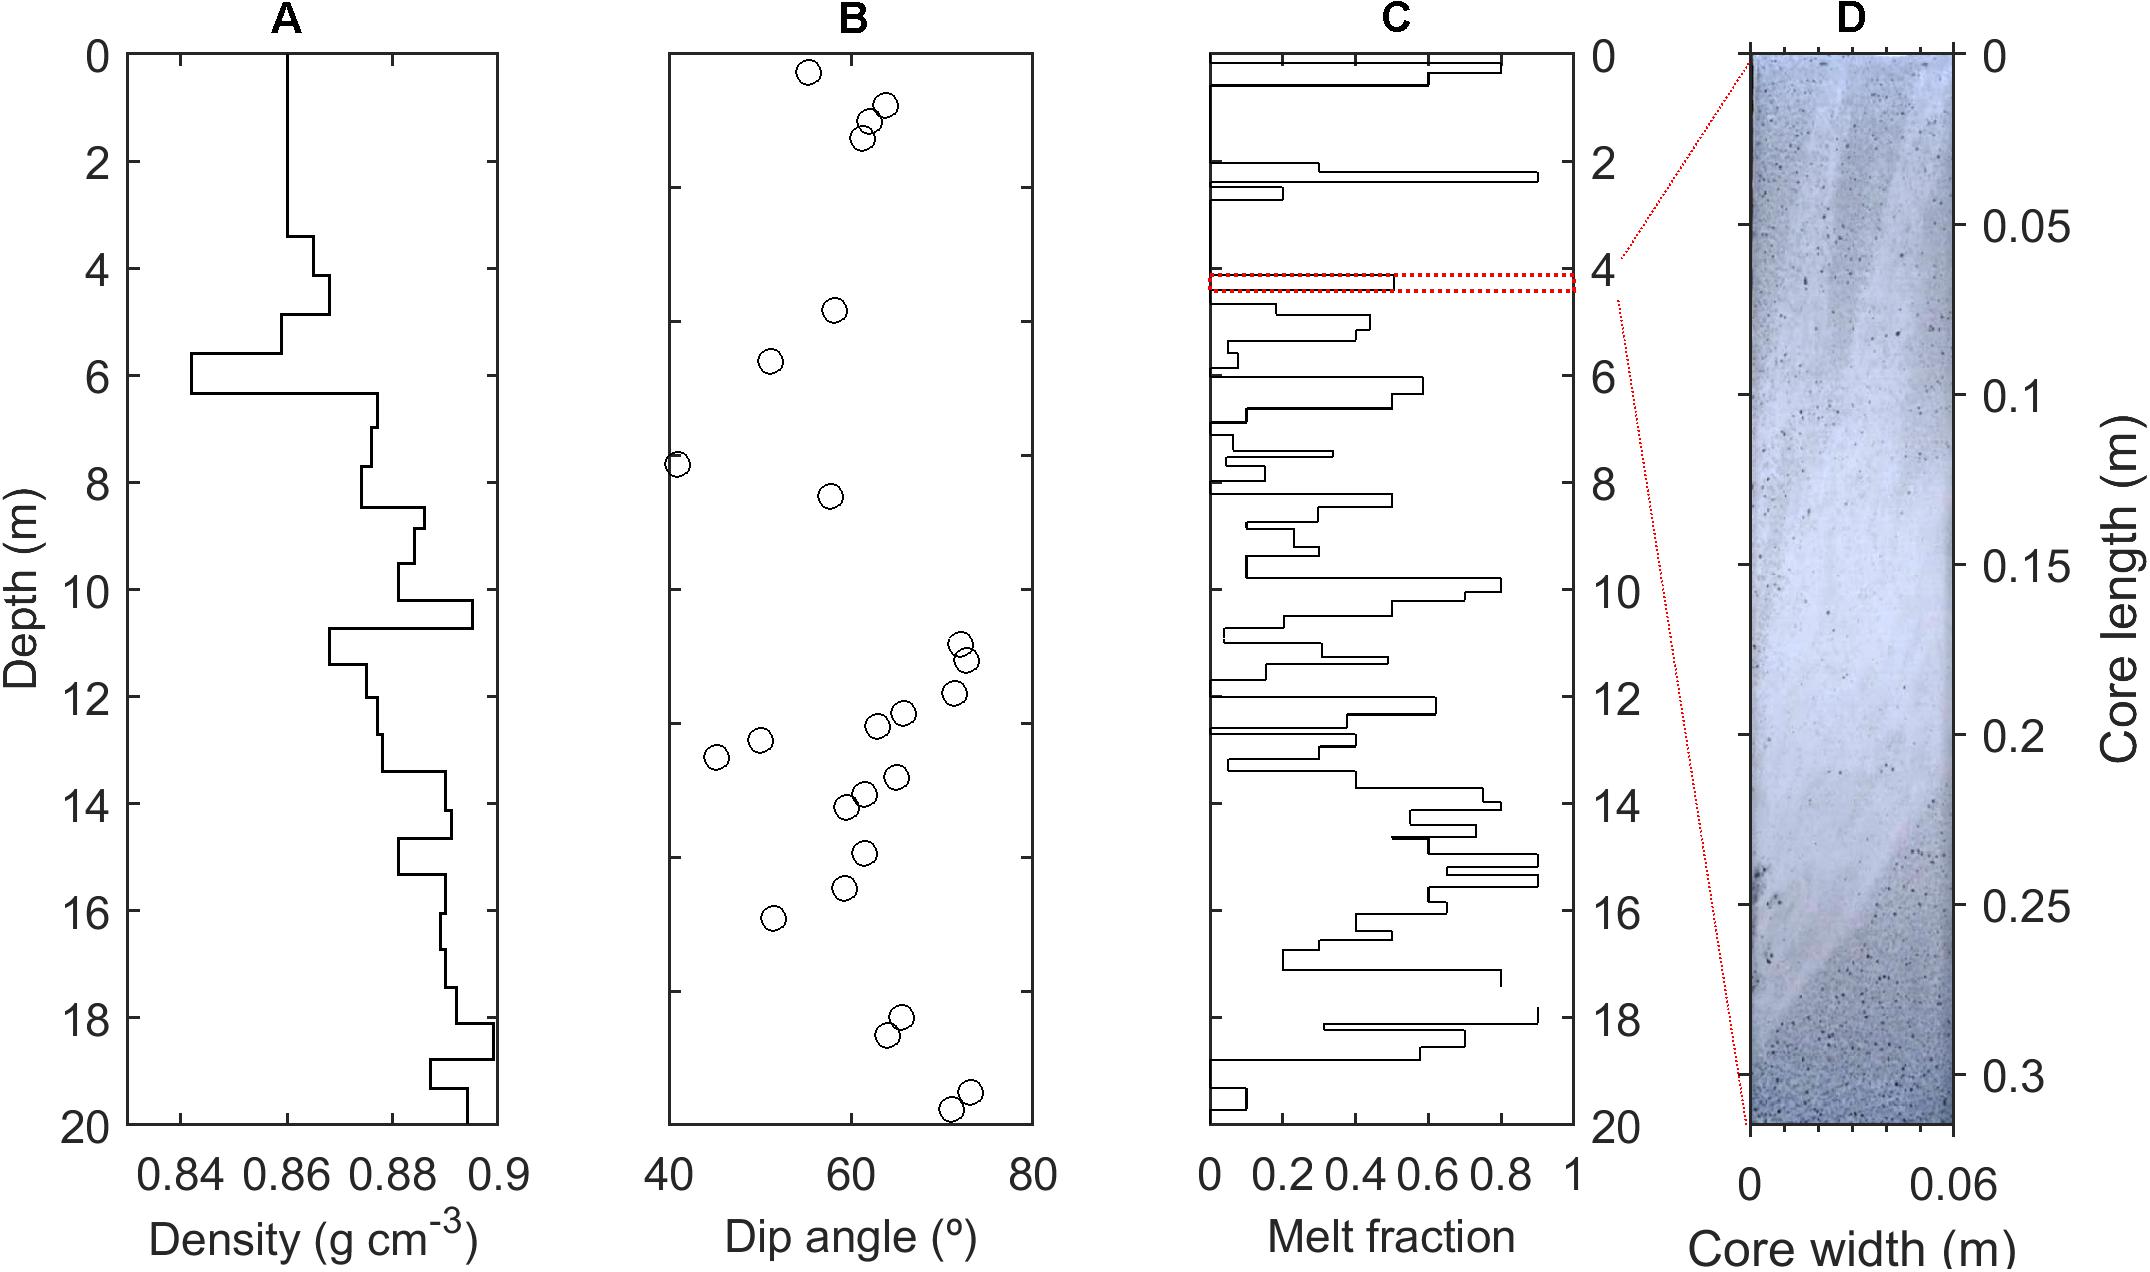
Figure 7. Visual stratigraphy for the top 20 m of the ice core. (A) Density; (B) dip angles of melt features; (C) melt fraction; the red rectangle shows the location of the core shown in (D); (D) example of melt feature reminiscent of penitent morphology.
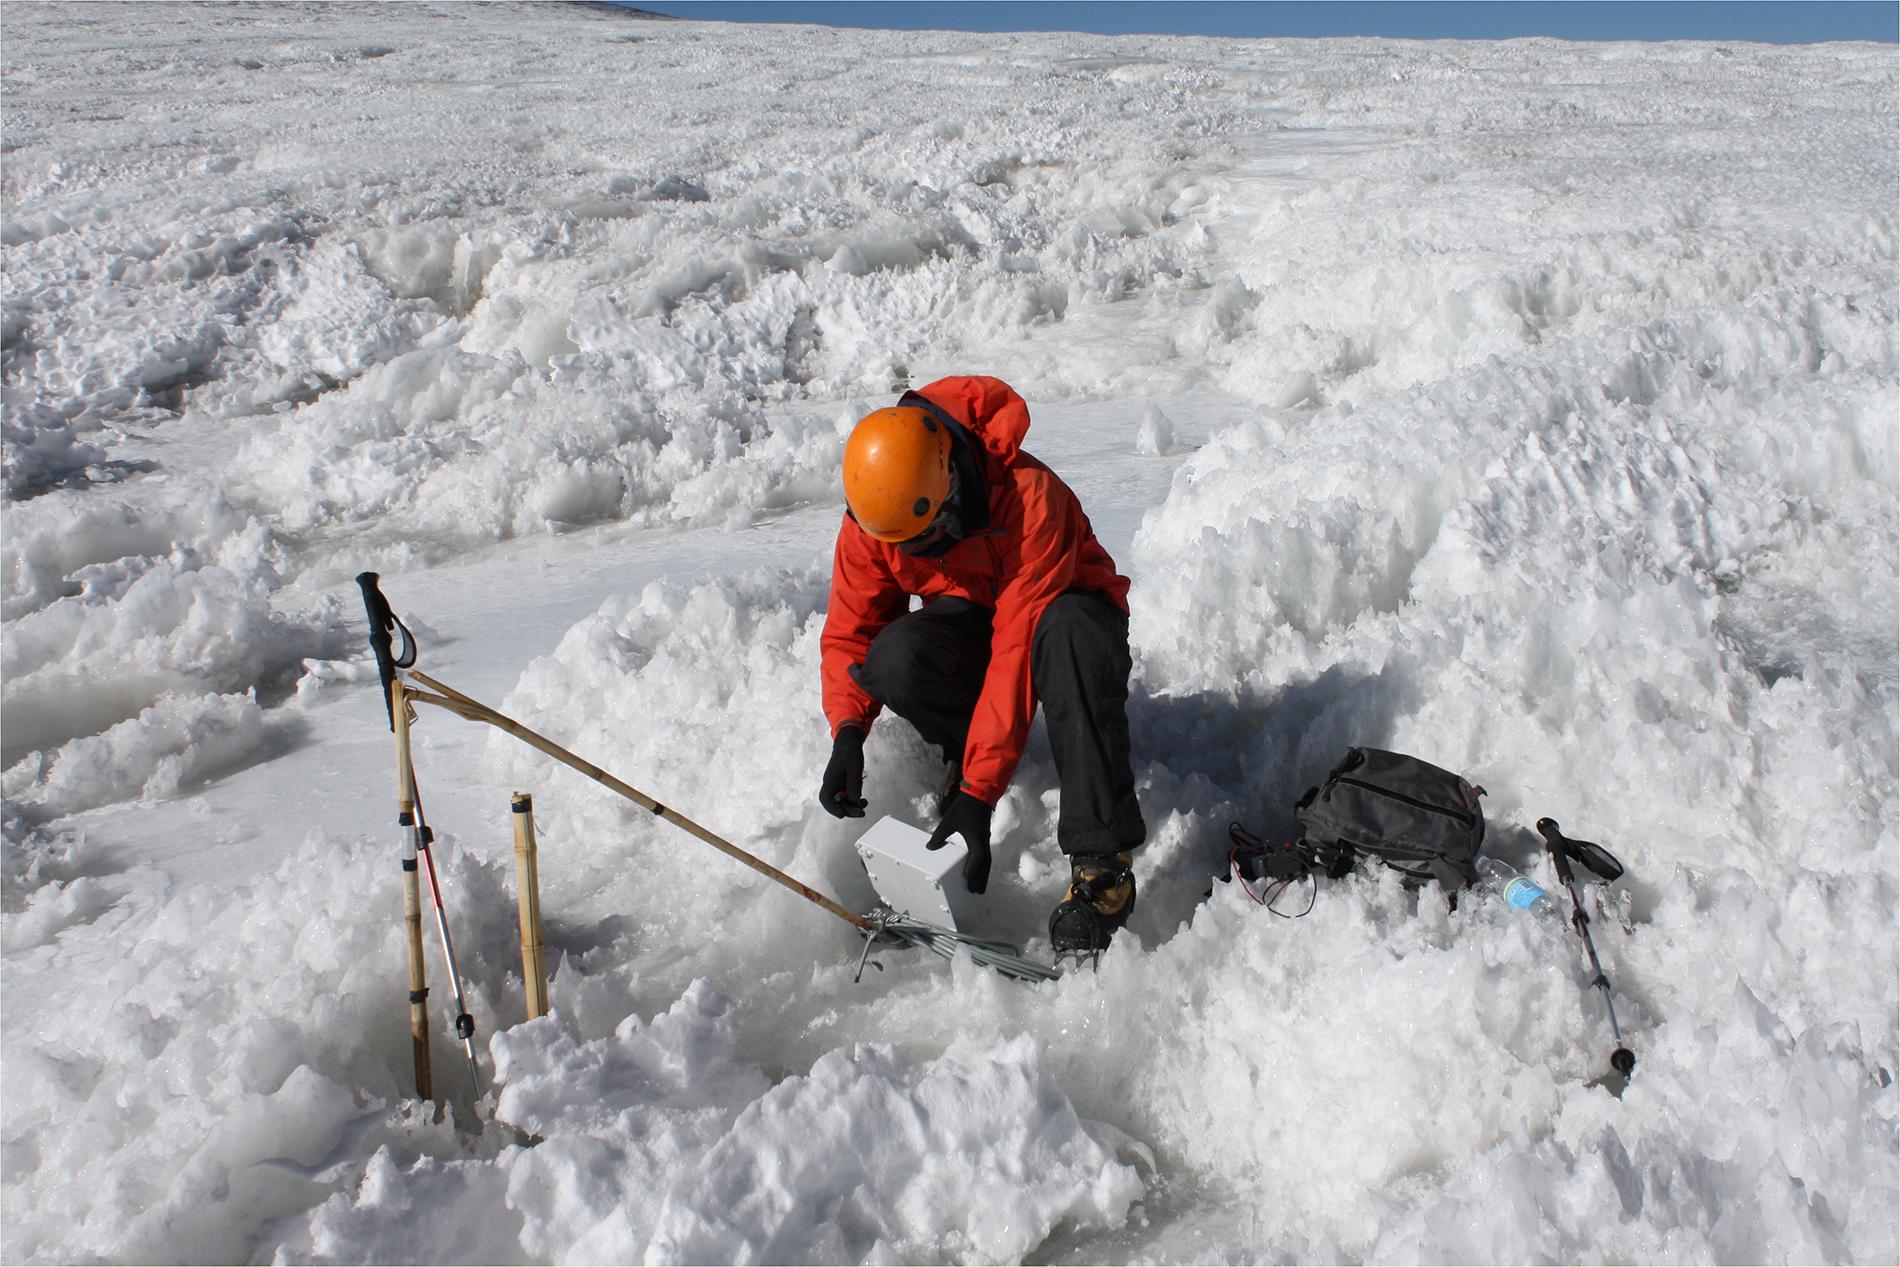
Figure 8. Photograph of Guanaco Glacier at the ice coring location, showing the presence of small penitents on the surface (March 12, 2010).
Ice Core Relative Dating
The average 3H concentration measured in surface snow was 4.69 ± 0.38 TU, which is compatible with values for recent precipitation (Cauquoin et al., 2015). In contrast, ice samples all had near zero 3H concentrations, which indicates that the ice formed before 1945 AD (see Supplementary Table 3). This conclusion is confirmed by the concentration of 137Cs measured along the top 20 m of the core, which was found to be below the detection limit (0.011 Bq/kg), or undetected. Furthermore, 210Pb was also undetected throughout the first 20 m of the core, despite the low detection limit (0.052 Bq/kg) used. These results indicate that the current glacier ice surface is more than 100 years old. This represents a minimum limit on the age of the upper ice core and more accurate absolute dating is not possible at this point.
Ice Core Stable Water Isotopes
The stable water isotopes (δ18O and δ2H) profiles show well defined cycles (Figure 9A). The profiles are generally smooth, but a few sharp transitions occur, e.g., at a 13 m w.e. depth. The amplitude of the isotopic cycles (3–5‰ for δ18O; 20–40‰ for δ2H) is similar to that seen in surface snow on nearby Tapado Glacier (Sinclair and MacDonell, 2016) and is thus interpreted to correspond to an annual signal. The same periodicity is visible in the deuterium excess series (Figure 9B). Spectral analysis of the δ18O profile based on the continuous wavelet transform (Torrence and Compo, 1998) confirms the presence of significant power along the 0.5–3 m w.e. spectral band which is significantly different from autocorrelated (red) noise (Figures 9C,D).
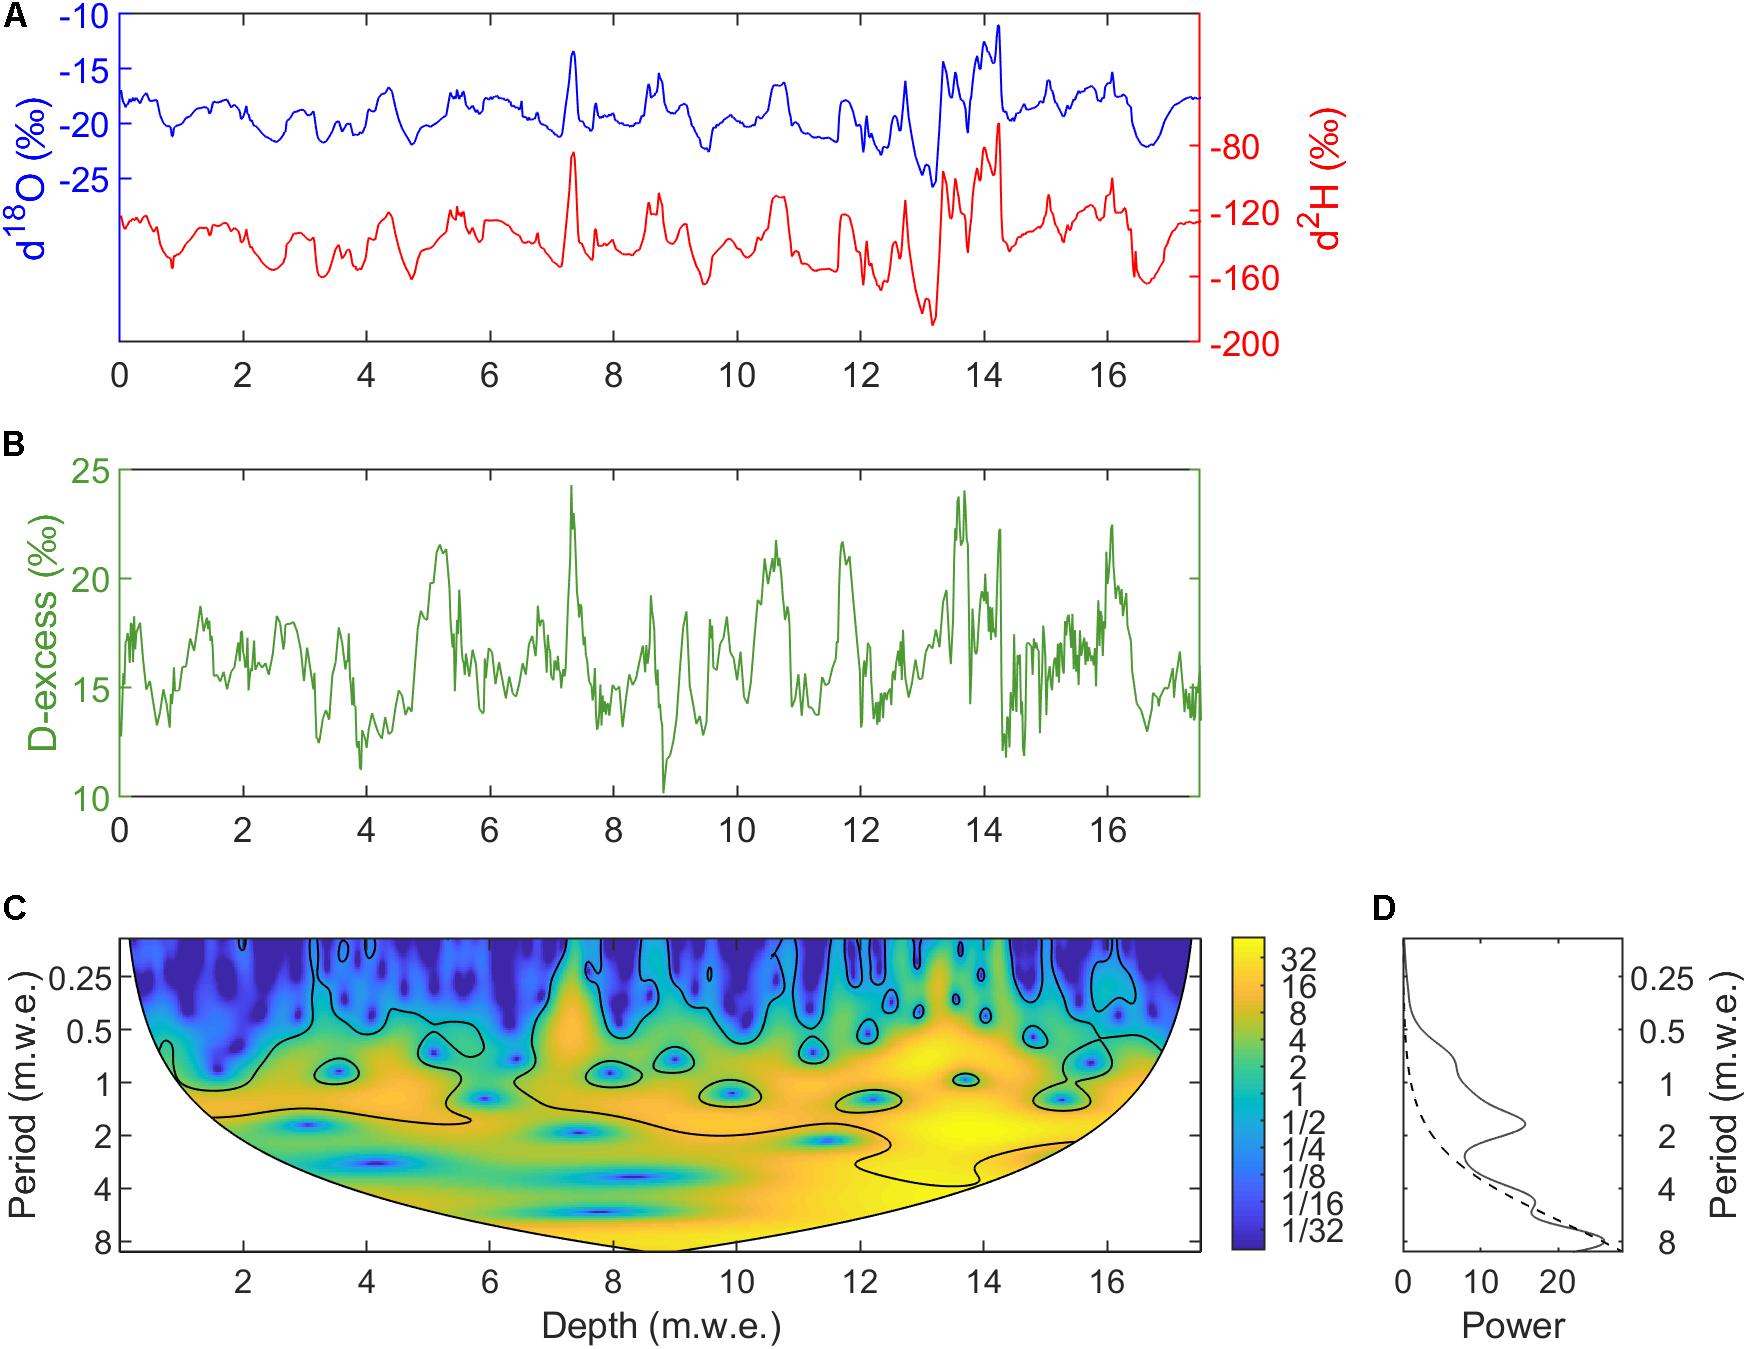
Figure 9. Stable isotope profiles for the topmost 20 m of the Guanaco Glacier ice core. (A) δ18O and δ2H; (B) Deuterium excess; (C) Wavelet power spectrum of the δ18O series. Black contours delineate the 95% significance level against a red-noise (AR1) model with lag1 correlation r = 0.9; (D) mean wavelet power spectrum; stippled line shows the 95% significance level.
Stable isotopes of precipitation contain mixed information reflecting notably the temperature at the time of precipitation formation (condensation), the geographic location and meteorological conditions prevailing at the source of atmospheric humidity, and the amount of precipitation lost during air mass transport. When the moisture source, rainout rates and air mass pathway can be assumed constant, stable water isotopes are good proxies for the local air temperature, such as commonly used at high latitude sites (Dansgaard, 1964). However, this temperature control breaks down for low latitudes, where cloud systems are dominantly of convective character and the influence of surface or near-surface temperature on the formation of precipitation decreases. Hence variations in Andean ice core isotopic signals are generally thought to predominantly reflect atmospheric circulation (Hoffmann et al., 2003; Vimeux et al., 2009). On nearby Tapado Glacier, seasonal cycles in chemical and isotopic profiles were interpreted to arise from changing moisture sources: during the austral winter the westerly circulation brings cold air masses from the Pacific Ocean which carry most of the annual precipitation, while episodic convective storms in summer bring humid air masses from the Amazon Basin (Ginot et al., 2006). The same mechanism holds here. Post-depositional processes can also strongly modify the isotopic signal originally imprinted in snow. Sublimation in dry climates can induce a relative enrichment of the isotopic composition of surface snow. The deuterium excess, which characterizes the deviation from the global meteoric water line [d (‰) = δ2H – 8 × δ18O], is an indicator of non-equilibrium phase changes characteristic of post-depositional processes. It is particularly sensitive to the relative humidity which governs these processes (Whillans and Grootes, 1985). Stichler et al. (2001) showed that sublimation on the summit of Tapado Glacier leads to a progressive enrichment of δ18O and a decrease in d at the surface. However, the isotopic enrichment was limited to the first 5-10 cm of the snow and the enriched layers became preserved after being buried by the next snowfall. These disturbed layers showed as anomalous points on a δ2H – δ18O scatter plot (Stichler et al., 2001, their Figure 6). Similar sublimation-induced enrichment of stable isotopes was observed at the surface of penitents at the beginning of the ablation season in the ablation zone of Tapado Glacier (Sinclair and MacDonell, 2016). Later in summer, melting tended to smooth the original isotopic profile. The linear relationship between δ2H and δ18O values for Guanaco is strong and without anomalous deviations (Figure 10), indicating that all precipitation events arose from well-defined and replicable meteorological processes. The high slope of the local meteoric line (8.49) and the relatively high d values (mean d = + 16.4 ± 2.3‰), as well as a positive correlation between δ18O and d, indicate that precipitation can include a regular contribution of re-evaporated continental surface water on a seasonal basis (Putman et al., 2019). The fact that d is always larger than 10‰ (corresponding to the global meteoric water line) suggests that the profile along the first 20 m of the core was not significantly affected by post-depositional sublimation processes.
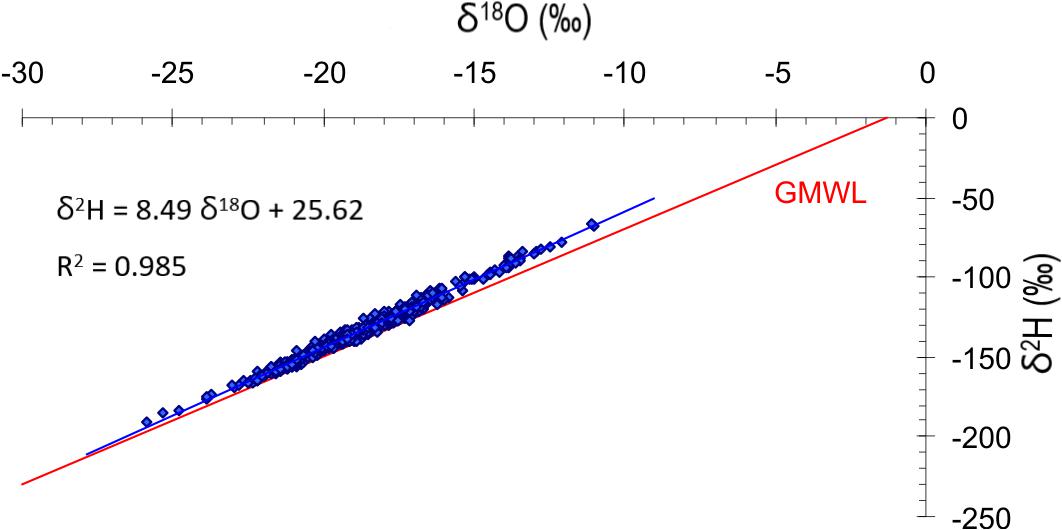
Figure 10. Local (blue) and global (red) meteoric water line calculated from the Guanaco ice core.
Melting, percolation and subsequent refreezing of meltwater tend to smooth and redistribute the isotopic signal, sometimes obliterating completely any seasonal signal originally present (Koerner, 1997; Schotterer et al., 2003). Several studies have looked at the effect of melting on isotopic and chemical signals of melt-affected ice cores. Grumet et al. (1998), Pohjola et al. (2002), Moore et al. (2005), and Kinnard et al. (2008) all found that although melting affects the isotopic and chemical record of ice cores, annual to biannual cycles are still detectable. As opposed to major ions, stable water isotopes are the least affected by melting and seasonal cycles are still observed provided that refreezing of meltwater occurs within the annual layer (Pohjola et al., 2002). Melting can be seen to have affected the integrity of the isotopic signal in Figure 7. The broad increase in melt fraction with depth is associated with sharper transitions in the stable isotope series and a blurring of the cyclicity (Figure 9). The significant spectral band in the δ18O record, assumed to be of seasonal origin, is seen to spread toward larger periods between 12 and 16 m w.e. depths. We interpret this as an indication for possible percolation and refreezing beyond the depth of annual deposition, which smooths the annual cycle signal (Grumet et al., 1998). Despite this, melting does not seem to have completely obliterated the dominant cyclicity in the signal. Detailed analysis of the wavelet spectrum in Figure 9 shows a first power band peak centered around 0.7 m w.e. and a second one around 1.7 m w.e., perhaps representing an annual/biannual signal. However, given the likelihood for melting to have displaced the original seasonal peaks, deriving a precise annual accumulation rate from seasonal cycles is not possible, and only a range (0.5–3 m w.e. a–1) can be inferred.
Recent Glacier-Climate Relationships
While the spatial variability of annual mass balance (ba) is mainly controlled by summer mass balance conditions, interannual variability in glacier-wide annual mass balance (Ba) was found to be predominantly driven by winter conditions (Table 1). This is also shown by correlations between Ba and climate variables (Table 3), which display the highest correlation with precipitation but no relationship with air temperature, contrary to most glaciers in temperate zones (Hock, 2005; Cuffey and Paterson, 2010). On the other hand Ba was found to be significantly correlated with the vapor pressure deficit and wind speed, which are two important drivers of sublimation (Kull et al., 2002; Stigter et al., 2018). Sublimation is currently the dominant ablation process on Guanaco Glacier (MacDonell et al., 2013), a peculiarity of high-latitude glaciers and snow cover in the Arid Andes (Ayala et al., 2017; Réveillet et al., 2020). P and VPD were found to be the best combination of predictors of Ba variability on Guanaco Glacier (r2adj = 0.90, p < 0.05, Table 3). The positive influence of VPD on Ba suggests that increased sublimation during drier conditions limits mass loss by melting, due to the large quantity of latent heat consumed by sublimation. Conversely, wetter conditions will increase accumulation but also decrease sublimation, favoring more efficient mass loss by melting due to its much smaller latent heat consumption. As such, sublimation acts as a negative feedback on Ba because of its control on mass loss from melting.
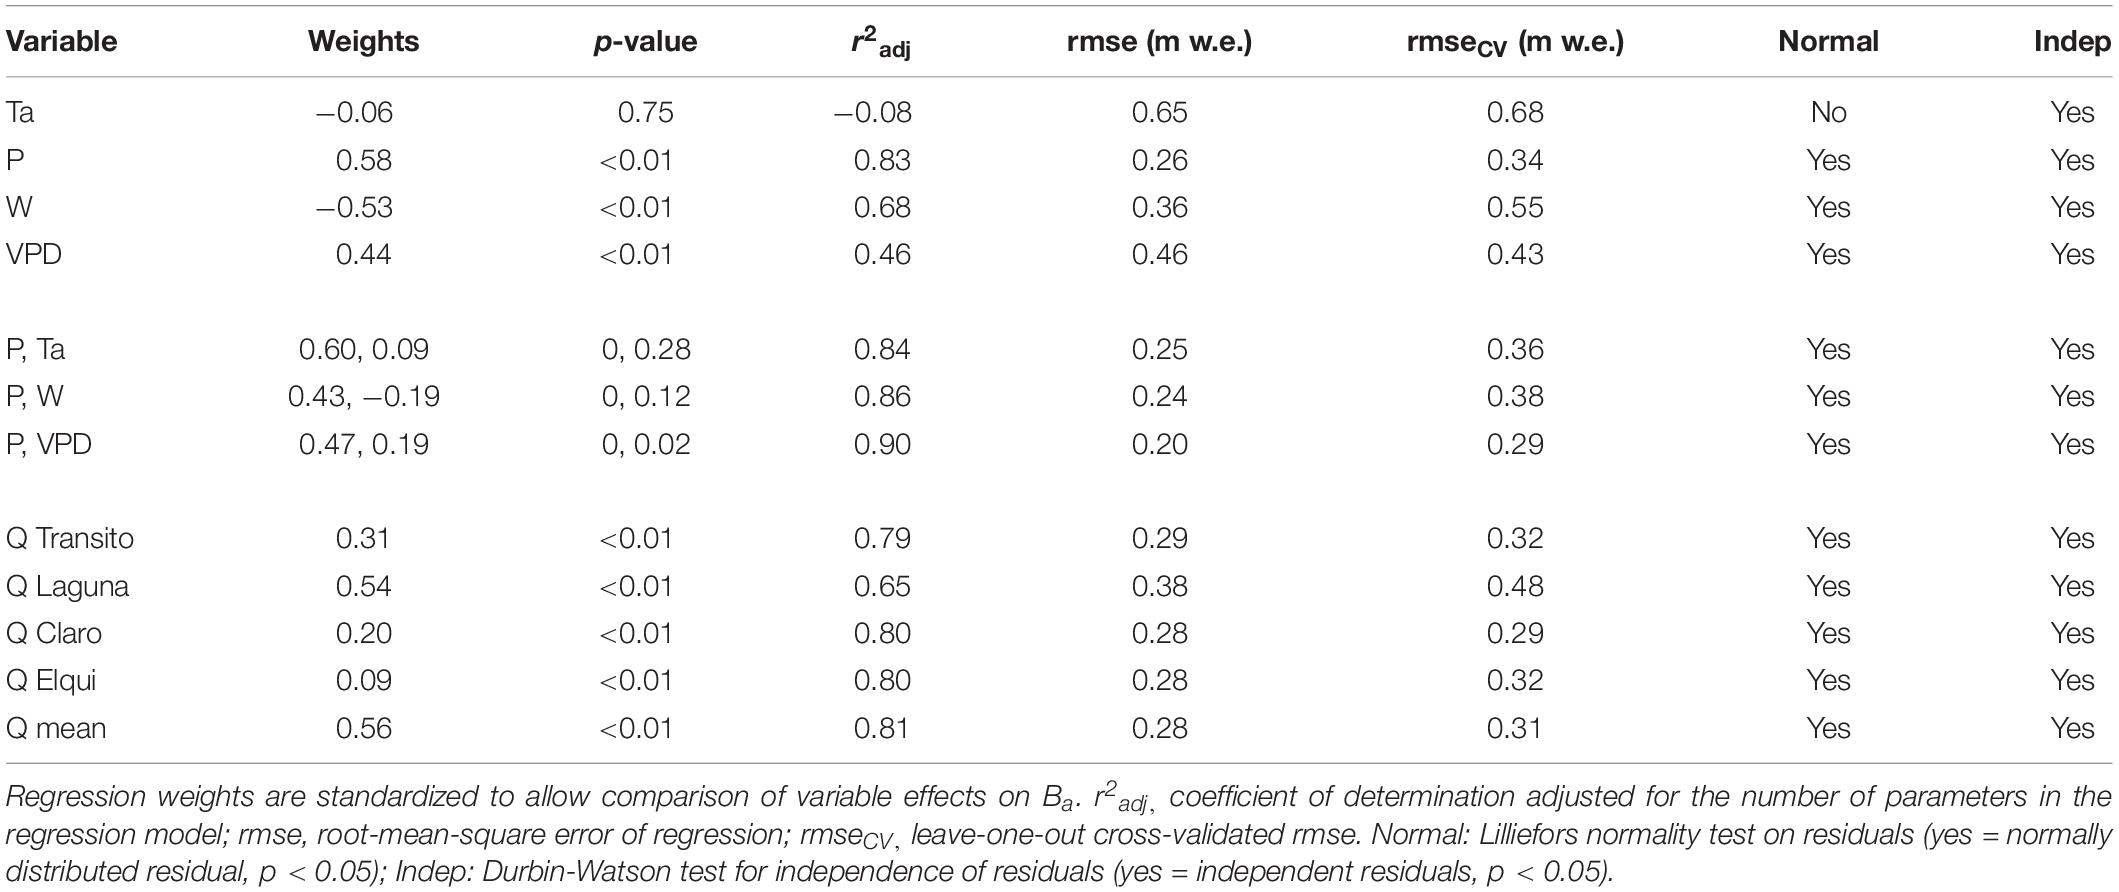
Table 3. Linear regression between climate variables (Ta, P, W, VPD), streamflow (Q) and annual mass balance (Ba).
The little sensitivity of Ba to air temperature found in this study is consistent with the previously documented notion that the sensitivity of mass balance to temperature decreases in colder and drier climates (Kaser, 2001; Oerlemans, 2001; Cuffey and Paterson, 2010). As Guanaco Glacier lies above the 0°C isotherm, air temperature has little influence on the precipitation phase while sublimation limits the influence of temperature on melting. Rupper and Roe (2008) also showed that glaciers in central Asia with low precipitation and higher sublimation rates are less sensitive to temperature. In South America, Sagredo et al. (2014) showed that the glacier equilibrium line altitude (ELA) in the subtropical Andes is the least sensitive to temperature, and most sensitive to precipitation, consistent with the cold and dry climate conditions of that region (Sagredo and Lowell, 2012). More recently, Dussaillant et al. (2019) derived geodetic mass balance estimates for 2000–2018 for the whole Andes Cordillera based on ASTER stereoscopic imagery. They showed that the dry Andes had the smallest mass loss rates (-0.28 ± 0.18m w.e.a–1), but that mass loss increased from slightly positive in 2000–2009 to a strongly negative mass balance in 2009–2018, a trend attributed to the recent prolonged drought conditions in North-Central Chile (Garreaud et al., 2019). These findings show again the peculiarity of the cold and dry glaciers of the dry Andes where humidity, rather than air temperature plays a key role in the mass balance response to climate.
Historical Mass Balance and Climate Conditions: Observations
Glaciological and geodetic mass balance estimates show that Guanaco Glacier has been predominantly losing mass since at least 1955, and that mass loss has accelerated over time (Table 2). Mass loss rates during the most recent period (2005–2015: −0.64 ± 0.09 m w.e. a–1) are five times higher than during the 1955–2005 period (−0.13 m ± 0.06 w.e. a–1). Few long mass balance records exist in the region to compare with these results. The longest record comes from Echaurren Norte Glacier (33.58°S), in the central Andes where the climate becomes more Mediterranean. Its cumulative mass balance has been relatively stable since 1975, until 1993 when it started decreasing until today (Escobar et al., 1995; Masiokas et al., 2016). In the Argentinean Andes, the mass balance of Piloto East Glacier (32°S) broadly followed the same trend, with approximately neutral balance until 1993 followed by a negative balance (Leiva et al., 2007). Our results broadly agree with these trends, however with slightly negative mass balance during 1978–2005 (−0.10 ± 0.03 m w.e. a–1) but increasing mass loss subsequently.
Ice core conditions on the other hand suggest drastically different mass balance conditions, with net accumulation rates of 0.5–3 m w.e. a–1 inferred from the stable isotope record (Figure 9), relatively high melting rates inferred from the significant proportion of refrozen ice in the core (Figure 7) and reduced sublimation inferred from small deuterium excess values (d) (Figure 10). Penitents occur on the present surface (Figure 8) and in the core (Figure 7). The formation of penitents is partly conditioned by microclimatic conditions: sublimation predominantly occurs on the wind-exposed tips while higher air humidity promotes melting and deepening of the sheltered troughs (Lliboutry, 1954). However the first-order process for the formation of penitents is not sublimation, but rather the focusing effect of solar radiation in depressions at high incidence angles (Cathles et al., 2014), a phenomenon favored at low latitudes and in clear atmospheric conditions such as in the Desert Andes. Hence penitents were also present under the more humid climate inferred from the ice core.
When did these humid climate conditions occur and when did the ice of the upper core form? Our radioactive isotopes measurements in the upper core show that the modern (2008) glacier surface is at least 100 years old. In addition, the ice core density profile (Figure 7) shows the presence of residual firn at the end of the compaction cycle, during which ice density increases slowly from the compression of air bubbles by creep of the surrounding ice (Ginot et al., 2006; Cuffey and Paterson, 2010). The absence of younger and more porous firn above suggest it has completely ablated. On nearby Tapado Glacier, ice has accumulated continuously until at least 2001, when a 36 m surface-to-bedrock was retrieved from the summit (5536 m a.s.l, 30.13°S, 69.92°W) (Ginot et al., 2006). The age at the bottom of the continuous accumulation sequence in the Tapado ice core was dated to 1920 AD, below which older, but undated ice was found separated by a hiatus. Annual accumulation since 1920 AD varied between 0.1 and 1.03 m w.e. a–1 with a mean of 0.32 m w.e. a–1. The time span for the continuous accumulation of firn and its transformation to ice on Tapado Glacier (1920–2001: 81 years) is the closest analog for the time span of the missing firn on Guanaco Glacier. This figure is on the same order, but still smaller than the minimum age for the 2008 surface derived from radioactive isotopes (>100 years). Further South, a 104 m ice core was recovered in 2005 from La Ollada Glacier on Cerro Mercedario (31.97°S, 70.12°W, 6100 m a.s.l.), covering 92 years (1913–2004) of continuous accumulation varying between 0.3 and 1.8 m w.e. a–1 (mean = 0.91 m w.e. a–1) (Ciric et al., 2010). Hence, climate conditions since the early 20th century have allowed continuous accumulation on Cerro Mercedario and Cerro Tapado, both located south and higher than Guanaco Glacier, but have resulted in mass loss on Guanaco Glacier.
Historical Mass Balance and Climate Conditions: Stochastic Reconstructions
In order to further our understanding of historical mass balance variability, the annual and cumulative mass balance of Guanaco Glacier was reconstructed back to the early 20th century using the statistical models developed in Table 3 and the methods outlined in Section “Mass Balance Climate Interactions and Reconstructions” (see further details in Supplementary Material). The use of climate and streamflow records not located in the immediate vicinity of the glacier calls into question their representativity to reconstruct mass balance. The La Laguna winter precipitation record was found to be well correlated with the local snow record at Pascua-Lama (r = 0.90, p < 0.01, n = 13 years) as well as with the El Indio snow precipitation record (r = 0.89, p < 0.01, n = 23 years) (see Figure 1 for locations), confirming the spatial coherence of winter precipitation in this region of the Desert Andes. On the other hand, streamflow records in the Norte Chico region are good proxies of net snow precipitation (precipitation minus sublimation) (Favier et al., 2009), which makes them ideal to reconstruct the precipitation-sensitive glacier mass balance. Ba was found to be significantly and positively correlated (r2adj 0.65–0.80, p < 0.01) with the four long streamflow records in the upper Huasco and Elqui catchments (Table 3). The best correlation (r2adj = 0.81, p < 0.01) was obtained on a composite series of these four records (Q mean, Table 3). The composite record is itself well correlated with each individual record (r = 0.93–0.96, p < 0.01), confirming the presence of a strong, precipitation-based signal in headwater catchment outflows.
The model based on winter precipitation (P) and vapor pressure deficit (VPD) as predictors can only be forced using the VPD climatology, as La Frontera station is in operation since 1999, with reliable humidity data since 2002 only. Hence the model was forced with P measured at La Laguna since 1965 and the mean VPD ± one standard deviation (std) over the 2002–2015 period in order to check the sensitivity of the reconstructed Ba to VPD. Using the mean or low (mean − std) VPD yields a poor fit on geodetic balance estimates, while the fit improves when using the higher (mean + std) VPD estimate (lower blue curve on Figure 11B). This suggests that higher VPD prevailed prior to 2002 compared to more recent conditions (2002–2015). It also shows the feedback effect of air humidity on Ba at Guanaco Glacier: while higher precipitation increases Ba, a lower VPD during more humid years could favor mass loss by melting and as such decreases Ba.
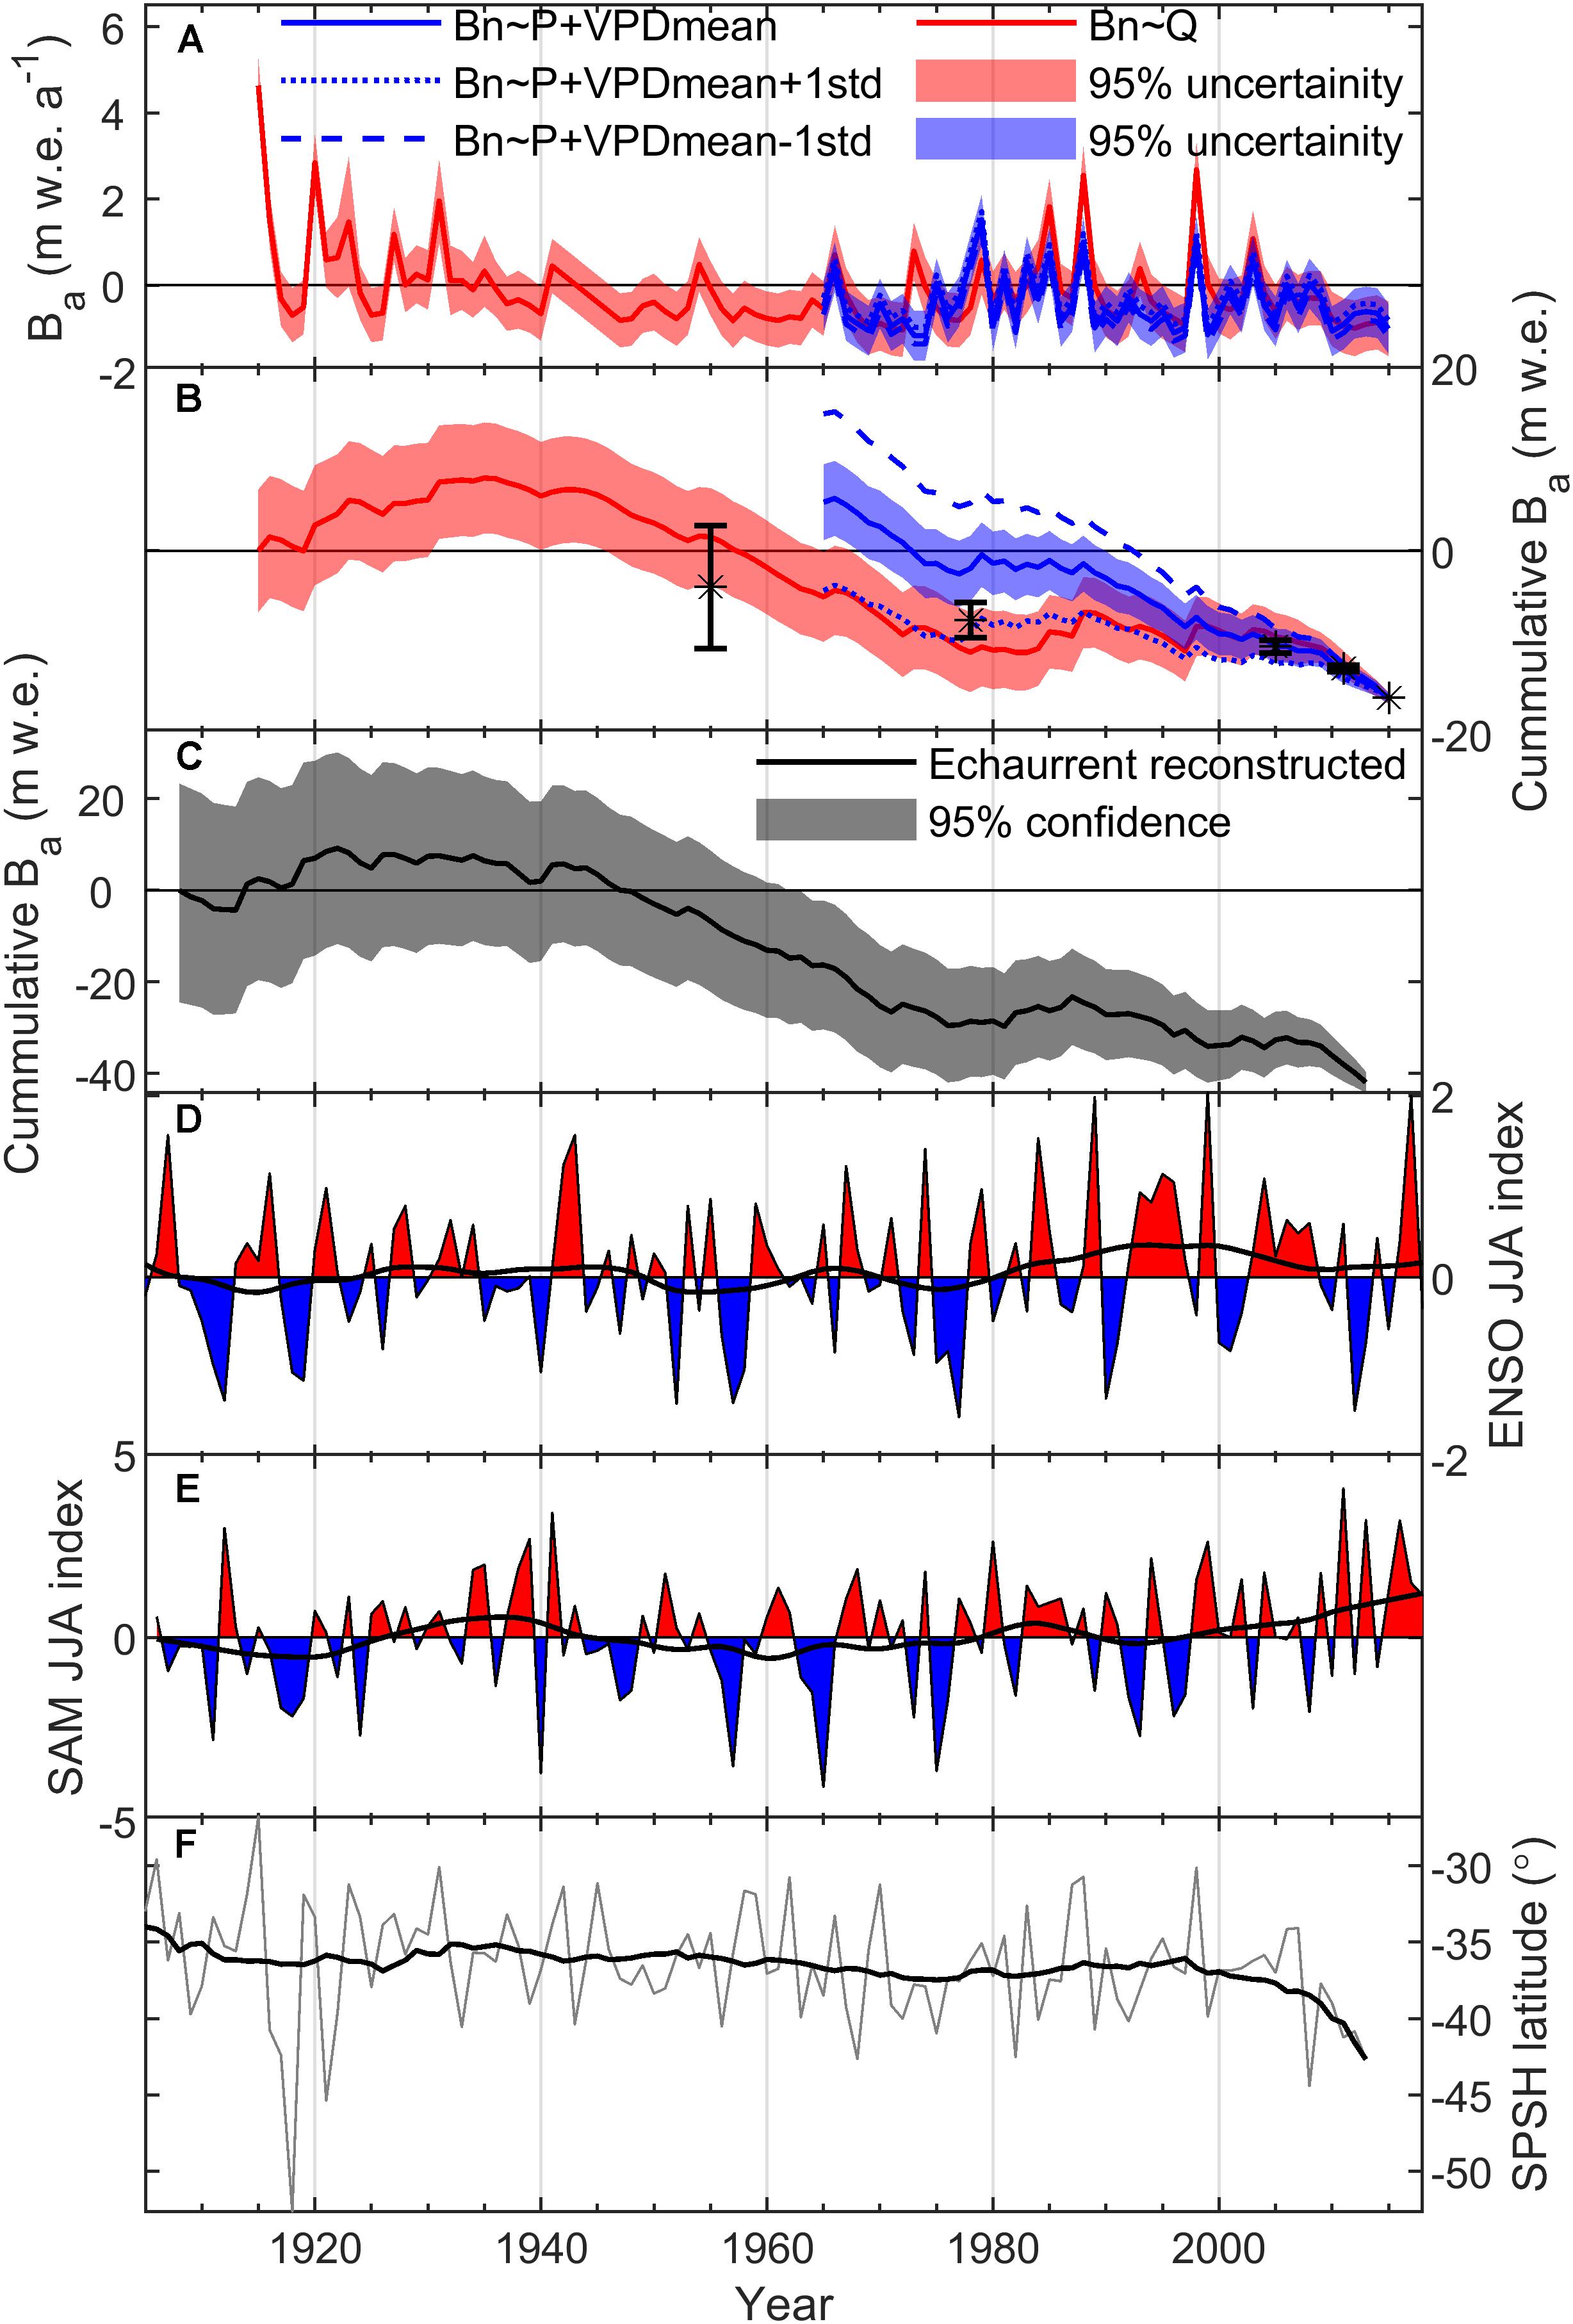
Figure 11. Reconstructed mass balance of Guanaco Glacier. (A) Annual mass balance reconstructed from precipitation and vapor pressure deficit (VPD) (blue) and streamflow (red). Thick blue curve: model with mean VPD at La Frontera (1999–2015); upper dashed/lower dotted blue curves: models with mean ± one standard deviation from mean VPD. (B) Reconstructed cumulative mass balance of Guanaco Glacier based on precipitation and VPD ± std (blue) and composite streamflow (red). Cumulative geodetic (1955–2011) and glaciological (2011–2015) mass changes were computed backward from 2015 and shown as black asterisk with error bars. (C) Reconstructed mass balance of Echaurren Norte Glacier (33.58°S, 70.13°W) (Masiokas et al., 2016). (D) JJA Bivariate ENSO index with 21-year lowess curve (black trace); (E) Southern Annular Mode (SAM) index, with 21-year lowess curve (black); (F) Annual latitudinal position of the South Pacific Subtropical High (SPSH) 1020 isobar, with 21-year lowess curve (black).
The short VPD and P records do not allow extending Ba very far back in time. The composite streamflow record was thus used to reconstruct Ba back to 1915. The streamflow-based reconstruction agrees relatively well with the geodetic balance back to 1955, within error bounds (Figure 11B). The reconstructed Ba record shows a period with frequent positive mass balance conditions during the early part of the record (1915–1935), followed by a period with predominantly negative balance (1935–1975), a more neutral period with alternating negative and positive mass balance (1975–2005), and sustained mass loss thereafter. This trend is similar overall to the reconstructed mass balance of Echaurren Norte Glacier in central Chile (Masiokas et al., 2016) (Figure 11C). Annually reconstructed Ba on Guanaco Glacier reached positive values up to 2 m w.e. during the 1975–2005 period, and even higher values in the early period (up to 4 m w.e.). Considering that ice was still accumulating on Guanaco Glacier from 1915 up to ∼1935 AD with a mean reconstructed net accumulation rate of 0.60 m w.e. a–1, and that the reconstructed cumulative mass loss was 17.3 ± 6 m w.e. between 1935 and 2008, the age of the 2008 surface would be approximately equal to 1935 – (17.3 ± 6)/0.6 m w.e. = 1910 AD ± 10 years. This is a crude estimate, but which is in line with the radiometric minimum age of the 2008 glacier surface (<1908 AD). The mean (0.60 m w.e. a–1) and maximum (4 m w.e. a–1) accumulation rate during the early 1915–1935 period is also consistent with the range of values inferred from the stable isotope record (0.5–3 m w.e. a–1). Based on this evidence, it is thus plausible that the ice sampled in the core dates back to the mid 19th to early 20th century period when precipitation in central Chile was higher than today (Garreaud et al., 2017) and several glacier advances were inferred from historical sources and dated moraines in the Dry Andes (Masiokas et al., 2009).
Link With Atmospheric Circulation
The sensitivity of mass balance to precipitation, and the recent sustained mass loss of Guanaco Glacier that occurred during a prolonged drought, calls into question the role of changing atmospheric circulation to explain the observed and reconstructed mass balance record. Precipitation in central Chile (30–37°S) is impacted by tropical sea surface temperature patterns, with precipitation increasing during El Niño Southern Oscillation (ENSO) events, although this association starts to decay North of 30°S (Houston, 2006; Garreaud et al., 2009; Boisier et al., 2018). Interdecadal variations in precipitation have also been ascribed to low-frequency variability in sea surface temperature, captured by the Pacific Decadal Oscillation (PDO) index (Garreaud et al., 2009). Extratropical circulation also conditions precipitation variability in subtropical Chile: the Southern Annular Mode (SAM), also known as the Antarctic Oscillation, is the leading pattern of tropospheric circulation variability south of 20°S and describes the north–south movement of the westerly wind belt that circles Antarctica. A positive correlation between the SAM index and precipitation exist at 30–45°S latitudes, but this correlation quickly decays north of 30°S (Garreaud et al., 2009; Boisier et al., 2018). The Bivariate ENSO index (Smith and Sardeshmukh, 2000) and the reconstructed (1905–2005) (Jones et al., 2009) and station-based (2006–2015), winter (JJA) SAM index were compared with the reconstructed Ba in Figure 11. The reconstructed Ba is positively correlated with the ENSO index (r = 0.41, p < 0.01) and high values of the index are often, but not always, associated with positive mass balance years. There is little correspondence between the reconstructed Ba and the SAM index (r = 0.13, p = 0.13). These results agree with those found for precipitation and the recent glaciological Ba record (see Supplementary Material).
Guanaco Glacier is located south of the so-called Arid Diagonal, a transitional zone separating the tropical circulation cell to the north and the extratropical westerly wind belt to the south. As such, Guanaco Glacier may be particularly sensitive to the displacement of these large-scale circulation features. Winter precipitation in the area are strongly conditioned by the intensity and position of the South Pacific Subtropical High (SPSH). This semi-permanent anticyclone is the surface manifestation of the subsiding branch of the Hadley cell, which in winter migrates north and allows the passage of frontal systems moving eastward from the Pacific (Garreaud, 2009). In recent decades a strengthening and expansion of the SPSH have been observed and attributed to global warming, leading to precipitation decreases from central to southern Chile (Falvey and Garreaud, 2009; Flores-Aqueveque et al., 2019). The decrease in precipitation and related mass loss on Guanaco Glacier may thus be closely associated with the intensity and position of the SPSH. Figure 12 shows trends in winter (JJA) SLP for the period 1905–2012 computed from the Hadley Centre Sea Level Pressure dataset (HadSLP2) (Allan and Ansell, 2006). Decreasing SLP occur over the Bellingshausen Sea sector of Antarctica and increasing SLP south of the SPSH mean position. A similar pattern was previously highlighted for annual SLP trends by Falvey and Garreaud (2009) for the shorter 1979–2005 period based on reanalysis data. The trend pattern is also similar to the South Pacific dipole pressure pattern which has recently been associated with the so-called “Mega Drought” in Chile (Garreaud et al., 2019). The increase in SLP south of the SPSH in Figure 12 may be partly due to the expansion and/or southward migration of the SPSH. The latitudinal migration of the winter SPSH was investigated by tracking the southernmost latitude of the 1020 isobar over time (Figure 11F). The latitudinal position of the winter SPSH shows interannual variability as well as a broad negative trend over time, estimated at −0.21 ± 0.06° decade–1 (p < 0.01) from linear regression. The SPSH position is significantly correlated with the reconstructed Ba (r = 0.39, p < 0.01), consistent with the notion that an equatorward migration of the winter SPSH favors the advection of moist air masses and precipitation on the glacier. However, while ENSO and the position of the SPSH are both correlated with the reconstructed Ba, these two indices together can only explain 21% of the variability in the reconstructed Ba. Storms reaching the continent do not always reach the high Andes in winter, due to complicated orographic and synoptic atmospheric processes (Scaff et al., 2017; Viale and Nuñez, 2011) which limits our understanding of dynamical forcing of mass balance based on seasonal averages.
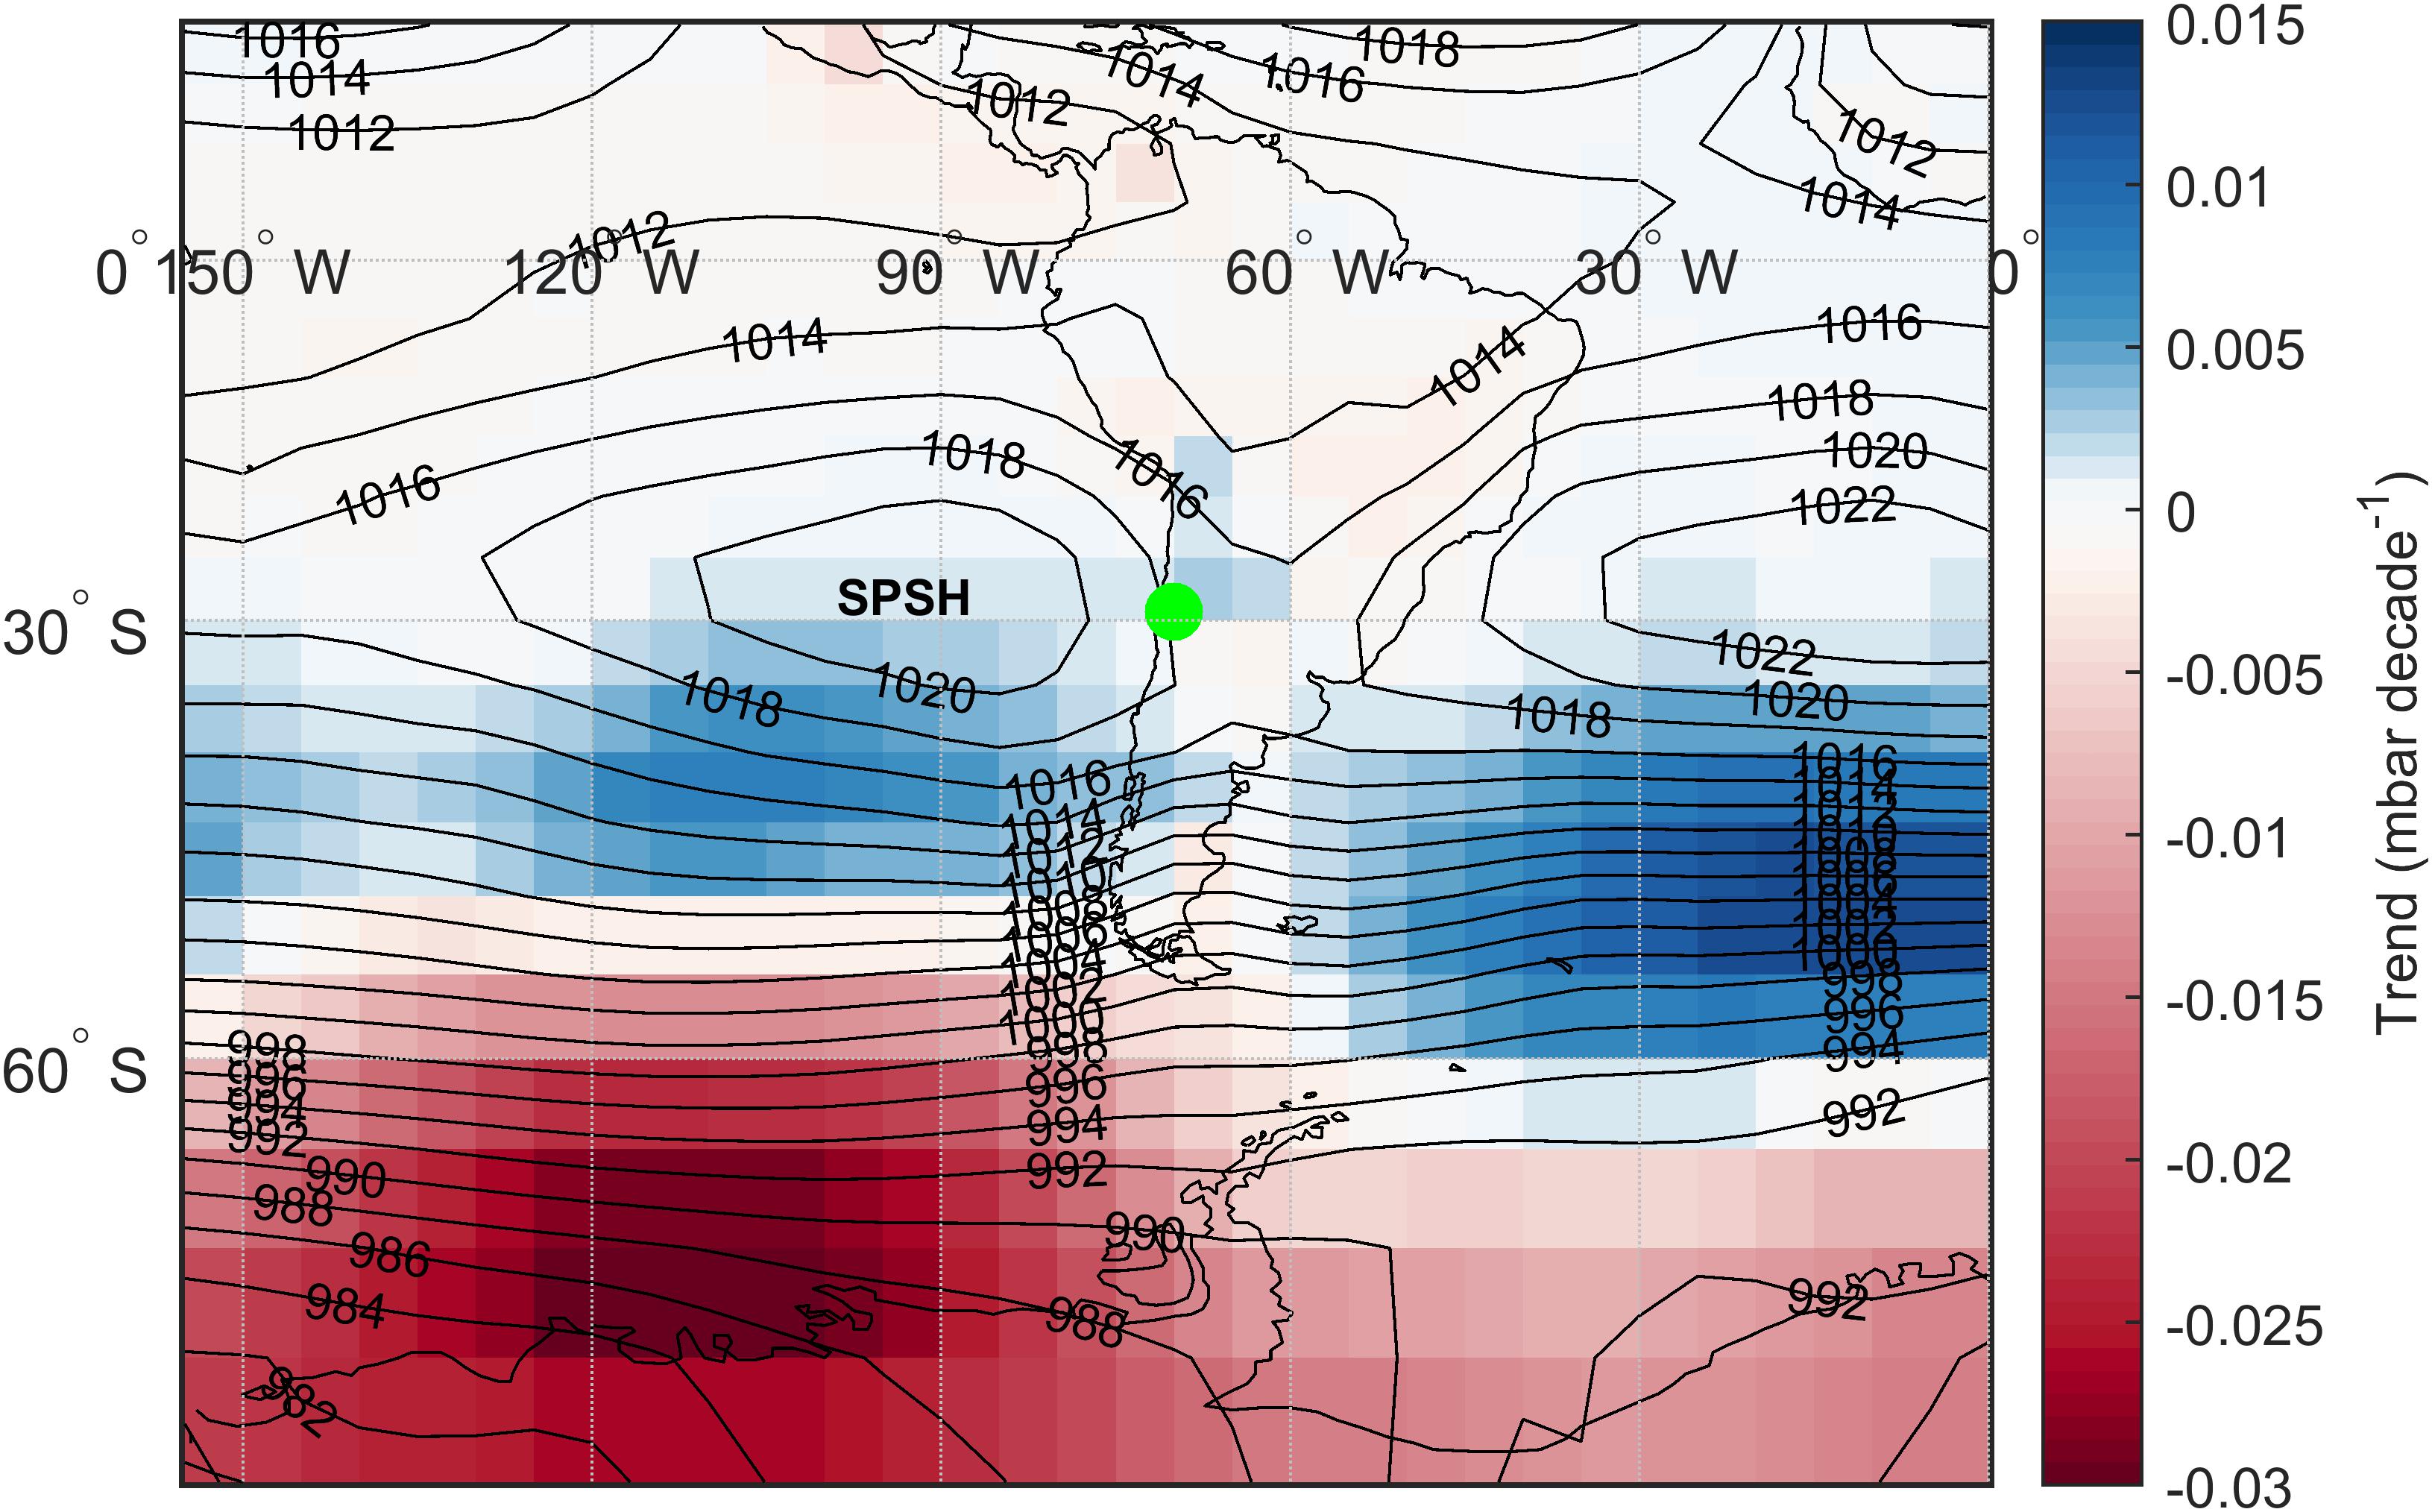
Figure 12. Mean sea-level pressure (SLP) patterns during winter (JJA) over South America (black isobars), and linear trends in SLP (color scale) over the 1905–2012 period. SPSH, South Pacific Subtropical High; Green dot: Guanaco Glacier.
Conclusion
This study has brought together and analyzed a unique and diverse glacio-climate dataset comprising recent glaciological mass balance, geodetic and statistical mass balance reconstructions, and ice core measurements in order to investigate the evolution of Guanaco Glacier in the Dry Andes. This is a region where glacier-climate interactions are not yet well constrained, despite the fact that meltwater from snow and glaciers in spring and summer is vital to sustain populations and economic activities. This study showed that the measured mass balance on Guanaco Glacier has been predominantly negative since 2002, and that it is currently mostly sensitive to precipitation variations, while low temperatures, aridity and high solar radiation and wind speeds cause large sublimation losses and limited melting. As such, humidity plays a key role in glacier-climate interactions, with humid conditions favoring precipitation and snow accumulation but also increased ablation due to reduced sublimation and concurrent higher melting.
The reconstructed mass balance shows that the glacier gained mass during the early part of the record (1915–1935), followed by a period with predominantly negative balance (1935–1975), a more neutral period (1975–2005) and sustained mass loss thereafter. Ice core data suggest that high accumulation rates and higher melting prevailed before the early 20th century, matching the earliest period of glacier growth reconstructed from streamflow records. Understanding the causes of precipitation variability is key to understand and project future glacier and snow mass balance variability in the dry Andes. The reconstructed mass balance of Guanaco Glacier was shown to be positively correlated with the ENSO index as well as with the position of the South Pacific Subtropical High (SPSH). The apparent poleward migration of the SPSH observed in this study and elsewhere (Flores-Aqueveque et al., 2019) may have been driving a progressive starvation of precipitation over Guanaco Glacier, culminating in the sustained mass loss observed in the recent decade. Continued migration and/or expansion of the SPSH in the future, as predicted by general circulation models (Flores-Aqueveque et al., 2019), could continue to deplete accumulation on glaciers, exacerbating the ongoing hydrological drought and obliterating the paleoclimate potential of high-altitude glaciers in the Dry Andes.
Data Availability Statement
The datasets generated for this study are available on request to the corresponding author.
Author Contributions
CK designed the study, carried out the analyses, and wrote the manuscript. AS carried out geodetic mass balance calculations. PG, NP, LN, and ARa designed the ice coring study. PG and NP carried out glaciochemistry analyses and participated in the interpretation of the ice core data. CK, SM, LN, ARa, ARi, and FS participated in the Guanaco Glacier mass balance monitoring program. All authors reviewed the final manuscript.
Funding
Funding to CK was provided by the Natural Sciences and Engineering Research Council of Canada (grant number RGPIN-2015-03844) and the Canada Research Chair Program (grant number 231380). SM and FS were supported by CONICYT-Programa Regional R16A10003. The glacier monitoring program and ice core retrieval in Pascua-Lama was funded by Compañía Minera Nevada.
Conflict of Interest
Funding for the mass balance monitoring program and ice coring was provided by the Compañía Minera Nevada in order to implement a Glacier monitoring plan approved by Comisión Regional del Medio Ambiente (Corema) de la Región de Atacama, Chile. The authors declare no personal nor financial conflict of interest related to the results presented in this study.
Acknowledgments
CK thanks Mariano H. Masiokas for providing the reconstructed Echaurren Norte Glacier data, and the several members at CEAZA who participated in the glacier monitoring program. ARi thanks CECs and all the members of the glaciology laboratory that performed surveys at Guanaco Glacier for several years.
Supplementary Material
The Supplementary Material for this article can be found online at: https://www.frontiersin.org/articles/10.3389/feart.2020.00040/full#supplementary-material
References
Abermann, J., Kinnard, C., and MacDonell, S. (2014). Albedo variations and the impact of clouds on glaciers in the Chilean semi-arid Andes. J. Glaciol. 60, 183–191. doi: 10.3189/2014jog13j094
Allan, R., and Ansell, T. (2006). A new globally complete monthly historical gridded mean sea level pressure dataset (HadSLP2): 1850–2004. J. Clim. 19, 5816–5842. doi: 10.1175/jcli3937.1
Arenson, L. U., Jakob, M., and Wainstein, P. (2015). “Effects of dust deposition on glacier ablation and runoff at the Pascua-Lama Mining Project, Chile and Argentina,” in Engineering Geology for Society and Territory-Volume 1, Lollino, G., Manconi, A. Clague, J. Shan, W. and Chiarle, M. (Cham: Springer), 27–32. doi: 10.1007/978-3-319-09300-0_6
Ayala, A., Pellicciotti, F., MacDonell, S., Mcphee, J., and Burlando, P. (2017). Patterns of glacier ablation across North-Central Chile: identifying the limits of empirical melt models under sublimation-favorable conditions. Water Resour. Res. 53, 5601–5625. doi: 10.1002/2016wr020126
Barcaza, G., Nussbaumer, S. U., Tapia, G., Valdés, J., García, J.-L., Videla, Y., et al. (2017). Glacier inventory and recent glacier variations in the Andes of Chile, South America. Ann. Glaciol. 58, 166–180. doi: 10.1017/aog.2017.28
Barnett, T. P., Adam, J. C., and Lettenmaier, D. P. (2005). Potential impacts of a warming climate on water availability in snow-dominated regions. Nature 438, 303–309. doi: 10.1038/nature04141
Bergeron, V., Berger, C., and Betterton, M. (2006). Controlled irradiative formation of penitentes. Phys. Rev. Lett. 96:098502.
Boisier, J. P., Alvarez-Garretón, C., Cordero, R. R., Damiani, A., Gallardo, L., Garreaud, R. D., et al. (2018). Anthropogenic drying in central-southern Chile evidenced by long-term observations and climate model simulations. Elem. Sci. Anth. 6:74. doi: 10.1525/elementa.328
Bolius, D., Schwikowski, M., Jenk, T., Gäggeler, H. W., Casassa, G., and Rivera, A. (2006). A first shallow firn-core record from Glaciar La Ollada, Cerro Mercedario, central Argentine Andes. Ann. Glaciol. 43, 14–22. doi: 10.3189/172756406781812474
Bown, F., Rivera, A., and Acuna, C. (2008). Recent glacier variations at the Aconcagua basin, central Chilean Andes. Ann. Glaciol. 48, 43–48. doi: 10.3189/172756408784700572
Bozkurt, D., Rojas, M., Boisier, J. P., and Valdivieso, J. (2017). Climate change impacts on hydroclimatic regimes and extremes over Andean basins in central Chile. Hydrol. Earth Syst. Sci. Discuss. 2017, 1–29. doi: 10.5194/hess-2016-690
Brenning, A. (2008). “The impact of mining on rock glaciers and glaciers,” in Darkening Peaks: Glacier Retreat, Science, and Society, eds B. S. Orlove, E. Wiegandt, and B. Luckman, (Oakland, CA: University of California Press).
Cabré, M. F., Solman, S., and Núñez, M. (2016). Regional climate change scenarios over southern South America for future climate (2080-2099) using the MM5 Model. Mean, interannual variability and uncertainties. Atmósfera 29, 35–60. doi: 10.20937/atm.2016.29.01.04
Cathles, L. M., Abbot, D. S., and Macayeal, D. R. (2014). Intra-surface radiative transfer limits the geographic extent of snow penitents on horizontal snowfields. J. Glaciol. 60, 147–154. doi: 10.3189/2014jog13j124
Cauquoin, A., Jean-Baptiste, P., Risi, C., Fourré, É., Stenni, B., and Landais, A. (2015). The global distribution of natural tritium in precipitation simulated with an Atmospheric General Circulation Model and comparison with observations. Earth Planet. Sci. Lett. 427, 160–170. doi: 10.1016/j.epsl.2015.06.043
Ciric, A., Gäggeler, H., and Schwikowski, M. (2010). “ENSO related accumulation variability on cerro Mercedario,” in Paul Scherrer Institut, Labor für Radio- und Umweltchemie, Annual Report 2009, eds B. S. Orlove, E. Wiegandt, and B. Luckman, (Berkeley, CA: Lawrence Berkeley National Laboratory).
Cogley, J. G. (2009). Geodetic and direct mass balance measurements: comparison and joint analysis. Ann. Glaciol. 50, 96–100. doi: 10.3189/172756409787769744
Cuffey, K. M., and Paterson, W. S. B. (2010). The Physics of Glaciers, 4th Edn. Amsterdam: Academic Press.
Dussaillant, I., Berthier, E., Brun, F., Masiokas, M., Hugonnet, R., Favier, V., et al. (2019). Two decades of glacier mass loss along the Andes. Nat. Geosci. 12, 802–808. doi: 10.1038/s41561-019-0432-5
Escobar, F., Pozo, V., Salazar, A., and Oyarzo, M. (1995). “Balance de Masa en el Glaciar Echaurren Norte, 1975 a 1992” Publicación DGA, H. A. y G. 97/1, Dirección General de Aguas. (Santiago: InteRNA Technologies B.V).
Falvey, M., and Garreaud, R. D. (2009). Regional cooling in a warming world: recent temperature trends in the southeast Pacific and along the west coast of subtropical South America (1979–2006). J. Geophys. Res. Atmos. 114:D04102. doi: 10.1029/2008JD010519
Favier, V., Falvey, M., Rabatel, A., Praderio, E., and López, D. (2009). Interpreting discrepancies between discharge and precipitation in high-altitude area of Chile’s Norte Chico region (26–32(S). Water Resour. Res. 45:W02424.
Fiebig-Wittmaack, M., Astudillo, O., Wheaton, E., Wittrock, V., Perez, C., and Ibacache, A. (2012). Climatic trends and impact of climate change on agriculture in an arid Andean valley. Clim. Change 111, 819–833. doi: 10.1007/s10584-011-0200-z
Flantua, S. G., Hooghiemstra, H., Vuille, M., Behling, H., Carson, J. F., Gosling, W., et al. (2016). Climate variability and human impact in South America during the last 2000 years: synthesis and perspectives from pollen records. Clim. Past 12, 483–523. doi: 10.5194/cp-12-483-2016
Flores-Aqueveque, V., Rojas, M., Aguirre, C., Arias, P. A., and González, C. (2019). South Pacific Subtropical High from the late Holocene to the end of the 21st century: insights from climate proxies and general circulation models. Clim. Past 16, 79–99. doi: 10.5194/cp-16-79-2020
Fountain, A. G., and Tangborn, W. V. (1985). The effect of glaciers on streamflow variations. Water Resour. Res. 21, 579–586. doi: 10.1029/wr021i004p00579
Garreaud, R. (2009). The Andes climate and weather. Adv. Geosci. 22, 3–11. doi: 10.5194/adgeo-22-3-2009
Garreaud, R. D., Alvarez-Garreton, C., Barichivich, J., Boisier, J. P., Christie, D., Galleguillos, M., et al. (2017). The 2010-2015 megadrought in central Chile: impacts on regional hydroclimate and vegetation. Hydrol. Earth Syst. Sci. 21, 6307–6327. doi: 10.5194/hess-21-6307-2017
Garreaud, R. D., Boisier, J. P., Rondanelli, R., Montecinos, A., Sepúlveda, H. H., and Veloso-Aguila, D. (2019). The central Chile mega drought (2010–2018): a climate dynamics perspective. Int. J. Climatol. 40, 421–439. doi: 10.1002/joc.6219
Garreaud, R. D., Vuille, M., Compagnucci, R., and Marengo, J. (2009). Present-day South American climate. Palaeogeogr. Palaeoclimatol. Palaeoecol. 281, 180–195. doi: 10.1016/j.palaeo.2007.10.032
Gascoin, S., Kinnard, C., Ponce, R., MacDonell, S., Lhermitte, S., and Rabatel, A. (2011). Glacier contribution to streamflow in two headwaters of the Huasco River, Dry Andes of Chile. Cryosphere 5, 1099–1113. doi: 10.5194/tc-5-1099-2011
Gascoin, S., Lhermitte, S., Kinnard, C., Bortels, K., and Liston, G. E. (2013). Wind effects on snow cover in Pascua-Lama, Dry Andes of Chile. Adv. Water Resour. 55, 25–39. doi: 10.1016/j.advwatres.2012.11.013
Ginot, P., Kull, C., Schotterer, U., Schwikowski, M., and Gäggeler, H. (2006). Glacier mass balance reconstruction by sublimation induced enrichment of chemical species on Cerro Tapado (Chilean Andes). Clim. Past 2, 21–30. doi: 10.5194/cp-2-21-2006
Ginot, P., Stampfli, F., Stampfli, D., Schwikowski, M., and Gaggeler, H. (2002). FELICS, a new ice core drilling system for high-altitude glaciers. Mem. Natl. Inst. Polar Res. 56, 38–48.
Golder Associates, (2005). Estudios de Campo de Hielo y Glaciares Proyecto Pascua-Lama, Chile. Santiago: Golder Associates S.A.
Grumet, N. S., Wake, C. P., Zielinski, G. A., Fisher, D., Koerner, R., and Jacobs, J. D. (1998). Preservation of glaciochemical time-series in snow and ice from the Penny Ice Cap, Baffin Island. Geophys. Res. Lett. 25, 357–360. doi: 10.1029/97gl03787
Hock, R. (2005). Glacier melt: a review of processes and their modelling. Prog. Phys. Geogr. 29, 362–391. doi: 10.1191/0309133305pp453ra
Hoffmann, G., Ramirez, E., Taupin, J. D., Francou, B., Ribstein, P., Delmas, R., et al. (2003). Coherent isotope history of Andean ice cores over the last century. Geophys. Res. Lett. 30:1179. doi: 10.1029/2002GL014870
Houston, J. (2006). Variability of precipitation in the Atacama Desert: its causes and hydrological impact. Int. J. Climatol. 26, 2181–2198. doi: 10.1002/joc.1359
Huss, M. (2011). Present and future contribution of glacier storage change to runoff from macroscale drainage basins in Europe. Water Resour. Res. 47:W07511.
Iribarren Anacona, P., Mackintosh, A., and Norton, K. P. (2015). Hazardous processes and events from glacier and permafrost areas: lessons from the Chilean and Argentinean Andes. Earth Surf. Process. Landf. 40, 2–21. doi: 10.1002/esp.3524
Jansson, P., Hock, R., and Schneider, T. (2003). The concept of glacier storage: a review. J. Hydrol. 282, 116–129. doi: 10.1016/s0022-1694(03)00258-0
Jones, J. M., Fogt, R. L., Widmann, M., Marshall, G. J., Jones, P. D., and Visbeck, M. (2009). Historical SAM variability. Part I: Century-length seasonal reconstructions. J. Clim. 22, 5319–5345. doi: 10.1175/2009jcli2785.1
Juliá, C., Rahn, D. A., and Rutllant, J. A. (2012). Assessing the influence of the MJO on strong precipitation events in subtropical, semi-arid north-central Chile (30 S). J. Clim. 25, 7003–7013. doi: 10.1175/jcli-d-11-00679.1
Kaser, G. (2001). Glacier-climate interaction at low latitudes. J. Glaciol. 47, 195–204. doi: 10.3189/172756501781832296
Kinnard, C., Koerner, R. M., Zdanowicz, C. M., Fisher, D. A., Zheng, J., Sharp, M. J., et al. (2008). Stratigraphic analysis of an ice core from the Prince of Wales Icefield, Ellesmere Island, Arctic Canada, using digital image analysis: High-resolution density, past summer warmth reconstruction, and melt effect on ice core solid conductivity. J. Geophys. Res. Atmos. 113:D24120. doi: 10.1029/2008JD011083
Koerner, R. M. (1997). Some comments on climatic reconstructions from ice cores drilled in areas of high melt. J. Glaciol. 43, 90–97. doi: 10.1017/s0022143000002847
Kronenberg, J. (2013). Linking ecological economics and political ecology to study mining, glaciers and global warming. Environ. Policy Gov. 23, 75–90. doi: 10.1002/eet.1605
Kull, C., Grosjean, M., and Veit, H. (2002). Modeling modern and Late Pleistocene glacio-climatological conditions in the north Chilean Andes (29–30). Clim. Change 52, 359–381.
Leiva, J., Cabrera, G., and Lenzano, L. (2007). 20 years of mass balances on the Piloto glacier, Las Cuevas river basin, Mendoza, Argentina. Glob. Planet. Change 59, 10–16. doi: 10.1016/j.gloplacha.2006.11.018
Lhermitte, S., Abermann, J., and Kinnard, C. (2014). Albedo over rough snow and ice surfaces. Cryosphere 8, 1069–1086. doi: 10.5194/tc-8-1069-2014
Lliboutry, L. (1954). The origin of penitents. J. Glaciol. 2, 331–338. doi: 10.1017/s0022143000025181
MacDonell, S., Kinnard, C., Mölg, T., Nicholson, L., and Abermann, J. (2013). Meteorological drivers of ablation processes on a cold glacier in the semi-arid Andes of Chile. Cryosphere 7, 1513–1526. doi: 10.5194/tc-7-1513-2013
Masiokas, M. H., Christie, D. A., Le Quesne, C., Pitte, P., Ruiz, L., Villalba, R., et al. (2016). Reconstructing the annual mass balance of the Echaurren Norte glacier (Central Andes, 33.5 S) using local and regional hydroclimatic data. Cryosphere 10, 927–940. doi: 10.5194/tc-10-927-2016
Masiokas, M. H., Rivera, A., Espizua, L. E., Villalba, R., Delgado, S., and Aravena, J. C. (2009). Glacier fluctuations in extratropical South America during the past 1000 years. Palaeogeogr. Palaeoclimatol. Palaeoecol. 281, 242–268. doi: 10.1016/j.palaeo.2009.08.006
Montecinos, A., and Aceituno, P. (2003). Seasonality of the ENSO-related rainfall variability in central Chile and associated circulation anomalies. J. Clim. 16, 281–296. doi: 10.1175/1520-0442(2003)016<0281:soterr>2.0.co;2
Moore, J. C., Grinsted, A., Kekonen, T., and Pohjola, V. (2005). Separation of melting and environmental signals in an ice core with seasonal melt. Geophys. Res. Lett. 32:L10501. doi: 10.1029/2005GL023039
Naruse, R., and Leiva, J. C. (1997). Preliminary study on the shape of snow penitents at Piloto Glacier, the Central Andes. Bull. Glacier Res. 15, 99–104.
Neukom, R., and Gergis, J. (2012). Southern Hemisphere high-resolution palaeoclimate records of the last 2000 years. Holocene 22, 501–524. doi: 10.1177/0959683611427335
Nicholson, L., Marín, J., Lopez, D., Rabatel, A., Bown, F., and Rivera, A. (2009). Glacier inventory of the upper Huasco valley, Norte Chico, Chile: glacier characteristics, glacier change and comparison with central Chile. Ann. Glaciol. 50, 111–118. doi: 10.3189/172756410790595787
Nuth, C., and Kääb, A. (2011). Co-registration and bias corrections of satellite elevation data sets for quantifying glacier thickness change. Cryosphere 5, 271–290. doi: 10.5194/tc-5-271-2011
Østrem, G., and Brugman, M. (1991). Glacier Mass balance Measurements: A Manual for Field and Office Work (NHRl Science Report). Saskatoon: National Hydrological Research Institute.
Østrem, G., and Haakensen, N. (1999). Map comparison or traditional mass balance measurements: Which method is better? Geogr. Ann. 81, 703–713.
Oyarzún, J., and Oyarzún, R. (2011). Sustainable development threats, inter-sector conflicts and environmental policy requirements in the arid, mining rich, northern Chile territory. Sustain. Dev. 19, 263–274. doi: 10.1002/sd.441
Peña, H., and Escobar, F. (1987). Análisis del Aluvión de Mayo de 1985 del Río Manflas, Cuenca del Río Copiapó. Santiago: Ministerio de Obras Públicas.
Pohjola, V., Moore, J., Isaksson, E., Jauhiainen, T., Van De Wal, R., Martma, T., et al. (2002). Effect of periodic melting on geochemical and isotopic signals in an ice core from Lomonosovfonna, Svalbard. J. Geophys. Res. Atmos. 107:4036.
Putman, A. L., Fiorella, R. P., Bowen, G. J., and Cai, Z. (2019). A global perspective on local meteoric water lines: meta-analytic insight into fundamental controls and practical constraints. Water Resour. Res. 55, 6896–6910. doi: 10.1029/2019wr025181
Quintana, J., and Aceituno, P. (2012). Changes in the rainfall regime along the extratropical west coast of South America (Chile): 30-43° S. Atmósfera 25, 1–22.
Rabatel, A., Castebrunet, H., Favier, V., Nicholson, L., and Kinnard, C. (2011). Glacier changes in the Pascua-Lama region, Chilean Andes (29 ° S): recent mass balance and 50 yr surface area variations. Cryosphere 5, 1029–1041. doi: 10.5194/tc-5-1029-2011
Réveillet, M., MacDonell, S., Gascoin, S., Kinnard, C., Lhermitte, S., and Schaffer, N. (2020). Impact of forcing on sublimation simulations for a high mountain catchment in the semiarid Andes. Cryosphere 14, 147–163. doi: 10.5194/tc-14-147-2020
Rolstad, C., Haug, T., and Denby, B. (2009). Spatially integrated geodetic glacier mass balance and its uncertainty based on geostatistical analysis: application to the western Svartisen ice cap. Norway. J. Glaciol. 55, 666–680. doi: 10.3189/002214309789470950
Rupper, S., and Roe, G. (2008). Glacier changes and regional climate: a mass and energy balance approach. J. Clim. 21, 5384–5401. doi: 10.1175/2008jcli2219.1
Sagredo, E., and Lowell, T. (2012). Climatology of Andean glaciers: a framework to understand glacier response to climate change. Glob. Planet. Change 86, 101–109. doi: 10.1016/j.gloplacha.2012.02.010
Sagredo, E. A., Rupper, S., and Lowell, T. V. (2014). Sensitivities of the equilibrium line altitude to temperature and precipitation changes along the Andes. Quat. Res. 81, 355–366. doi: 10.1016/j.yqres.2014.01.008
Scaff, L., Rutllant, J. A., Rahn, D., Gascoin, S., and Rondanelli, R. (2017). Meteorological interpretation of orographic precipitation gradients along an Andes west slope basin at 30 S (Elqui Valley, Chile). J. Hydrometeorol. 18, 713–727. doi: 10.1175/jhm-d-16-0073.1
Schotterer, U., Grosjean, M., Stichler, W., Ginot, P., Kull, C., Bonnaveira, H., et al. (2003). “Glaciers and climate in the Andes between the Equator and 30(S: what is recorded under extreme environmental conditions?” in Climate Variability and Change in High Elevation Regions: Past, Present & Future, ed. H. F. Diaz, (Dordrecht: Springer), 157–175. doi: 10.1007/978-94-015-1252-7_9
Schotterer, U., Schwarz, P., and Rajner, V. (1998). “From pre-bomb levels to industrial times: a complete tritium record from an alpine ice core and its relevance for environmental studies,” in Proceedings of the Isotope Techniques in the Study of Environmental Change (Vienna: International Atomic Energy Agency).
Schulz, N., Boisier, J., and Aceituno, P. (2012). Climate change along the arid coast of northern Chile. Int. J. Climatol. 32, 1803–1814. doi: 10.1002/joc.2395
Sinclair, K. E., and MacDonell, S. (2016). Seasonal evolution of penitente glaciochemistry at Tapado Glacier, Northern Chile. Hydrol. Process. 30, 176–186. doi: 10.1002/hyp.10531
Smith, C. A., and Sardeshmukh, P. D. (2000). The effect of ENSO on the intraseasonal variance of surface temperatures in winter. Int. J. Climatol. 20, 1543–1557. doi: 10.1002/1097-0088(20001115)20:13<1543::aid-joc579>3.0.co;2-a
Stichler, W., Schotterer, U., Fröhlich, K., Ginot, P., Kull, C., Gäggeler, H., et al. (2001). Influence of sublimation on stable isotope records recovered from high-altitude glaciers in the tropical Andes. J. Geophys. Res. 106, 22613–22620. doi: 10.1029/2001jd900179
Stigter, E. E., Litt, M., Steiner, J. F., Bonekamp, P. N., Shea, J. M., Bierkens, M. F., et al. (2018). The importance of snow sublimation on a Himalayan glacier. Front. Earth Sci. 6:108. doi: 10.3389/feart.2018.00108
Surazakov, A. B., and Aizen, V. B. (2006). Estimating volume change of mountain glaciers using SRTM and map-based topographic data. IEEE Transact. Geosci. Remote Sens. 44, 2991–2995. doi: 10.1109/tgrs.2006.875357
Thibert, E., Blanc, R., Vincent, C., and Eckert, N. (2008). Glaciological and volumetric mass balance measurements: error analysis over 51 years for Glacier de Sarennes, French Alps. J. Glaciol. 54, 522–532. doi: 10.3189/002214308785837093
Thompson, L. G. (2000). Ice core evidence for climate change in the Tropics: implications for our future. Quat. Sci. Rev. 19, 19–35. doi: 10.1016/s0277-3791(99)00052-9
Torrence, C., and Compo, G. P. (1998). A practical guide to wavelet analysis. Bull. Am. Meteorol. Soc. 79, 61–78.
Valdés-Pineda, R., Pizarro, R., García-Chevesich, P., Valdés, J. B., Olivares, C., Vera, M., et al. (2014). Water governance in Chile: availability, management and climate change. J. Hydrol. 519, 2538–2567.
Viale, M., and Nuñez, M. N. (2011). Climatologyof winter orographic precipitation over the subtropical central Andes and associated synoptic and regional characteristics. J. Hydrometeorol. 12, 481–507. doi: 10.1175/2010jhm1284.1
Vimeux, F., Ginot, P., Schwikowski, M., Vuille, M., Hoffmann, G., Thompson, L. G., et al. (2009). Climate variability during the last 1000 years inferred from Andean ice cores: a review of methodology and recent results. Palaeogeogr. Palaeoclimatol. Palaeoecol. 281, 229–241. doi: 10.1016/j.palaeo.2008.03.054
Viviroli, D., Dürr, H. H., Messerli, B., Meybeck, M., and Weingartner, R. (2007). Mountains of the world, water towers for humanity: typology, mapping, and global significance. Water Resour. Res. 43:W07447.
WGMS, (ed.) (2017). Global Glacier Change Bulletin No. 2 (2014-2015). Zurich: World Glacier Monitoring Service.
Whillans, I., and Grootes, P. (1985). Isotopic diffusion in cold snow and firn. J. Geophys. Res. Atmos. 90, 3910–3918.
Young, G., Zavala, H., Wandel, J., Smit, B., Salas, S., Jimenez, E., et al. (2010). Vulnerability and adaptation in a dryland community of the Elqui Valley Chile. Clim. Change 98, 245–276. doi: 10.1007/s10584-009-9665-4
Keywords: glacier mass balance, geodetic mass balance, ice core, dry Andes, climate change, stable isotopes, sublimation, drought
Citation: Kinnard C, Ginot P, Surazakov A, MacDonell S, Nicholson L, Patris N, Rabatel A, Rivera A and Squeo FA (2020) Mass Balance and Climate History of a High-Altitude Glacier, Desert Andes of Chile. Front. Earth Sci. 8:40. doi: 10.3389/feart.2020.00040
Received: 11 November 2019; Accepted: 04 February 2020;
Published: 25 February 2020.
Edited by:
Bryan G. Mark, The Ohio State University, United StatesReviewed by:
Ninglian Wang, Chinese Academy of Sciences, ChinaPascal Buri, University of Alaska Fairbanks, United States
Copyright © 2020 Kinnard, Ginot, Surazakov, MacDonell, Nicholson, Patris, Rabatel, Rivera and Squeo. This is an open-access article distributed under the terms of the Creative Commons Attribution License (CC BY). The use, distribution or reproduction in other forums is permitted, provided the original author(s) and the copyright owner(s) are credited and that the original publication in this journal is cited, in accordance with accepted academic practice. No use, distribution or reproduction is permitted which does not comply with these terms.
*Correspondence: Christophe Kinnard, christophe.kinnard@uqtr.ca