Seismology at School in Nepal: A Program for Educational and Citizen Seismology Through a Low-Cost Seismic Network
 Shiba Subedi
 György Hetényi
 Paul Denton
 Anne Sauron
- 1Institute of Earth Sciences, Faculty of Geosciences and Environment, University of Lausanne, Lausanne, Switzerland
- 2British Geological Survey, Nottingham, United Kingdom
- 3HES-SO Valais-Wallis, Sion, Switzerland
Nepal, located above the convergent India-Eurasia plate boundary, has repeatedly experienced devastating earthquakes. During the 2015 magnitude 7.8 Gorkha earthquake, an often-reported experience was that people were not aware of the threatening seismic hazard and had an insufficient level of preparedness. An important source of the problem is that earthquake-related topics are not part of the school curriculum. Earthquake education reaching a broad group of the population early in their lives is therefore strongly needed. We established an initiative in Nepal to introduce seismology in schools, with a focus on education and citizen seismology. We have prepared educational materials adapted to the Nepali school system, which we distributed and also share on our program’s website: http://seismoschoolnp.org. In selected schools, we also installed a low-cost seismometer to record seismicity and to allow learning-by-doing classroom activities. Our approach was very well received and we hope it will help make earthquake-safe communities across Nepal. The seismic sensor which we installed in schools is a Raspberry Shake 1D (RS1D), this was selected based on its performance in laboratory tests and suitability for the field conditions. At a test site in Switzerland we were able to record magnitude 1.0 events up to 50 km distance with a RS1D. In Nepal, 22 such seismometers installed in schools create the Nepal School Seismology Network providing online data openly. The seismometer in each school allows students to be informed of earthquakes, visualize the respective waveforms, and estimate the distance and magnitude of the event. For significant local and regional events, we provide record sections and network instrumental intensity maps on our program’s website. In 6 months of network operation, more than 194 local and teleseismic earthquakes of M ≥ 4 have been recorded. From a local and a global catalog, complemented with our own visual identifications, we have provided an earthquake wave detectability graph in distance and magnitude domain. Based on our observations, we have calibrated a new magnitude equation for Nepal, related to the epicentral distance D [km] and to the observed peak vertical ground velocity PGVV [μm/s]. The calibration is done to best fit local catalog magnitudes, and yields the following equation: M = 1.05 × log10(PGVV) + 1.08 × log10(D) + 0.75.
Introduction and Background
Nepal is located above the Himalayan convergent plate boundary between the Indian and Eurasian plates (Aitchison et al., 2007), and consequently in the heart of the most active continental seismic hazard zone. The recent geological and geodetic shortening accommodated across the Himalayas is about 2 cm/yr (Bilham et al., 1997; Lavé and Avouac, 2001; Jouanne et al., 2004; Zheng et al., 2017). The surface expression of this shortening is the Main Frontal Thrust, which continues at depth, to about 15 km below the surface, for more than 100 km toward the North, forming the Main Himalayan Thrust (Cattin and Avouac, 2000; Duputel et al., 2016; Elliott et al., 2016). This is the megathrust interface which hosts major earthquakes all along the 2’500 km long Himalayan range. The mountain belt has experienced devastating earthquakes throughout the geological, historical and recent past, claiming lives and causing significant damage. Nepal, in the central part of the Himalaya, occupies nearly one third of the mountain belt, and is the home of ca. 30 million people who live in a very high seismic hazard zone.
The largest instrumentally recorded earthquake in Nepal, the 1934 Mw8.2 event has been followed by the Mw7.8 Gorkha earthquake and a second, Mw7.3 event in 2015 in Central Nepal (Figure 1). Paleoseismic investigations along strike of the active frontal thrust reveal further large historical earthquakes (e.g., Bollinger et al., 2016), the oldest known earthquake described in a primary source having occurred in 1223 (Bollinger et al., 2016), but its description remains unreadable due to defaced letters and words. The greatest event in Nepal, which is also the most recent great earthquake in Western Nepal, occurred in 1505, as reported in historical chronicles (Ambraseys and Jackson, 2003; Ghazoui et al., 2019). The elapsed time since then leads to the existence of a well-identified seismic gap in which another large earthquake is due (Bollinger et al., 2016). This fits the overall view of the seismic cycle in the Himalayas, which has recorded a major earthquake all along the mountain belt in the past 500 years (Hetényi et al., 2016). Earthquakes are the most common and most deadly natural disaster in Nepal, claiming more than 19 thousand lives since 1934, which is more than 80% of the total casualties from natural disasters (Ministry of Home Affairs [Moha], 2015).
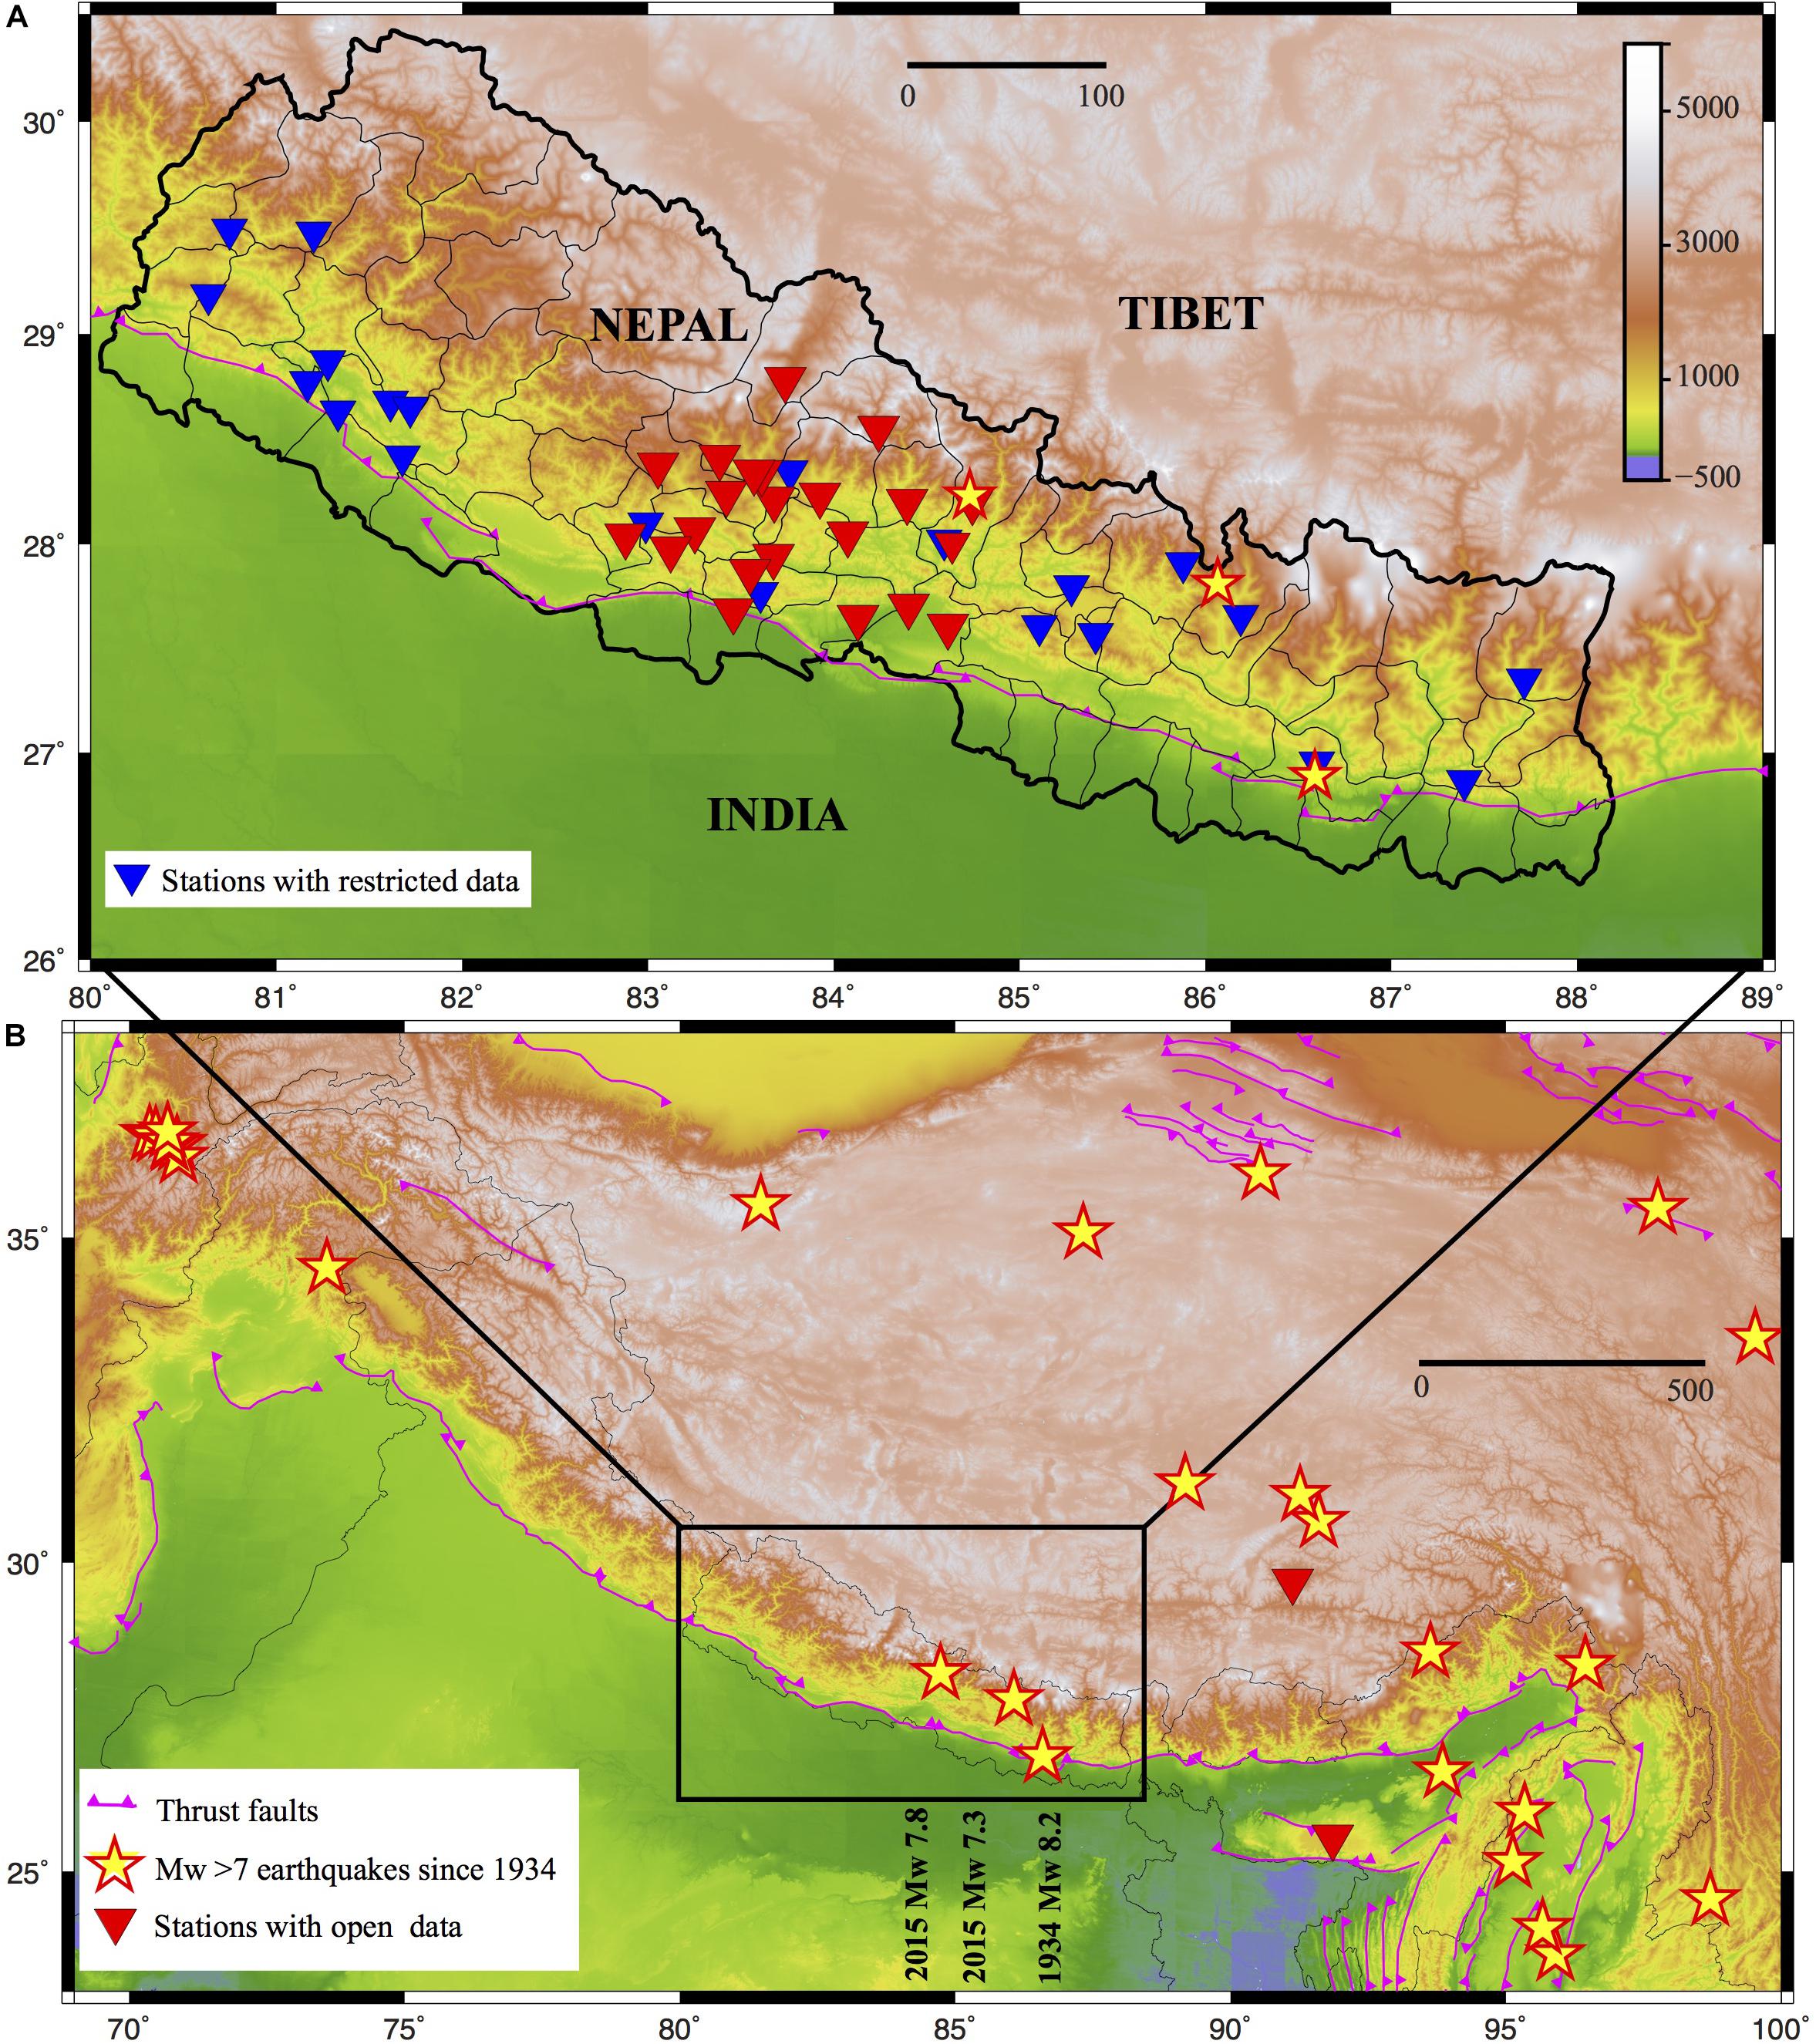
Figure 1. Studied area maps. (B) The Himalaya-Tibet region, with large and great earthquakes (M ≥ 7) since 1934 from the USGS catalog (https://earthquake.usgs.gov/earthquakes/search/). Permanent seismic stations with open data are shown in red. (A) Focus on Nepal, showing 21 permanent seismic stations of the National Seismological Center with restricted data in blue, and 22 Nepal School Seismology Network (this project) stations in Western Nepal with open data in red. Pink lines are thrust faults in the area (Styron et al., 2010). Distance scales are in kilometers.
Despite the clearly high seismic hazard, permanent seismological observatories with open data are rare in the region (Figure 1). The only government facility in Nepal is the National Seismological Center (NSC), which has been operating a permanent seismic network for decades within the framework of international collaboration, and is currently operating 21 short-period and broadband stations in the country. The NSC publishes earthquake information to the population for earthquakes inside Nepal when the local magnitude ML equals or exceeds 4. Other seismic networks in the area are typically temporary research networks, they are installed for a few years, but their data is only openly accessible after a few years of delay and in a format far less comprehensible to the general public.
Scientific results based on these seismological data are abundant and should be acknowledged for pushing the limits of knowledge in an area where fieldwork conditions are not straightforward. Geophysically imaging the structure of the orogen at depth (e.g., Schulte-Pelkum et al., 2005; Nábělek et al., 2009; Singer et al., 2017; Subedi et al., 2018) is very important to establish quantitative models of seismic hazard. Locating the seismicity both during the inter- and the post-seismic periods (e.g., Bollinger et al., 2007; Adhikari et al., 2015; Diehl et al., 2017; Hoste-Colomer et al., 2018) are equally important to understand the mechanical behavior and dynamics of the orogenic wedge. Nevertheless, state-of-the-art geoscience knowledge reaches only a very small fraction of the population. For example, recent publications report that there is an increased risk of a future major (M > 8) earthquake in the area between west of Nepal and India (Galetzka et al., 2015; Avouac et al., 2015), and recent estimates of average return period for great earthquakes ranges from 300 to 870 years plus uncertainties (Avouac et al., 2001; Bollinger et al., 2014). However, the local population has almost no information about these recent findings.
What the local population is aware of are their own felt-earthquake experiences, the fresh memory of the 2015 Gorkha earthquakes, and the announcements of the NSC (ML ≥ 4 events in Nepal). The latter information is spread through the NSC webpage1, through social media, and – with some time lag – through newspapers and online articles. Still, the general level of information about what a person should do in case of a seismic event is surprisingly low. Citizen’s awareness is a key element for seismic risk mitigation, which is clearly missing in the field. Some efforts by various organizations after the 2015 Gorkha earthquake around the capital city Kathmandu were initiated, but these have not reached people in the countryside. The majority of Nepal’s population has either a mythological perception or no clear idea about what causes earthquakes and what is the best behavior and practice to protect themselves. In addition, ways to communicate about earthquakes and related topics are not well established in the community.
Our initiative aims to tackle two challenges with a combined approach, for which we start our program in an area of high seismic hazard but relatively limited (although not the lowest) level of information in the country. First, it is crucial to increase the awareness of the local population about the fact that they live in a region where the accumulated energy is sufficient to produce a large earthquake. Second, we need to teach and train citizens in the community for better preparedness and what actions they can undertake to lower their chances of being hurt. In the countryside, no other source of information like television and newspapers are easily accessible, and also in cities it is difficult to gather knowledge from these kinds of sources. Hence, we found that the best way to engage people in learning about earthquakes is through the educational system, as what information students receive at school can be transmitted to their families and communities most efficiently.
In order to undertake this approach, it is necessary to connect communities to citizen science in Nepal. That is why we installed the first 22 low-cost seismic stations in local schools as a part of the Nepal School Seismological Network (Figure 1). This network is already used both for teaching and for sharing locally recorded data openly. We hope that the example set in Western Nepal will spread across the entire country, and that our program helps to make earthquake-safer communities.
Preparatory Phase
The project’s preparatory phase included planning, laboratory, logistic and field work, which we carried out as mostly parallel tasks as follows: (1) definition of the study area and site planning, (2) preparation of educational material, (3) seismic sensor survey, testing and selection. This section describes our approach in detail, and the next section focuses on the implementation in Nepal.
Site Selection
Within the broader frame of educational activities, we planned to build the Nepal School Seismic Network (NSSN) in western Nepal (83–85°E) over an area of ca. 200 km east-west extent, including the epicenter village of the 2015 Gorkha earthquake and westwards from there. The area is relatively densely populated, but is too far from the capital Kathmandu to be included in initiatives aiming to implement earthquake education. There were some case studies for earthquake risk management and risk mitigation in the Kathmandu valley (Asian Disaster Preparedness Center [ADPC], 2000; Moha/Hmgn-Jica, 2002). However, even after the 2015 Gorkha earthquake, when national and international non-governmental organizations had tried to initiate earthquake preparedness projects around Kathmandu for local people, the efforts remained geographically limited (see e.g., the following reports and websites on disaster management and safer constructions: https://www.usaid.gov/sites/default/files/documents/1861/Pages%202-3.pdf, http://www.safernepal.net, https://www.rosie-may.com/2017/07/28/rebuild-nepal/; other projects are on the way]. Our approach, located away from the capital, is different, and complementary in scope.
To the best of our knowledge, no efforts have been reported outside the Kathmandu valley for educational and citizen seismology. We have selected Western Nepal to start our program because (i) people have very limited to no opportunity to learn about earthquakes, (ii) there was no major earthquake in the last 500 years and therefore the probability of such an event is high, and (iii) travel time between the different sites is within reasonable bounds. The main goal in setting up the NSSN was therefore to establish a broadly and possibly homogeneously distributed network across the region, to initiate earthquake education in schools and also to build a seismic network able to provide useful data for both education and basic research. To establish a broad base for site selection, we used social media (facebook and twitter, both popular in Nepal) to spread information about our program, and also asked interested schools to fill out a request form. An excellent knowledge of the region’s geography and social relations, as well as communications skills were required for this step. The non-Nepali co-authors of this work believe that foreigners alone would have had no chance to start and implement this project due to a lack of sufficient local contacts and knowledge of Nepali society.
More than 100 schools submitted a request form from the defined study area. Out of these, we selected 22 along the criteria for good sites as follows:
• the school hosts a large number of students from the area,
• high motivation of the school administrative board,
• feasibility to install the seismometer on the ground floor,
• school located relatively far from a major road, village, or city, to avoid cultural noise (minimum distance from a road or highway must be 200 m),
• the school having its own internet connection and alternate power supply (technical priority criteria),
• the school is reachable by vehicle or short walk.
Each submitted form was evaluated individually to see which site met as many criteria as possible. In many cases, compromises were necessary. We also aimed to have an overall geographical distribution of schools that covers the study area evenly. With the final selection of sites, we covered the administrative regions of Province 5 and Gandaki Province in western Nepal. Finally, to prepare the field implementation phase, we have validated our remote site choices by visiting all schools in person during a reconnaissance trip in April-May 2018. The selected school’s name is listed in Supplementary Table 1, the map of the NSSN is shown in Figure 1, and photos of two typical school buildings are shown in Figure 2.
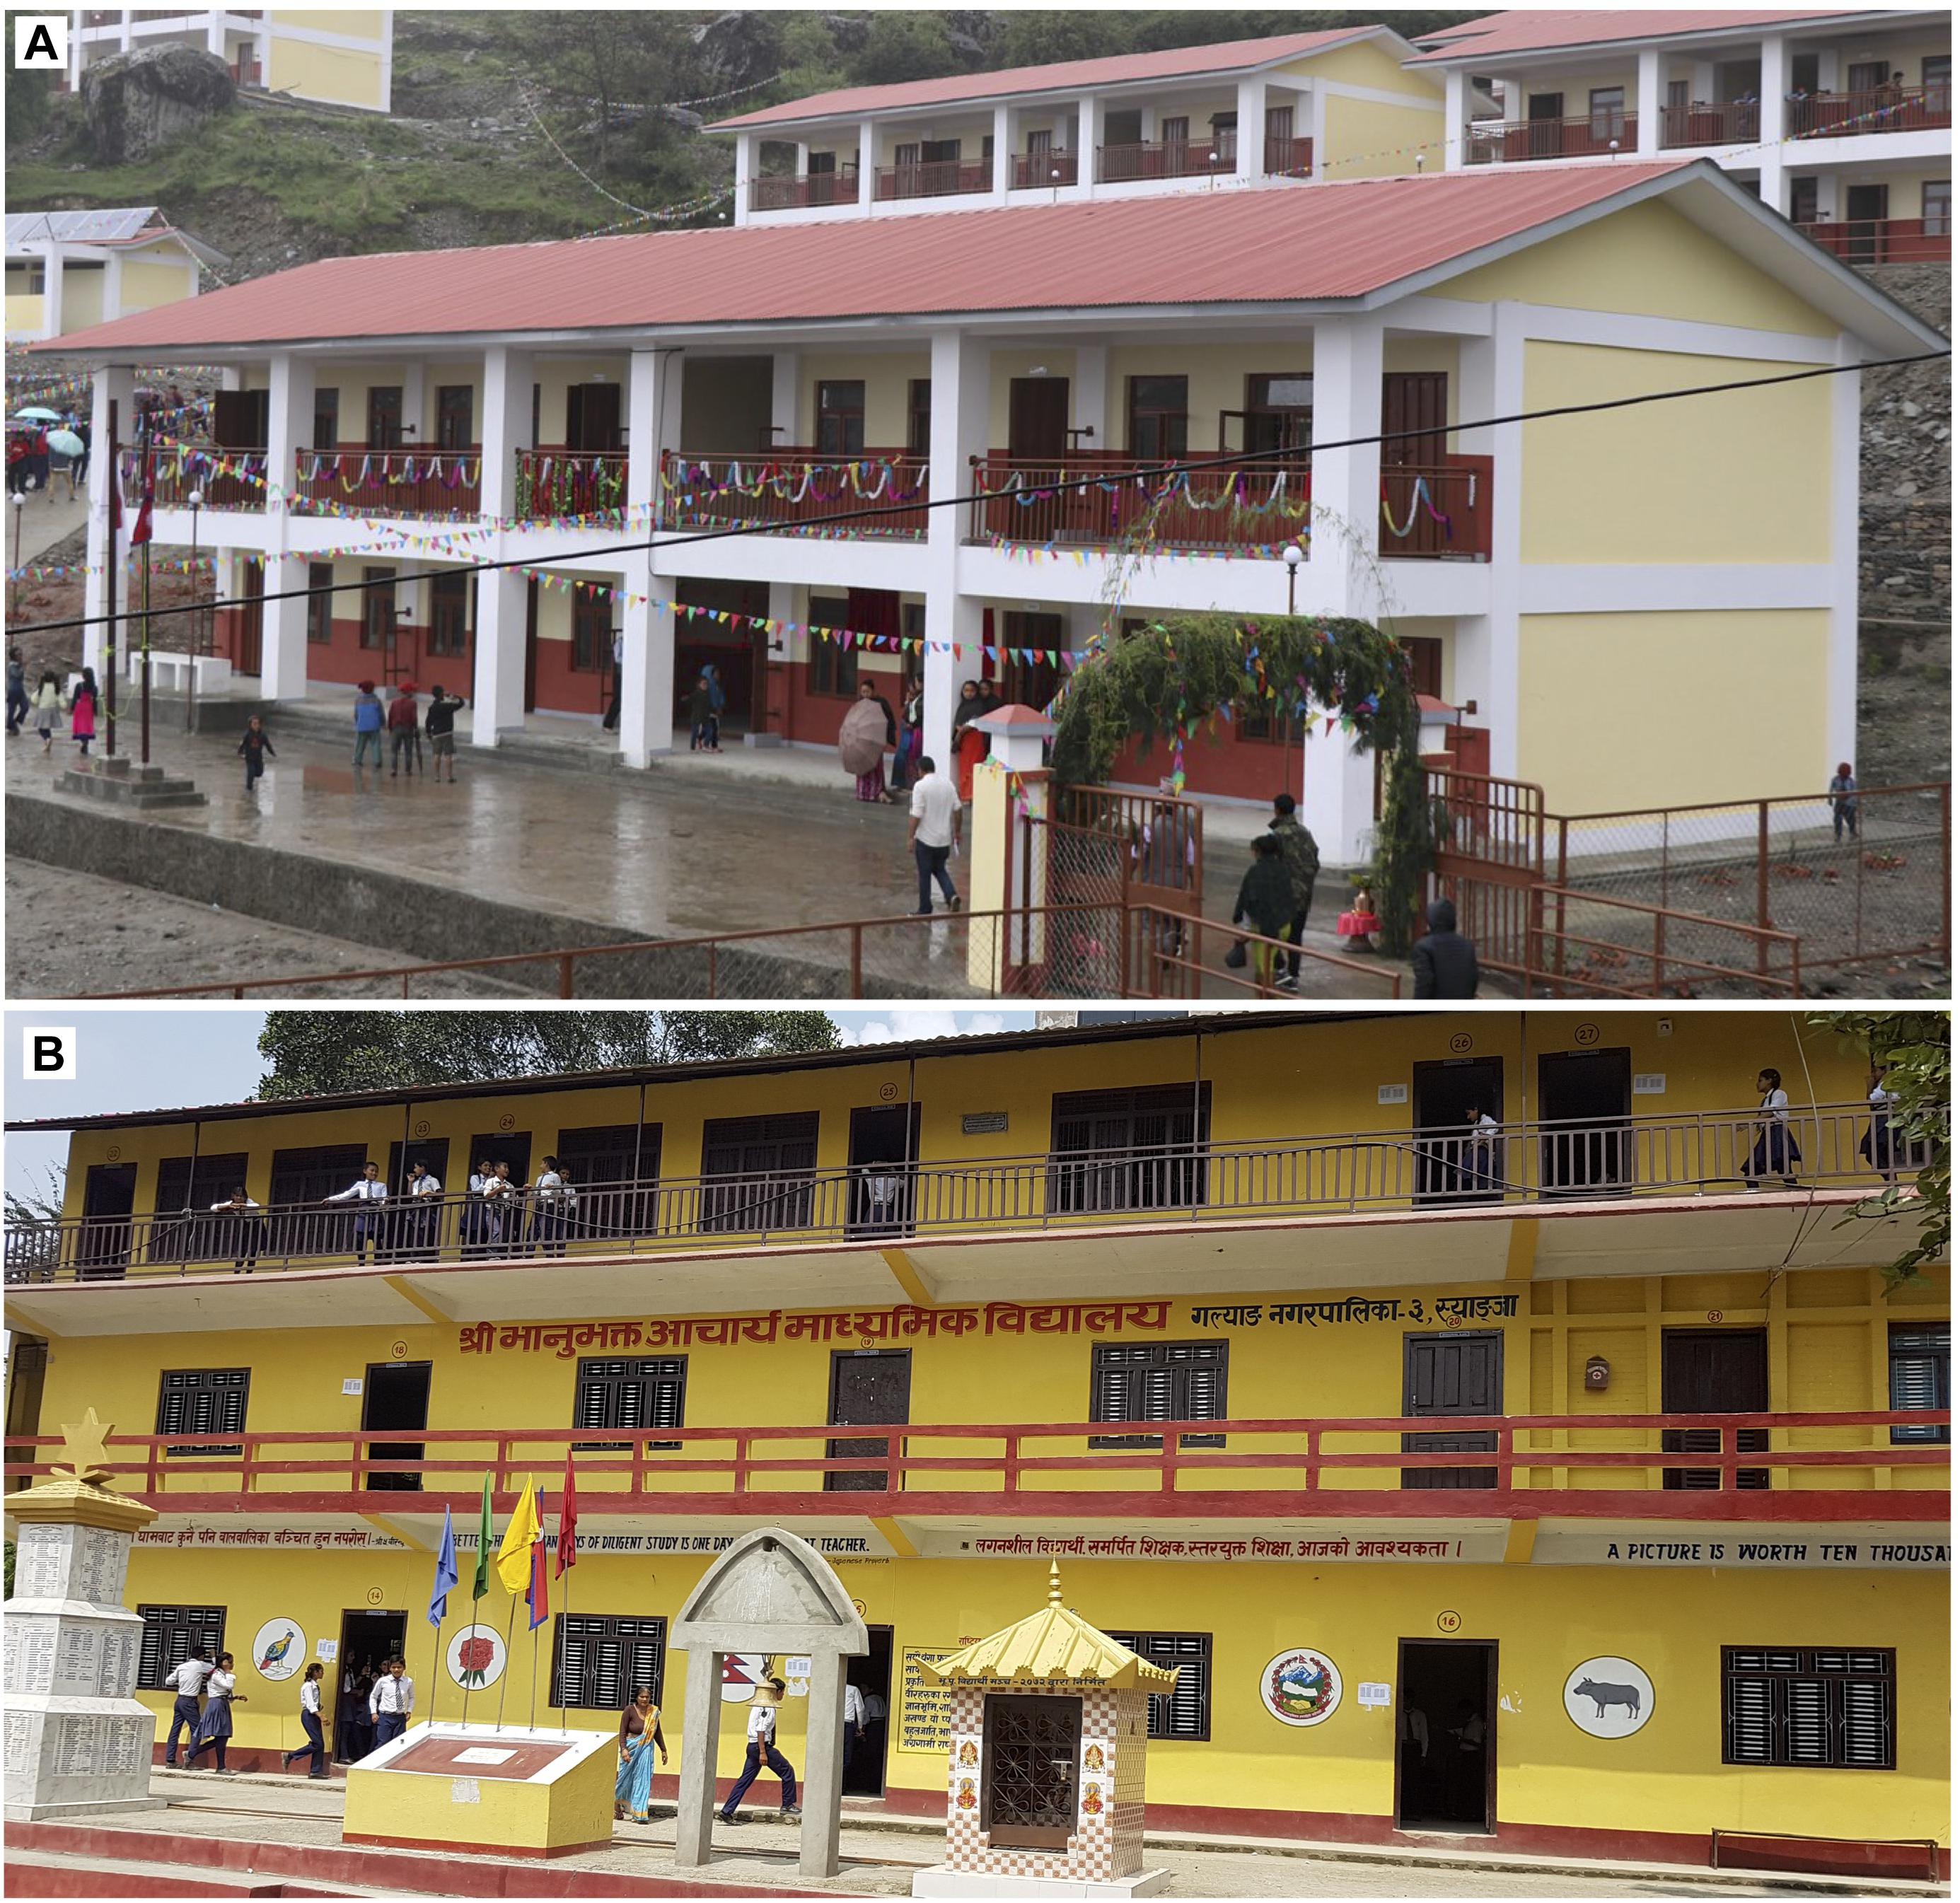
Figure 2. School buildings participating in our program. (A) Shree Himalaya Secondary School in Barpak, Gorkha district. A reinforced cement concrete (RCC) building was newly constructed after the 2015 Gorkha earthquake. A total of 672 students study in the school. (B) Shree Bhanubhakta Acharya Secondary School in Galyang, Syangja district. RCC building, but the third story is not cemented: it is brick, with tin roof on top. A total of 925 students study in this school.
Educational Materials
School education in Nepal occurs at basic and secondary level (Table 1). Schooling begins with basic level and the school starting age for children is 5 years old; however, attendance is not compulsory. As of the 2017 Department of Education survey, a total of 35′222 operational schools (from grade 1) received a total of 7′752′601 pupils (Department of Education [DOE], 2017), which is more than 25% of Nepal’s population. We therefore believe that the schools are the best platforms to share the required knowledge with the community, as relevant education not only teaches the children, but, through their families also reaches further into society. Seismology is not part of the curriculum in schools, a problem we aim to tackle in our program toward better preparedness.
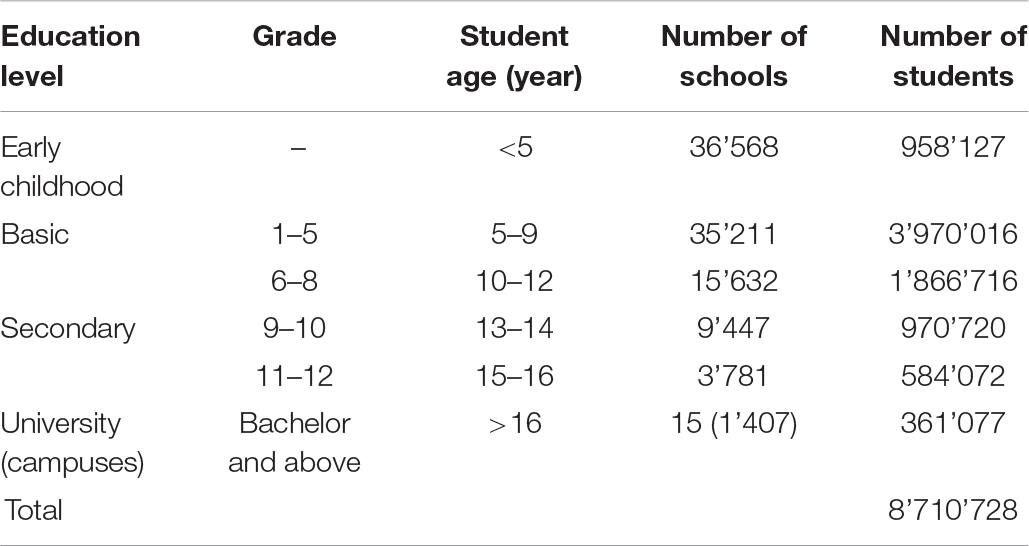
Table 1. Education system in Nepal and key numbers, according to Department of Education [DOE] (2017).
In the context of Earth science education in Nepal, we could find only very limited information about earthquakes in textbooks. We therefore based our approach on existing educational seismology projects around the world. There are a number of similar initiatives running currently (or until recently), mostly in developed countries, such as the United Kingdom school seismology project, the Swiss Seismo@school project, the Irish Seismology in Schools project, the Texas Educational Seismic Project (United States), and the Australian Seismometers in Schools project. We have held discussions with specialists from different countries to gain knowledge from their experiences and to build up ideas for the educational material development for Nepal. We also looked for existing materials which might be suitable for our purpose and context. Numerous suggestions and experiences shared by experts were taken into account in the preparation of several educational materials adapted to the Nepali school system and language.
One of the most important educational material is a flyer, as partially shown in Figure 3A. This leaflet was designed by the Earthquake Education Center in Sion, Switzerland and translated into Nepalese for our schools. This leaflet delivers detailed information on how to prepare before an earthquake, how to save one’s life during an earthquake, and what to do after an earthquake, well-illustrated with drawings and sketches. Information about the contact person and/or office in case of an earthquake, and games related to earthquakes for kids are also included in the flyer. Further educational tools were prepared in advance of our field visit, which we describe in detail under the implementation phase of the project in section “Educational Implementation.”
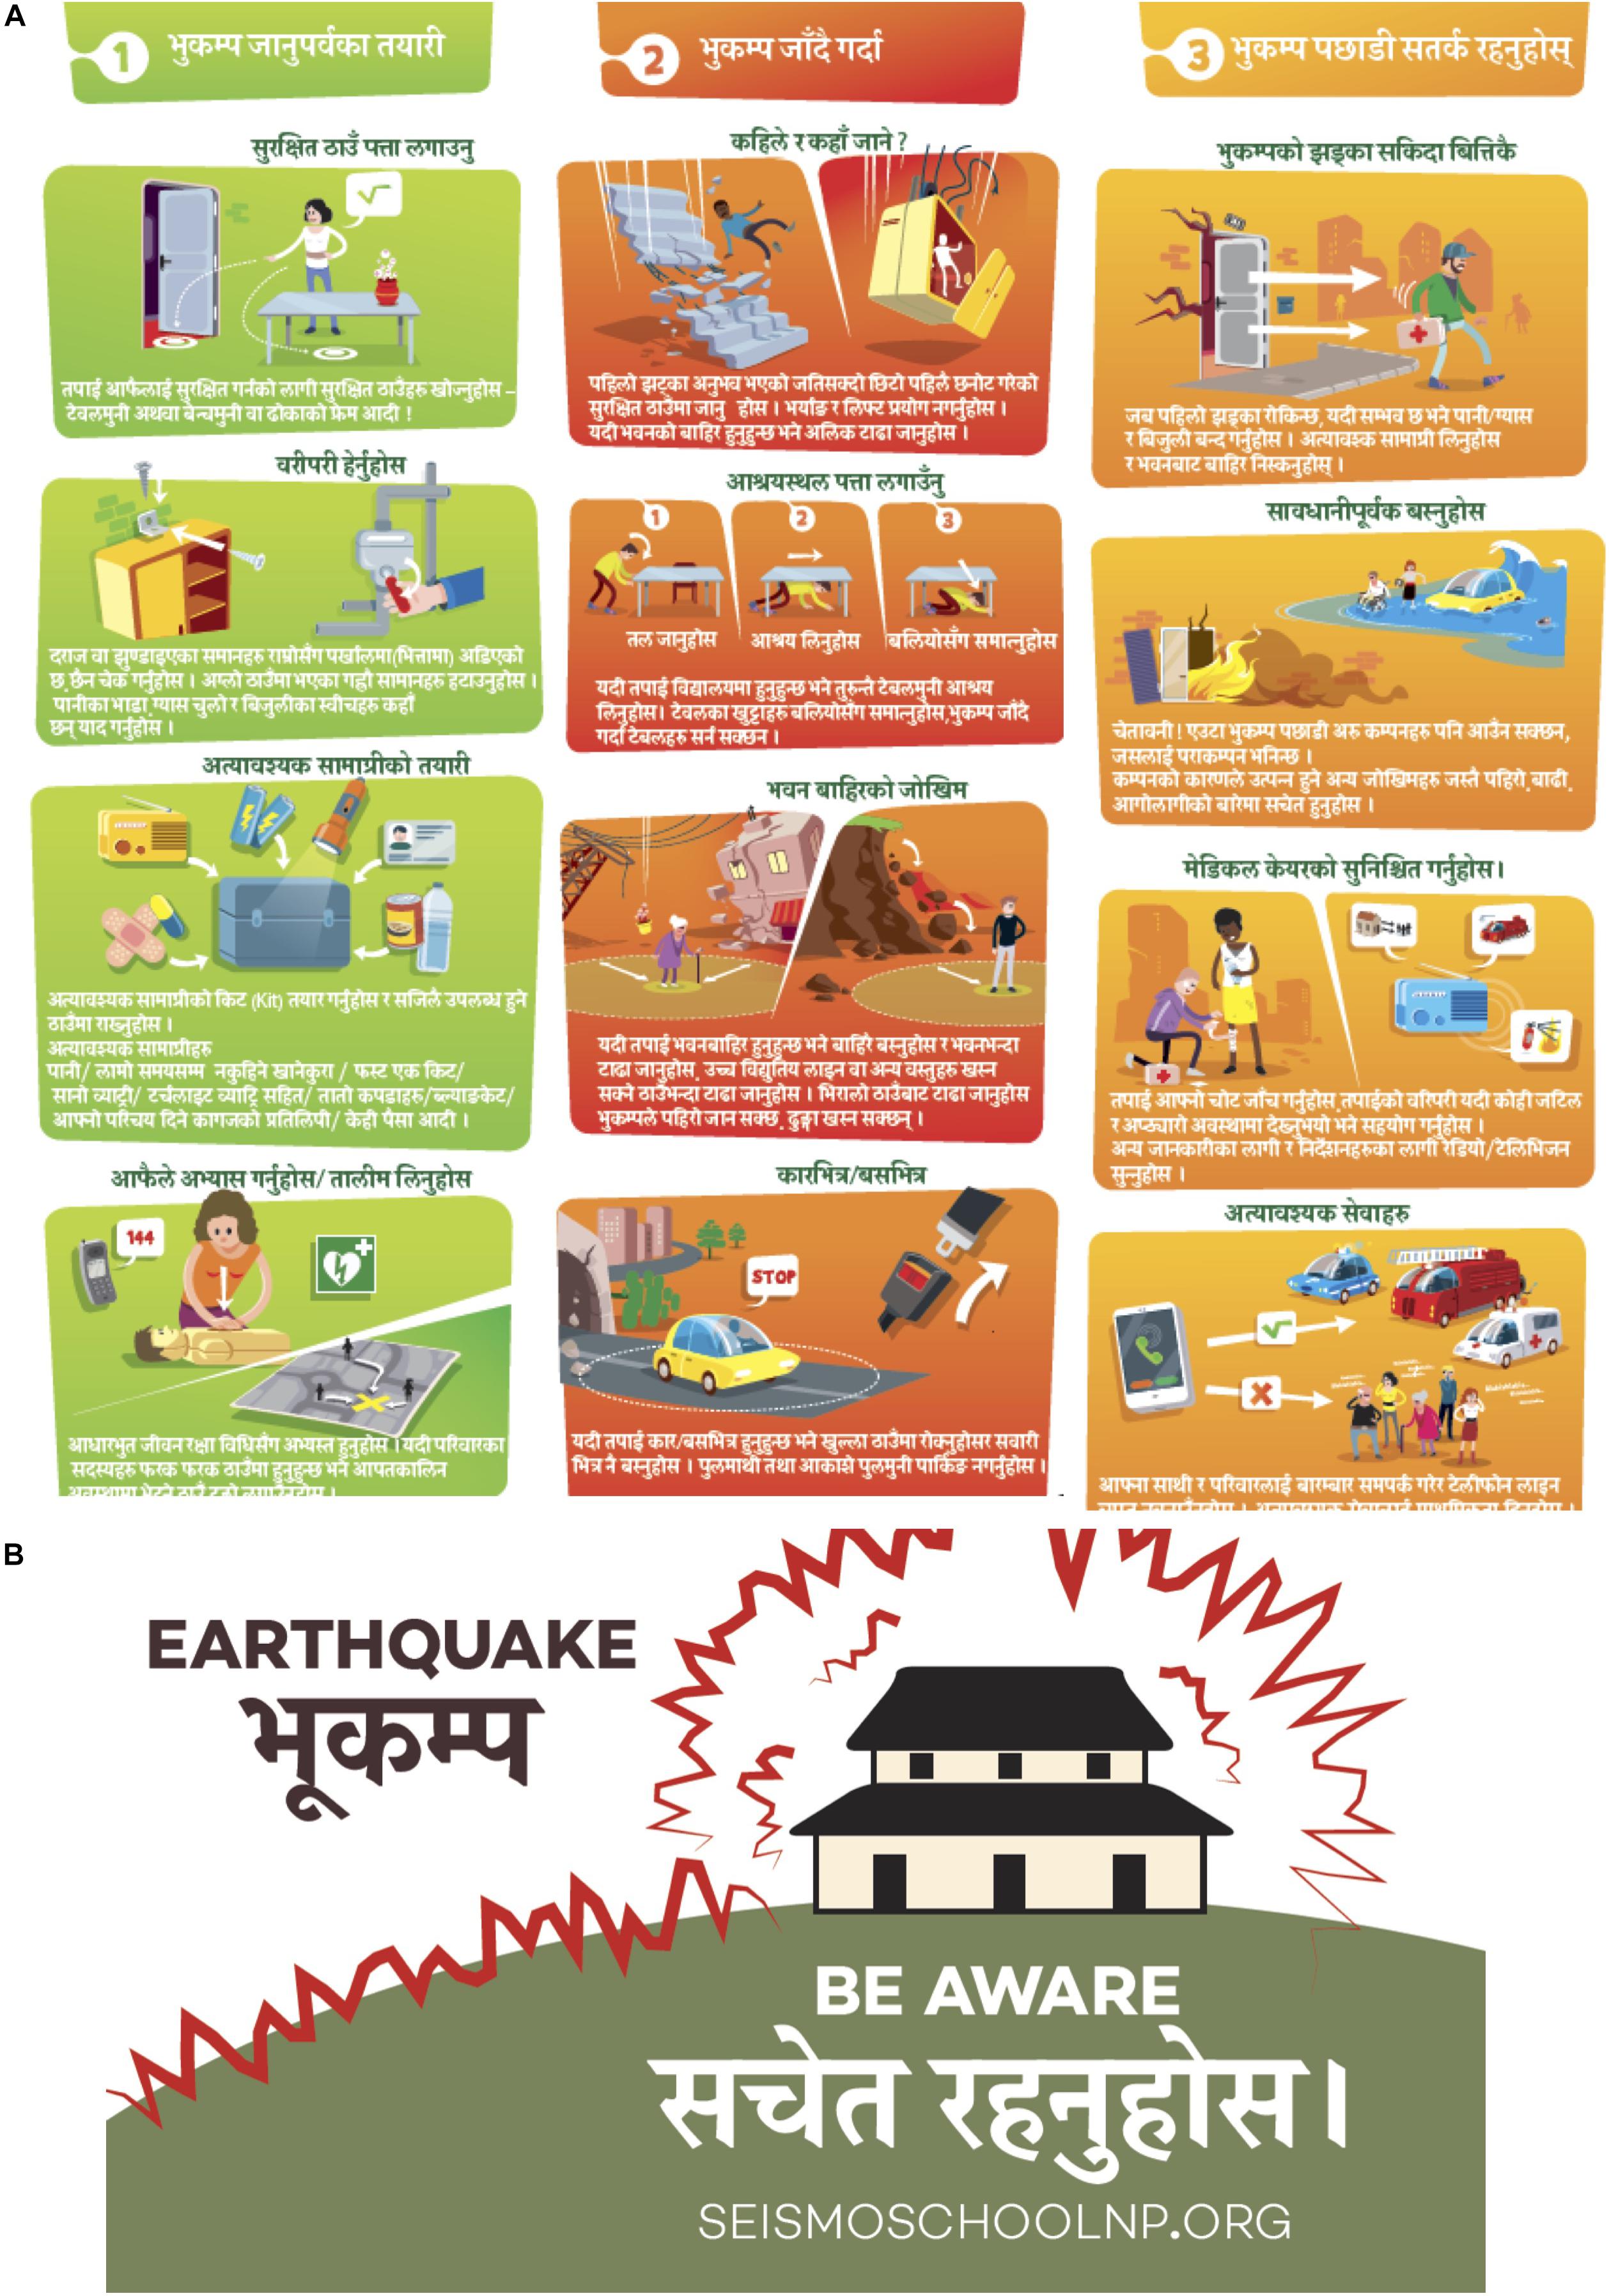
Figure 3. (A) An important teaching material: a flyer prepared in Nepali language on what to do before, during and after an earthquake, illustrated in detail with pictures. The flyer is adopted from the English version which was initially prepared by and for the Earthquake Education Center, Switzerland (http://www.cpps-vs.ch). The full flyer is freely available from our website directly at: http://seismoschoolnp.org/wp-content/uploads/2019/11/Be-Prepared-Nepali.pdf. (B) Earthquake awareness sticker aimed as a reminder, in English and Nepalese language.
Instrument Selection
The seismic sensor should achieve two different goals of the program, namely to be able to detect relatively low magnitude earthquakes, and to be able to be used as a teaching instrument to share knowledge with students in an efficient way in the classroom. Therefore, we needed to find a compromise between a simple pendulum which is a common instrument in Nepali schools to teach physics, and research quality modern broadband sensors that are very expensive. Following literature review and based on personal communications with several experts in the field, we found many low-cost seismological instruments which seems to satisfy both our target criteria. We carried out a market survey on low-cost sensors available around the world by defining criteria as follows:
• total cost including the delivery charge is cheap, below 500 USD,
• easily applicable for educational purposes,
• reasonably high sensitivity to detect local earthquakes,
• easy to handle,
• possibility to record data without an additional computer.
Our initial list included a total of 16 types of seismometers, some of these were already adopted in programs with similar purposes to ours (e.g., in the United Kingdom, at IRIS). From this list and using the criteria above, we have selected four types of sensors: the Quake Catcher Network (QCN), the Lego, the Slinky, and the Raspberry Shake 1D (Figure 4). We purchased a sample instrument of each, and carried out various tests in laboratory conditions to assess their respective sensitivity, detection threshold, noise level, frequency band, ease of use, adequacy to field conditions, etc. Our findings are synthesized in Table 2, in which two other sensors are also included from Zollo et al. (2014). After this comparison of performance, the RS1D instrument was found best for our purposes and selected for our project. Subsequently, we found that Anthony et al. (2019) judged the RS1D suitable for studying local and regional earthquakes.
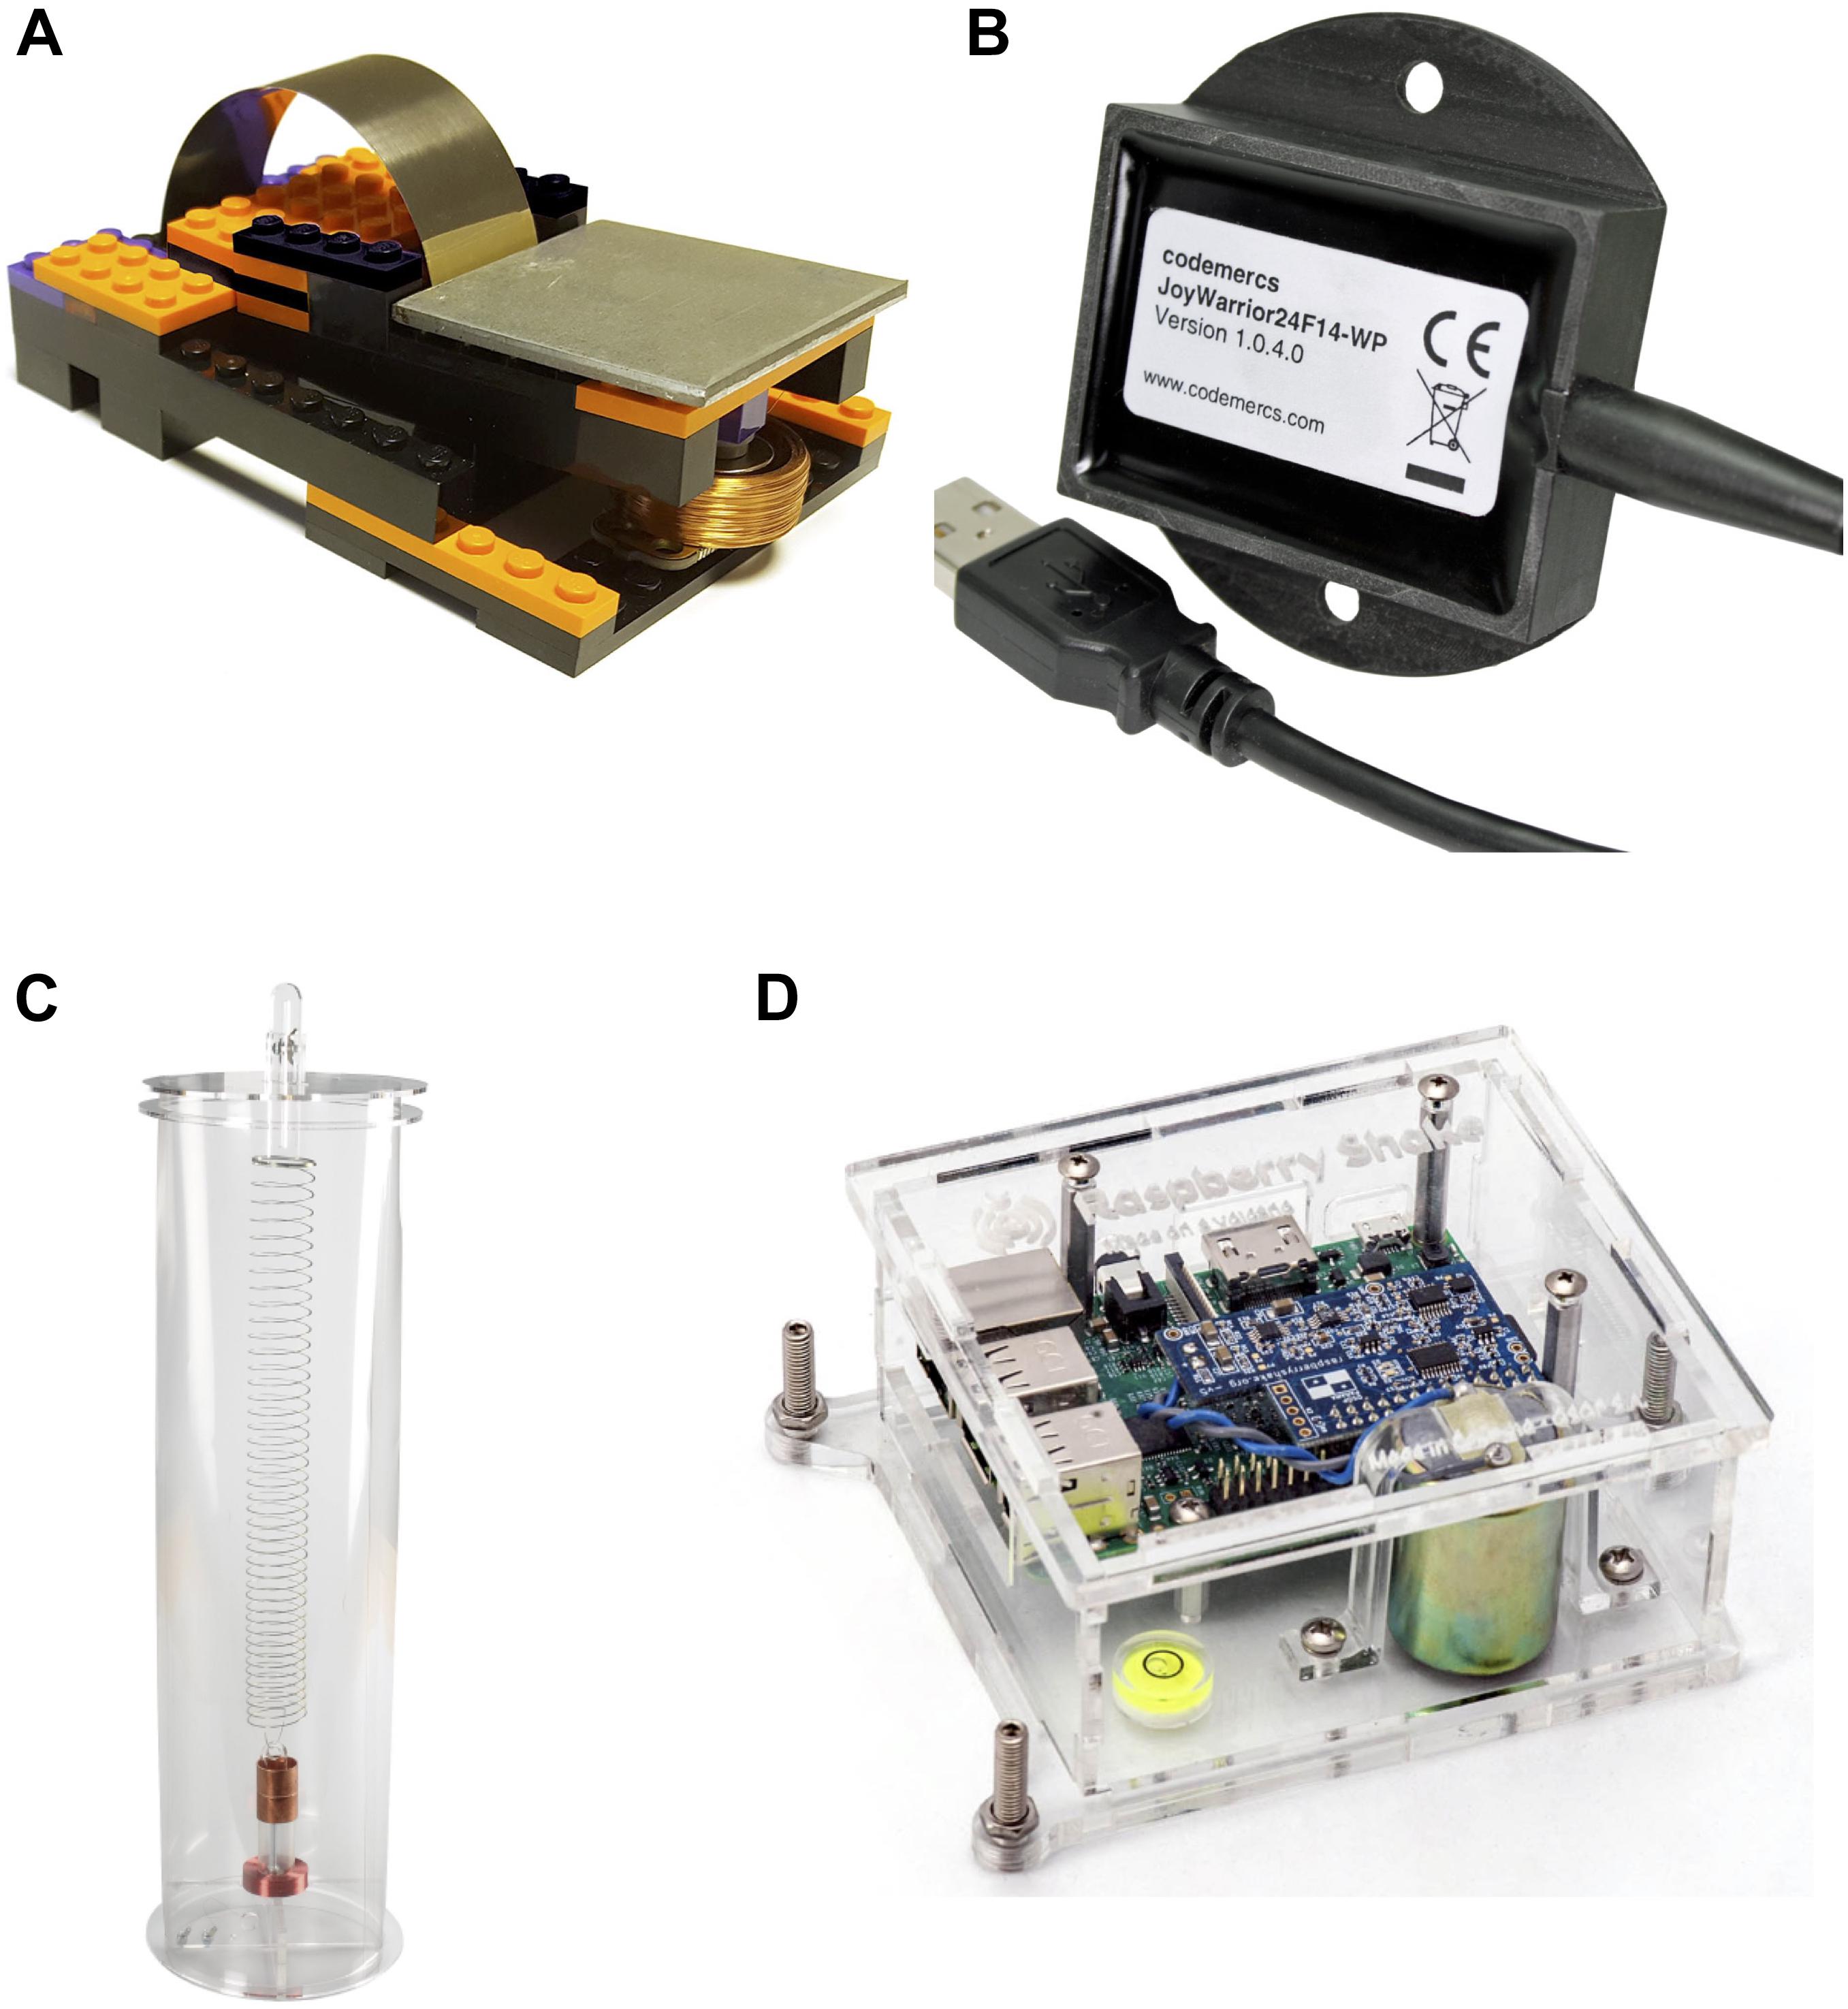
Figure 4. Low-cost sensors purchased and tested before selecting one for our program: (A) Lego, (B) Quake Catcher, (C) Slinky, (D) Raspberry Shake 1D. See Table 2 for the characteristics of each sensor and our evaluation.
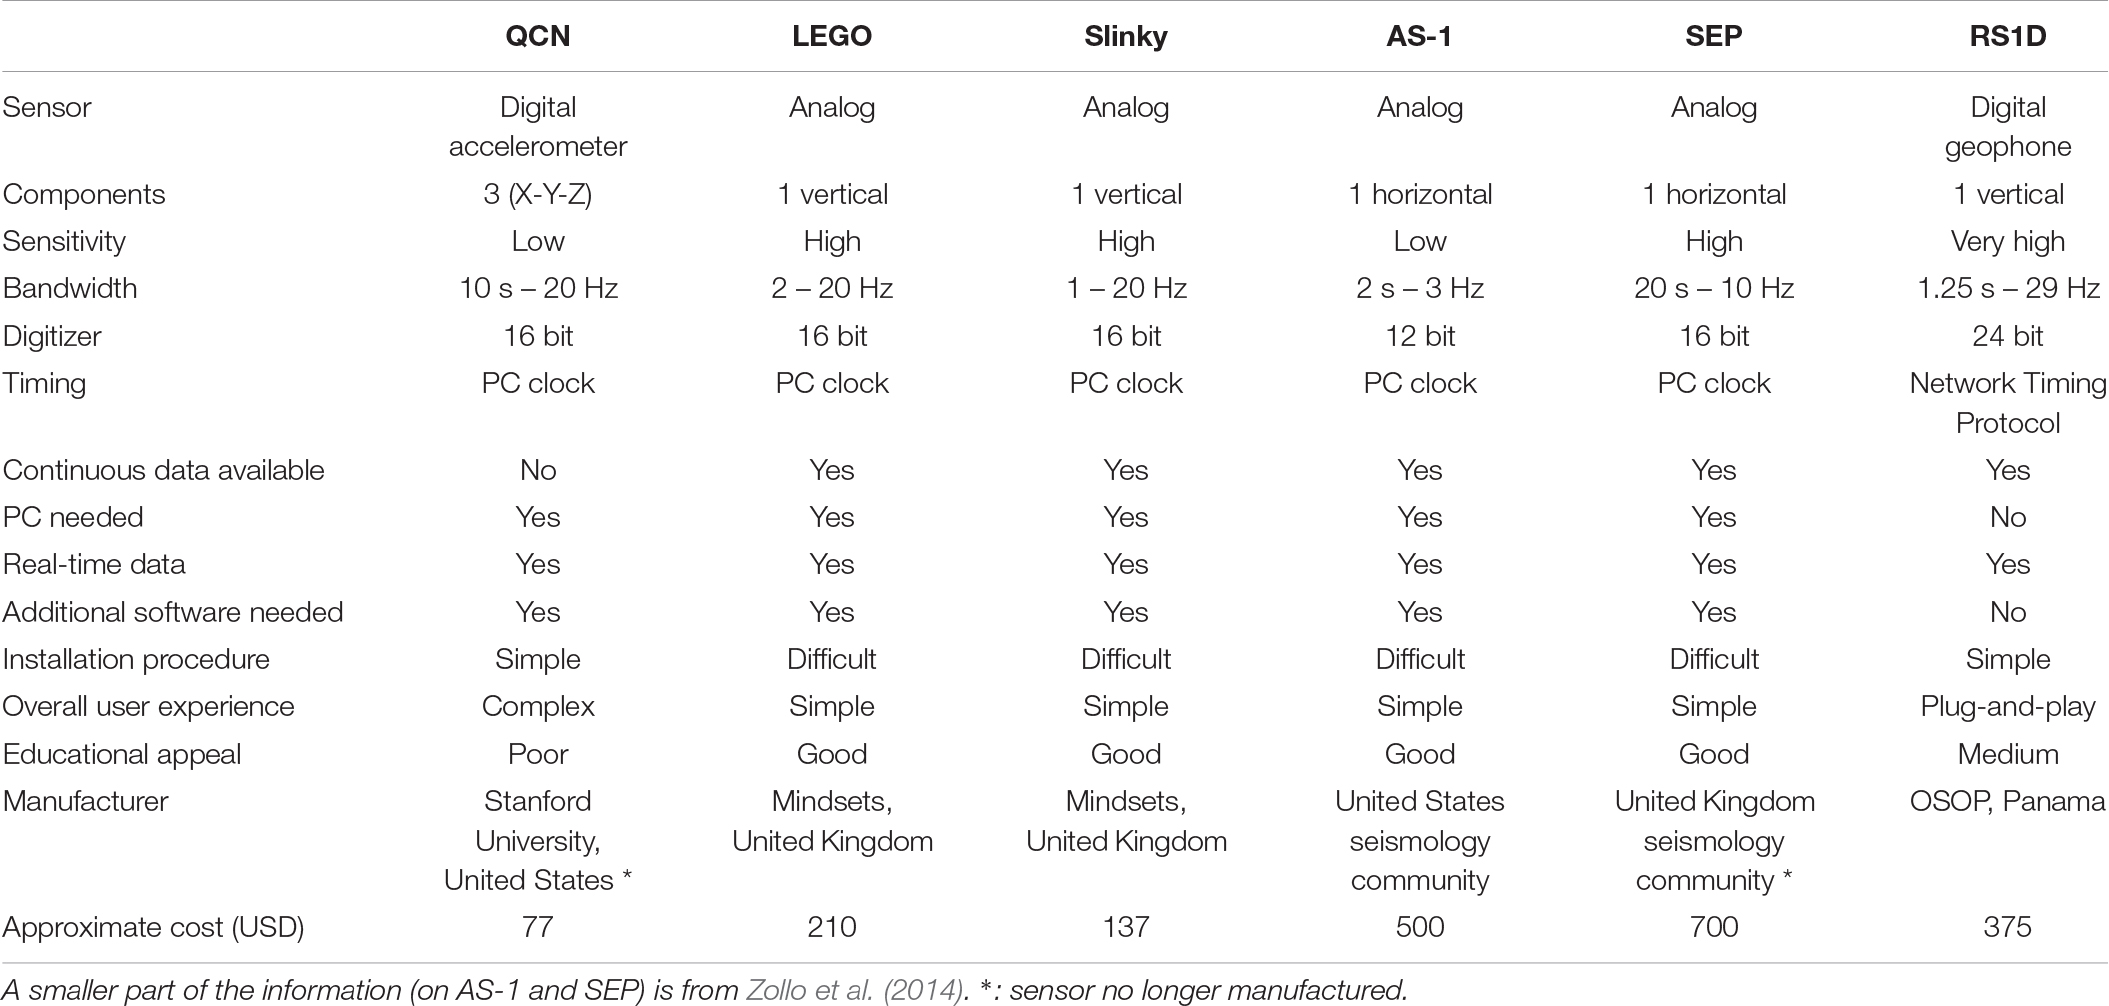
Table 2. List of seismological instruments tested for the educational purposes and comparison of their characteristics.
To complement our laboratory tests, we also installed an RS1D sensor at a field test site at a low-noise location in Grimisuat, in Valais canton, Switzerland. This region is known to be that with the highest seismic activity in Switzerland, with recurrent damaging events. The latest major event occurred in 1946 in Sierre, and had a magnitude of 5.8 with strong aftershocks (Fäh et al., 2011). We installed a sensor in March 2019, and shortly after we were able to detect an earthquake of ML1.0 at 36 km distance, located by the Swiss Seismological Service (SED). This was a surprise to us, and the good performance of the sensor was confirmed by the recording of a “footquake” at less than 3 km distance following the hitherto earliest goal (10 s after kick-off) scored in the Swiss top league which was celebrated by ca. 7′000. At our test site, during 6 months of operation, more than 210 events (0.4 ≤ ML ≤ 4.2) have been recorded. These events are extracted from the SED web catalog2,3. The observed peak ground velocity values are discussed below. The data recorded at this station is available as sensor ID R291C of the AM (RaspberryShake) network, and real-time data can be viewed directly at https://raspberryshake.net/stationview/#?net=AM&sta=R291C.
Implementation in Nepal
After several preparatory discussions, we decided to apply a people-centered approach in our project, where students and local people have the opportunity to directly interact with scientists; this is considered to be more effective than a top–down approach (Scolobig et al., 2015). The preparatory phase of fieldwork consisted of a ca. 1-month reconnaissance trip in Nepal during which all selected schools were visited and cooperation agreements signed, as well as the first earthquake-focused classes were taught in Spring, 2018. The implementation phase started with a 2-day educational workshop for school teachers in Pokhara, followed by visits to every school where the low-cost seismometers were installed and full educational activities started in Spring, 2019. The implementation phase lasted 34 working days including all travel to Nepal and ca. 3’700 km travel on roads in Nepal in ca. 480 h. About 6 months later, all sites were visited again for station maintenance (where needed) and updates on the educational side. Up to now, a total of ca. 77 extended working days (ca. 980 h) and ca. 9’200 km distance traveled were spent in the field.
Educational Implementation
During our early visits, we could ascertain that schools play a vital role in teaching the essential elements of common values and culture. The teachers were well respected, the students still wore uniforms (sometimes classical, sometimes modern), and in most cases a class or group of students were waiting for our visit. Therefore, teaching earthquake related themes to students in schools still seemed a good idea after the field visit. A critical element was to do most of the work in the Nepali language: while most teachers we met spoke English and most students understood English, it was easier for them to talk in Nepali and ask practical questions, or simply to overcome a normal level of shyness.
During the reconnaissance trip, we talked to the school principals and management committees about our program and its benefit to the community. The level of interest was very high and they were excited to see the appearance of someone for earthquake education in the school for the first time ever. We have given a few lectures and taught students key information about earthquakes in every school. In our experience, students are highly interested to learn about earthquake science, but they lack relatively basic knowledge to start with. We have focused on delivering some of this knowledge in an easy and simple way. For example, regarding the Himalayas, we talked about the height of Mount Everest, which was known to every student, but also the age of the Himalayas, to which nobody knew the answer (despite some geological evidence sold in the area as tourist souvenirs). Giving the age ourselves, we could then continue onto the formation of the Himalayas as a consequence of subduction of the Indian plate beneath Tibet and the collision history. This then led onto moving plates, which are the source of energy stored beneath the surface, episodically released to create earthquakes. We also demonstrated what can be done in case an earthquake hits the school or their homes, and performed earthquake drill exercises to shelter beneath tables, doorframes, or to evacuate to a safe place.
A delicate point of the communication was not to cause confrontation between science and people’s religious or mythological views. We prepared this partly with the help of a Hinduism specialist. The strategy for teaching and discussions relied on two main points. First, to express that we have come to explain our views, and not to argue with their devout opinion or judge in any way. Second, we presented them a picture of the Earth, showing symbols of twelve major religions that exist, and then added symbols representing research and science, which is another view on how the Earth functions, the one which we came to present them. This strategy has worked well so far.
During the reconnaissance trip, we had already distributed the Nepali earthquake preparedness flyers (Figure 3A). We added further elements to this in our main fieldwork in 2019. We designed a 9-by-5 cm sticker (Figure 3B) to remind people about earthquake hazard, which we distributed to students and teachers (3’000 copies, >100 for each school so far), which should increase people’s level of awareness. We also prepared an “Emergency Meeting Point” sign in Nepali, of which we distributed plasticized copies to each school. All these materials are freely available for download from our program’s website Download page. Moreover, we have offered a slinky to each school: a colorful plastic spring with the help of which teachers can demonstrate P and S wave propagation in the classroom (Figure 5).
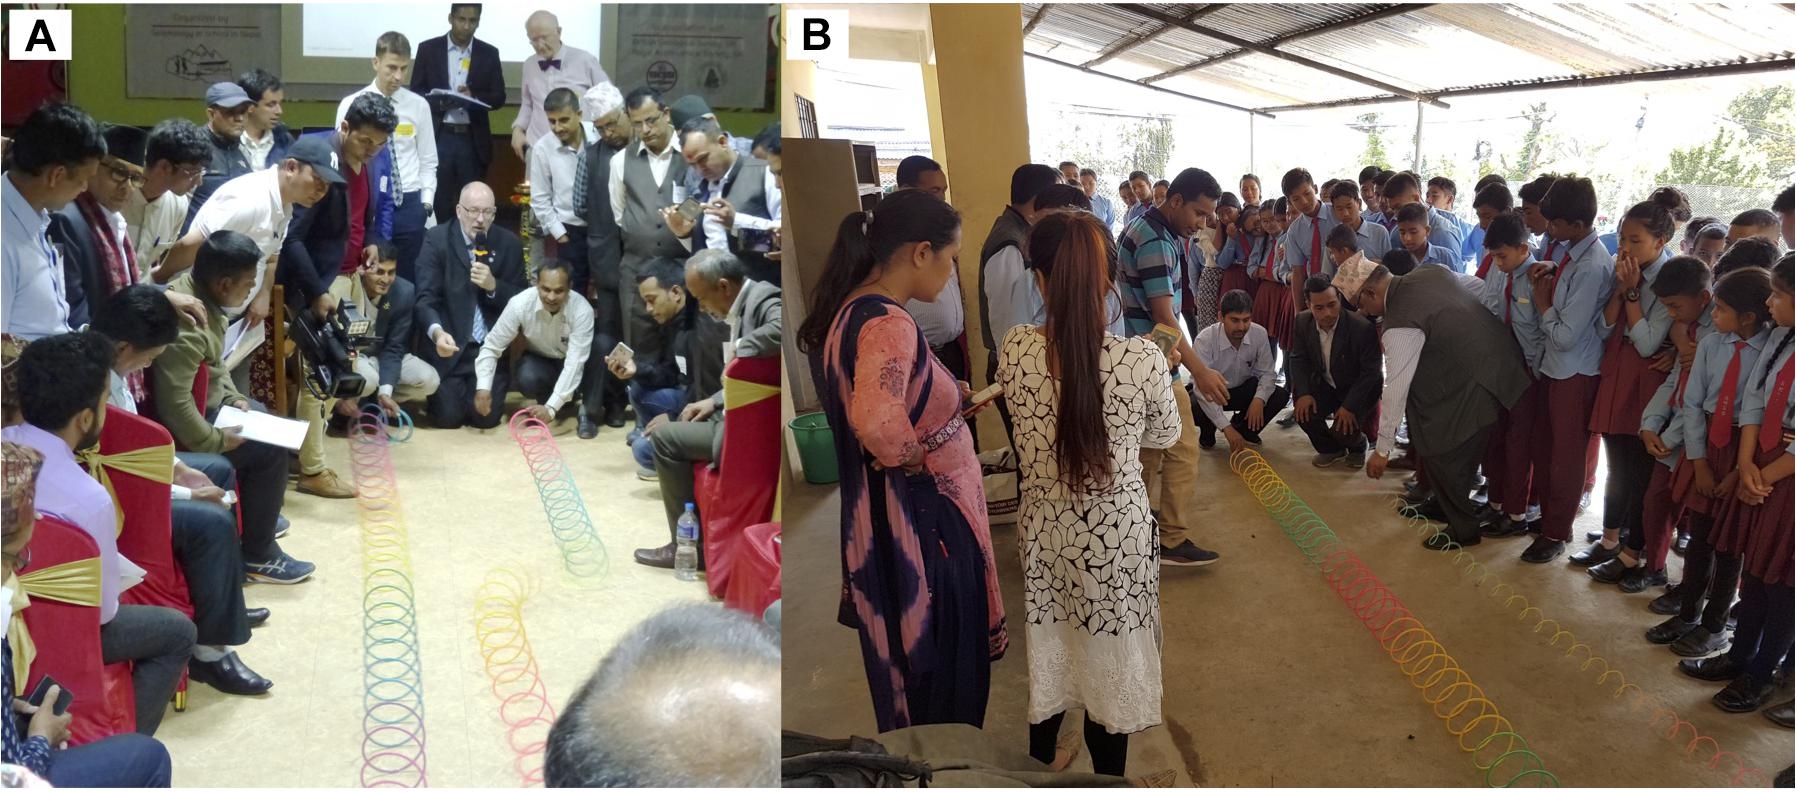
Figure 5. Educational demonstration examples. (A) Nature of the S-wave propagation using a slinky, explained by Dr. Paul Denton (with microphone) and performed by a voluntary participant during the First International Workshop on Education Seismology in April 2019 in Pokhara, Nepal. More than 80 school teachers participated in the workshop. (Photo Credit: Peter Loader). (B) Shiba Subedi (in T-shirt) demonstrates a P-wave using a slinky and discusses its nature with students in Balmandir Secondary School, Gorkha district. (Photo Credit: School). All people or their legal representatives on the photos have agreed to be taken on picture and to be presented in frame of this research project.
Workshop
Even though our occasional visits to the schools with lectures, training and discussion are a special opportunity for both students and teachers, this effort alone would not be sufficient to reach our goals, either in terms of education of the topic, or to reach further into their communities. To increase the frequency and efficiency of learning, we therefore organized a workshop primarily for school teachers at the beginning of the implementation phase, and in the center of the study area, Pokhara. This event was very important both for knowledge transfer and for crossing the language boundaries: international experts presented their knowledge in English to 96 local participants, who then are able to disseminate this in the Nepali language to their respective audiences. The 2 days of workshop allowed plenty of time for discussions, translations, and also for sharing educational experiences between Nepali and foreign school teachers. Out of 96 participants, over 70 were teachers from the 22 selected schools and further 10 from other, interested schools (mainly science, computer science, social subject teachers, as well as school principals), and there was a representative presence of the Province, of the Nepal Army, Nepal Police and Nepal Armed Police Forces, of the National Seismological Center, a few university and college students, as well as several journalists. The teaching by the international experts covered a broad spectrum of topics, from wave physics to Himalayan geology, earthquakes to plate tectonics, teaching methods to practical advices regarding earthquake preparedness, and several demonstrations with and without seismometer involving highly motivated volunteers from the audience (Figure 5). A local earthquake occurring during a workshop session provided a very good demonstration and analysis topic. All the workshop material, including videos, is freely available from our program’s website. Furthermore, a number of relevant and presented Earth Learning Ideas4 are also directly linked.
One of the most interesting sessions of the workshop was the very wide ask-me-anything session. The presenting experts received a plethora of questions from the audience; some to clarify terms and concepts, and some really unexpected ones which lead to very interesting discussions. Here we list a few examples:
• Do tectonic plates always move in the same direction?
• Do you necessarily make earthquakes on faults?
• Why do mythological explanations of earthquakes often involve animals?
• Which discipline studies the relationship between Hinduism and earthquakes?
• If the Earth is an ellipsoid, with the poles being closer to the center of Earth than the equator, is the heat flow higher at the poles?
The full board of experts answered all questions based on their scientific, technical and personal knowledge, sometimes helped by Nepali translations.
The event was a big success according to both the participants and speakers, and the teachers seemed to leave happy and with a high level of satisfaction. The school teachers reported that the workshop greatly helped them to make their first steps of teaching earthquake related topics in the classroom, and that the workshop format was helpful for an easier transfer of new knowledge. They were grateful for the memorable event, and that the organizers cared more about their earthquake safety than they themselves did. The presence of many journalists from different media had a high impact regarding earthquake awareness, as the workshop and the program featured in 23 articles in national and regional newspapers, and in an extended live interview on the most widely watched Nepali television station. This ultimately increases the attention of people toward earthquakes and education of related themes. Based on the overall experience, we believe that this workshop made a long-term impact and contributed to earthquake-safer communities in Nepal.
Seismological Implementation
The visit of the schools started immediately after the workshop, and by early May 2019 we had successfully installed the Nepal School Seismology Network (Figure 1). The preparation for the full network installation in the field was based on the useful experience and lessons learned from the pilot station. By the end of the field work, all 22 RS1D seismometers had been installed on the ground floor, in most cases in the computer lab, the principal’s room, or the science lab. We fixed the sensors on a small wooden platform cemented to the ground to avoid minor flooding. In the future, we plan to replace the wooden platform by paving stone or small cement platform. We also added either a simple (wooden box) or thermal (survival sheet covered polystyrene box) shielding around the sensor. Each station is also equipped with an uninterruptable power supply, and wired internet connection directly from a router. The NSSN can be cited through this article as well as under the digital object identifier doi: 10.5281/zenodo.3406345. Raw seismological data from the NSSN is available through RaspberryShake, currently archived for 2 years, and NSSN stations are also regrouped under the virtual network _NSSN5. The data recorded by the NSSN can be downloaded freely via the following fdsnws server and command line, adapted by replacing the italic text by the wanted values: https:// fdsnws.raspberryshakedata.com/fdsnws/dataselect/1/query?net= AM&sta=stationID&loc=00&cha=*HZ&start=starttime&end= endtime. To download data from a particular station of NSSN, for example, R732B and for the two hours’ time period on 2020 March 25 starting at 01:00:00 UTC, following command is applicable to download the desired data directly “https:// fdsnws.raspberryshakedata.com/fdsnws/dataselect/1/query?net= AM&sta=R732B&loc=00&cha=EHZ&start=2020-03-25T01:00 :00&end=2020-03-25T03:00:00”.
To facilitate educational activities and also troubleshooting simple problems, we prepared detailed guidelines on how to visualize waveforms recorded by the seismometer on a computer, how to use the EQInfo smartphone application (Weber and Herrnkind, 2014), and how to estimate magnitude and distance of local earthquakes from their own school’s waveform recording. This document was distributed in every school and is also published at our website. We encouraged teachers to spread the information to citizens from the community, so that they can also share the experience without being at the school. Teachers report they use the EQInfo application for classroom activities.
A few participating schools have had the opportunity to receive additional funding from the local government to facilitate the logistics necessary to host an NSSN station. For example, Prabha Secondary School, Pyuthan has been selected by the Information and Communication Technology program and awarded ca. 5’000 USD from the Nepal government to equip a full computer room, purchase an alternate power supply, and to establish the internet connection for the school. Janak Secondary School, Gaindakot has received ca. 1’200 USD for creating a new, wired internet connection and power backup installation from the nearby Gaindakot Municipality, Nawalpur district. In the majority of schools, the seismometer is installed in a room corner separated by a thin wooden or aluminum wall, which improves signal-to-noise ratio, visibility and security (Figure 6). We are proud to report that we also reached the epicenter village of the 2015 Gorkha earthquake, Barpak, a remote place where 72 people died from the most recent major earthquake. At the moment of our first field visit, people were back to daily business after the devastating earthquake, but schools were in temporary shelters. By the time of the installation, the school managed to receive support from the government-owned telecommunication service provider, Nepal Telecom6, to install the first wired internet connection in Barpak, which made the installation of the seismometer possible.
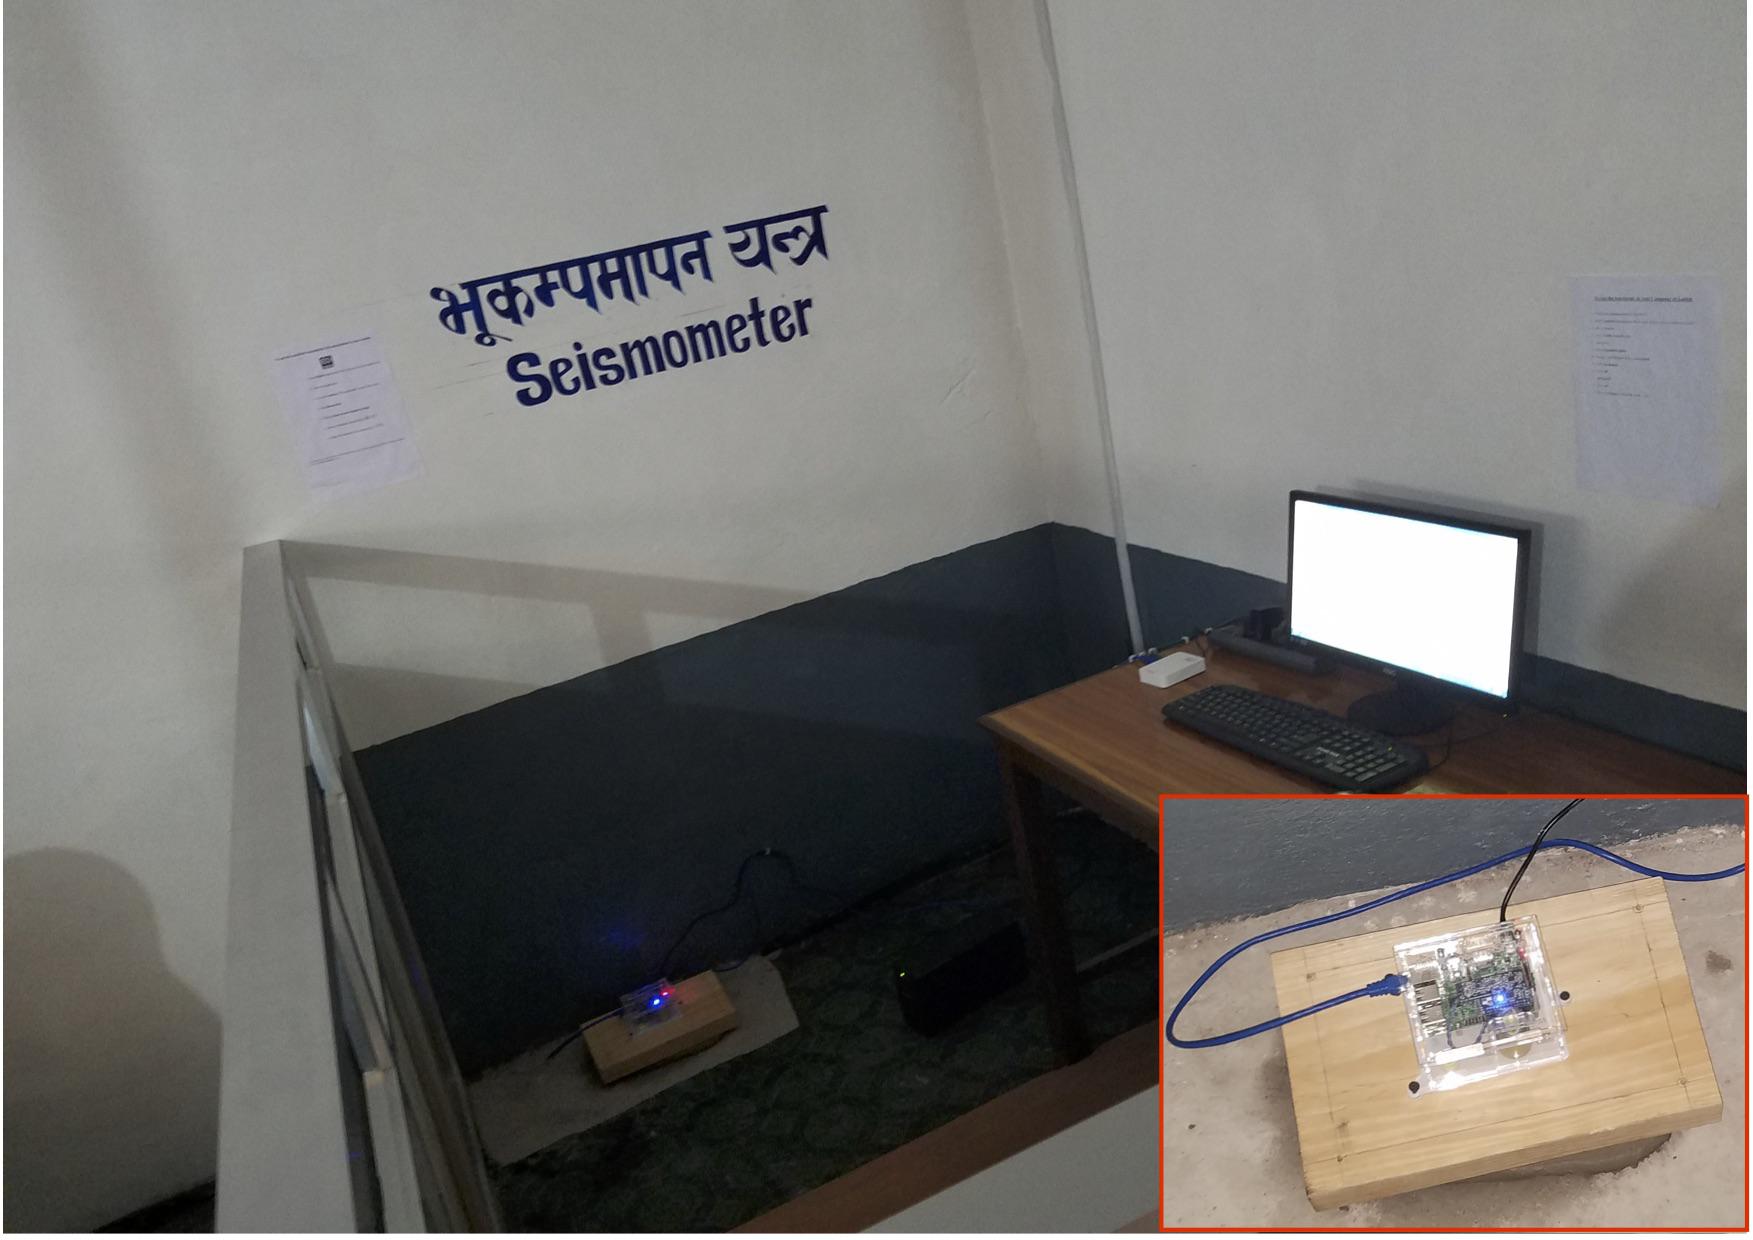
Figure 6. Example of the setting of an installed seismometer, in Shree Siddha Baba Secondary School, Gulmi district. The sensor is installed on the ground floor by making a partition in the Accounting Room; it is fixed to a wooden block which is itself fixed into a ca. 2 cm thick cemented base on the ground (inset). The station is connected to a desktop computer for real-time data visualization via the jAmaSeis (Drago et al., 2009) software. Detailed information on how to visualize waveforms on a smartphone using the EQInfo app is printed on the wall (A4 paper). The word “Seismometer” is written in on the wall in Nepali (and English) language.
During the sensor installation, schools have invited high level authorities from the district (e.g., Mayor of the municipality, Chief District Officer, etc.) to show how the sensor records earthquakes, and to demonstrate that the school participates in the earthquake education program. The local news coverage about seismometer installation typically followed within hours or one day7. Since the entire network has been installed, we are communicating with schools using social media (twitter, facebook) to keep the teachers’ attention on the project. On our program website, we are posting figures of recorded waveforms from local, NSC-reported earthquakes. Our approach has been very well received by schools and also appreciated by the local governments. We hope that the ideas will spread to other regions of the country as well, and we will seek opportunities in this direction.
Results and Discussion
Education
Teachers are at the first line of communication with the students. With high motivation, they are doing regular exercises with their students by showing waveforms recorded by the seismometer at the school (mostly for ML ≥ 4 local earthquakes). In each school, we encouraged teachers to practice evacuation exercises. The lessons learned from these drills helps the school community to respond more efficiently in case of a large earthquake, which increases the school’s resilience.
Teachers gave very good feedback on the main workshop and took it as a great opportunity to learn about earthquakes at their level. “I am more interested in Earth sciences after this workshop” said one teacher after the conference; a school principal expressed his gratitude because we were more worried about their earthquake safety than they were.
To evaluate the efficiency of our program and to assess the level of knowledge before its start and after 1 year of operation, we conducted a survey during the reconnaissance trip. A representative group of students from the selected schools, teachers and local people completed the survey with ca. 30 questions, and ca. 350 full sets of answers were collected. We plan to carry out the second survey in 2020 and compare it to the first one’s results to analyze the changes our program may have promoted.
With our program, school teachers estimate to have reached a broad audience in the studied area: directly more than 18’000 students benefited from the program, and indirectly ca. 150’000 people in the region could have been reached (Supplementary Table 1). While evaluating the indirect effect, an average family size in the community and the sociological situation were also taken into account. To share our activities and knowledge continuously with an even broader community in Nepal, we have developed the program’s own webpage8. All materials for the education, information of recorded earthquakes, guidelines for exercises, important questions and answers are available on the webpage. This page had 9’880 visitors in 12 months (last access on February 11th, 2020).
Seismology: Waveforms and Instrumental Intensity Map
The NSSN was successfully installed by May 2019 and operates well since then. While 18 stations have been recording data continuously, four others encountered problems due to the unstable internet connection and/or power supply, therefore a small amount of data is missing from those sites. In the monsoon season, (only) one of the sensors broke, which we could then replace. The site selection criteria, as described earlier, made us make compromises between education and seismological purposes. For example, a station in a populated area will reach more people through education, but the site will have a higher noise level. Using the data from June to December 2019, hourly power spectral density probability density functions (PSD PDFs) have been computed, with 50% overlap. Looking at the median values of these by station (Figure 7), most of sites are below the high-noise model (Peterson, 1993), whereas three sites CHITN (R8C46), GAIDA (R6EC4) and NAWAL(R51F6) are badly affected by daytime noise (road traffic, urban environment) but are still able to provide useful data at night. Nevertheless, most stations seem to represent a reasonable compromise between education and observation, and some have even very good signal-to-noise ratios.
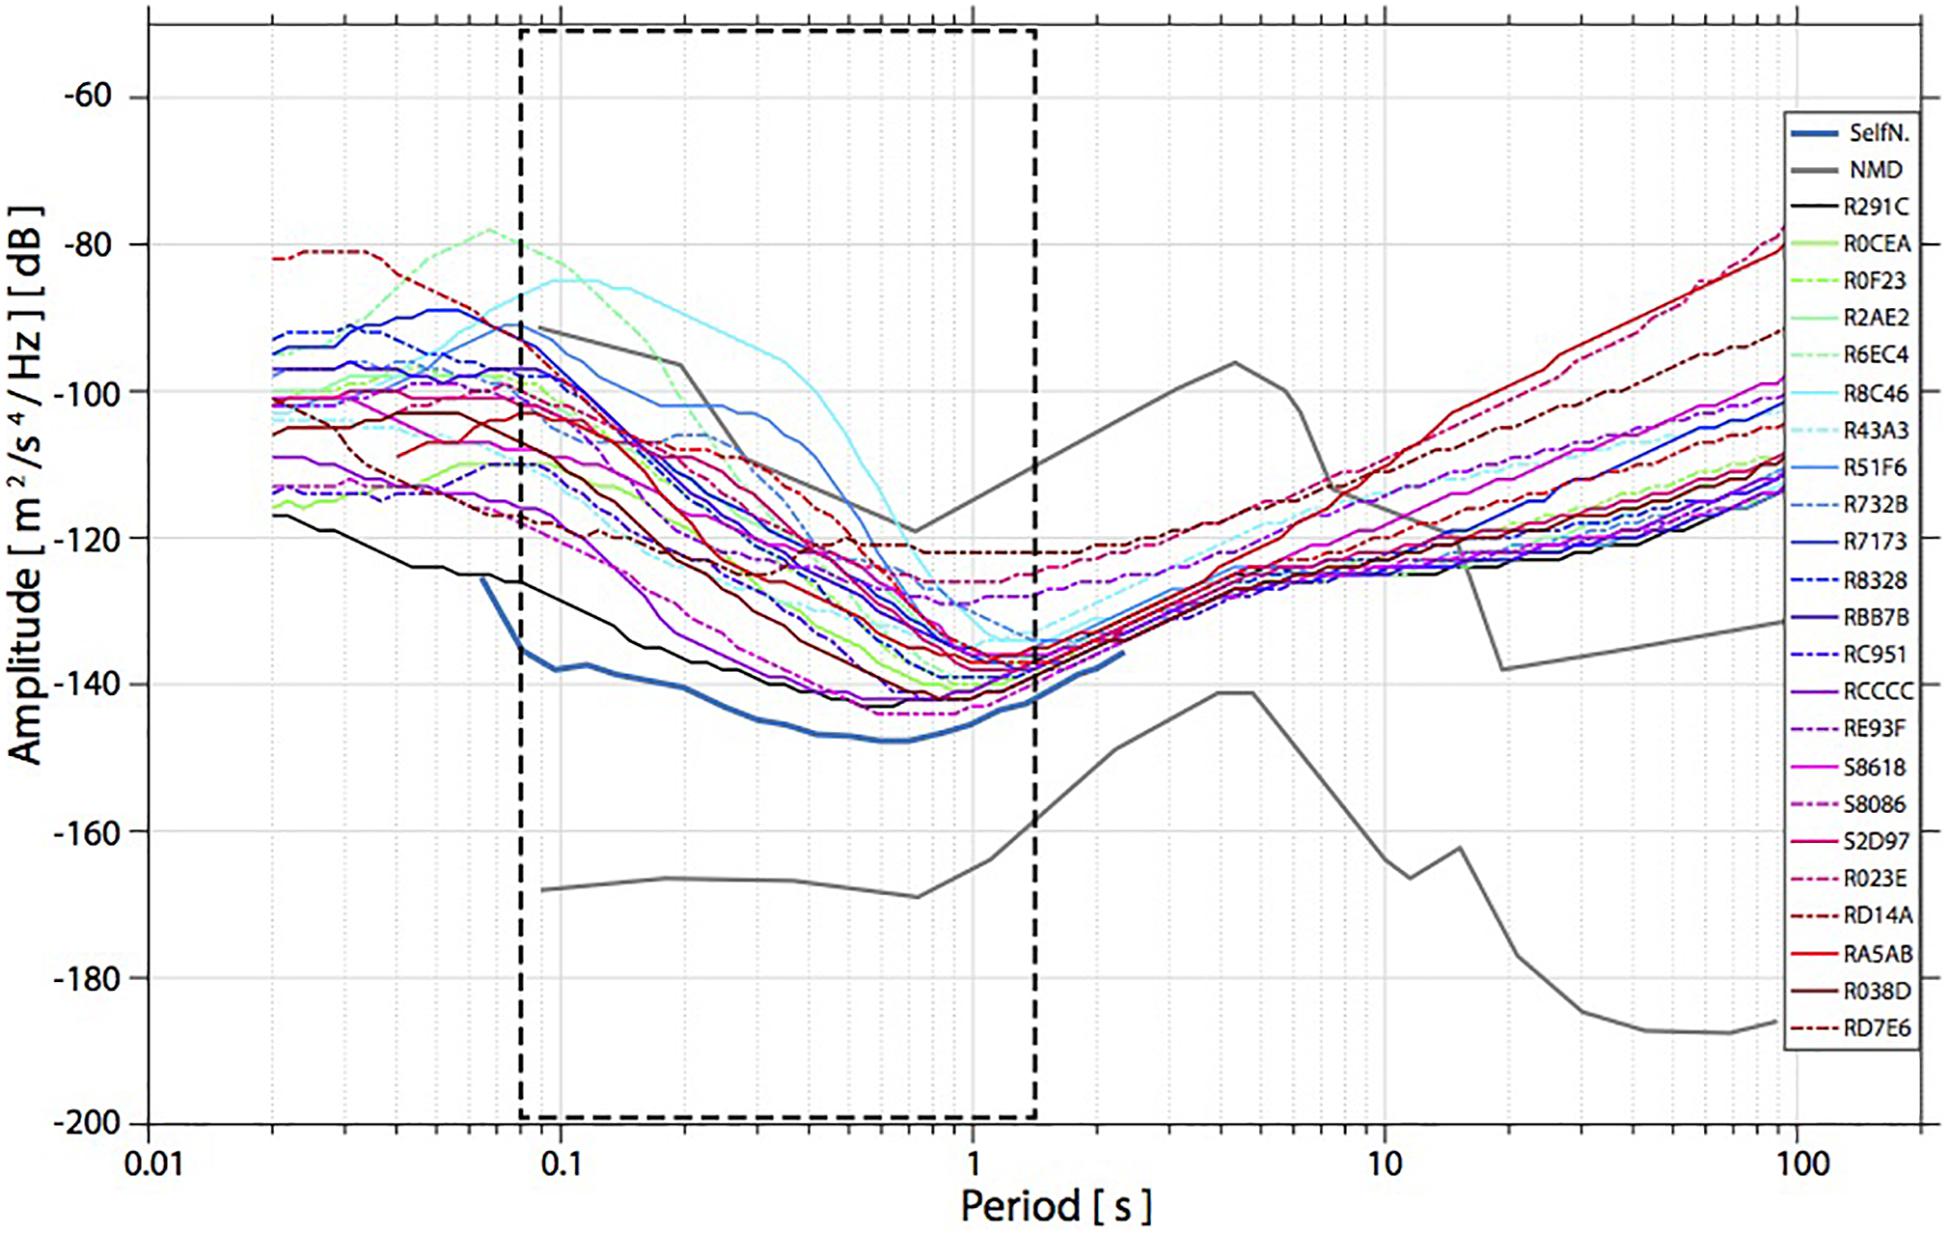
Figure 7. Power spectral density probability density function’s median value for each NSSN station as a function of period. Thick gray lines are the high and low noise models (according to Peterson, 1993; McNamara and Buland, 2004). For comparison, we also plot the same curve from the test site in Switzerland (R291C), and the instrument self-noise as provided by the manufacturer. The dashed black line highlights the bandwidth of flat instrument response. The curves are constructed using hourly PSDs with 50% overlap during the period from June to December 2019.
We have observed that the low-cost seismometers record earthquakes not only from local sources inside the network, but also across Nepal and from regional and teleseismic distances. For earthquakes in Nepal, our reference information comes from the earthquake catalog published by the NSC9, while for more distant events we rely on global catalogs such as the one from the European-Mediterranean Seismological Center (EMSC) and the United States Geological Survey (USGS). Figure 8 shows three examples of recorded waveforms, for a local, a regional and a teleseismic earthquake. The arrival of P and S phases is clearly visible, although somewhat different from simplistic theoretical arrival times. For local events, we detect all earthquakes that the NSC publish: these are detected by an STA/LTA-trigger at the NSC network, but only ML ≥ 4 events in Nepal are published on their website. The NSSN recorded some regional events in the Hindu Kush region, in China and in Myanmar. Likewise, we have recorded almost all M > 7 events around the globe, mostly at thousands of kilometers distance, including in Japan and in Indonesia region. We also clearly identified the Mw8.0 earthquake on 26 May 2019 in Peru at ca. 16’000 km distance. For large events, we clearly observe the more slowly propagating surface waves arriving after the body (P and S) waves. In 6 months of operational time, a total of 194 reported earthquakes have been identified in our records.
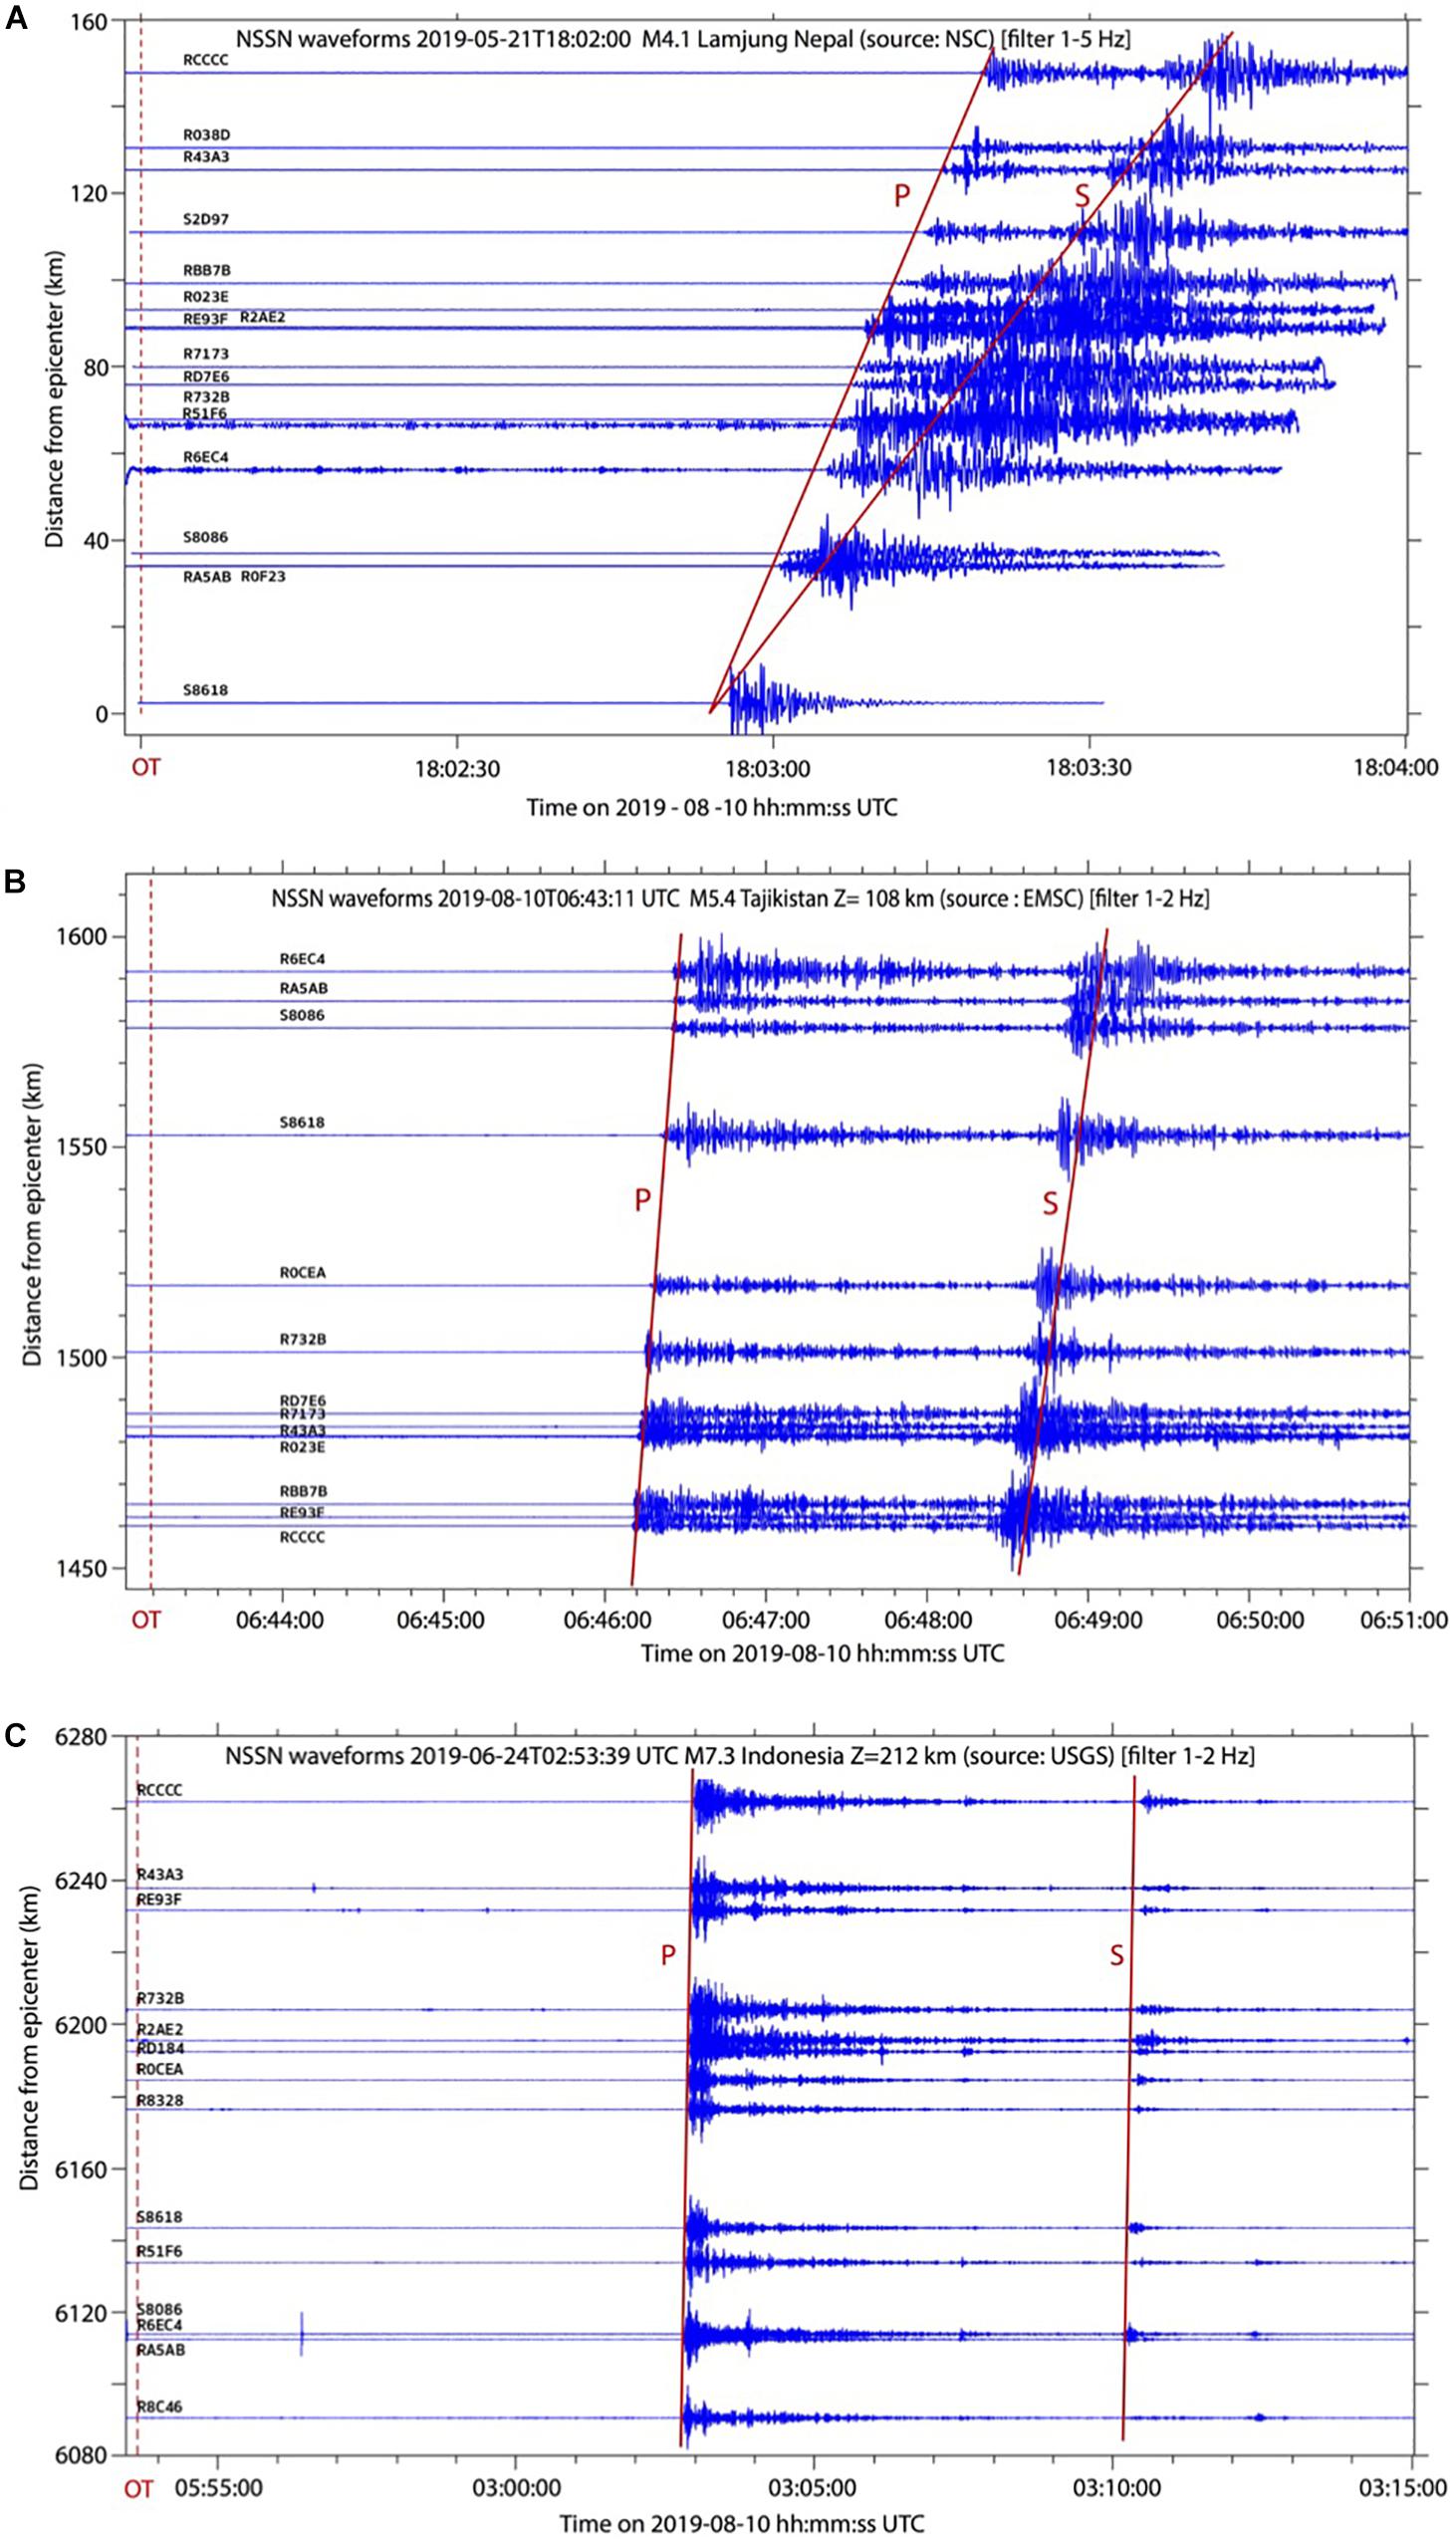
Figure 8. Examples of earthquakes’ waveforms recorded by the NSSN. The dashed red line in each figure denotes the origin time of the earthquake in the available catalog. (A) Filtered waveforms in the 1–5 Hz frequency band of a local event, with solid red lines plotted for the theoretical P and S wave arrival times using local velocity model in Nepal (Pandey et al., 1995). (B,C) Waveforms of a regional event in Tajikistan and of a teleseismic event in Indonesia, filtered between 1–2 Hz. Solid red lines are plotted for the theoretical P and S wave arrival time using global iasp91 velocity model (Kennett and Engdahl, 1991). First order information of each event is written on top of each figure, including the source of the information. NSC, National Seismological Centre, Kathmandu; EMSC, European-Mediterranean Seismological Centre; USGS, United States Geological Survey. All waveforms are normalized to the same maximum amplitude.
In Figure 8, the theoretical P and S wave arrival times are plotted on top of the recorded waveforms using different velocity models. We have used local velocity model in Nepal (Pandey et al., 1995) for local earthquakes, iasp91 (Kennett and Engdahl, 1991) for regional and global events. The slope of the theoretical P and S wave arrivals do not exactly fit that of the observed waveforms for the local earthquake, which is probably related to the variation of the local crustal structure with respect to the 1D model. We estimate the origin time of the local event at 18:02:54 UTC, however 18:02 UTC is reported in the published catalog, the information about the seconds is truncated (Figure 8A). Similarly, P but especially S phases show different arrivals times from the theoretical ones for the regional earthquake in Afghanistan, which again points to more complex velocity model of the orogenic region along the raypath than the 1D model used. For the teleseismic event, the P and S wave arrivals match relatively well the theoretical arrival times.
Some of the events we recorded are felt by the people involved in our school seismology program, who were naturally interested to learn more. For that purpose, it is very instructive to produce instrumental intensity maps that shows measured intensity values at stations across the NSSN. We produce such maps routinely for felt events in the study area, and represent shaking as instrumental intensity converted from peak ground velocity (which in our sensors is recorded on the vertical component, hence we note it PGVV), following the scale of Worden et al. (2012). The instrumental intensity map for the event causing one of the largest intensities so far, an ML4.7 earthquake inside the network is presented in Figure 9. The station closest to the epicenter, Janapriya Secondary School, Darwang, Myagdi district, clearly felt the shaking with an intensity of II-III, while stations further from the epicenter have not recorded felt-shaking (intensity I). The largest PGVV measured so far was recorded very close to a ML4.5 event, at a value of 1.22 mm/s. The instrumental intensity map will not be delivered for large events as the sensors will reach their limits of recording (clip) (Anthony et al., 2019) at 22 mm/s (peak-to-peak) according to the manufacturer. Nevertheless, the micro- to moderate size seismicity can be very well monitored. In general, the instrumental intensity map representing measured shaking is critical to estimate the damage after an earthquake and to prepare an emergency response and rescue; in the frame of our educational seismology project, it shows all schools together and demonstrates the connection within the community of schools.
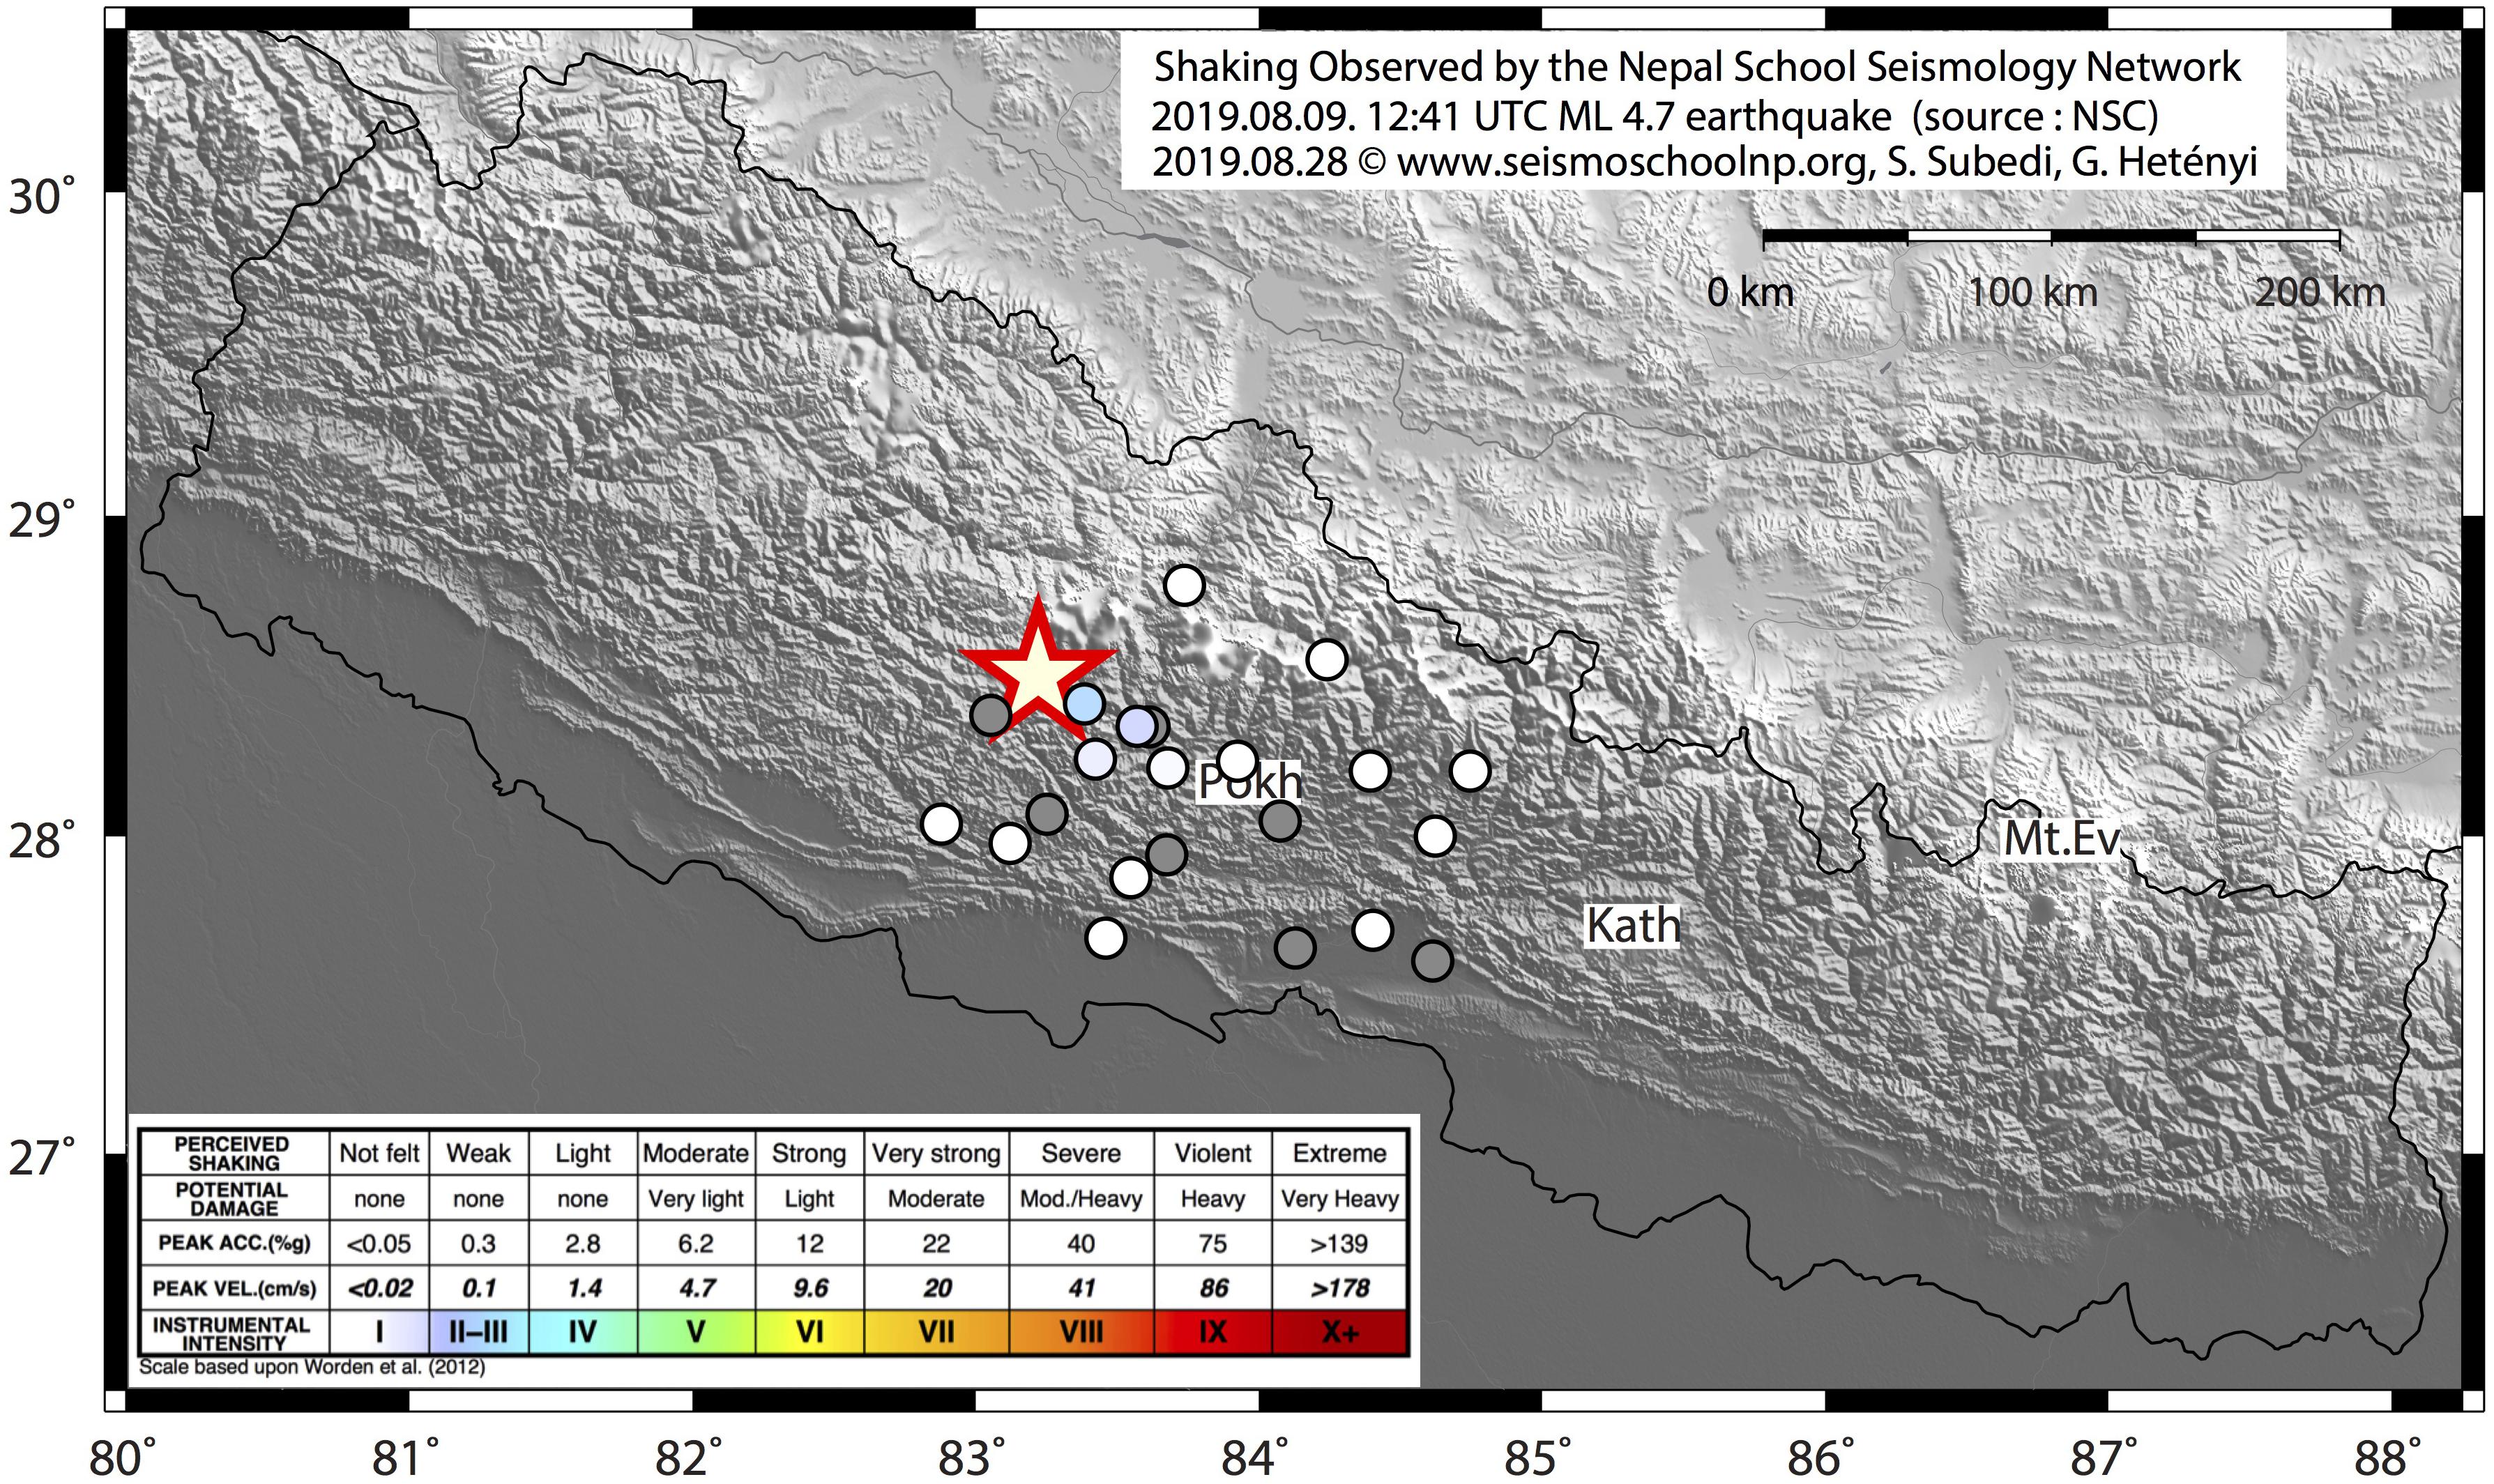
Figure 9. Observed instrumental intensity map from the 2019 August 9 ML4.7 Myagdi earthquake. The observed intensity data at NSSN stations are plotted in circles and are color-coded according to their value based on Worden et al. (2012) as shown in the legend. Gray color means no data for the event from that station (either no internet or no power supply). The capital city of Nepal, Kathmandu is denoted by Kath, the highest point of the Earth, Mount Everest is denoted by Mt.Ev, and the capital city Pokhara of the Gandaki province is denoted by Pokh.
Seismology: Detection Threshold
By collecting detected phase arrivals from a representative number of earthquakes, the detection threshold of the RS1D in real field conditions can be mapped. This strongly depends on the selected sites, and here we present our findings (Figure 10).
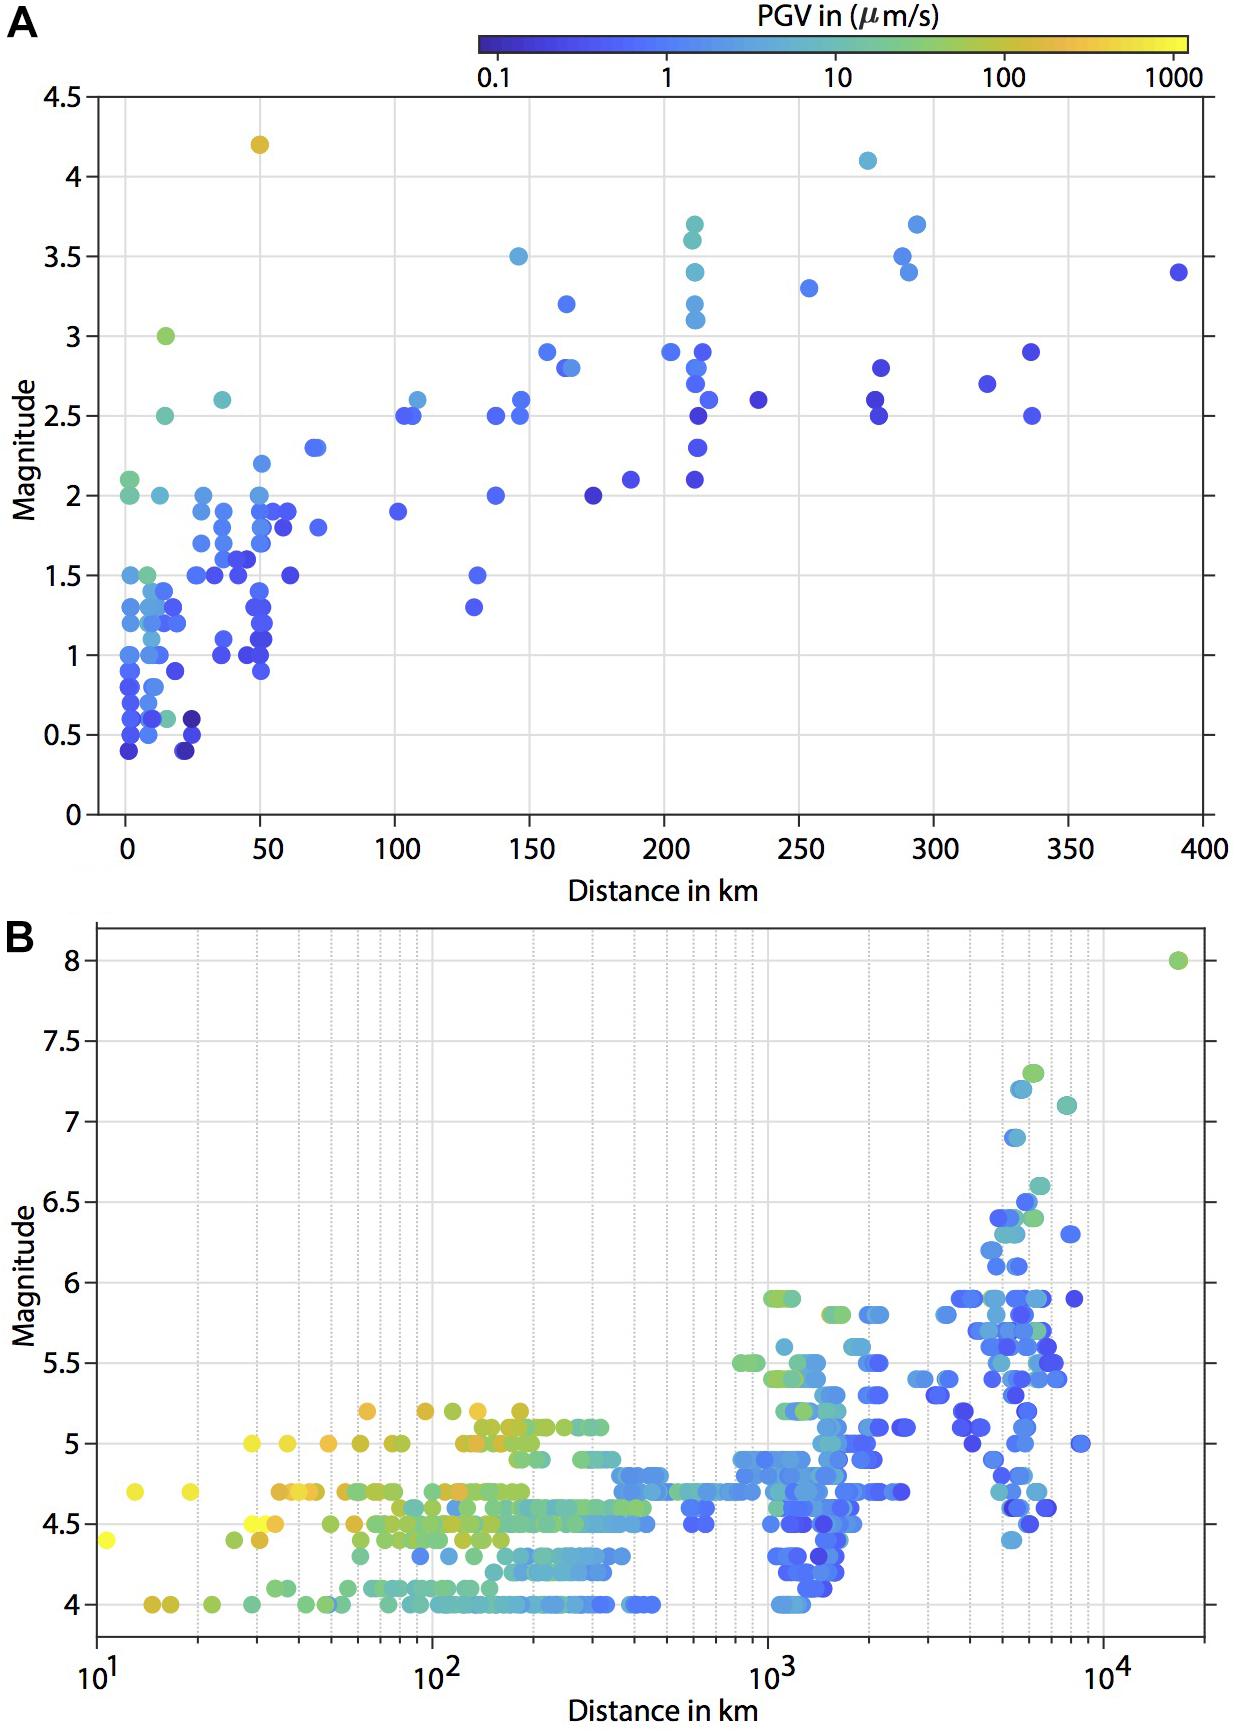
Figure 10. Observed vertical peak ground velocity (PGVV) as a function of magnitude and distance at (A) our test site in Grimisuat, Switzerland, and (B) across the NSSN. Each circle in the plot represents the observed maximum amplitude motion at a station following a single earthquake. In total 210 events for the station in Switzerland and 194 events for NSSN are plotted using the 6-month data from the catalogs. Sources of earthquake catalogs: SED in Switzerland (A), NSC and USGS for stations in Nepal (B).
At the test site in Switzerland, which is relatively quiet, we are able to record relatively small earthquakes (ML ≤ 1.0) earthquakes at surprisingly large (50 km) distances. This was possible as the background noise level of this site is low, typically around 0.2 μm/s or less. The observed peak ground velocity (PGVV) for all events recorded at this site is plotted as a function of epicentral distance and magnitude in Figure 10A. Observed ground velocity increases with magnitude and decreases with distance, as expected. Still, typical felt (ML∼2.5) events are detected up to ca. 300 km distance.
In Nepal, information on micro earthquakes (ML < 4) is not publicly accessible. Nevertheless, all reported local earthquakes of this size and larger are clearly recorded, and also some regional events of ML 4 beyond 1’000 km distance have been detected (Figure 10B). The magnitude and distance dependence of PGVV show the same pattern as for the test site: increasing with the magnitude, decreasing with the distance when other parameters are kept constant. The list of earthquakes used in this study is provided in the Supplementary Table 2. The location of micro earthquakes inside the NSSN is currently being investigated, and is beyond the scope of this article.
Seismology: Magnitude Calibration for Earthquake Monitoring
An important parameter in seismology is the magnitude of an earthquake. Due to various definitions of magnitude, it is not always straightforward to compare one event measured on one scale with another event measures on another scale. Typically, local magnitudes ML for a given region are converted to moment magnitude Mw for an energy based comparison. In Nepal, ML is provided by the NSC, and for coherency with the nationally used scale, we here quantitatively calibrate our own seismic observations to fit that scale.
Our approach is based on the presented by Allen et al. (2012) who fit a general equation on intensity and how it attenuates with epicentral distance and earthquake magnitude. Our mathematical approach is the same, but instead of intensity values, we work with vertical-component peak ground velocity PGVV, in μm/s. Following Allen et al. (2012), we assume the following formula:
where MNSSN is the local magnitude determined by the NSSN, D is epicentral distance in kilometers, and S is a site effect term which we first consider to be 0. The value of PGVV at each station is determined as the maximum amplitude recorded by a vertical-component low-cost seismometer, typically of the Sg or Sn seismic phase, after second-order Butterworth band-pass filtering between 0.7 and 7 Hz. The three constants a, b, and c are the parameters we have to determine by regression. Once the values are known, we can rearrange the equation to compute MNSSN as a function of observed PGVV and D:
The full observed dataset is presented in Figure 11. For the regression, we considered events located by the NSC in the distance range 31–450 km (within Nepal), and we omit the single ML5.7 event as it is 0.5 magnitude units away from the rest of the dataset. Events having epicentral distances smaller than 31 km [i.e., log10(D) < 1.5] have not been considered to avoid near-source effects and because of uncertain focal depth determinations. Then, for each 0.1-wide bin of earthquake magnitude (including overlap as catalog magnitudes are rounded to the nearest 0.1 unit), we regress for the intermediate distance intensity attenuation value, c, and obtain the results shown in Figure 12A. The median value of this dataset, trimmed by 1σ around the raw mean value, is taken as the most fitting attenuation value c. The value turns out to be –1.03, and since no clear trend of variability is observed with magnitude, it is used as a constant for further regression analysis.
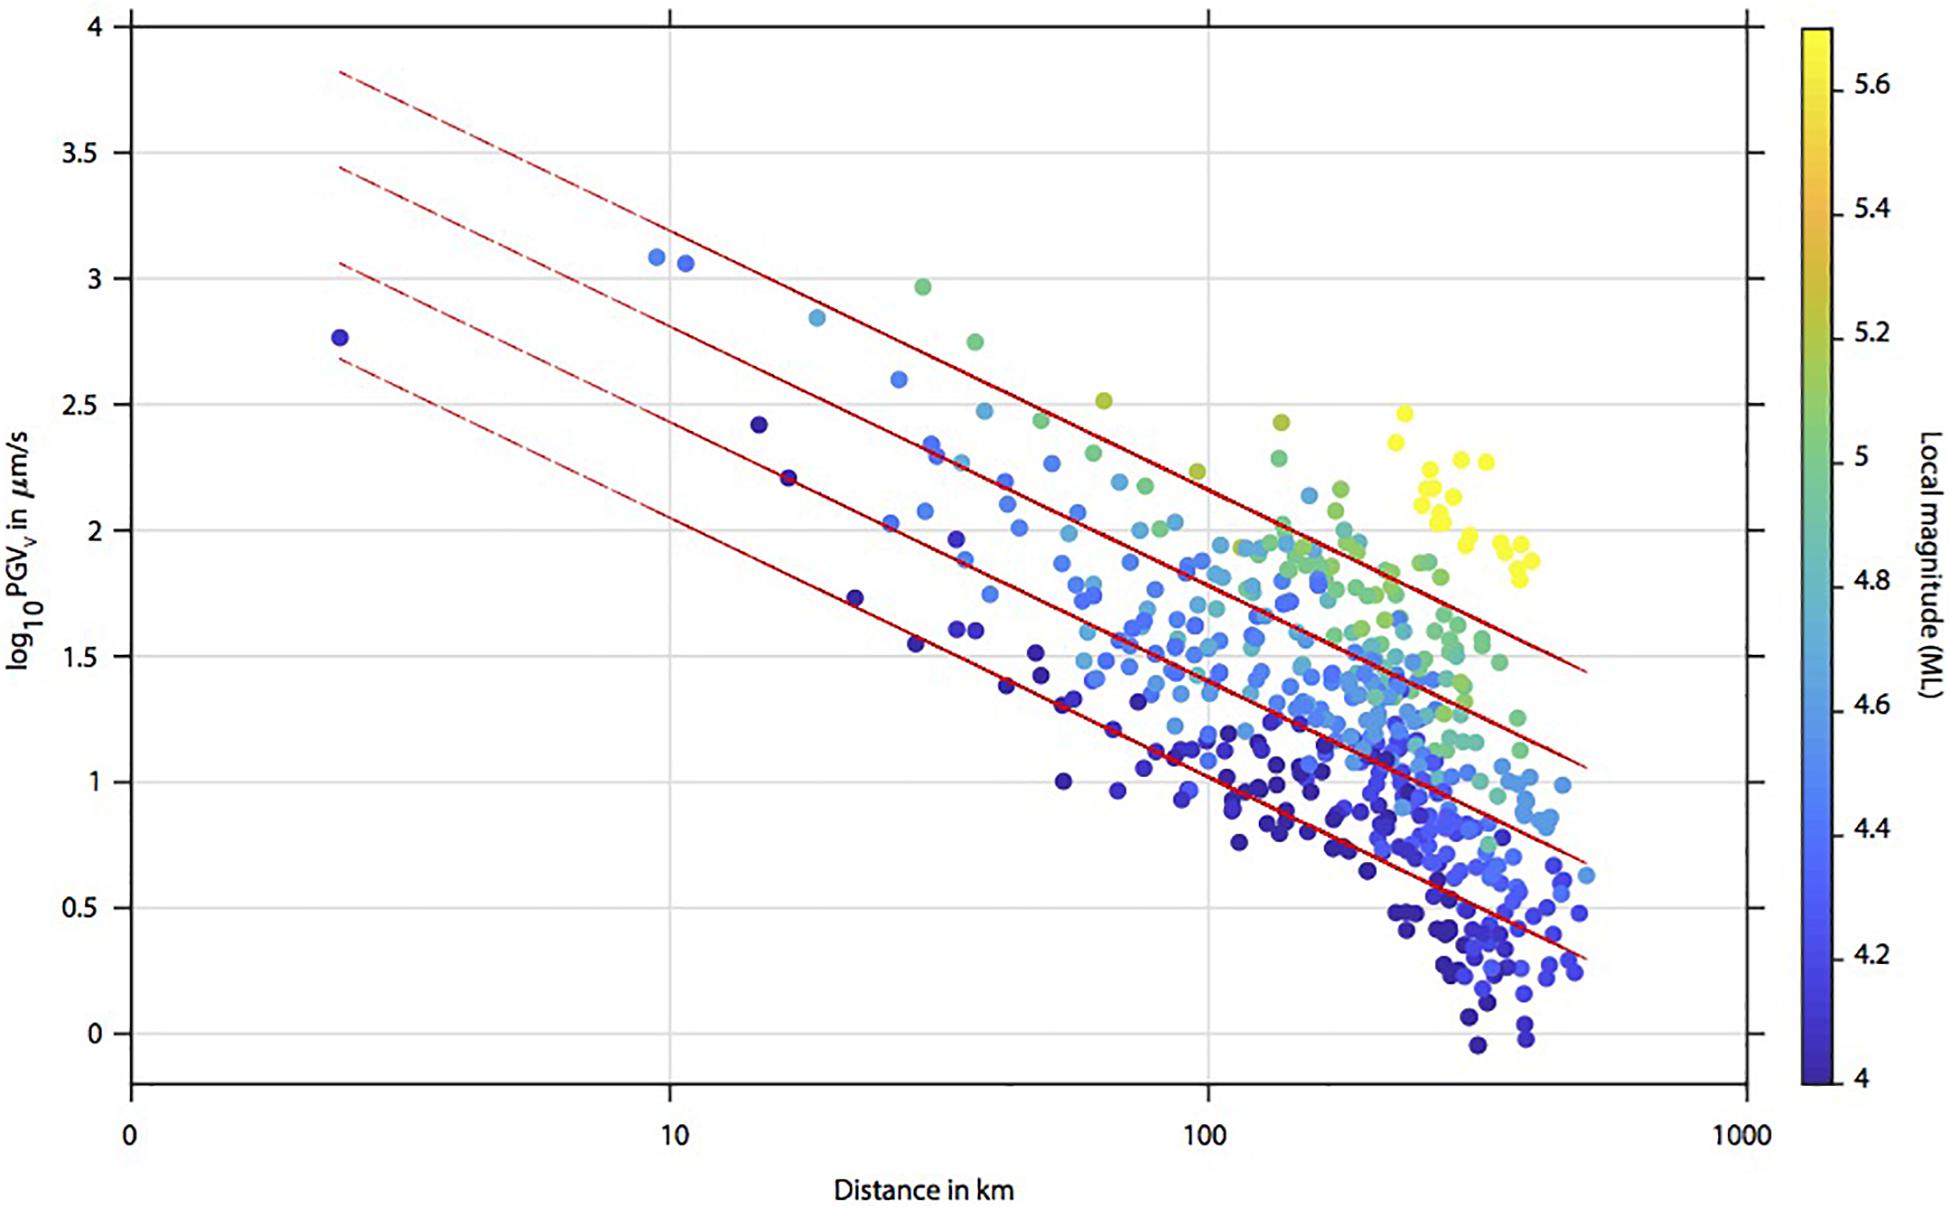
Figure 11. Observed peak ground velocity (PGVV) across the NSSN as a function of earthquake magnitude and epicentral distance. Each circle in the plot represents a single earthquake detection at a station, colored by magnitude. Six months data are considered from April 2019. Source of earthquake data is the National Seismological Center’s published catalog. Red lines represent the fitted PGVV-distance lines for M4.0, M4.4, M4.8, and M5.2 earthquakes after the regression (see text for details).
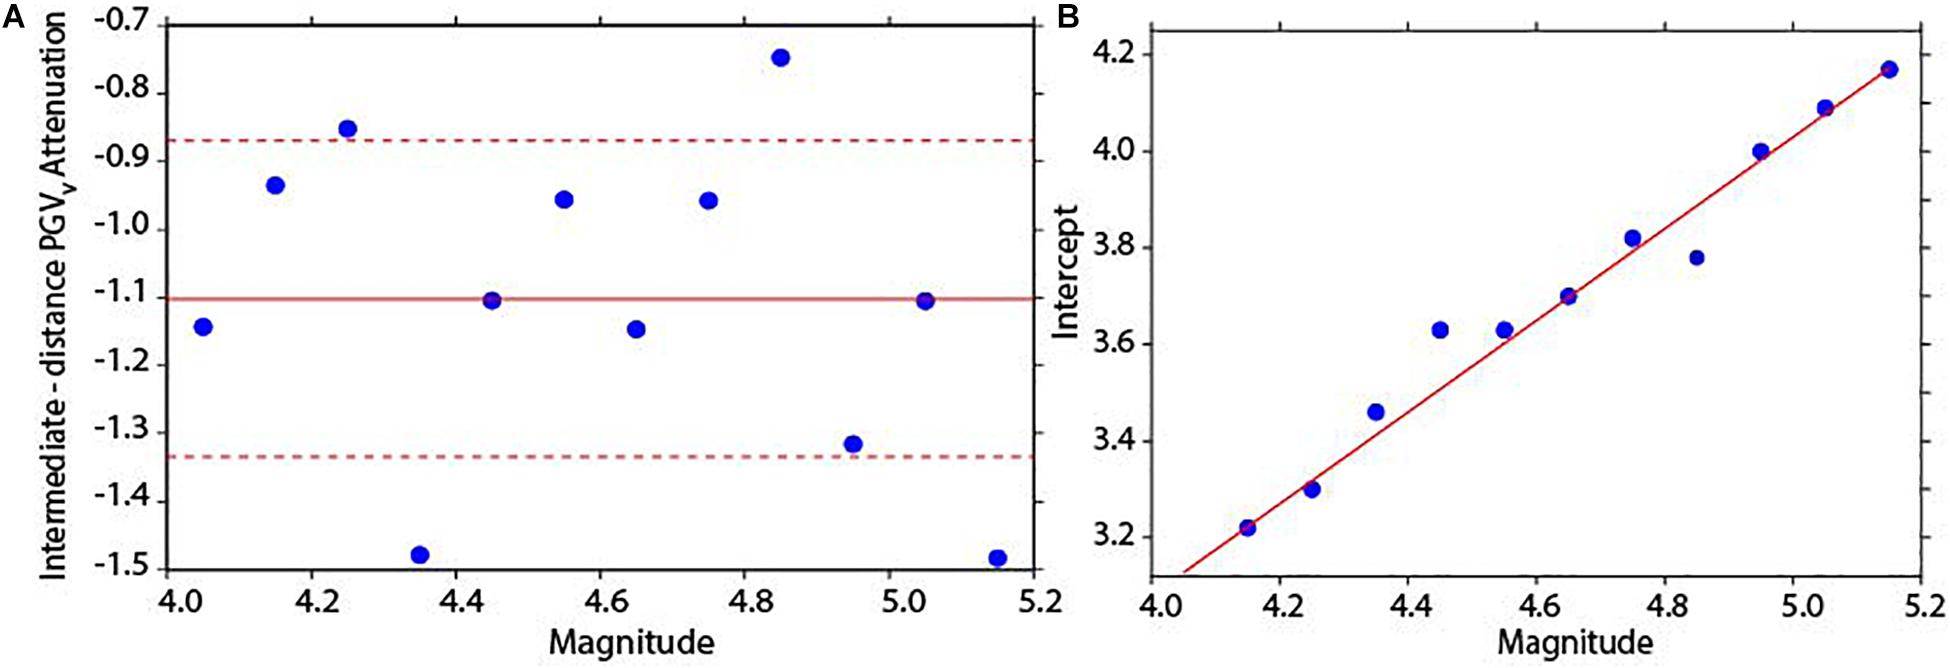
Figure 12. (A) Intermediate-distance PGVV attenuation c plotted for magnitude bins. Data points beyond the 1σ variability (0.30, red dashed lines) of the raw mean (–1.39, solid red line) are trimmed and the median of the remaining PGVV attenuation provided parameter c in Eq. 1, which is found to be –1.03 across the dataset. (B) Fitting the distance and PGVV data for each magnitude window using the constant slope value c to find the slope and intercept of the magnitude dependence (respectively b and a in Eq. 1), regressed using the linear least squares.
In a second step, in order to find the values of the slope b and intercept value a of the magnitude dependence in Equation 1, we have fitted the PGV–distance data for each magnitude window using the constant slope value c and regressed using the linear least squares (Figures 11, 12B). The values we find are a = –0.72 and b = 0.95. (The same calibration including the ML5.7 event gives slightly different values for a, b, and c: as −0.53, 0.94 and –1.10, respectively, but the change in MNSSN is negligible, <0.1).
Hence, replacing these into Equation 2, we obtain the calibrated magnitude equation for the NSSN:
Finally, using the determined value of a, b, and c and Equation 1, we have estimated theoretical values of PGVV for each event and each station. By subtracting this from the observed PGVV values for all events, the average residual of PGVV is calculated for each station, which is effectively gives the site effect term S. As the nominal sensitivity of the RS1D sensors is provided with a 10% uncertainty, we have considered the value of S in Equation 1 for a station only when its value exceeded 0.1 (10 sites, largest value 0.29). With this value, we can correct the observed value of PGVV when computing MNSSN in the future.
To assess and to appreciate the magnitude calibration equation, we plot the NSSN-observed magnitude value against the local ML as provided by the NSC in Figure 13. The largest difference is below 0.3 units, which is a very reasonable value considering that the value of b (magnitude-dependence of PGVV) is on the order of 1, and that network-wide determined magnitude values are averaged from individual station magnitudes with a standard deviation that can exceed this difference. Although the magnitude equation was calibrated using data from ML4.0–5.2 earthquakes, the fit to the so far single ML5.7 event is very good.
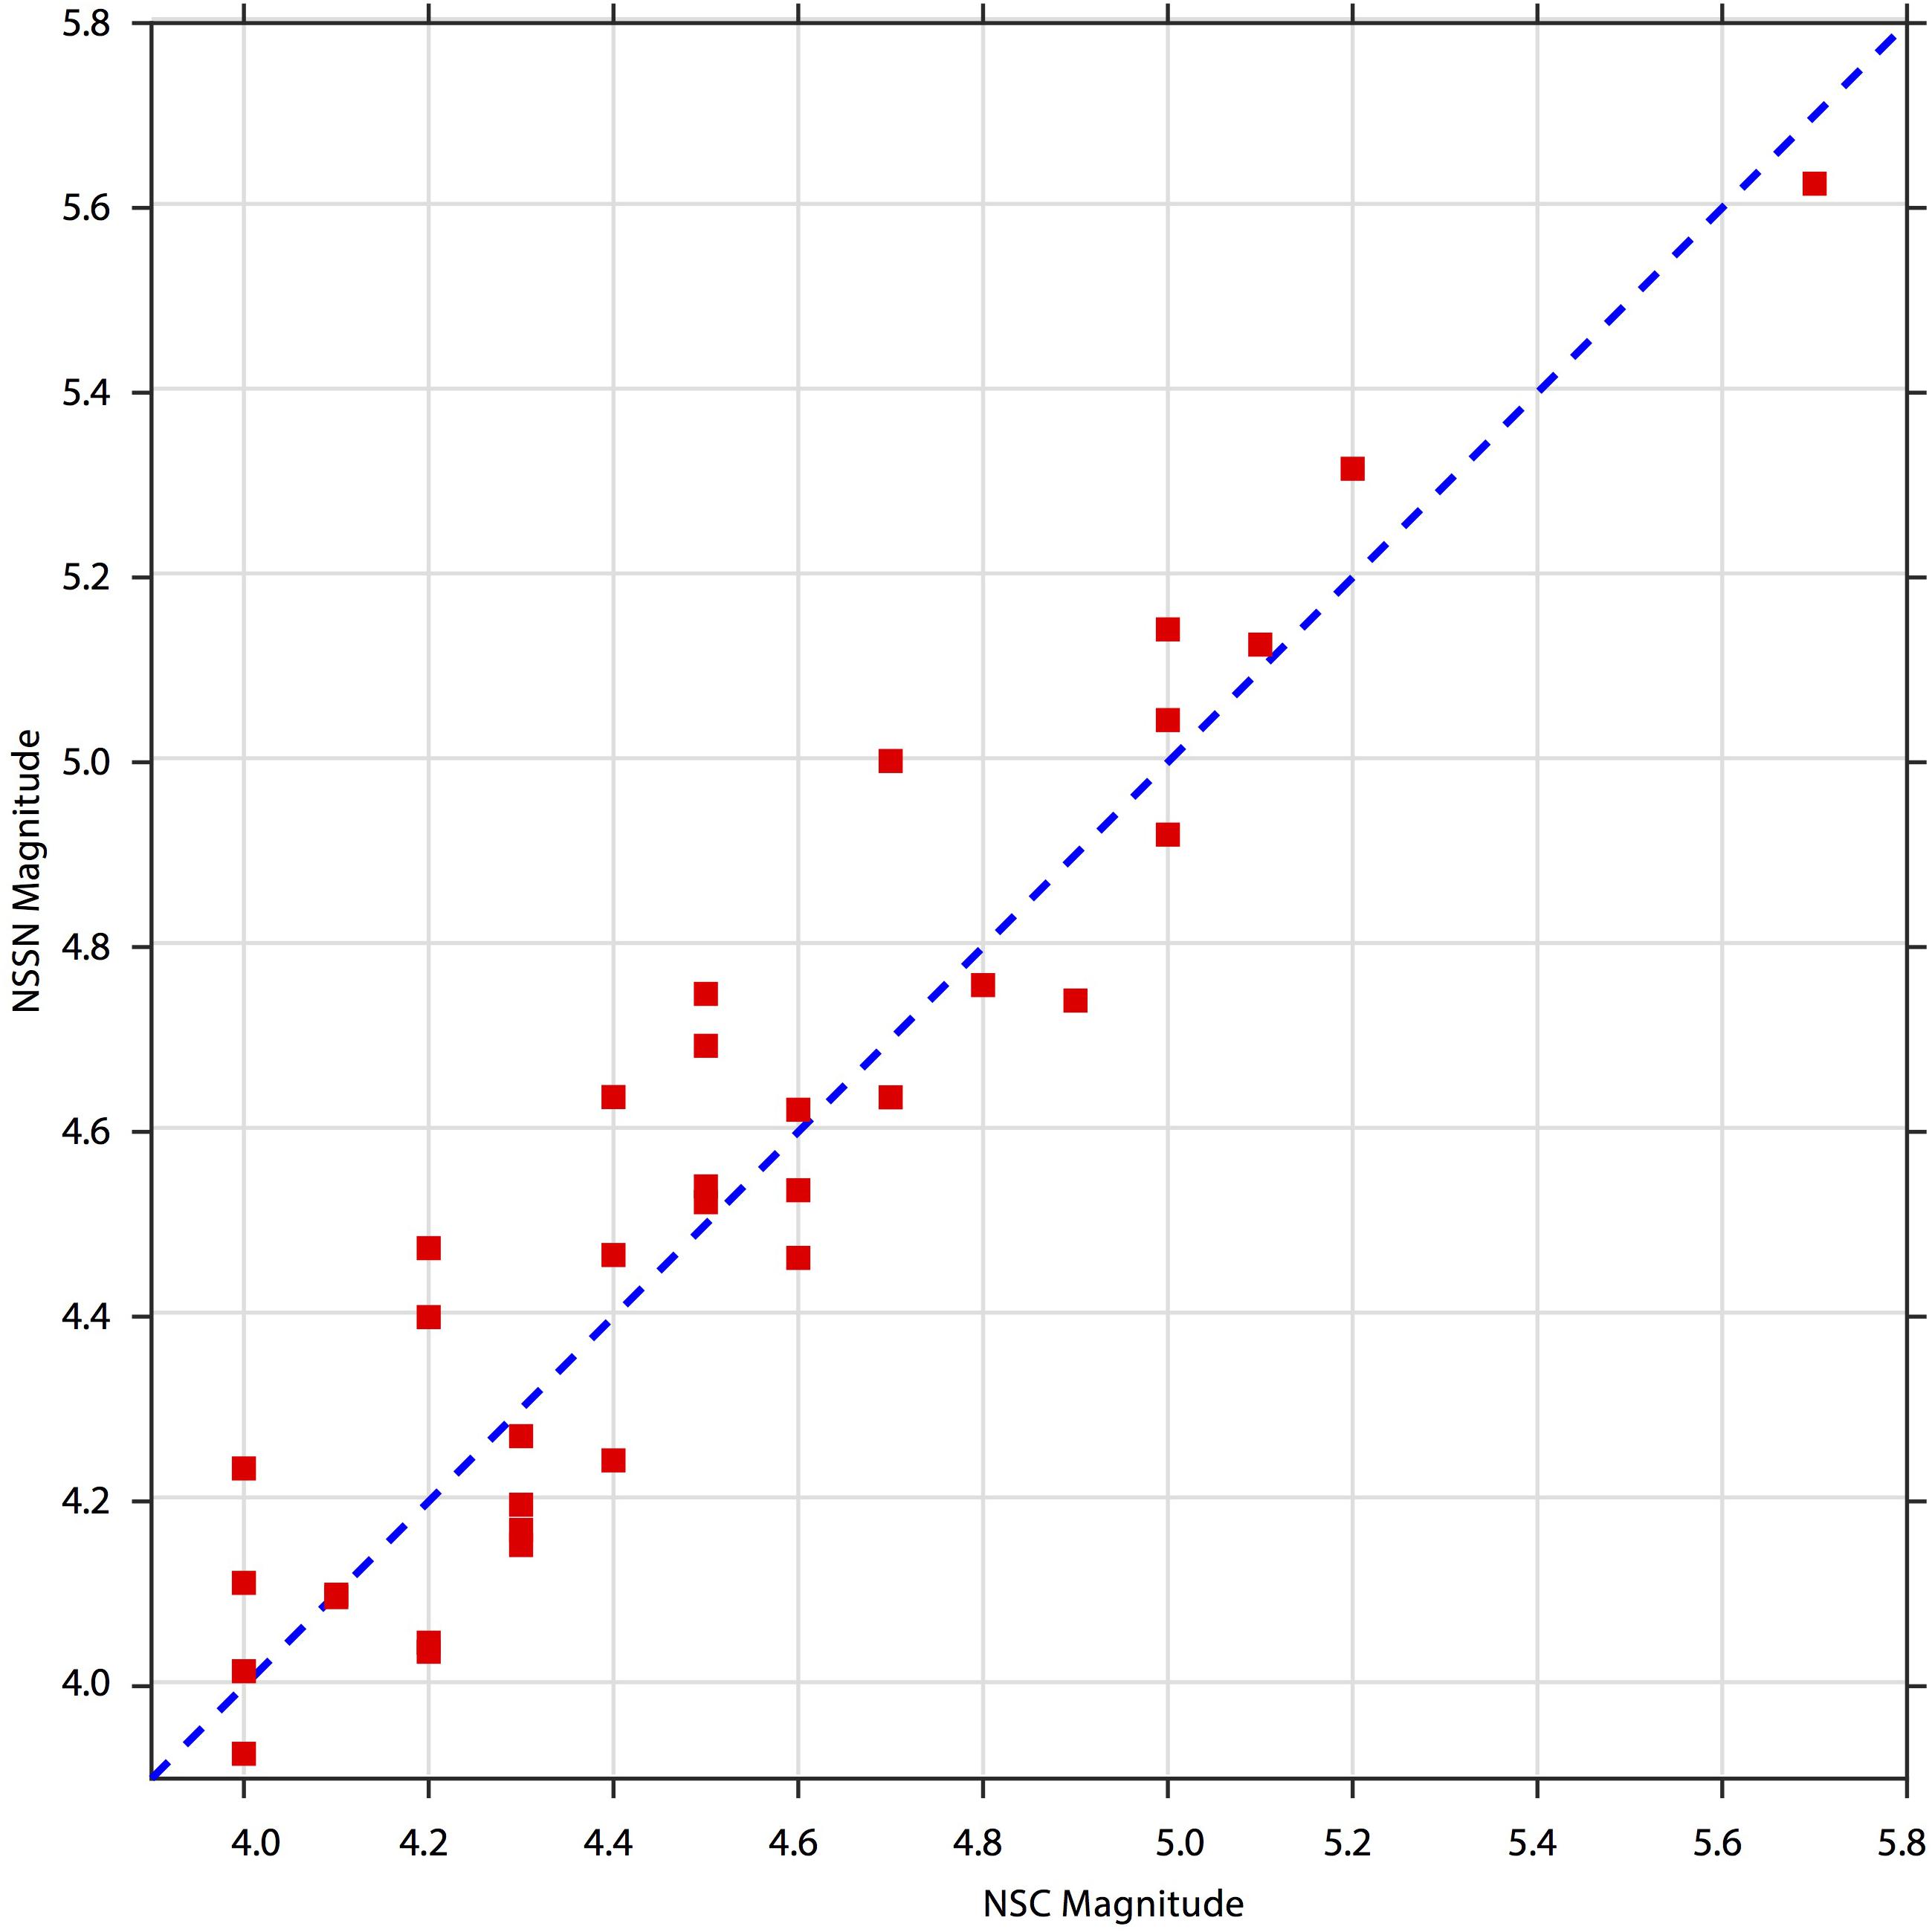
Figure 13. Magnitude comparison plot. The NSC-reported magnitude is plotted against the NSSN magnitude using the newly calibrated magnitude equation (Eq. 3). Note that the site effect at each NSSN station is considered as described in the text. The maximum difference between the two magnitude scales for any given event is <0.3 unit of ML.
Although the seismometers in the NSSN are relatively inexpensive, this program for schools allowed us to build a network with real observatory capabilities for seismic monitoring. This somewhat unexpected point further highlights the very important role that schools and their environment can play in monitoring, understanding and preparing for earthquakes.
Conclusion
In less than 2 years of work, we have established the framework of the Seismology at School in Nepal program, and successfully implemented it in the field. The program carries both educational and seismological aspects, results of which can be summarized as the following:
• The program jointly established an educational network with the close involvement of 22 schools, each hosting a low-cost seismometer which spans the Nepal School Seismology Network in the region where a great earthquake is due.
• Various educational activities were performed, involving schools, students, teachers and communities in earthquake education; teachers were trained primarily during a 2-day dedicated workshop.
• With only 6 months of data, useful seismological results could be produced for both education (record sections, shake-maps) and research (event detectability).
• A new local magnitude equation for Nepal is calibrated based on the data observed by the NSSN, which is applicable to consistently compute the magnitude of forthcoming local events.
• Openly available data and educational resources through our program’s website contribute to the broadest possible outreach.
On the basis of our bottom-up approach, earthquake preparedness and earthquake awareness have increased in the local communities. In this sense, the project has started to help this region of Nepal to prepare for future earthquakes, and we hope that the initiative is spread to other regions of Nepal.
Data Availability Statement
All datasets generated for this study are freely available and can be downloaded from the fdsn server for network code AM, https://www.fdsn.org/networks/detail/AM/.
Author Contributions
SS and GH developed the project concept and implementation details with input from AS on the educational and by PD on the instrumentation aspects. SS carried out most of the fieldwork with some help by the other co-authors. SS did the manuscript preparation, figures, tables, and the calculations, guided and verified by GH. All authors discussed the results, and contributed to the final manuscript.
Funding
Funding for SS’s Ph.D. was provided by the Swiss Confederation through a Swiss Government Excellence Scholarship. Instrumentation was financed by the Royal Astronomical Society (RAS), United Kingdom and Faculty of Geoscience and Environment, University of Lausanne. The cost for teachers to attend and participate in the Pokhara workshop was funded by the American Geophysical Union 100 years celebration major grant. Part of the field expenses were covered by the Institute of Earth Sciences, University of Lausanne.
Conflict of Interest
The authors declare that the research was conducted in the absence of any commercial or financial relationships that could be construed as a potential conflict of interest.
Acknowledgments
The Ph.D. thesis of SS is funded by the Federal Commission for Scholarships for Foreign Students (FCS), Switzerland. We greatly acknowledge the Institute of Earth Sciences and the Faculty of Geosciences and Environment at the University of Lausanne for hosting SS as a Ph.D. student and for their support toward the instrumentation of the project, for which we also express our gratitude to the, Royal Astronomical Society. We are indebted to the American Geophysical Union for their AGU100 support which allowed all Nepali participants to attend the teacher’s training workshop in Pokhara. We are very thankful to Pete Loader for his enthusiasm and participation at the Pokhara workshop and all the advices. We are thankful to Mathias Dessimoz (http://mo-ma.ch/) for his great design of the earthquake awareness sticker. We warmly thank Laurent Bollinger, Jérôme Vergne, Lok Bijaya Adhikari, and John Clinton for useful discussion and valuable suggestions. Numerous other colleagues and experts of seismology, education, Nepal, and a combination of these provided us valuable ideas – we are thankful to them even if the list is too long to fit here. The kind support of the Robyr family for the installation and operation of our test site in Switzerland is much appreciated. We are grateful to Branden Christensen and entire OSOP team for their technical supports and suggestions. We are particularly thankful to all teachers and students from the Nepali schools for their enthusiastic participation in the program.
Supplementary Material
The Supplementary Material for this article can be found online at: https://www.frontiersin.org/articles/10.3389/feart.2020.00073/full#supplementary-material
Footnotes
- ^ www.seismonepal.gov.np
- ^ http://www.seismo.ethz.ch/en/earthquakes/switzerland/all-earthquakes/
- ^ http://arclink.ethz.ch/fdsnws/event/1/
- ^ www.earthlearningidea.com
- ^ http://ds.iris.edu/mda/_NSSN
- ^ https://www.ntc.net.np/
- ^ http://seismoschoolnp.org/?page_id=746
- ^ www.seismoschoolnp.org
- ^ http://seismonepal.gov.np/earthquakes
References
Asian Disaster Preparedness Center [ADPC] (2000). Project Completion Report of the Kathmandu Valley Earthquake Risk Management Project Available online at: https://www.adpc.net/Igo/contents/Publications/publications-Details.asp?pid=187&t=Naga%20City%20Disaster%20Mitigation%20Plan(accesed Nov 18, 2019).
Adhikari, L. B., Gautam, U. P., Koirala, B. P., Bhattarai, M., Kandel, T., Gupta, R. M., et al. (2015). The aftershock sequence of the 2015 April 25 Gorkha-Nepal earthquake. Geophys. Suppl. Monthly Notices R. Astronom. Soc. 203, 2119–2124. doi: 10.1093/gji/ggv412
Aitchison, J. C., Ali, J. R., and Davis, A. M. (2007). When and where did India and Asia collide? J. Geophys. Res. 112:B05423. doi: 10.1029/2006JB004706
Allen, T. I., Wald, D. J., and Worden, C. B. (2012). Intensity attenuation for active crustal regions. J. Seismol. 16, 409–433. doi: 10.1007/s10950-012-9278-7
Ambraseys, N., and Jackson, D. (2003). A note on early earthquakes in northern India and southern Tibet. Curr. Sci. 84, 570–582.
Anthony, R. E., Ringler, A. T., Wilson, D. C., and Wolin, E. (2019). Do low-cost seismographs perform well enough for your network? An overview of laboratory tests and field observations of the OSOP Raspberry Shake 4D. Seismol. Res. Lett. 90, 219–228. doi: 10.1785/0220180251
Avouac, J. P., Bollinger, L., Lavé, J., Cattin, R., and Flouzat, M. (2001). Le cycle sismique en Himalaya. Comptes Rendus de l’Académie des Sciences-Series IIA-Earth and Planetary Science 333, 513–529. doi: 10.1016/s1251-8050(01)01573-7
Avouac, J. P., Meng, L., Wei, S., Wang, T., and Ampuero, J. P. (2015). Lower edge of locked main himalayan thrust unzipped by the 2015 Gorkha earthquake. Nat. Geosci. 8:708. doi: 10.1038/ngeo2518
Bilham, R., Larson, K., and Freymueller, J. (1997). GPS measurements of present-day convergence across the Nepal Himalaya. Nature 386:61. doi: 10.1038/386061a0
Bollinger, L., Perrier, F., Avouac, J. P., Sapkota, S., Gautam, U. T. D. R., and Tiwari, D. R. (2007). Seasonal modulation of seismicity in the Himalaya of Nepal. Geophys. Res. Lett. 34:L08304. doi: 10.1029/2006gl029192
Bollinger, L., Sapkota, S. N., Tapponnier, P., Klinger, Y., Rizza, M., Van Der Woerd, J., et al. (2014). Estimating the return times of great Himalayan earthquakes in eastern Nepal: evidence from the Patu and Bardibas strands of the Main Frontal Thrust. J. Geophys. Res. Solid Earth 119, 7123–7163. doi: 10.1002/2014jb010970
Bollinger, L., Tapponnier, P., Sapkota, S. N., and Klinger, Y. (2016). Slip deficit in central Nepal: omen for a repeat of the 1344 AD earthquake? Earth Planets Space 68:12. doi: 10.1186/s40623-016-0389-1
Cattin, R., and Avouac, J. P. (2000). Modeling mountain building and the seismic cycle in the Himalaya of Nepal. J. Geophys. Res. Solid Earth 105, 13389–13407. doi: 10.1029/2000jb900032
Department of Education [DOE] (2017). Education in Figures 2017 (At A Glance). Available online at: https://moe.gov.np/assets/uploads/files/Education_in_Figures_2017.pdf, last accessed on Nov.15, 2019.
Diehl, T., Singer, J., Hetényi, G., Grujic, D., Clinton, J., Giardini, D., et al. (2017). Seismotectonics of Bhutan: evidence for segmentation of the Eastern Himalayas and link to foreland deformation. Earth Planet. Sci. Lett. 471, 54–64. doi: 10.1016/j.epsl.2017.04.038
Drago, J., Ginther, J., Viglione, P., Wicklund, E., and Coleman, B. (2009). “jAmaseis: seismology software meeting the needs of educators,” in Midstates Conference for Undergraduate Research in Computer Science and Mathematics, (Milwaukee, WI: Marquette University), 27.
Duputel, Z., Vergne, J., Rivera, L., Wittlinger, G., Farra, V., and Hetényi, G. (2016). The 2015 Gorkha earthquake: a large event illuminating the Main Himalayan Thrust fault. Geophys. Res. Lett. 43, 2517–2525. doi: 10.1002/2016GL068083
Elliott, J. R., Jolivet, R., González, P. J., Avouac, J. P., Hollingsworth, J., Searle, M. P., et al. (2016). Himalayan megathrust geometry and relation to topography revealed by the Gorkha earthquake. Nat. Geosci. 9, 174–180. doi: 10.1038/ngeo2623
Fäh, D., Giardini, D., Kästli, P., Deichmann, N., Gisler, M., Schwarz-Zanetti, G., et al. (2011). ECOS-09 earthquake catalogue of Switzerland release 2011 report and database. Public catalogue, 17.4.2011. Report SED/RISK/R/001/20110417. Zurich: Swiss Seismological Service ETH Zurich.
Galetzka, J., Melgar, D., Genrich, J. F., Geng, J., Owen, S., Lindsey, E. O., et al. (2015). Slip pulse and resonance of the Kathmandu basin during the 2015 Gorkha earthquake. Nepal. Sci. 349, 1091–1095. doi: 10.1126/science.aac6383
Ghazoui, Z., Bertrand, S., Vanneste, K., Yokoyama, Y., Nomade, J., Gajurel, A. P., et al. (2019). Potentially large post-1505 AD earthquakes in western Nepal revealed by a lake sediment record. Nat. Commun. 10:2258. doi: 10.1038/s41467-019-10093-4
Hetényi, G., Le Roux-Mallouf, R., Berthet, T., Cattin, R., Cauzzi, C., Phuntsho, K., et al. (2016). Joint approach combining damage and paleoseismology observations constrains the 1714 AD Bhutan earthquake at magnitude 8±0.5. Geophys. Res. Lett. 43, 10–695. doi: 10.1002/2016gl071033
Hoste-Colomer, R., Bollinger, L., Lyon-Caen, H., Adhikari, L. B., Baillard, C., Benoit, A., et al. (2018). Lateral variations of the midcrustal seismicity in western Nepal: Seismotectonic implications. Earth Planet. Sci. Lett. 504, 115–125. doi: 10.1016/j.epsl.2018.09.041
Jouanne, F., Mugnier, J. L., Gamond, J. F., Le Fort, P., Pandey, M. R., Bollinger, L., et al. (2004). Current shortening across the Himalayas of Nepal. Geophys. J. Int. 157, 1–14. doi: 10.1111/j.1365-246x.2004.02180.x
Kennett, B. L. N., and Engdahl, E. R. (1991). Travel times for global earthquake location and phase identification. Geophys. J. Int. 105, 429–465. doi: 10.1111/j.1365-246x.1991.tb06724.x
Lavé, J., and Avouac, J. P. (2001). Fluvial incision and tectonic uplift across the Himalayas of central Nepal. J. Geophys. Res. Solid Earth 106, 26561–26591. doi: 10.1029/2001JB000359
McNamara, D. E., and Buland, R. P. (2004). Ambient noise levels in the continental United States. Bull. Seismol. Soc. Am. 94, 1517–1527. doi: 10.1785/012003001
Ministry of Home Affairs [Moha] (2015). Nepal Disaster Report 2015. ISBN 978-9937-0-0324-7. Available at http://www.drrportal.gov.np/uploads/document/329.pdf, (accessed Nov 15, 2019).
Moha/Hmgn-Jica (2002). The Study on Earthquake disaster Mitigation of Kathmandu Valley, Kingdom of Nepal, Project Report. Kathmandu: Ministry of Home Affairs, HMG/N.
Nábělek, J., Hetényi, G., Vergne, J., Sapkota, S., Kafle, B., Jiang, M., et al. (2009). Underplating in the Himalaya-Tibet collision zone revealed by the Hi-CLIMB experiment. Science 325, 1371–1374. doi: 10.1126/science.1167719
Pandey, M. R., Tandukar, R. P., Avouac, J. P., Lave, J., and Massot, J. P. (1995). Interseismic strain accumulation on the Himalayan crustal ramp (Nepal). Geophys. Res. Lett. 22, 751–754. doi: 10.1029/94GL0297
Peterson, J. R. (1993). Observations and Modeling of Seismic Background noise (No. 93-322). Reston, VA: US Geological Survey.
Schulte-Pelkum, V., Monsalve, G., Sheehan, A., Pandey, M. R., Sapkota, S., Bilham, R., et al. (2005). Imaging the Indian subcontinent beneath the Himalaya. Nature 435, 1222–1225. doi: 10.1038/nature03678
Scolobig, A., Prior, T., Schröter, D., Jörin, J., and Patt, A. (2015). Towards people-centred approaches for effective disaster risk management: balancing rhetoric with reality. Int. J. Disaster Risk Reduct. 12, 202–212. doi: 10.1016/j.ijdrr.2015.01.006
Singer, J., Kissling, E., Diehl, T., and Hetényi, G. (2017). The underthrusting Indian crust and its role in collision dynamics of the eastern himalaya in bhutan: insights from receiver function imaging. Jo. Geophys. Res. Solid Earth 122, 1152–1178. doi: 10.1002/2016JB013337
Styron, R., Taylor, M., and Okoronkwo, K. (2010). Database of active structures from the Indo-Asian collision. Eos Trans. AGU 91, 181–182. doi: 10.1029/2010EO200001
Subedi, S., Hetényi, G., Vergne, J., Bollinger, L., Lyon-Caen, H., Farra, V., et al. (2018). Imaging the moho and the main himalayan thrust in western nepal with receiver functions. Geophys. Res. Lett. 45, 13–222. doi: 10.1029/2018gl080911
Weber, B., and Herrnkind, S. (2014). “EQInfo-earthquakes world-wide,” in EGU General Assembly Conference Abstracts, Vol. 16, Munich.
Worden, C. B., Gerstenberger, M. C., Rhoades, D. A., and Wald, D. J. (2012). Probabilistic relationships between ground-motion parameters and modified Mercalli intensity in California. Bull. Seismol. Soc. Am. 102, 204–221. doi: 10.1785/0120110156
Zheng, G., Wang, H., Wright, T. J., Lou, Y., Zhang, R., Zhang, W., et al. (2017). Crustal deformation in the India-Eurasia collision zone from 25years of GPS measurements. J. Geophys. Res. Solid Earth 122, 9290–9312. doi: 10.1002/2017jb014465
Keywords: educational seismology, citizen science, seismic hazard, earthquake magnitude, Nepal
Citation: Subedi S, Hetényi G, Denton P and Sauron A (2020) Seismology at School in Nepal: A Program for Educational and Citizen Seismology Through a Low-Cost Seismic Network. Front. Earth Sci. 8:73. doi: 10.3389/feart.2020.00073
Received: 09 December 2019; Accepted: 28 February 2020;
Published: 09 April 2020.
Edited by:
Remy Bossu, European-Mediterranean Seismological Centre, FranceReviewed by:
Gerasimos Chouliaras, National Observatory of Athens, GreeceEmily Wolin, USGS Albuquerque Seismological Laboratory (ASL), United States
Copyright © 2020 Subedi, Hetényi, Denton and Sauron. This is an open-access article distributed under the terms of the Creative Commons Attribution License (CC BY). The use, distribution or reproduction in other forums is permitted, provided the original author(s) and the copyright owner(s) are credited and that the original publication in this journal is cited, in accordance with accepted academic practice. No use, distribution or reproduction is permitted which does not comply with these terms.
*Correspondence: Shiba Subedi, shiba.subedi@unil.ch
†Paul Denton, Denton Seismo Ltd., Oakham, United Kingdom