Changes in Climatology, Snow Cover, and Ground Temperatures at High Alpine Locations
 Esther Bender
 Michael Lehning
 Joel Fiddes
- 1WSL Institute for Snow and Avalanche Research SLF, Davos, Switzerland
- 2Department Medizin Technik, Fakultät Life Scinces, Hochschule für Angewandte Wissenschaften Hamburg, Hamburg, Germany
- 3CRYOS, School of Architecture, Civil and Environmental Engineering, Ecole Polytechnique Fédérale de Lausanne, Lausanne, Switzerland
Knowledge about changes in ground temperatures under a changing climate is important for many environmental, economic, and infrastructure applications and can be estimated by transient numerical simulations. However, a full annual cycle of precipitation data is needed to achieve this, yet is often unavailable in high alpine regions where a lack of infrastructure precludes installation of heated instruments capable of measuring the solid precipitation component. This paper presents a method to reconstruct a full year precipitation dataset at high alpine weather stations, which is then used to model ground temperature and snow depth for 16 alpine sites in Switzerland for the past and three climate scenarios. Differences in the possible temperature trajectories are highlighted with a focus on elevation and regional climatic differences within Switzerland. Snow height and ground temperatures under a changing climate are modeled with the one-dimensional physical model SNOWPACK by applying a delta change signal to the meteorological data set obtained from the CH2011 climate scenarios of Switzerland. All sites showed a decrease of snow cover, a shortening of the snow season and an increase in ground temperature to the end of the century. Sites in the inner alpine regions of Grisons were found to be less sensitive to climate change than sites in the western Alps. The magnitude of reduction of mean snow height depends mainly on location, whereas for the contraction of the snow season elevation is the key factor. It could be shown that the temperature–precipitation combination as expressed in the snow dynamics explain changes in ground temperatures more than the individual changes in either parameter. Alpine meadow and thin snow cover appear to delay warming of the ground.
1. Introduction
The impact of climate change on the ground thermal regime of high mountain environments remains uncertain in many aspects, due in part to complex processes involving mass and energy exchanges with the winter snow cover. Alpine snow cover projections have been produced by several studies (e.g., Laternser and Schneebeli, 2003; López-Moreno, 2005; Derksen and Brown, 2012), all reporting an ongoing contraction of the snow season, mainly due to an earlier melt-out date. Recent studies such as e.g., López-Moreno et al. (2008) and Schmucki et al. (2015) have used model-based approaches to predict changes in snow cover to the end of the century. However, climate change induced evolution of high mountain ground temperatures and connection to changes in the winter snowpack, are less clear and have so far been investigated in relatively few studies.
Several studies have documented slope failures in permafrost terrain and linked these failures to general warming trends or specific events such as the heatwave of 2003 (Gruber et al., 2004; Stoffel et al., 2005), however these generally report on specific case studies. Ravanel (2011) investigated transient changes in the Mont Blanc Massif from the end of Little Ice Age to 2100 and found distinct warming on all investigated Rockwalls. Deline et al. (2015) compiled a rockfall inventory covering the last 300 years and found evidence of increased rockfall and a causative link with warming rock temperature. Luetschg and Haeberli (2005) looked at the interaction of snowcover and ground temperature in an earlier study and found the lower limit of permafrost to be raised by 170 and 580 m over an 80 year period. However this study was undertaken at one site only, Weissfluhjoch, Davos.
Dedicated permafrost studies have been carried out to both establish the current state (Luetschg and Haeberli, 2005) and future evolution of the ground thermal regime in various case-study locations (Noetzli et al., 2007; Ravanel et al., 2017). However, these have either focused on permafrost areas exclusively, slope stability issues or rockwall dynamics. No study has systematically studied the effects on snow and ground temperature under a changing climate in the Alps. Anticipated changes are important to characterize particularly in the Swiss Alps where infrastructure and assets are often built upon (or exposed to) mountain permafrost soils. Changes in ground temperature can cause significant socio-economic problems, as thawing ground material loses mechanical strength and therefore stability (Haeberli, 1998; Gruber et al., 2004; Krautblatter et al., 2013), potentially causing or contributing to rockfall, landslides, debris flows, or other events related to destabilization of ground material in peri-glacial environments (Gobiet et al., 2014; Deline et al., 2015). Several studies have observed a warming of ground temperatures over the past decades (Harris et al., 2003) leading to an increase in permafrost slope failures (Noetzli et al., 2007; Haeberli and Gruber, 2008; Phillips et al., 2017). There is evidence of both increased rock wall failure as a consequence of changes in ground thermal regime (Deline et al., 2015) and debris flow activity (Gobiet et al., 2014), although this phenomena is additionally strongly linked to large precipitation events.
Processes involving snow are often close to melting point and therefore highly sensitive to climate change. Mountain areas have experienced a strong increase in mean annual air temperature over the past decades (by up to 0.35 °C per decade in the Swiss Alps) (Ceppi et al., 2012) and temperature increase will probably continue for the foreseeable decades (Bernstein et al., 2008) and consequently, snow cover will be reduced. It is therefore very likely that ground temperatures will also undergo significant changes. However, the interaction of ground temperature and snowcover is not entirely straightforward and studies such as Delarue et al. (2015) and Haberkorn et al. (2015) have indicated that warmer air temperature can lead to ground cooling in certain terrain and soil conditions. In contrast to these findings Henry (2008) reported a decrease in soil freezing days in Canada and Mellander and Löfvenius (2007) found an increase of soil temperature in Swedish pine stands. However, very few studies (and none to our knowledge) have modeled the interaction of soil temperature and snow cover at a larger scale and across a range of climates, in a high mountain environment, while considering these dynamics under a future climate. Snow influences ground temperature mainly by its physical properties (high albedo, low thermal conductivity, latent head of fusion) (Zhang, 2005). As the physical properties of snow can lead to both cooling and warming of the ground, the net effect depends on the time of the year and the state of the snowpack (Haeberli, 1998; Luetschg et al., 2008). Cooling effects are mainly seen in early winter, because of the high albedo (Wendler and Kelley, 1988; Zhang et al., 1996) and during snow melt when temperature is zero due to isothermal conditions at the soil-snow interface as latent heat is released during refreezing of melt water in the snow. Warming effects dominate in high winter under a thick snow cover (Haeberli, 1973). The insulation effect of a thick winter snow cover has been shown in several studies (Zhang, 2005; Luetschg et al., 2008), as well as the cooling effect of a thinner snow cover (Kaste et al., 2008). Snow cover can change mean annual ground temperature by several degrees and the overall effect depends on snow depth, the date of the onset of snow cover in winter, the duration of the snow covered period, snow density and the date of the snow cover melt-out in spring/summer (Haeberli, 1975; Zhang, 2005). Depending on the duration of the fully insulating snow cover, snow cover can increase annual ground temperature by 2–7 °C (Zhang et al., 1997; Bartlett et al., 2004). Differences in the onset and melt-out day of snow cover can change mean annual ground temperature by up to 6 °C (Goodrich, 1982). Studies have shown (Ling and Zhang, 2003) that the onset date of snow cover in autumn is more critical than the melt-out day and additionally, an increase in snow depth by one meter can increase temperature by 2.7 °C.
In the Alps, topography has a large influence on ground temperatures mainly due to differences in incoming short wave radiation and air temperature (Gubler et al., 2011). This influences snow metamorphosis and can enhance snow melt by weeks to months on south facing slopes. Snow accumulation, and therefore thickness of snow cover, is also heavily influenced by topography, due to wind effects and slope angle (Gerber et al., 2017). Due to these effects, temperature can vary strongly at small scales. Recent studies on the small-scale variability of mean annual ground surface temperature in mountain slopes, found a variability of 0.16–2.5 °C within 10 × 10 m footprints (Gubler et al., 2011) and 1.5–3.0 °C over distances of 30–100 m (Isaksen et al., 2011).
This study has two main objectives:
1. A model-based approach is used to simulate ground temperatures changes in the Swiss Alps until the end of the century in snow covered areas between 1,700 and 2,800 m a.s.l. using the process-based model SNOWPACK. The strength of this study is the ability to evaluate the reference period, which spans the years from 2004 to 2016, against a high quality dataset of high elevation Automatic Weather Stations (AWS) from the Intercantonal Measurement and Information (IMIS) network that is used for avalanche forecasting in Switzerland. This network records a full suite of meteorological parameters together with snow depth and ground temperature. Therefore, this dataset provides a good opportunity to study snow-ground temperature interactions under current and future conditions.
2. In order to model snow cover, SNOWPACK is driven by snow height measurements during the winter season. In order to simulate ground temperature the model needs to be run continuously for the entire annual cycle. However, winter precipitation is not measured at these stations as the energy requirements for heated pluviometers is unable to be met at these remote stations. To overcome this problem a method to reconstruct a full year precipitation data set at each AWS is additionally presented.
2. Data and Methods
In this study, ground temperatures and snow height are modeled for a reference period and three future periods at 16 high alpine AWS stations of the IMIS in Switzerland. These can be classified as high alpine (with possible permafrost occurrence), alpine and low elevation. The elevation of the stations range from 1,630 m a.s.l. for low alpine stations to 2,850 m a.s.l. for high alpine stations. All stations are relatively flat (slope angle 2–12 °) and all stations have a permanent snow cover in winter. The snow season duration at the stations varies between 192 (Bosco/Gurin, BOG2) and 250 days (Simplon, SPN2). Mean snow height varies from 0.68 m at Simplon Ze Seewe (SPN2) to 1.96 m at the Simplon (SPN3). High alpine stations are located in Grisons and the Valais, mid altitude stations in Grisons and the central Alpine north slope and lower elevation stations (below 2,000 m a.s.l.) on the north side of the Alps. Figure 1 shows the location of, and Table 1 gives metadata for, each station. The spatial distribution of stations covers all climatic regions of Switzerland. Even though the Swiss Alps domain is relatively small, the climatic variability is large. Based on forecasted climate change signals (e.g., from CH2011 and CH2018 summary reports) it is common to divide the Alps into west, east, and northern sectors. This is mainly due to the fact that the Swiss Alps straddles a European climate divide, with a forecasted decrease of winter precipitation south of the Alps and increase north of the Alps. In this study both signals play a role, so stations are mainly classified by their geographical location, resulting in the three main regions which are used in this study. These are as follows: (1) the Valais region in the south-west, which has snow rich winters, (2) Grisons, which is located in the south-east of Switzerland and is much drier, characterized by an inner-alpine climate in many parts, and (3) the Alpine north slope, which is mostly influenced by weather conditions from the north Atlantic and northern Europe.
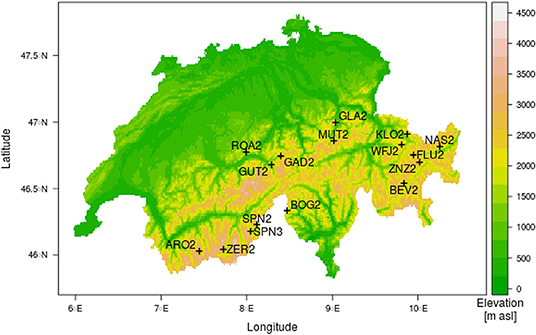
Figure 1. Location and elevation of the 16 stations used in the study.
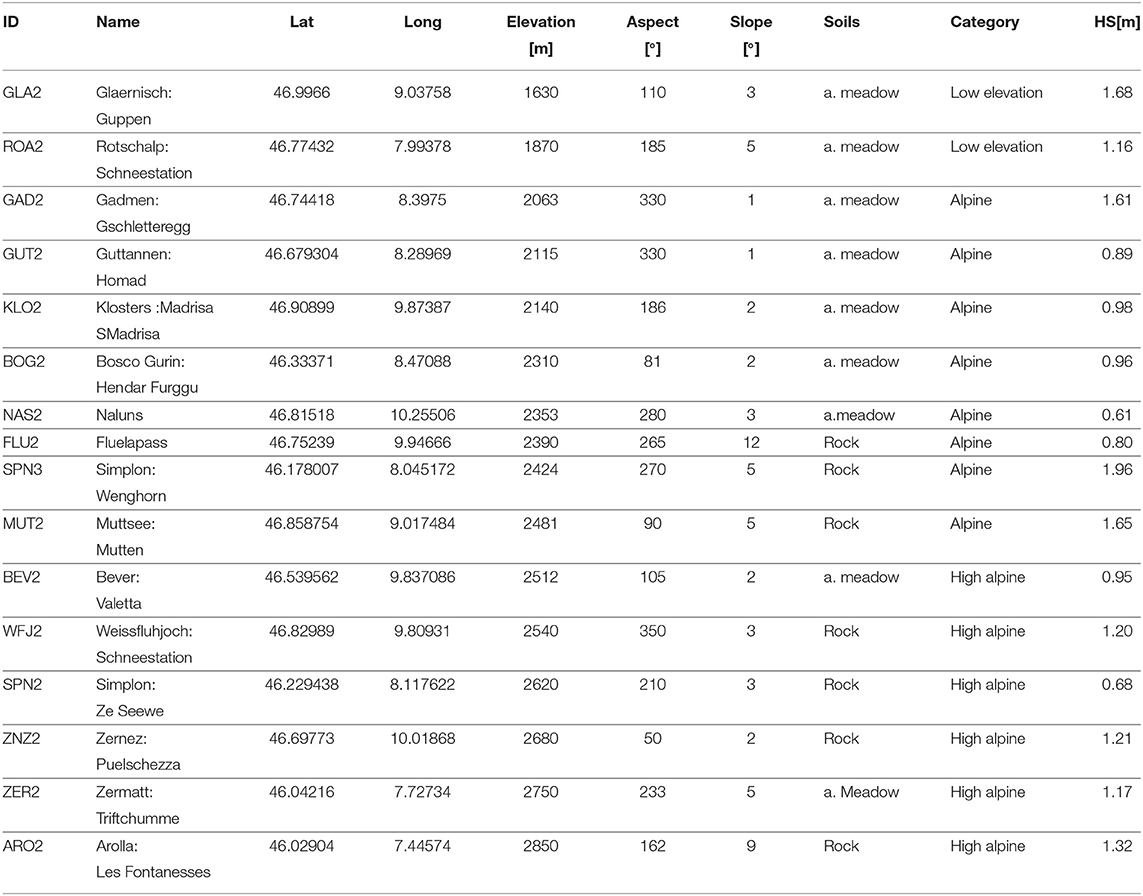
Table 1. ID, name, location, elevation, slope aspect, slope angle (Slope), soil type, category (a. meadow stands for Alpine meadow) and mean snow height, for all days were snow height (HS) >0.1 m for all stations used in the study.
2.1. Input Data
All IMIS stations measure the following variables: air temperature, relative humidity, wind speed, wind direction, and outgoing shortwave radiation, snow surface temperature, ground surface temperature, and snow depth. Temperature/relative humidity sensors are naturally ventilated. Data is available at 30 minute resolution. A continuous data set of summer and winter precipitation is required to force the model but unavailable as unheated pluviometers at the stations are only capable of measuring liquid precipitation. Additionally, only a subset of the stations have been equipped with unheated rain gauges and only since 2009. This data, when available is used for liquid precipitation input in summer. Therefore, data are completely missing in winter and sparse in summer. The treatment of data gaps is described below.
IMIS fields are used to force SNOWPACK and solid precipitation is back calculated from measured snow height, using the Costijn Zwart's snow density model. Additional quality assurance and quality control checks are made on the dataset as follow. As vegetation growth is incorrectly registered as snow by the sonic ranger (Lehning et al., 1999) these are filtered out by checking the correlation between air and ground temperature increase, and a rate of change filter for snow height (Marty and Klein, 2015). Snow height measurements which are detected as vegetation are set to zero. Negative snow values due to sensor calibration errors are set to zero. In order to filter out melting snow in the unheated rain gauges which cause false precipitation events, non zero precipitation measurement from all sources are only allowed if relative humidity >0.6 and the temperature difference between air and snow surface temperature is smaller than 3 °C for snow height above 0 °C, because that indicates cloudy conditions. Negative precipitation values, due to calibration and measurement errors from IMIS stations are set to zero.
The automatic ground measurement network (ANETZ) is part of the meteorological measurement network of the Swiss national meteorological service (SwissMetNet). This network is composed of around 160 stations which have measured air temperature and precipitation since at least 2000. All stations are equipped with heated pluviometers to make year-round precipitation measurements. However, we preferentially use IMIS data as these stations better represent the Alpine zone, whereas ANETZ stations are fully powered and therefore are often situated at lower or less remote locations due to this requirement to be “on-grid.” This network is used to fill remaining gaps in the IMIS data according to the following procedure: (1) SwissMetNet data is used as input for a multiple linear regression which is used to reconstruct precipitation events at the IMIS stations. (2) The regressions of the top five SwissMetNet stations within a radius of 35 km and with the smallest elevation difference are used as a first estimate for a given IMIS station. (3) Finally, of these five stations a maximum of two stations that give the best R2 values are chosen. For all stations used in the study R2 is greater than a threshold set at 0.6. Regressions are computed on hourly data and based on a subset of winter precipitation events that exceed >1 mm. Note, some of the regressions contain an interaction term, which can have a negative sign. If precipitation on one station is strong, but weak at the other, then negative precipitation can occur. If this situation is found, rain on the actual IMIS station is not very likely, so then values are set to zero. Negative values total between 3 and 5 % of all values.
In order to prepare a complete precipitation dataset and to capture rain on snow events (precipitation during the “snow” season), gaps were not only filled with regression data, but for each data point it was decided based upon a set of rules (Table 2) which precipitation values should be taken. Values are taken from three existing sources. (1) Solid precipitation is taken from SNOWPACK simulations, calculated from the measured snow height difference using the calculated snow density from SNOWPACK. Liquid precipitation is either taken from (2) measurements at the IMIS station or (3) from linear regression values calculated from surrounding ANETZ stations. As a first step, snow height is checked, if snow height is >0.1 m and temperature is below 1.2 °C, precipitation values calculated with SNOWPACK from measured snow height differences are used, because at temperatures below this threshold, rain is unlikely. For temperatures above 1.2°C and snow height above 0.1 m, the regression from ANETZ is used as rain input if the regression results in a non-zero value. For snow height between 0.02 and 0.1 m, ANETZ measurements are taken if temperature is above 0 °C and SNOWPACK data otherwise. The threshold for thin snow covers is different, because snow cover below 0.1 m mainly exists in autumn, when rain on snow events happen more often because on average air temperature is higher than in winter (Il Jeong and Sushama, 2018). However, this only makes up <5% of all data points. If snow height is below 0.02 m and the IMIS station has precipitation measurements these values are taken, otherwise ANETZ regressions are used. For snow height below 0.02 m SNOWPACK measurements, which depend on the differences in snow height, are not accurate. Therefore below 0.02 m only IMIS and ANETZ measurements are taken. This situation occurs mainly in summer, where IMIS measurements are accurate, possible summer snow events will also be measured with the unheated rain gauge, due to a typically rapid melt as air temperature warms to “normal” summer conditions. Missing summer IMIS data is preferentially filled with ANETZ data, otherwise SNOWPACK data is used if ANETZ measurements are also missing. This algorithm also includes summer snow events, because it is dependent on snow height and not on air temperature or time of the year. When comparing ANETZ regressions to measured winter and summer precipitation data, ANETZ data tends to overestimate precipitation events, therefore IMIS data is preferentially used, if available. The overestimation of ANETZ regressions mainly comes from the fact that not all false precipitation events can be filtered out, as distances between stations are large. For station Weissfluhjoch the method presented above leads to a mean annual precipitation input of 1359 mm per year, which can be compared to the mean yearly values from 1981 to 2010 obtained from a heated pluviometer of 1411 mm, by MeteoSwiss. Additional gaps in the forcing fields are filled with linear regression (Bavay et al., 2012), except for station Weissfluhjoch where data is missing from August 2008 to October 2008 and filled with mean values over the entire observation period for the respective day. Gaps do not exceed a period of 3 days, except for this Weissfluhjoch case.
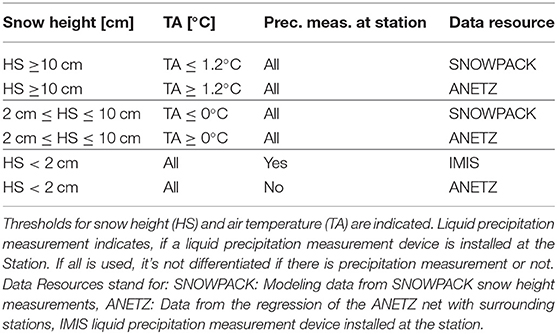
Table 2. Summary of rules which are used to build the precipitation data sets.
2.2. Climate Change
For the climate change period, the delta change method is applied (Hay et al., 2000), which applies a scaling (“delta signal”) to reference period values in order to simulate a changed climate (CH2011, 2011). In order to apply the delta change signal, the delta changes for air temperature are added to every data point of the corresponding day of the year. For precipitation the data from the reference period is multiplied with the delta change signal of the corresponding day of the year. This approach is commonly used in climate studies, because it is robust against regional climate model errors, but has the disadvantage that extremes and inter-annual variability does not change pattern (López-Moreno et al., 2008), magnitude only is changed. Delta changes are applied to the whole reference period and future modeling has been done for 12 years for each future climate period. We found that modeling future periods with the climate change signal directly, does not reveal any significant difference, compared to a transition run from 2000 to 2100 which had been performed for one regional climate model at Weissfluhjoch.
The Swiss climate change scenarios CH2011 (CH2011, 2011) predicts possible changes in seasonal mean air temperature and precipitation to the end of the century in Switzerland. This study was primarily conducted prior to the release of the new CH2018 (National Centre for Climate Services, 2018) scenarios and therefore they were not able to be considered. However, as stated in the technical report (CH2018, 2018), the latest results mainly confirm those of the previous scenario assessment, CH2011 and therefore we do not expect this to have a significant impact upon our main findings.The local daily delta change signals for precipitation (%) and air temperature (°C) from the extended version of CH2011 (Pattern scaling- Local daily scenarios, PS-LDS) is used in this study. For the PS-LDS dataset regional results from CH2011 have been downscaled to MeteoSwiss station locations and results are generated for 10 different regional climate models (Bosshard et al., 2011). The CH2011 data were obtained from the center for Climate Systems Modeling (C2SM) at the ETH Zurich. A multi-model approach is used and results are generated for two different emission scenarios defined by the fourth IPCC report (2007a, Bernstein et al., 2008). In this study results from the A2 scenario of IPCC 2007 are used which describes a very heterogeneous world, meaning, little or no climate action, and local development, which results in continuously increasing population and a more fragmented and slower economic growth. For the A2 scenario an increase in winter temperatures at the stations used in the study of 3.5–3.8 °C for the period of 2070–2099 compared to the reference period of 1980–2009 is projected. In Supplementary Material 1, change signals of the ten regional models for WFJ station are shown. Mean summer temperatures are projected to increase by 4.3–5.5 °C. All temperatures have an approximate uncertainty of 1 °C. By 2085, summer precipitation is projected to decrease by 9−22 % and winter precipitation is predicted to increase by 3−14 %. CH2011 scenario data is available at site scale at all MeteoSwiss stations, however, these are not co-located with IMIS stations. In this study daily delta change signals of the nearest-neighbor location for every IMIS station is used. The distance between the stations does not exceed 10 km, but elevation differences can be large in some cases. No elevation based scaling, has been applied to the delta change signals.
2.3. Modeling Setup
As a reference period the time from October 2004 to October 2016 is used which includes 12 full winter seasons. The reference period differs from the reference period used for CH2011 (1980–2009) and is shorter (12 years compared to 29 years) because data in useful quality is only available from 2004 for most stations. Prior to 2004 only a subset of IMIS stations existed and timeseries contain large data gaps. For station Naluns only data from 2010 to 2016 was used, because there are no earlier measurements available. It has been included in this study because it has ground temperature measurements from 2013 to 2016. For the stations in the central north Alps (Gadmen, Mutten, Guttannen) data is only available since 2009. They are included in the study to provide coverage for this region of Switzerland. For the climate change periods, delta change signals for the period 2035–2060 (2035), 2060–2085 (2060), and 2085–2100 (2085) are added to the input data for the reference period.
2.4. SNOWPACK
SNOWPACK is a one dimensional, physically-based, numerical model which provides information about the state of the snow pack, including new snow depth, snow temperature, and density (Lehning et al., 2002a). Snow is modeled as a tri-phase porous medium (ice, water, air) and is characterized by the volumetric content (θ) of each medium and four independent micro structure parameters (sphericity, dendricity, grain size, and bond size). Mass, energy transport, and phase change processes are modeled the same way in soil and snow (Lehning et al., 2002b). The model solves the partial differential equations governing the mass, energy, and momentum conservation within the snow pack and soil layers using a Lagrangian finite element method (Bartelt and Lehning, 2002).
Soil is modeled as a four component material consisting of water, air, ice, and soil mineral components. Different soil types are characterized by the mean grain size, density, and thermal properties of the dry soil material. The grain size sets the volumetric content of water and soil (Luetschg et al., 2008). In SNOWPACK 12 grain size classes are predefined, these classes also determine the water retention capability by setting the van Genuchten parameters for the water retention curve. For this, the ROSETTA soil classification and class average hydraulic parameters (Schaap et al., 2001) are used. The saturated hydraulic conductivity is also set according to the grain size class. Luetschg et al. (2003) showed that modeling different soil types by their grain size radius gives satisfying results. The density of the soil content, heat capacity, soil albedo, and the heat conductivity also strongly influence the behavior of the soils. Those parameters need to be set individually for each soil profile.
2.4.1. Parameter Initialization
For the initial soil profiles used in the study, the stations are classified by their land use classes, which is either rock or alpine meadow. A soil profile is then assigned based on this classification. At all stations in the study some organic or plant material is present, as none are directly situated on bedrock. The dominant surface cover at the stations is taken from field surveys completed at all IMIS stations in 2015 and further confirmed by maps available from the Federal Statistical Office (1979). For all stations the observed ground cover corresponds with the land use map (Wever et al., 2017). Soil information is also available at all stations from profiles made during the 2015 survey. For the “rock” class a loamy-sand profile is assigned, whereas for “alpine meadow” silt—loam from 0.00 to 0.6 m and sandy—loam for deeper soils 0.60 to 3.00 m) is assigned, following Wever et al. (2015). For the density of the soil particles (ρs), the thermal conductivity (γs), and specific heat capacity (cp) values are taken from previous studies (Wever et al., 2017) and are, at least for the station Weissfluhjoch, comparable to measurements (Wever et al., 2015). Soils are modeled to a depth of 5 m with a total of 50 Layers. Layer thickness increases from 0.01 m at the surface to 0.30 m at the bottom of the profile. Layer thickness of 0.01 m at the surface is chosen for numerical reasons because of the high diurnal variability of temperature at the surface and because surface temperature is highly sensitive to surface layer thickness (Gubler et al., 2013). Near surface (0.00–1.00 m) temperatures are initialized by the measured surface temperature at the station. Modeling results show that the mean annual ground temperature is not sensitive to the initial temperature at the surface, as it evolves relatively fast. Temperature at depth of 1.00–5.00 m are initialized with the mean modeled temperature at 1.00–5.00 m depth resulting from a 12 year model run.
2.4.2. Modeling Setup
The model is driven with precipitation sums, air temperature, wind direction, relative humidity, and outgoing shortwave radiation. Instead of measured surface temperature, parameterized incoming longwave radiation is used as a boundary condition for the temperature equation, because it is related to air temperature and therefore will provide more realistic results for the climate change signal, as described in detail by Schmucki et al. (2015). Incoming longwave radiation is parameterized using the all-sky formulation of Crawford and Duchon (1999) and the clear-sky parametrization by Dilley and O'Brien (1998). For atmospheric stability the correction model MOHOLTSLAG (Schlögl et al., 2017) is used, which is based on the model of Holtslag and De Bruin (1988). Roughness length is set to 2 mm for all stations and no vegetation canopy is present. The Neumann boundary condition is used for the temperature equation at the surface of the snowpack and a geothermal heat flux of 0.6 Wm2 as the boundary condition at the base. The temperature threshold for snow/rain separation is 1.2 °C. For water transport in the snow and soil the full solution of Richards equation is used with free drainage (Wever et al., 2014a, 2015). Snow albedo is parameterized in SNOWPACK (Schmucki et al., 2014).
3. Results and Discussion
3.1. Validation
To validate model performance the following metrics are used: modeled mean snow height and the onset and melt-out day of snowcover. Mean snow height is the mean snow height, for all days with snow height >0.10 m. This threshold is chosen, because measurements and modeling results are reasonable for errors below 0.10 m. Differences in modeled vs. observed snow height are between −4 and 12%. The melt-out day was defined as the first day between February and August where measured snow height is 0.00 m. As all of the stations are located in high alpine regions and have a continuous snow cover between December and end of winter, a melt-out day can be identified using this definition. Modeled mean snow height was generally in the expected range for each station and between 0.68 m in Simplon and 1.96 m in Wenghorn (Table 3). On several stations snow height is underestimated by the model, particularly when mean annual snow height is high (Figure 2). This has been seen in other studies (Wever et al., 2015) at station Weissfluhjoch for precipitation driven SNOWPACK simulations. This has three main reasons: First, modeling errors such as biases in the precipitation input or errors in model parameterizations (e.g., densification). Second, the modeled snow height includes many days with snow height below 10 cm in early winter, which do not appear in the measurements. These values lower mean modeled snow height. To minimize this effect only values above 10 cm are used for mean snow height calculation. Supplementary Material 2 shows the differences between calculated mean snow height with and without a low snow threshold. Third, early melt out of the snow cover, lowers mean snow height, as discussed in section 5.1. below. However, most of this bias is due to calculation issues and mainly occurs at snow depth greater than 1 m and is therefore not expected to influence ground temperature substantially. Additionally, melt out dates are generally accurately modeled with offsets of no more than 2 days.
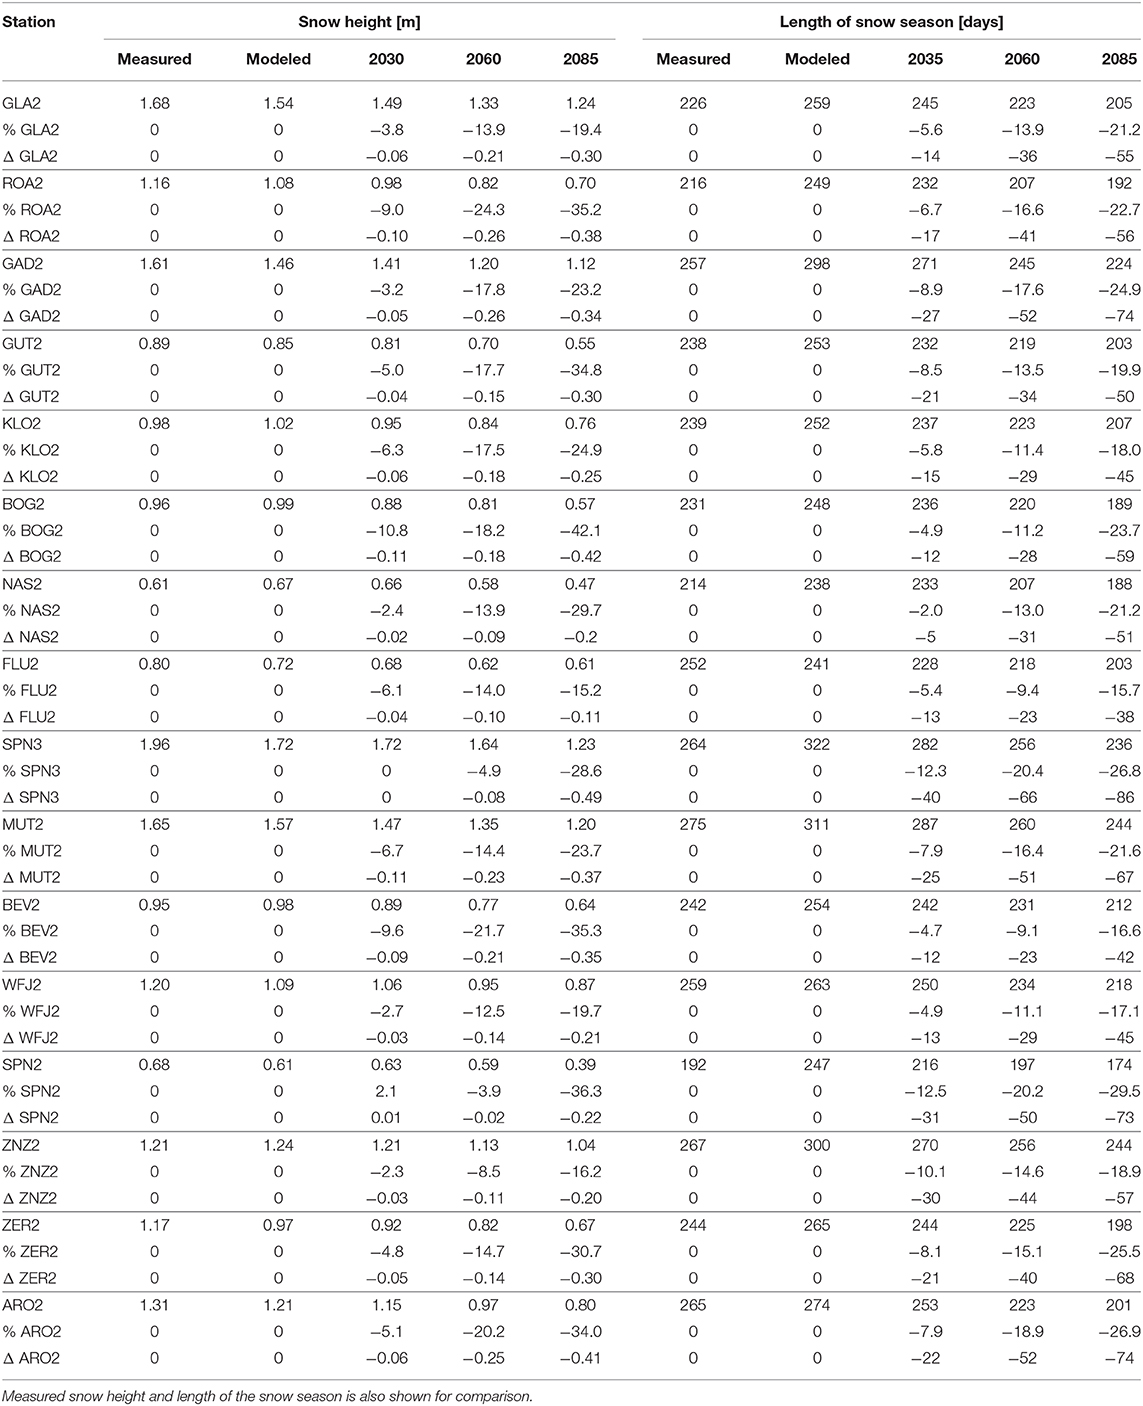
Table 3. Mean snow height (HS), for all days with snow height > 0.1 m in meters and length of snow season in days for the reference period as well as for the three future periods and decrease in percentage of total snow height and length of snow season.
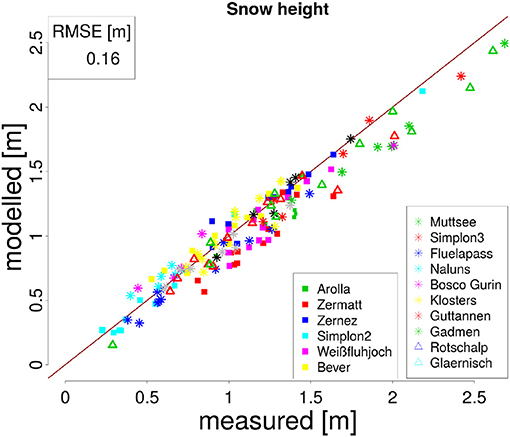
Figure 2. Scattered plot of modeled and measured maximum annual snow height for station used in the study. Dots represent the stations. Squares represent high alpine stations, stars alpine stations, and triangles low alpine. The root mean square error (RMSE) for all stations is 0.16 m.
For the onset of snow cover, the first day, when snow height is larger than 10 cm for 10 successive days is chosen. Differences between measured and modeled onset day and the annual differences are large. Differences between modeled and measured onset days are between 7 and 30 days. The earlier modeled onset of snow cover is due mainly to the fact that some autumn snowfall events are overestimated by the model and melt-out of these events are slower than in reality. The low melt-rate is also seen in spring and could be related to errors in snow albedo and incoming longwave radiation parametrization. For all stations the onset of snow melt is consistently too early and is associated with a phase of rapid snow melt which can not be seen in the measurements. As the melt-out day is modeled accurately compared to measurements, it can be seen that the melt rate, after the first rapid snow melt, is modeled too low. For station Weissfluhjoch this was not seen in earlier studies such as Schmucki et al. (2015). In these earlier studies measured incoming longwave and outgoing shortwave radiation was used to calculate snow albedo, whereas in this study only measured outgoing shortwave and parameterized incoming longwave radiation is used. Errors in calculated snow albedo could therefore explain the rapid melt-out phase in spring leading to the generally negatively biased snow height. As measured incoming longwave radiation is only available for Weissfluhjoch but not for the other stations, only measured outgoing shortwave radiation was used for consistency in this study. This phase of early melt out, does lower the mean snow height of all stations by up to 0.02 m. It also has minor effects on ground temperature. Figure 3 present measured and modeled snow depth and ground temperature at various depths over the period 2014–2016 at station WFJ2. Modeling approach 1 (green lines) only uses measured outgoing shortwave for snow height calculation. This approach is used in this study for all stations. Modeling approach 2 (blue lines) is modeled data, calculated with measured incoming longwave radiation, which leads to better results in modeling snow height, because the early melt out is not reproduced here. This comparison shows that the early modeled onset of snow melt out, moves forward the beginning of the zero curtain point, and with that increases the mean temperature. Recalculating the mean temperature, with lower ground temperature for the critical time, does lower mean temperature by 0.01–0.03 °C, depending on the station and the performance of snow height results.

Figure 3. Measured and modeled snow height (HS, A) and ground temperature (GT) at surface (B) and at 10 (C), 20 (D), and 50 cm (E) depths for 2014–2016 at Weissfluhjoch (WFJ) station. The gray horizontal line indicates the zero degree line in each ground temperature plot.
For good estimates of ground temperature, accurate modeling of melt-out day and mean winter snow height is required, which was possible with this study. However, modeled ground temperatures could not be thoroughly evaluated, because there are few high quality measurements available. The station Weissfluhjoch is one exception where ground temperatures measurements at 10, 20, and 50 cm depth from 2014 to 2016 are compared to the modeled ground temperature. The data is measured close to the IMIS stations at 30 min resolution. Ground surface temperature (GST) measurements are available for most IMIS stations, with the primary purpose of measuring temperature at base of the snowpack. They are not always shaded and are therefore prone to measurement errors. As these measurements are not of sufficient quality in the context of this study, they are not used for evaluating the model.
At Weissfluhjoch (Figure 3), ground temperature is modeled slightly too low at all depths for summer and winter, this has been observed in other studies for Weissfluhjoch such as Wever et al. (2015). Winter temperatures are modeled of equal quality in all depths, but summer ground temperature variability is captured better at depth, even if the absolute value is negatively biased at 0.50 m depth. Temperature variations on the surface are higher than in the ground and therefore are more sensitive to errors. Turbulent fluxes at the boundary of air and soil enhance the heat exchange at the boundary and cause a fast, direct reaction of the ground surface temperature to air temperature. Deeper in the soil profile this effect is not present and soil layers above have an insulating effect. Because of this low heat conductivity the effect of air temperature at depth is reduced. Slower dynamics and reduced variability are simpler to model and can explain the better results in summer for 0.30 and 0.50 m depth. The rapid and direct response of surface temperature to surface conditions also explains improved modeling results in winter as dependency lies only on snow depth and heat transport in the snow cover which may be more accurately modeled than soil heat flux. It can be concluded that the actual heat transport in soil is too rapid for the fairly simple parametrization used in this study.
Winter ground temperature modeling is highly sensitive to snow height. Snow melt-out is characterized by a time period where ground temperatures are exactly 0.0 °C due to isothermal conditions, the “zero-curtain period.” This phase can be clearly seen at the surface and at 0.10 m depth. At depth the effect is not as strong but still visible, which is mainly because it's a surface effect. The increase in ground temperature after snow melt-out can also clearly be seen and depends on the accuracy of the snow modeling. It is too late at the end of winter 2013/2014, when snow melt-out is modeled too late and too early at the end of winter 2015/2016 where snow melt-out is modeled too early compared to the measurements. The high temperatures of up to 20 °C highlights the problem of modeling errors due to direct modeled solar radiation exposure. Measurement devices for ground temperature are normally shaded and not exposed to direct solar radiation, whereas no ground shadowing is modeled in the study, which can lead to the very high temperature due to direct solar radiation. The ground temperature thermistors has been placed at 1 cm depth, to reduce this problem, but low ground albedo and non shadowing can still lead to high temperature. These high temperature values are also seen at the beginning of winter 2013/2014 at the surface and at 10 cm depth.
3.2. Climate Change Period
3.2.1. Snow Height
The satisfying results for the reference period made modeling ground temperature and snow until 2100 a worthwhile exercise. According to simulated results for the climate change periods, mean snow height is projected to decrease for all three future periods at all stations. However, differences between station responses are high and depend on elevation and station location. By 2035 decreases are seen to be between 1% (SIMP3) and 11% (Bosco Gurin), and by the period 2085 snow height reduction of between 19% (Glaernisch) and 42% (Bosco Gurin) is seen (Table 3). The decrease of snow height is higher at the stations in Valais and south of the Alps, than in Grison and the northern Alps. This is mainly due to two effects. First, the onset of snow cover in Valais is earlier than at Weissfluhjoch and Zernez, because in the Grisons there are generally lower precipitation totals in early winter. Conversely, in the western Alps there is a higher frequency of snow fall events in early winter, close to the melting point, which are likely converted into rain events in the future. This delays the onset of snow cover at these stations and also makes a significant differences in snow height mean values, due to these early winter snowfall events being removed from the annual snow cover budget. In Grison the main snow fall period is in high winter, where temperature will persist at values below 0.0 °C over a wide area in the future modeled periods. An earlier melt-out of snow, which can be seen at all stations, does not have a significant influence on mean snow height.
The stations in Valais are more influenced by the southern climate change signal, and are therefore likely to get less precipitation in winter, in contrast to the stations in Grisons where winter precipitation is projected to increase. Projected changes in precipitation are however uncertain and depend strongly on the regional climate model which is used. Changes in mean snow height are however sensitive to this signal, as an increase in high winter precipitation can compensate for a shorter winter season due to a later onset or earlier melt-out day. For stations in climatically similar regions, elevation effects dominate and a decrease in mean snow height is strongest at low stations and less at the high alpine and alpine stations. This is simply because at lower elevations snow fall occurs closer to melting point and is therefore more sensitive to changes in air temperature. Table 3 shows the absolute and percentage decrease of mean snow height together with changes in the length of snow season for all stations and periods.
By 2035 snow height at all stations is likely to increase by approximately the same amount (Table 3). Here the elevation signal is the main factor driving the decreasing snow height trend. At high alpine stations in Grisons and Simplon, as well as wind exposed alpine stations with a thin snow cover, only a decrease of around 0.06 m (Table 3) is seen. The station topography and regional climate appear to be dominant drivers. Relative changes are of the same amount.
However, by 2085 the strongest decrease (around 0.40 m) is seen in the Valais, the Engadin and at low elevation stations. In the Valais this is assumed to be because of reduced winter precipitation. At the alpine and low elevation stations, decrease in snow height is ca. 0.38 m, with a slightly stronger decrease at snow rich stations. An exception is the high alpine station Simplon and the alpine stations Fluelapass and Naluns. These stations are located at wind exposed locations. Due to wind erosion of snow, snow height at these stations is strongly reduced. Calculated decrease of snow height under climate change scenarios at these stations is however relatively small. The main reason for this fact is that wind erosion is the dominant factor affecting snow height accumulation, yet changes in wind speed are not included in the scenarios.
In terms of changes in length of the snow season, regional climate differences are seen to be the most important factor. Shortening of the snow season is strongest in the Valais with 8 % in 2035 and 25 % in 2085. This is mainly because, as noted earlier, the snow season tends to start earlier in Valais, and this early winter snow fall will likely be converted to rain in the future. In Grison, the snow season will shorten by around 5 % and approximately 13 days in 2035 and 18 % in 2085. In the northern Alps, this value is approximately 9 % in 2035 and approximately 21 % in 2085. Figure 4 shows snow height at Weissfluhjoch, Zermatt, Gadmen, Fluelapass for each day of an average year for the reference period as well as for 2035, 2060, and 2085. Values are the mean daily value calculated over the entire 12 year period. At all stations an earlier start of the melt-out period and an earlier end of snow cover is seen. All stations show snow cover decreases for all times of the year and for all future periods.
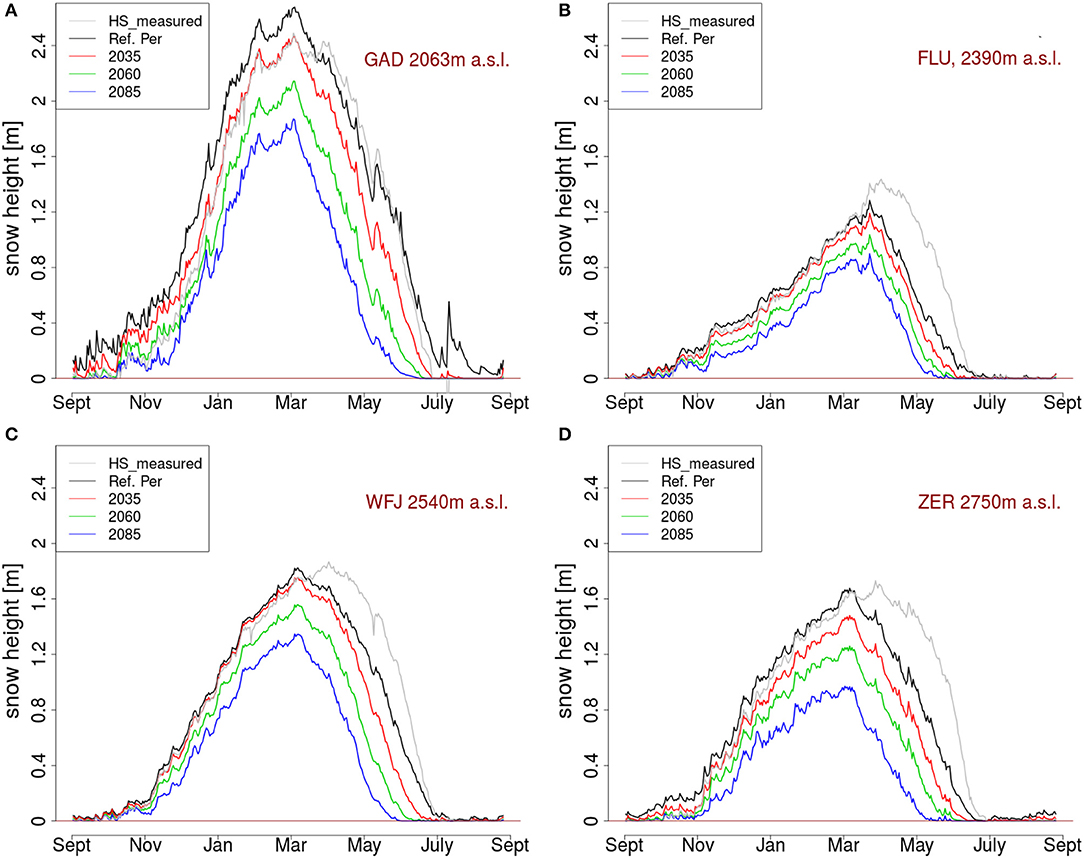
Figure 4. Mean snow heights (HS) for the average of 12 years, for the reference period (black line) and the three climate change periods (red, green, blue) for Gadmen (GAD2, A), Fluela (FLU2, B), Weissfluhjoch (WFJ2, C), and Zermatt (ZER2, D). Average year follows the snow season, so September to September is chosen, elevation of the stations is indicated. Gray lines show measured snow height, black lines modeled snow height for reference period (2004–2016), followed by red (2035–2060), green (2060–2085), blue (2085–2100).
By 2035 at the inner alpine stations Fluelapass and Weissfluhjoch, no significant changes in the snow accumulation period are seen, however, an earlier and more rapid melt-out process is likely. This effect is mainly driven by higher spring temperatures. At those stations snow accumulation in early winter is slow and most of the snowfall events happen in mid winter, when temperatures are well below melting point and a slight temperature increase is not significant. No change in accumulation processes and the maximum snow height are to be expected by 2035. However, by the end of the century a decrease in snow height at all stations and times of the winter is likely, but changes in melt-out period are still more pronounced at the inner alpines areas in Grison. At the alpine stations, changes in accumulation period are also smaller than during the melt period, especially at the stations with a relatively thin snow cover (Naluns and Fluelapass) and a slower rate of snow accumulation. This trend can also be seen in the changes in the length of the snow season, as it is defined by the number of days between the onset and melt out day of the snow cover. In Table 3, the shortening of the snow season at stations in the Valais is stronger, than at the snow poor stations in inner-alpine Grison, which is less exposed to westerlies from the Atlantic.
3.2.2. Ground Temperatures
An increase in air temperature, shortening of the snow season and changes in precipitation, will likely effect ground temperature at all depths in future decades. Figure 5 shows the temperature differences between the reference period and the three future periods for all stations at 5.0, 2.0, 1.0, 0.3, 0.1 m depth and at the surface. This result shows an increase in temperature at all stations and at all depths by 2035 and this increase progressing through 2085. For most stations warming at the surface is greater than in deeper soils and ranges between a mean increase of 0.6 and 2.3 °C by 2035 and 2.9 to 6.8 °C by 2085 at the surface. And at a depth of 5 m between 0.3 and 1.8 °C by 2035 and 1.6 and 4.4 °C by 2085. By 2035, surface warming at the high alpine stations is greater than at the middle and low alpine stations but by 2085 surface warming at the high alpine station is around the same amount as at the other stations. Temperature increases seen at the Valais stations are greater than at the stations in Grison, at all depths. This fact agrees with the differences in snow height changes. Therefore, shortening of snow season and a stronger decrease of snow height leads to a stronger increase in ground temperature. In deeper soils, temperature increase is strongest for the stations which are classified with a rocky soil (Table 1), the higher permeability and air content of those soils allows more rapid warming at depth in response to surface temperature signal. Organic soils have a higher heat capacity and therefore, alpine meadow soils can store more heat, which can delay the warming of deeper ground. At the surface, soil class is not significant, because here the main driver of temperature dynamics is the change in snow height.
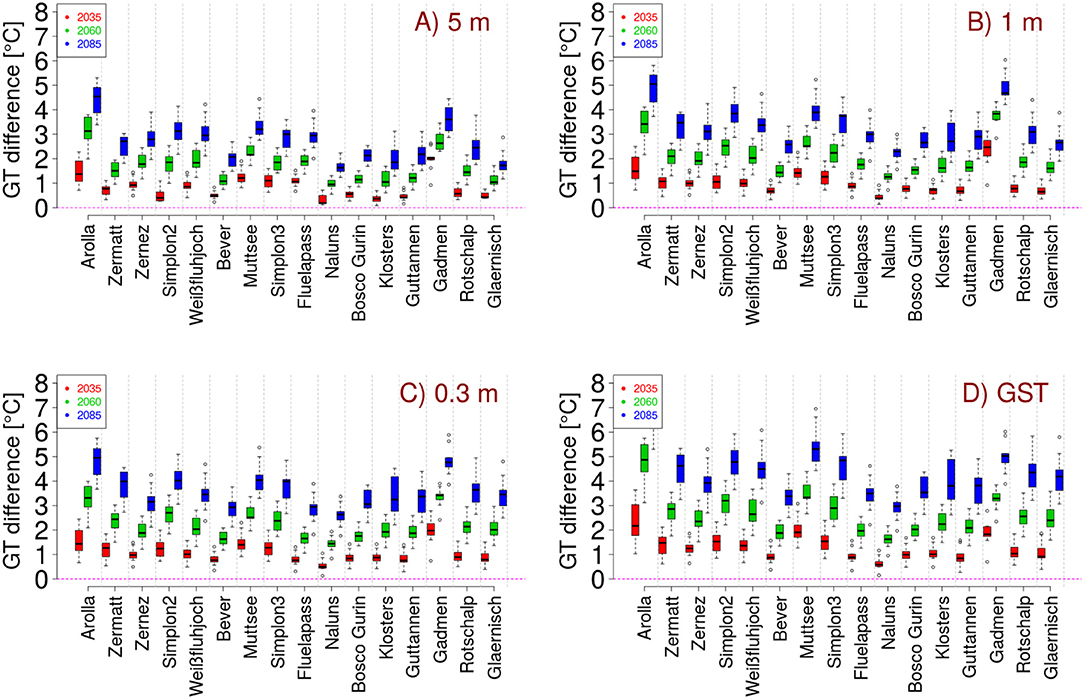
Figure 5. Increase of ground temperature (GT) at surface (D), 0.3 m (C), 1.0 m (B) and 5.0 m (A) depth, for all stations and all period is shown. Stations are ranked high to low and colors indicate climate change period. For all stations three boxes are shown. Ground temperature difference are shown in comparison to the reference period. The boxes show the differences between the 10 different regional climate change models.
Model variability, which is represented by the boxplots in Figure 5 increases with time and so does the magnitude of the differences between modeled ground temperature differences. For most stations there is an increase of temperature with time. At Arolla the increase of ground temperature is the strongest in the period of 2060–2085, where also the shortening of the snow season is pronounced and can be explained by the climate change input signal, which projects a slight decrease of winter precipitation in 2060 and an increase in both 2035 and 2085. At Gadmen the strongest warming is seen in the period from 2035 to 2060. At Gadmen decrease of snow height is also the strongest in that period, which again shows the high degree of coupling between snow height and ground temperature. At Muttsee and Wenghorn warming in 2060 is slightly less than in the other periods, which corresponds with a lower decrease of snow height for this future period. At the high alpine stations Zermatt, Weissfluhjoch, and Zernez warming at the surface is less in 2060 than for the periods 2035 and 2085.
The mean annual ground temperature for the 16 simulated stations shows an increasing trend overall, however for some specific years and stations a short cooling of ground temperature can be seen. Figure 6 shows the changes in ground temperature and snow height for two typical years. In the top panel we see a year with low snow accumulation and a cooling of ground in early winter, whereas in the bottom panel a year with rapid snow accumulation and ground temperature increase is seen. This cooling effect is only seen if specific conditions are met. As seen in Figure 6A a thin long duration snow cover in early winter, that does not melt out, leads to a cooling of ground in early winter. This is mainly because the thin snow cover still has a high albedo, that reflects incoming shortwave radiation, yet allows cold winter temperature to penetrate into the soils as there is no decoupling from the atmosphere due to thin snow cover. A snow depth of 0.40 m is shown to be a threshold that defines the degree of coupling between surface and atmosphere. If snow height sinks below this value, cooling effects are enhanced. Snow covers between 0.40 and 0.80 m, a common threshold for a fully insulating snow cover (Haeberli, 1973, 1975), show a slight cooling effect. Snow cover has to be thin for a significant time in early winter, and should require more than one significant snow fall event to exceed 0.80 m, for noticeable ground cooling. During the period of thin snow cover, temperature need to be below zero for cooling. For the years when a cooling is seen, maximum snow height is lower than in the other years. Figure 6B shows a year with no cooling effect and we see that only a short time period exists in early winter with a thin snow cover. In that period, ground temperature significantly sinks, but snow height is higher for future periods, so the enhanced cooling does not compensate the higher air temperature. Snow height does exceed 0.80 m very early. With snow height above 0.80 m the ground temperatures are fully insulated from the cold winter air temperature and no further cooling can be seen, even if snow height in general will be slightly reduced in the future. For both years an earlier melt-out of snow causing an earlier increase in ground temperature compared to the reference period is seen. Looking at mean annual ground temperature (Figure 5) the strong increase in temperature and in spring, does compensate all possible cooling effects from early winter. Even for the years with slight cooling effect in winter, mean annual ground surface temperatures were found to increase. In terms of long term and mean ground temperature, the cooling effects of thin early winter snow cover was seen to be not significant.
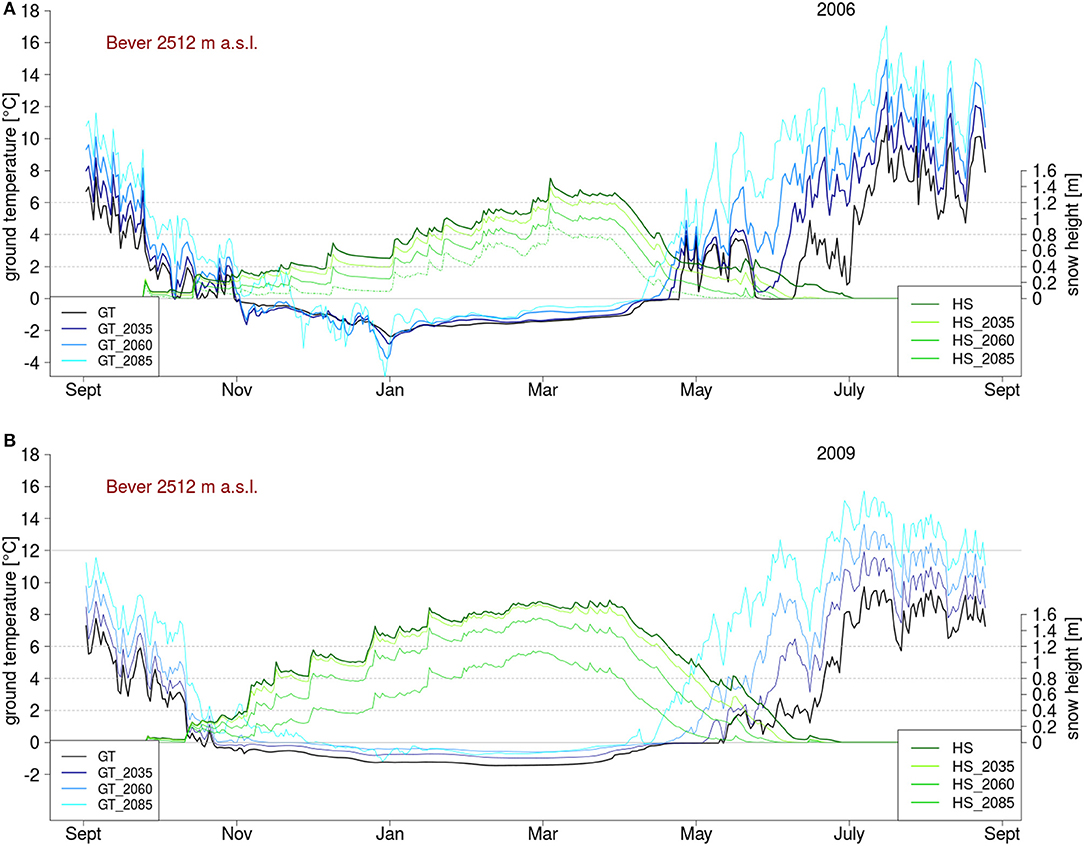
Figure 6. Example of a snow-poor year (A, 2006) where a cooling of the ground in early winter can be seen and a snow-rich year (B, 2009) with no cooling effect for the Bever-station in Grison. Snow height (HS) is in greenish colors and ground temperature (GT) in blue.
Figure 7 shows the changes in ground temperature per snow season, for 2035 (top), 2060 (middle), 2085 (bottom). Ground temperature was seen to increase for all depths and all seasons. The temperature decrease which can be seen for some stations in the snow accumulation period (Figure 6) does not lead to a general cooling trend in early winter, because inter-annual and inter-station variabilities are large. As shown in Figure 5 the increase of temperature is greatest at the surface, with a mean increase in 2035 of 1.24 °C at the surface and 0.7 °C at 5 m depth. Seasonal differences are clearly visible and again strongest at the surface. At the surface the increase is the smallest for the time with a constant snow cover (winter), because as long as a permanent, fully insulating snow cover is present, ground temperature is decoupled from atmospheric conditions. The increase of winter soil temperature is instead mainly driven by warmer soil temperatures in the snow accumulation period (autumn). The high increase during melt period (spring), is mainly due to an earlier snow melt-out, which leads to very high ground temperature differences. In the snow-free period (summer) ground temperatures are coupled to air temperature and the increase in ground temperature is comparable to the magnitude of the increase in air temperature that is due to the delta change signal. Surface temperature signals require time to penetrate to depth. At depth the seasons are shifted, which is clearly visible in Figure 7. For example, at surface air temperature signal needs around six months to reach a depth of 5 m, therefore at 5 m the strongest increase in ground temperature is in autumn and the weakest increase in spring reflecting summer and winter air temperature signals, respectively.
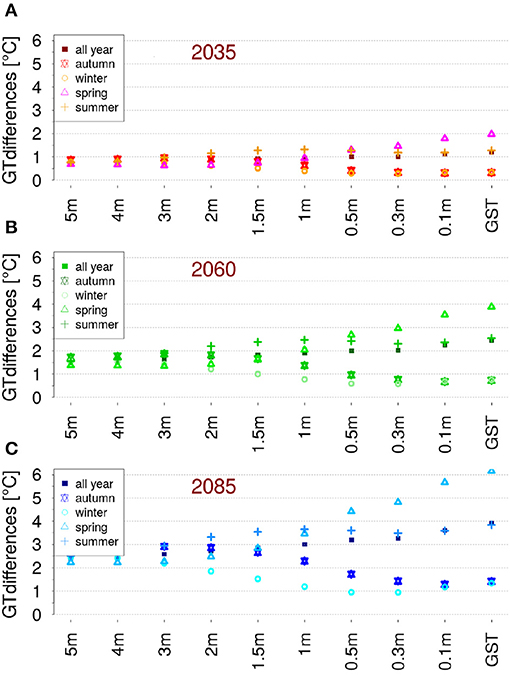
Figure 7. Mean increase of ground temperature (GT) for snow accumulation period [November–January, (Autumn, star)], snow covered time [February–April, (Winter, circle)], melt out [May–July, (Spring, triangle)], and snow free period [August–October, (summer, cross)], and all year (square) for different depths. Dots represent the mean values of all 16 stations. Differences for 2035 (A), 2060 (B) and 2085 (C).
3.3. Uncertainties
In this study, we have three main error sources: the model itself, the precipitation input and the climate change signal. All delta change values, used for future climate change modeling,from the CH2011 have an error of c. 1 °C (CH2011, 2011) however since we take the mean of 10 different climate change models over a long period, this has little influence on the results. Winter precipitation values are reconstructed well, at least for the mean values. A single event might be missed or overestimated. As the influence of single (rain on snow) event on total winter snow height is negligible, the results are reasonable. Summer precipitation reconstruction is connected with larger error, at least, compared to IMIS station rainfall measurements. As those are unheated and unprotected, the reconstructed precipitation values are more trustworthy than the IMIS measurements, which are used for comparison. As we use the same input for all modeling periods, even if total numbers might include some errors, predicted changes for the future appear to be robust. No sensitivity test for the SNOWPACK model has been performed in this study, because SNOWPACK has already been widely used for climate change studies and numerous sensitivity studies, have been conducted in this context (Lehning et al., 2002a; Wever et al., 2014b; Richter et al., 2018). Schmucki et al. (2014) showed that the choice of incoming longwave parametrization does not influence snow height results, but SNOWPACK is sensitive to precipitation input. Correction of precipitation undercatch, as we did in this study, does improve SNOWPACK results significantly.
Calculating mean snow height reveals a small negative bias of modeled snow height, however as discussed above, this does not have an influence on ground temperature. Calculation errors and the early onset of melt out period, leads to differences between modeled and measured snow height between 3 and 10%. We were able to show, that this only has minor effects on ground temperature. These systematic errors also influence climate change model results, but in the same way as they do for the reference period. So the calculated changes toward the end of the century are unaffected in a relative sense. The annual cycle of the snow cover, could be represented well and changes in the snow cycle are reasonable for all stations.
Estimating the errors of ground temperature modeling is challenging, as there were few measurements that could be used for comparison. The yearly cycle of ground temperature reproduces the expected pattern. For Weissfluhjoch and Naluns, absolute errors for the mean annual ground temperature are between 1 and 3 °C. These errors appear fairly high, but as we use the same methods for reference period and climate change period, delta changes are still very reasonable. Using different model set ups shows that a good representation of summer temperature does have a greater influence on mean ground temperature, than small differences in snow height modeling (Figure 3). Our model set up does successfully achieve a good representation of summer temperature. The early beginning of melt out season only changes ground temperature by 0.1–0.3 °C, which is less then the calculated changes in temperature. The presented model is robust for mean yearly temperature and changes, as well as changes in seasonal pattern, but has some weaknesses in modeling single events. In Supplementary Material 2 we present further results from a fully transient run (2004–2100). The comparison with our single time period (12 years) simulations for future soil climate shows that the latter appears to be sufficient.
4. Conclusion
In this study, we modeled the interaction of snow height and ground temperature at 16 high alpine stations at climatically distinct regions in the Swiss Alps. Applying delta change signals from the CH2011 climate change scenarios, showed a decrease of snow height and a shortening of snow season to the end of the century for all stations. Decrease in mean snow height by the end of the century was found to be 35 % at low elevation stations, 32 % at alpine stations, and 35 % at high alpine sites in the Valais and 20 % in Grisons. Changes in date of snow-cover melt-out are greater than for the onset date. The magnitude of the snow season contraction and the decrease of mean snow height depends on the station and shows considerable variability depending upon elevation and climate zone.
Ground temperature are predicted to increase for all stations, at all depths for all future periods. For most stations warming at the surface is greater than in deeper soils and ranges between a mean increase of 0.6 and 2.3 °C by 2035 and 2.9 to 6.8 °C by 2085 at the surface and 0.3 and 1.8 °C by 2035 and 1.6 and 4.4 °C by 2085 at depth of 5 m. Cooling effects are only seen for some years at some stations, generally when a thin snow cover exists in early winter. However, these cooling effects are insignificant compared to summer warming and inter annual variability, which dominates the signal. Increase in mean summer is larger than in mean winter ground temperature and mean annual ground temperature on the surface is seen to increase more strongly than at depth. The absolute values of ground temperature increase depend on the station. A strong coupling of changes in temperature to changes in snow cycle is shown.
Modeling of ground temperature is still challenging. Comparison to few existing measurements show that the annual cycle of ground temperature is reproduced well, but differences in absolute values can be quite large. Ground temperature is very sensitive to snow height modeling and availability of measured radiation fields to drive the model (such as incoming shortwave at Weissfluhjoch) helps to significantly improve ground temperature modeling.
Modeling of climate change impacts involves large uncertainties and errors. The biggest error occurs due to modeling errors because snow height and ground temperature can not be exactly reproduced for the reference period. Additionally, delta change signals for the climate change periods involve errors. The reference period and the climate change periods are modeled using the same approach, therefore while absolute values of future ground temperature and snow height might be uncertain, relative changes in a modeled future as compared to the references period are noteworthy.
We presented a method to construct a complete year-round precipitation data set of high quality for our high-alpine sites, which have snow depth measurements but no reliable direct precipitation sensors. The method consists of calculating precipitation based on snow depth changes and modeling the settling with SNOWPACK (Lehning et al., 1999) for snow falls and interpolating rain from neighboring stations, which have reliable sensors. The data set for 16 stations between 1,630 and 2,850 m a.s.l. is available for further analysis.
Data Availability Statement
The datasets generated for this study are published on the WSL data platform EnviDat with the doi: 10.16904/envidat.144.
Author Contributions
EB led the analysis and prepared the manuscript. JF assisted with analysis and text. ML devised the study and assisted with analysis and text.
Funding
The project has been supported by the Swiss National Science Foundation (SNF grant 200020_179130).
Conflict of Interest
The authors declare that the research was conducted in the absence of any commercial or financial relationships that could be construed as a potential conflict of interest.
The handling editor declared a past co-authorship with one of the authors ML.
Acknowledgments
Mathias Bavay, Charles Fierz, Nander Wever, and Christoph Marty are thanked for help with simulations and data preparation. The CH2011 data were obtained from the Center for Climate Systems Modeling (C2SM).
Supplementary Material
The Supplementary Material for this article can be found online at: https://www.frontiersin.org/articles/10.3389/feart.2020.00100/full#supplementary-material
References
Bartelt, P., and Lehning, M. (2002). A physical SNOWPACK model for swiss avalanche warning Part I : numerical model. Cold Regions Sci. Technol. 35, 123–145. doi: 10.1016/S0165-232X(02)00074-5
Bartlett, M. G., Chapman, D. S., and Harris, R. N. (2004). Snow and the ground temperature record of climate change. J. Geophys. Res. 109. doi: 10.1029/2004JF000224
Bavay, M., Egger, T., Fierz, C., and Lehning, M. (2012). “MeteoIO: a pre-processing library for numerical models,” in Proceedings of the EGU General Assembly Conference Abstracts (Vienna).
Bernstein, L., Bosch, P., Canziani, O., Chen, Z., Christ, R., and Riahi, K. (2008). IPCC, 2007: Climate Change 2007: Synthesis Report. IPCC.
Bosshard, T., Kotlarski, S., Ewen, T., and Schär, C. (2011). Spectral representation of the annual cycle in the climate change signal. Hydrol. Earth Syst. Sci. 15, 2777–2788. doi: 10.5194/hess-15-2777-2011
Ceppi, P., Scherrer, S. C., Fischer, A. M., and Appenzeller, C. (2012). Revisiting Swiss temperature trends 1959–2008. Int. J. Climatol. 32, 203–213. doi: 10.1002/joc.2260
CH2011 (2011). CH2011, (2011), Swiss Climate Change Scenarios CH2011. CH2011 by C2SM, MeteoSwiss, ETH, NCCR Climate, and OcCC (Zurich).
Crawford, T. M., and Duchon, C. E. (1999). An improved parameterization for estimating effective atmospheric emissivity for use in calculating daytime downwelling longwave radiation. J. Appl. Meteorol. 38, 474–480. doi: 10.1175/1520-0450(1999)038<0474:AIPFEE>2.0.CO;2
Delarue, F., Buttler, A., Bragazza, L., Grasset, L., Jassey, V., Gogo, S., et al. (2015). Experimental warming differentially affects microbial structure and activity in two contrasted moisture sites in a sphagnum-dominated peatland. Sci. Tot. Environ. 511, 576–583. doi: 10.1016/j.scitotenv.2014.12.095
Deline, P., Gruber, S., Delaloye, R., Fischer, L., Geertsema, M., Giardino, M., et al. (2015). “Chapter 15 - Ice loss and slope stability in high-mountain regions,” in Snow and Ice-Related Hazards, Risks and Disasters, eds J. F. Shroder, W. Haeberli, and C. Whiteman (Boston, MA: Academic Press), 521–561.
Derksen, C., and Brown, R. (2012). Spring snow cover extent reductions in the 2008–2012 period exceeding climate model projections. Geophys. Res. Lett. 39. doi: 10.1029/2012GL053387
Dilley, A., and O'Brien, D. (1998). Estimating downward clear sky long-wave irradiance at the surface from screen temperature and precipitable water. Q. J. R. Meteorol. Soc. 124, 1391–1401. doi: 10.1002/qj.49712454903
Federal Statistical Office, S. (1979). Hintergrunddaten Arealstatistik and Vereinfachte Bodennutzung. Abteilung Raum und Umwelt Sektion Geoinformation 2.
Gerber, F., Lehning, M., Hoch, S., and Mott, R. (2017). A close-ridge small-scale atmospheric flow field and its influence on snow accumulation. J. Geophys. Res. 122, 7737–7754. doi: 10.1002/2016JD026258
Gobiet, A., Kotlarski, S., Beniston, M., Heinrich, G., Rajczak, J., and Stoffel, M. (2014). 21st century climate change in the European Alps–a review. Sci. Tot. Environ. 493, 1138–1151. doi: 10.1016/j.scitotenv.2013.07.050
Goodrich, L. E. (1982). Influence of snow cover on the ground thermal regime. Can. Geotech. J. 19, 421–432.
Gruber, S., Hoelzle, M., and Haeberli, W. (2004). Permafrost thaw and destabilization of Alpine rock walls in the hot summer of 2003. Geophys. Res. Lett. 31.
Gubler, S., Endrizzi, S., Gruber, S., and Purves, R. S. (2013). Sensitivities and uncertainties of modeled ground temperatures in mountain environments. Geosci. Model Dev. 6, 1319–1336. doi: 10.5194/gmd-6-1319-2013
Gubler, S., Fiddes, J., Keller, M., and Gruber, S. (2011). Scale-dependent measurement and analysis of ground surface temperature variability in alpine terrain. Cryosphere 5, 431–443. doi: 10.5194/tc-5-431-2011
Haberkorn, A., Phillips, M., Kenner, R., Rhyner, H., Bavay, M., Galos, S. P., et al. (2015). Thermal regime of rock and its relation to snow cover in steep alpine rock walls: gemsstock, central swiss alps. Geogr. Ann. Ser. A Phys. Geogr. 97, 579–597. doi: 10.1111/geoa.12101
Haeberli, W. (1973). Die Basis- Temperatur der Winterlichen Schneedecke als Möglicher Indikator für die Verbreitung von Permafrost in den Alpen. Zeitschrift für Gletscherkunde und Glazialgeologie.
Haeberli, W. (1975). Untersuchungen zur Verbreitung von Permafrost. Mitteilung der Versuchsanstalt fuer Wasserbau, Hydrologie und Glaziologie and der ETH Zuerich.
Haeberli, W., and Gruber, S. (2008). “Research challenges for permafrost in steep and cold terrain: an alpine perspective,” in Proceedings of the 9th International Conference on Permafrost (Fairbanks, AK), 597–605.
Haeberli, W., and Beniston, M. (1998). Climate change and its impacts on glaciers and permafrost in the alps. Ambio 27, 258–265.
Harris, C., Vonder Mühll, D., Isaksen, K., Haeberli, W., Sollid, J., King, L., et al. (2003). Warming permafrost in European mountains. Glob. Planet. Change 39, 215–225. doi: 10.1016/j.gloplacha.2003.04.001
Hay, L., Wilby, R., and Leavesley, G. (2000). A comparison of delta change and downscaled gcm scenarios for three mountainous basins in the united states. J. Am. Water Resour. Assoc. 36, 387–397. doi: 10.1111/j.1752-1688.2000.tb04276.x
Henry, H. A. L. (2008). Climate change and soil freezing dynamics: historical trends and projected changes. Clim. Change 87, 421–434. doi: 10.1007/s10584-007-9322-8
Holtslag, A., and De Bruin, H. (1988). Applied modeling of the nighttime surface energy balance over land. J. Appl. Meteorol. 27, 689–704. doi: 10.1175/1520-0450(1988)027<0689:AMOTNS>2.0.CO;2
Il Jeong, D., and Sushama, L. (2018). Rain-on-snow events over North America based on two Canadian regional climate models. Clim. Dyn. 50, 303–316. doi: 10.1007/s00382-017-3609-x
Isaksen, K., Ødegård, R. S., Etzelmüller, B., Hilbich, C., Hauck, C., Farbrot, H., et al. (2011). Degrading mountain permafrost in Southern Norway: spatial and temporal variability of mean ground temperatures, 1999-2009. Permaf. Perigl. Process. 22, 361–377. doi: 10.1002/ppp.728
Kaste, O., Austnes, K., Vestgarden, L. S., and Wright, R. (2008). Manipulation of snow in small headwater catchments at Storgama, Norway: effects on leaching of inorganic nitrogen. AMBIO J. Hum. Environ. 37, 29–37. doi: 10.1579/0044-7447(2008)37[29:MOSISH]2.0.CO;2
Krautblatter, M., Funk, D., and Günzel, F. K. (2013). Why permafrost rocks become unstable: a rock–ice-mechanical model in time and space. Earth Surf. Process. Landforms 38, 876–887. doi: 10.1002/esp.3374
Laternser, M., and Schneebeli, M. (2003). Long-term snow climate trends of the Swiss Alps (1931–99). Int. J. Climatol. 23, 733–750. doi: 10.1002/joc.912
Lehning, M., Bartelt, P., Brown, B., and Fierz, C. (2002a). A physical SNOWPACK model for the Swiss avalanche warning: part III: meteorological forcing, thin layer formation and evaluation. Cold Reg. Sci. Technol. 35, 169–184. doi: 10.1016/S0165-232X(02)00072-1
Lehning, M., Bartelt, P., Brown, B., Fierz, C., and Satyawali, P. (2002b). A physical SNOWPACK model for the Swiss avalanche warning: part II: snow microstructure. Cold Reg. Sci. Technol. 35, 147–167. doi: 10.1016/S0165-232X(02)00073-3
Lehning, M., Bartelt, P., Brown, B., Russi, T., Stöckli, U., and Zimmerli, M. (1999). Snowpack model calculations for avalanche warning based upon a new network of weather and snow stations. Cold Reg. Sci. Technol. 30, 145–157. doi: 10.1016/S0165-232X(99)00022-1
Ling, F., and Zhang, T. (2003). Impact of the timing and duration of seasonal snow cover on the active layer and permafrost in the Alaskan Arctic. Permafrost Periglac. Process. 14, 141–150. doi: 10.1002/ppp.445
López-Moreno, J. (2005). Recent variations of snowpack depth in the Central Spanish Pyrenees. Arct. Antarct. Alp. Res. 37, 253–260. doi: 10.1657/1523-0430(2005)037[0253:RVOSDI]2.0.CO;2
López-Moreno, J., Goyette, S., Beniston, M., and Alvera, B. (2008). Sensitivity of the snow energy balance to climatic changes: prediction of snowpack in the Pyrenees in the 21st Century. Clim. Res. 36, 203–217. doi: 10.3354/cr00747
Luetschg, M., Bartelt, P., Lehning, M., Stoeckli, V., and Haeberli, W. (2003). “Numerical simulation of the interaction processes between snow cover and alpine permafrost,” in 8th International Conference on Permafrost Proceedings (Lisse; Zürich: Swets & Zeitlinger), 697–702.
Luetschg, M., and Haeberli, W. (2005). Permafrost evolution in the Swiss Alps in a changing climate and the role of the snow cover. Norweg. J. Geogr. 59, 78–83. doi: 10.1080/00291950510020583
Luetschg, M., Lehning, M., and Haeberli, W. (2008). A sensitivy study of factors influencing warm/thin permafrost in the Swiss Alps. J. Glaciol. 54, 696–704. doi: 10.3189/002214308786570881
Marty, C., and Klein, G. (2015). “An automatic algorithm for validating snow depth measurements of IMIS stations,” in Swiss Geoscience Meeting (Basel).
Mellander, P., Löfvenius, M. O., and Laudon, H. (2007). Climate change impact on snow and soil temperature in boreal Scots pine stands. Clim. Change 85, 179–193. doi: 10.1007/s10584-007-9254-3
National Centre for Climate Services, Z. CH2018 (2018), CH2018 - Climate Scenarios for Switzerland, Technical Report. National Centre for Climate Services.
Noetzli, J., Gruber, S., Kohl, T., Salzmann, N., and Haeberli, W. (2007). Three-dimensional distribution and evolution of permafrost temperatures in idealized high-mountain topography. J. Geophys. Res. 112. doi: 10.1029/2006JF000545
Phillips, M., Wolter, A., Lüthi, R., Amann, F., Kenner, R., and Bühler, Y. (2017). Rock slope failure in a recently deglaciated permafrost rock wall at Piz Kesch Eastern Swiss Alps), February 2014. Earth Surf. Process. Landf. 42, 426–438. doi: 10.1002/esp.3992
Ravanel, L., and Deline, P. (2011). Climate influence on rockfalls in high-alpine steep rockwalls: the north side of the Aiguilles de Chamonix (Mont Blanc massif) since the end of the ‘Little Ice Age'. Holocene 21, 357–365. doi: 10.1177/0959683610374887
Ravanel, L., Magnin, F., and Deline, P. (2017). Impacts of the 2003 and 2015 summer heatwaves on permafrost-affected rock-walls in the Mont Blanc massif. Sci. Tot. Environ. 609, 132–143. doi: 10.1016/j.scitotenv.2017.07.055
Richter, B., van Herwijnen, A., Rotach, M., and Schweizer, J. (2018). “Sensitivity of modeled snow instability to meteorological input uncertainty,” in International Snow Science Workshop Proceedings (Insbruck), 1186–1190.
Schaap, M., Leij, F., and Van Genuchten, M. (2001). ROSETTA: A computer program for estimating soil hydraulic parameters with hierarchical pedotransfer functions. J. Hydrol. 251, 163–176. doi: 10.1016/S0022-1694(01)00466-8
Schlögl, S., Lehning, M., Nishimura, K., Huwald, H., Cullen, N. J., and Mott, R. (2017). How do stability corrections perform in the stable boundary layer over snow?. Boundary-Layer Meteorol. 165, 161–180. doi: 10.1007/s10546-017-0262-1
Schmucki, E., Marty, C., Fierz, C., and Lehning, M. (2014). Evaluation of modelled snow depth and snow water equivalent at three contrasting sites in Switzerland using SNOWPACK simulations driven by different meteorological data input. Cold Reg. Sci. Technol. 99, 27–37. doi: 10.1016/j.coldregions.2013.12.004
Schmucki, E., Marty, C., Fierz, C., and Lehning, M. (2015). Simulations of 21st century snow response to climate change in Switzerland from a set of RCMs. Int. J. Climatol. 35, 3262–3273. doi: 10.1002/joc.4205
Stoffel, M., Schneuwly, D., Bollschweiler, M., Lièvre, I., Delaloye, R., Myint, M., et al. (2005). Analyzing rockfall activity (1600–2002) in a protection forest—A case study using dendrogeomorphology. Geomorphology 68, 224–241. doi: 10.1016/j.geomorph.2004.11.017
Wendler, G., and Kelley, J. (1988). On the albedo of snow in Antarctica: a contribution to IAGO. J. Glaciol. 34, 19–25. doi: 10.1017/S0022143000009011
Wever, N., Comola, F., Bavay, M., and Lehning, M. (2017). Simulating the influence of snow surface processes on soil moisture dynamics and streamflow generation in an alpine catchment. Hydrol. Earth Sys. Sci. 21, S. 4053–4071.
Wever, N., Fierz, C., Mitterer, C., Hirashima, H., and Lehning, M. (2014a). Solving Richards Equation for snow improves snowpack meltwater runoff estimations in detailed multi-layer snowpack model. Cryosphere 8, 257–274. doi: 10.5194/tc-8-257-2014
Wever, N., Jonas, T., Fiertz, C., and Lehning, M. (2014b). Model simulations of the modulating effect of the snow cover in a rain-on-snow event. Hydrol. Earth Syst. Sci. 18, 4657–4669. doi: 10.5194/hess-18-4657-2014
Wever, N., Schmid, L., Heilig, A., Eisen, O., Fierz, C., and Lehning, M. (2015). Verification of the multi-layer snowpack model with different water transport schemes. Cryosphere 9, 2271–2293. doi: 10.5194/tc-9-2271-2015
Zhang, T. (2005). Influence of the seasonal snow cover on the ground thermal regime: an overview. Rev. Geophys. 43. doi: 10.1029/2004RG000157
Zhang, T., Osterkamp, T., and Stamnes, K. (1997). Effects of climate on the active layer and permafrost on the North Slope of Alaska, USA. Permafrost Periglac. Process. 8, 45–67. doi: 10.1002/(SICI)1099-1530(199701)8:1<45::AID-PPP240>3.0.CO;2-K
Keywords: climate change, snow cover, ground temperature, Switzerland, modeling, local development
Citation: Bender E, Lehning M and Fiddes J (2020) Changes in Climatology, Snow Cover, and Ground Temperatures at High Alpine Locations. Front. Earth Sci. 8:100. doi: 10.3389/feart.2020.00100
Received: 09 May 2019; Accepted: 20 March 2020;
Published: 12 May 2020.
Edited by:
Matthias Huss, ETH Zürich, SwitzerlandReviewed by:
Ward van Pelt, Uppsala University, SwedenNinglian Wang, Chinese Academy of Sciences, China
Copyright © 2020 Bender, Lehning and Fiddes. This is an open-access article distributed under the terms of the Creative Commons Attribution License (CC BY). The use, distribution or reproduction in other forums is permitted, provided the original author(s) and the copyright owner(s) are credited and that the original publication in this journal is cited, in accordance with accepted academic practice. No use, distribution or reproduction is permitted which does not comply with these terms.
*Correspondence: Esther Bender, baender@gmx.net