Melting Himalayan Glaciers Threaten Domestic Water Resources in the Mount Everest Region, Nepal
 Leah R. Wood1*
  Klaus Neumann2
  Kirsten N. Nicholson2
  Broxton W. Bird1
  Carolyn B. Dowling2
  Subodh Sharma3
- 1Department of Earth Sciences, Indiana University-Purdue University Indianapolis, Indianapolis, IN, United States
- 2Department of Environment, Geology, and Natural Resources, Ball State University, Muncie, IN, United States
- 3Department of Environmental Science and Engineering, Kathmandu University, Kathmandu, Nepal
Retreating glaciers and snowpack loss threaten high-altitude communities that rely upon seasonal melt for domestic water resources. But the extent to which such communities are vulnerable is not yet understood, largely because melt contribution to water supplies is rarely quantified at the catchment scale. The Khumbu Valley, Nepal is a highly glaciated catchment with elevations ranging from 2,000 to 8,848 m above sea level, where more than 80% of annual precipitation falls during the summer monsoon from June to September. Samples were collected from the rivers, tributaries, springs, and taps along the major trekking route between Lukla and Everest Base Camp in the pre-monsoon seasons of 2016–2017. Sources were chosen based upon their use by the communities for drinking, cooking, bathing, and washing, so the sample suite is representative of the local domestic water supply. In addition, meltwater samples were collected directly from the base of the Khumbu Glacier, and several rain samples were collected throughout the study site. Meltwater contribution was estimated from δ18O isotopic data using a two-component mixing model with the Khumbu glacial melt and pre-monsoon rain as endmembers. Results indicate between 34 and 90% of water comes from melt during the dry, pre-monsoon season, with an average meltwater contribution of 65%. With as much as two-thirds of the dry-season domestic water supply at risk, the communities of the Khumbu Valley are extremely vulnerable to the effects of climate change as glaciers retreat and snowpack declines.
Introduction
High-elevation communities are some of the most susceptible to the effects of climate change (Salerno et al., 2008), and a recent report concluded that even if global warming is kept below 1.5°C, a third of the glaciers in the Hindu Kush-Himalayan region and more than half of those in the eastern Himalaya will likely be lost by the end of this century (Bolch et al., 2019). Yet significant questions remain regarding the contribution of melt from glaciers and snow to water resources in mountain regions (Immerzeel et al., 2010; Bocchiola et al., 2011). Answering them requires catchment-scale study in order to quantify the role of meltwater and gauge the vulnerability of these communities to the effects of climate change (La Frenierre and Mark, 2014).
The sensitivity and vulnerability of high-altitude regions to the effects of a shifting climate make them ideal long-term sites for monitoring climate change (Salerno et al., 2008). The Hindu Kush-Himalayan Region and Tibetan Plateau are often referred to as the Earth's “Third Pole” (e.g., Yao et al., 2012) as they contain the greatest number of glaciers outside of polar regions. They are also referred to as the “Water Tower of Asia” (e.g., Viviroli et al., 2007), because they are the headwaters for some of the continent's largest rivers, including the Indus, Ganges, Brahmaputra, Yangtze, and Yellow rivers.
Previous related studies from the Himalaya have primarily focused on river discharge, rather than specifically sampling water sources that are used for domestic purposes including drinking, cooking, bathing, cleaning, laundry, and other daily necessities by local communities (e.g., Balestrini et al., 2014; Wilson et al., 2016); or they have estimated meltwater contributions at large, basin scales (e.g., Immerzeel et al., 2010). Analysis of surface waters by Balestrini et al. (2014) in the upper Khumbu Valley revealed relatively low ionic concentrations and indicated that surface water composition did not entirely reflect precipitation composition. This suggests that another source, or sources, made significant contributions to the local water resources. Despite the modest contribution of meltwater to total Ganges River Basin discharge, high-altitude communities may rely much more heavily on seasonal melting, and annual recharge of glaciers, snow, and ice since regional precipitation decreases with increasing altitude (Asahi, 2010). Similar work in the Langtang Basin, a comparable catchment c. 100 km west of the Khumbu Valley, concluded that meltwater dominated the hydrograph outside of the monsoon season (Wilson et al., 2016).
Likewise, our research concludes that in the Khumbu Valley, Nepal, up to two-thirds of water comes from glacial and snow melt during the dry season. This indicates that communities there are especially vulnerable to the retreat and eventual disappearance of glaciers and permanent snow fields in response to continued warming trends. By developing a baseline of the hydrologic cycle for the Khumbu Valley, this study benefits future monitoring of these critical water resources and provides a snapshot of pre-monsoon domestic water resources in the Khumbu Valley against which the effects of climate change can be observed. Predicting climate-driven changes before they occur, and quantifying how the contribution of meltwater to domestic water resources will change will allow the high-altitude Nepali communities to be better prepared. In addition, the approach implemented in this project may be applied to other high-altitude environments where snow and glaciers contribute to valuable water resources.
Materials and Methods
Site Background
The Khumbu Valley is located in the upper catchment of the Dudh Kosi river basin, in the Sagarmatha National Park, and Buffer Zone (SNPBZ) of northeastern Nepal, ~140 km northeast of the capital city of Kathmandu (Figure 1). The park was established in 1976 (Panzeri et al., 2013), and it was designated a World Heritage Site in 1979 due to its unique geological, ecological, cultural, and aesthetic value. In 2002, a 275 km2 Buffer Zone was added on the southern border of the 1,148 km2 park to further protect the region (UNESCO [United Nations Educational Scientific and Cultural Organization], 2009). The Dudh Kosi river drains the Mt. Everest Massif to the south, which makes it the highest-elevation river system in the world, along with the Yarlung Tsangpo river in Tibet, which drains the Mt. Everest Massif to the north. The Dudh Kosi river begins near the Gokyo lakes in the western portion of the study area, flows southward past Namche Bazar, and then west of Lukla and out of the study area. The Imja Khola and Lobuche rivers originate at the glaciers of the eastern portion of the study site, including the Khumbu and Imja glaciers. They flow southward, joining the Dudh Kosi river below Phortse. The Dudh Kosi river is one of the seven tributaries of the Sapta Koshi river, which is part of the greater Ganges river system (Xiang et al., 2018). Elevations within the study area ranges from c. 2,000 m where the Dudh Kosi River flows southward out of the Buffer Zone just southwest of Lukla to 8,848 m above sea level (asl) at the summit of Mt. Everest on the northern border of the park.
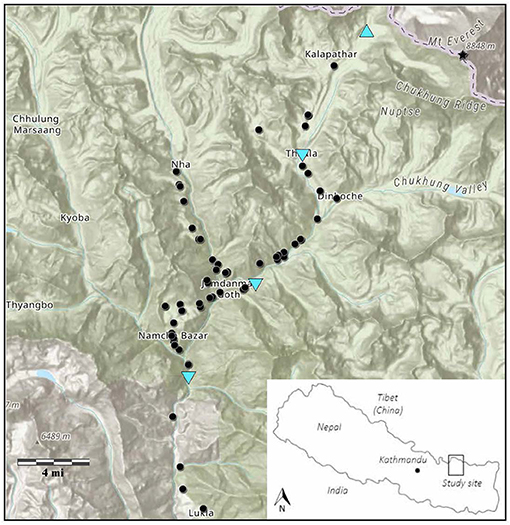
Figure 1. Map of Khumbu Valley; point-up triangle represents glacial melt sample; point-down triangles represent rain samples; circles represent all other sampling locations; inset map shows location of study area within Nepal.
The climate of the Khumbu Valley is temperate, characterized by strong seasonality with dry, cold winters and warm, wet summers (Nicholson et al., 2016). Due to its location within the Subtropical Asian Monsoon zone, more than 80% of annual precipitation to the region falls between the months of June and September (Mani, 1981; Barry and Chorley, 1982; Byers, 2005; Salerno et al., 2008). This precipitation is delivered via the South Asian Monsoon System, which carries warm, moist air out of the south, or southwest from the Bay of Bengal across the Indian Subcontinent and as far north as the Tibetan Plateau (Müller, 1980; Salerno et al., 2015).
Regional vegetation varies with altitude. The majority of samples were collected below the local tree line at c. 4,000 m asl. The landscape here is dominated by lush rhododendron forests punctuated by small, terraced, subsistence agricultural fields. Above the tree line, much of the ground is bare, and juniper and other hardy shrubs replace rhododendrons. From c. 5,500–6,000 m asl, only low-growing mats of cushion plants thrive. The nival zone above c. 6,000 m asl is glaciated or snow-covered for much of the year and vegetation is extremely limited. Local fauna includes the snow leopard, musk deer, and red panda, all of which are either endangered or threatened species (Van Geldern and Barth, 2012; Balestrini et al., 2014).
Despite concerns since the 1970s regarding the tourism-related pollution increase in the region, the first systematic study of drinking water quality in the Khumbu Valley was not undertaken until 2014. In that year, Nicholson et al. (2016) sampled community water sources with a focus on fecal contamination of drinking water. The study concluded that there were higher counts of E. coli and other coliform bacteria associated with fecal contamination in samples collected from lower elevation, higher population areas, and that surface water was more highly contaminated than groundwater-fed springs. Accurate census data for the region are scarce; however, recent estimates place the population of the Khumbu Valley between 3,500 and 6,000 people (e.g., Byers, 2005; UNESCO [United Nations Educational Scientific and Cultural Organization], 2009; Nicholson et al., 2016).
The Khumbu Valley, and the SNPBZ in general, is considered a data-poor region. The paucity of research is largely due to the location's geographic remoteness and ruggedness; historically, it has been difficult and expensive to access (Salerno et al., 2013). Increasing tourism over the past few decades has boosted the local economy and infrastructure, making access to the region for scientific endeavors more feasible, and there has been a marked increase in published research of the region since the turn of the century, and this study represents the first to attempt to evaluate local vulnerability to climate change with respect to domestic water resources.
Objectives
The objectives of this study were to: (1) collect a suite of samples representing community domestic water supplies in the Khumbu Valley as well as the sources that contribute to them, (2) to analyze the samples for δ18O and δ2H isotope values, and (3) to identify source endmembers and estimate the overall contribution of melt from glaciers, snow, and ice (hereafter “meltwater” or “melt”) vs. precipitation using a two-component mixing equation. The results have been used to evaluate the vulnerability of community domestic water resources in the Khumbu Valley to the observed and anticipated effects of climate change.
Methods
Two field campaigns were conducted: the first in spring 2016, when samples were collected between April 21 and May 06; and the second in spring 2017, when samples were collected between April 21 and May 05. These campaigns took place during the dry, pre-monsoon season. Sampling was carried out within the Khumbu Valley along the main Everest Base Camp Trekking Route between the town of Lukla and Everest Base Camp. Sampling locations included large rivers, small streams, natural springs, numerous community standpipes, and several indoor taps Locations were selected to reflect community drinking water sources—primarily standpipes and taps—as well as the waterways that supply them—rivers, tributaries, and springs. Collectively, the samples represent the water used for drinking by local residents and tourists alike. In addition, a glacial melt sample was taken directly from the terminus of the Khumbu Glacier in 2016, and precipitation samples were collected on April 22, April 28, and May 1, 2017 (Figure 1).
Samples for ion analysis were collected with a syringe, then passed through a 0.45-μm filter into pre-washed 60 or 125-mL high-density polyethylene bottles with screw-on polypropylene caps. Bottles were then sealed with paraffin sealing film. Samples for isotope analysis were collected, unfiltered, by syringe, or directly from the water source in 2-mL glass vials with plastic screw-on caps with no visible bubbles or headspace, then sealed with paraffin sealing film.
Temperature, pH, conductivity, and total dissolved solids (TDS) were measured in the field via Fisher Scientific Accumet AP85 portable waterproof meter. When possible, the instrument probes were inserted directly in the uncollected water for measurements. In case of insufficient flow—at standpipes and taps, for example—it was necessary to collect whole water in a plastic 1-L bottle into which the probes were inserted.
Ion Analysis
Analysis for cations (Ca2+, K+, Li+, Mg2+, Na+, and NH4+) was conducted at Ball State University via ion chromatography (IC) using a Dionex ICS-2000 with a Dionex AS40 Automated Sampler and processed through Chromeleon Chromatography Data System software. Analysis for anions (Cl−, NO3−, and SO42−) was conducted at Ball State University via IC using a Dionex ICS-5000+ with a Dionex EGC for potassium hydroxide eluent generation, a Dionex IonPac AS15 analytical column, and an Anion Self-Regenerating Suppressor 300. HCO3− concentrations were calculated at Ball State University using AquaChem groundwater software. All measured and calculated ion concentrations are reported in μEq/L.
Isotope Analysis
δ18O and δ2H isotopes were measured directly from water vapor using infrared spectroscopy (Kerstel et al., 1999; Kerstel and Gianfrani, 2008) at Indiana University Purdue University Indianapolis using a Picarro L2130-i Cavity Ringdown Spectrometer according to the methods described by Van Geldern and Barth (2012).
Isotope values are reported in standard delta notation (δ) in per mille units (‰), comparing heavy-to-light isotope ratios in the sample with the reference, Vienna Standard Mean Ocean Water (VSMOW). The following equations are used:
The VSMOW abundance ratio for 2H/1H is 1.5575 × 10⁻⁴ and 2.0052 × 10⁻³ for 18O/16O (Clark, 2015). The global meteoric water line (GMWL), defined by Craig (1961) is a linear equation expressing the global average linear relationship between δ18O and δ2H ratios in terrestrial waters:
where 8 is the slope of the line and 10‰ is the deuterium intercept, or value of δ2H at δ18O = 0. A local meteoric water line (LMWL) can be defined by the same equation for a set of samples according to δ18O and δ2H values, slope, and deuterium intercept. The intercept of any given sample, termed deuterium excess by Dansgaard (1964), is calculated according to the following equation:
For the purposes of this study, deuterium excess is calculated using Dansgaard's equation, and all LMWLs are compared to the GMWL observed by Craig (1961).
Estimating Meltwater Contribution
Meltwater contribution estimates were calculated using the following two-component mixing equation:
where xm is the contribution of meltwater to the sample in percent, cs is the δ18O value of the sample, cp is the δ18O value of the precipitation endmember, and cm is the δ18O value of the melt endmember (Mark and Seltzer, 2003).
Results and Discussion
Water Chemistry
Ion analysis revealed domestic water resources in the study site were primarily of the calcium-bicarbonate water-type. HCO3− was the most abundant ion overall, with an average concentration of 234.12 μEq/L. SO42− exceeds as the dominant anion in only six samples. The average SO42− concentration is 84.56 μEq/L. Ca2+ is the dominant cation in the majority of samples, with an average concentration of 207.41 μEq/L. Na+ is the second-most abundant cation, with an average concentration of 71.69 μEq/L. Overall, the following trends are observed regarding concentrations of cations and anions, respectively: Ca2+ > Na+ > Mg2+ > K+ > NH4+ > Li+; HCO3− > SO42− > Cl−> NO3+ (Table 1).
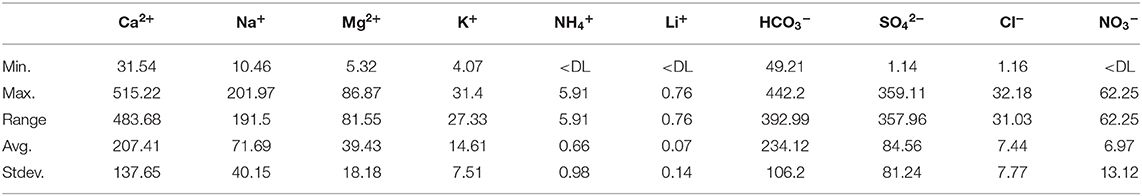
Table 1. Summary of results from ion analysis; all concentrations expressed in μEq/L; < DL indicates concentration was below instrument detection limit.
All samples were undersaturated with respect to any mineral. Ionic strength ranged from 0.14 to 0.91 mM/L with an average of 0.50 mM/L. Considering the abundant feldspar minerals in the lithology of the study site, the relatively low concentrations of Ca2+, Na+, and K+ may be indicative of a short groundwater residence time and little water-rock interaction (Ako et al., 2011; Nganje et al., 2017). And although the dissolution-resistant local metamorphic bedrock would not be expected to drastically increase ionic strength even given substantial groundwater residence time, samples collected from springs were chemically indistinguishable from other surface water samples. These observations collectively suggest there may be relatively little water-rock interaction within the region.
Local Meteoric Water Lines
All collected waters plot close to the Global Meteoric Water Line (GMWL; Figure 2), and the Local meteoric water line (LMWL) for 2017 is defined as follows:
The deuterium excess of 12.7‰ is slightly higher than for the GMWL (10‰), and is similar to the results of Balestrini et al. (2014) and Florea et al. (2017). This increase suggests a slightly greater kinetic component to primary evaporation than the global mean. This is consistent with the northward migration of the thermal equator with the Intertropical Convergence Zone (ITCZ) during the months of April and May (Kump et al., 2014). This is only a slight observed deviation from the deuterium excess of the GMWL, however, and it would be anticipated to be stronger during the warmer monsoon months, and weaker during the cooler winter months.
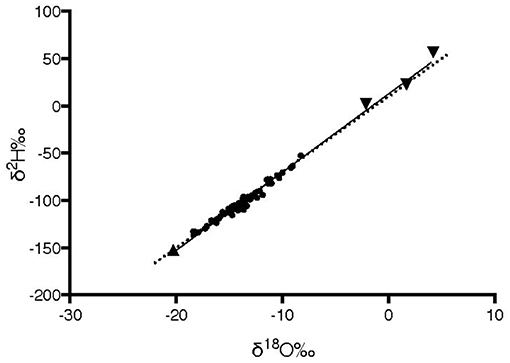
Figure 2. Local meteoric water line, represented by solid line, calculated from isotopic ratios of collected samples; LMWL is δ18O = 8.27 δ2H + 12.7‰; point-up triangle represents glacial melt sample; point-down triangles represent rain samples; circles represent all other sampling locations; global meteoric water line (δ18O = 8 δ2H + 10‰) is represented by dotted line.
In Figure 2, the sample that is most depleted in heavy oxygen and hydrogen isotopes compared with VSMOW has a δ18O value of −20.27‰ and a δ2H value of −152.46‰. This sample was collected directly from the base of the Khumbu Glacier at Everest Base Camp during the 2016 field campaign, and it serves as the melt endmember for the purposes of this study. The three precipitation samples collected during the 2017 campaign are the most enriched in the heavy isotopes with δ18O values of at least −2.09‰ and δ2H values of at least 2.19‰. Excluding the precipitation samples and meltwater endmember, all samples fell between a range of −8.25 to −18.39‰ for δ18O and −52.37 to −135.44‰ for δ2H. Within these samples, there was no clear trend based upon source. Specifically, there was no characteristic isotopic signature for samples sourced from springs vs. streams. Because of this, groundwater is not included as an endmember in this study. Considering the high topographic relief and dense metamorphic rocks of the study site, the lack of a groundwater signal from springs is not surprising. The water produced by springs is likely interflow with a short residence time below the surface. This is not to say that there is no groundwater in the region, but rather that deep groundwater does not seem to be a significant component in current domestic water resources.
Contribution of Meltwater
The estimated melt contribution to each sample was calculated based on isotopic composition using a two-component mixing equation with meltwater from the Khumbu Glacier and local precipitation as endmembers (Mark and Seltzer, 2003). The glacial melt sample was collected during the 2016 field campaign directly from the base of the Khumbu Glacier. The precipitation samples were collected during the 2017 field campaign from three separate rain events at a range of latitudes and altitudes. The most depleted of the precipitation samples is used as the precipitation endmember since it is known to be 100% rain. Using the other precipitation samples as endmembers or averaging them would skew the calculations so that the most depleted precipitation sample would appear to be <100% precipitation. If future work yields pre-monsoon-season rain samples more depleted than those in this study, the upper endmember would be further constrained, facilitating more accurate melt contribution estimates. Likewise, more enriched meltwater samples would constrain the lower endmember and alter melt contribution estimates. The use of rain samples from the pre-monsoon season assumes that only recent rain contributes to the rain component of samples. This is likely true as long as the residence time for surface water in the catchment is short. The majority of annual rainfall to the catchment occurs during the summer monsoon and is much more depleted in δ18O than pre-monsoon rain. But this water likely moves through the catchment very quickly, and therefore doesn't significantly contribute to pre-monsoon-season samples. Future work should focus on collecting additional rain and melt samples to improve endmember data quality as well as verifying or disproving the assumption that only pre-monsoon season rain contributes to the pre-monsoon season water supply.
Melt contribution estimates ranged from c. 34–90% (10–66% rain) with an average contribution of c. 65% (35% rain; Table S1). This far exceeds estimates that meltwater contributes c. 10% to the greater Ganges River Basin, the majority (c. 85%) of which area is located below 2,000 m asl, and is therefore supplied primarily by monsoonal precipitation rather than meltwater (Immerzeel et al., 2010). Figure 3 shows a strong positive relationship between altitude and meltwater contribution regardless of source. This relationship indicates that vulnerability to water scarcity from climate change increases with altitude.
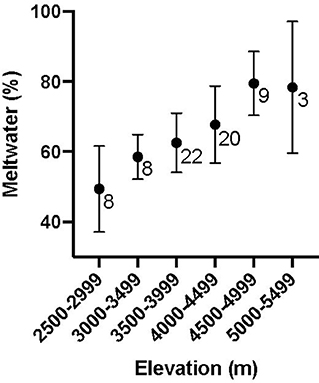
Figure 3. Comparison of the relationship between percent of meltwater contribution and elevation; for each elevation group, circle represents mean, bars represent one standard deviation, and number represents number of samples.
For the purposes of this study, there is no differentiation between melt from glaciers and that from other snow and ice. Because they are derived from the same vapor bodies, snowmelt from a mountain peak should isotopically match glacial melt from an adjacent valley, with any slight differences between them due to fractionation during melting. Analysis of fresh snow from the northeast face of Mt. Everest yielded isotopic values indistinguishable from those of Khumbu Glacier melt from this study (Kang et al., 2002). Furthermore, a study from the Eastern Himalaya determined glacial samples were isotopically similar to fresh snow samples from the same glacier (Nijampurkar and Bhandari, 1984). Likewise, a more recent study from the Bhutan Himalaya found that δ18O values for glacier ice, glacial outflow, and snow were all similar (Williams et al., 2016). Because glacial melt can only contribute to a sample if there is a glacier upslope of the sampling site, the contribution of melt from snow vs. glaciers can be rudimentarily evaluated by “looking uphill.” The region's glaciers are located primarily in valley bottoms at elevations higher than 4,500 m. As a general rule, melt contribution from samples collected downstream of these locations, such as river samples, can be assumed to have a significant glacial component. On the other hand, hillside springs and small streams do not generally have glaciers above them, so the melt component from those samples must be assumed to derive from snowmelt from the nival zone.
Implications for Climate Change Vulnerability
The SNPBZ is known for being the location of Mt. Everest. The Himalayas, containing the world's largest freshwater reserve outside of polar regions and known as Earth's “Third Pole” and the “Water Tower of Asia,” are particularly sensitive and vulnerable to climate change. The first study of glaciers in the region was conducted by Müller in 1956, just 3 years after the first successful ascent of Mt. Everest (Müller, 1959). In 2007, Bajracharya et al. (2011) mapped 3,808 glaciers across Nepal. They concluded that glaciers at elevations below 5,800 m above sea level are retreating, and in general, the number of individual glaciers in Nepal is increasing as larger ones break up. According to Salerno et al. (2008), there are c. 29 glaciers in the Sagarmatha National Park, which are primarily summer accumulation, debris-covered (D-type) “black glaciers.” The melting and retreat of these glaciers, which feed the Indus, Ganges, Brahmaputra, Yangtze, and Yellow Rivers, has the potential to impact over 1.4 billion people. Nearly half a billion live in the Ganges River Basin alone, where snow and glacial melt are estimated to contribute 10% of the basin's total discharge (Immerzeel et al., 2010).
Despite the significance of the Himalayan glaciers, catchment scale studies are almost non-existent. Previous studies from the Himalaya have primarily focused on river discharge (e.g., Balestrini et al., 2014; Wilson et al., 2016) and the large basin scale (e.g., Immerzeel et al., 2010). Yet, catchment-scale studies quantifying the role of melt are critical to assessing regional variability and vulnerability (La Frenierre and Mark, 2014). The results of this study, using geochemistry and δ18O and δ2H isotope analyses, indicate a reliance on meltwater to supply domestic drinking water sources in the Khumbu Valley. An average of 65% of the volume of domestic water resources in the Khumbu Valley during the dry, pre-monsoon season, can be attributed to meltwater contribution, with the remaining 35% coming from rain. The results are supported by work in the Langtang Valley where Wilson et al. (2016) conclude that meltwater dominates the hydrograph throughout most of the year, except during the monsoon season when precipitation dominates. The similarities between the Langtang Valley and the Khumbu Valley suggests that meltwater plays a significant role for the streams in the Khumbu region.
Given these results, along with the observation that Himalayan glaciers are rapidly receding (Bolch et al., 2019), high-altitude communities within the SNPBZ are likely to be particularly vulnerable to climate change and receding glaciers; extrapolating these results indicates that all high-altitude communities in the Himalaya may also be vulnerable. In addition, the low ionic strength of the samples in this study suggest little water-rock interaction, an indication that there is no long-term reservoir to buffer communities against even short-term shortages of water from precipitation or melt. In the long-term these results indicate that surface water availability during the pre-monsoon season will increase as rapid melting of alpine glaciers and snow contributes to streamflow in the short-term future, followed by eventual pre-monsoon water scarcity as the glaciers and permanent snow disappear. Because the samples used in this study were collected in 2016 and 2017, they reflect the relative contribution of meltwater and rain at that time. As global temperatures continue to rise (NOAA National Centers for Environmental Information, 2020), the meltwater contributions presented here can reasonably be considered minimum estimates, making these results even more important for local communities' efforts in resource management in the face of continued warming. The contribution of meltwater to community water supply in the Khumbu Valley and other high-altitude Himalayan catchments should continue to be monitored in order to refine and update meltwater estimates. Although not directly addressed in this study, future research may provide a detailed long-term timeline of Khumbu Valley domestic water supply through modeling of changing glacier, snow, and monsoon dynamics.
This study highlights the importance of understanding the high-altitude catchment basins, in order to predict the impact of climate change at both high and low altitudes in a river basin. Understanding climate-driven changes before they occur and quantifying the contribution of meltwater to domestic water resources will allow the high-altitude Nepali communities to be better prepared. These concepts may be applied to other high-altitude environments where snow and glaciers contribute to valuable water resources. In addition, the implications of this research can be used for long-term planning and climate hazard mitigation throughout the entire region.
Summary of Conclusions
(1) Domestic water resources in the Khumbu Valley are of low ionic strength and are primarily of the calcium-bicarbonate water- type, and less commonly, calcium-sulfate, sodium-bicarbonate, and sodium-sulfate.
(2) The LMWL calculated from 2016 to 2017 isotopic data is δ18O = 8.27 δ2H + 12.7‰. Long- term monitoring will yield a more accurate LMWL.
(3) A two-component mixing equation using meltwater from the Khumbu Glacier and local precipitation as endmembers reveals that meltwater contributes an average of 65% of the volume of domestic water resources in the Khumbu Valley during the dry, pre-monsoon season, and there is a strong positive correlation between altitude and meltwater contribution.
(4) It is likely that meltwater contribution to pre-monsoon domestic water resources in the Khumbu Valley will increase in the short-term future as glaciers, snow, and ice melt, and that water scarcity will follow when these sources have melted and are no longer recharged annually.
(5) Water resources in the Khumbu Valley should continue to be monitored in future years to further confirm or to update the findings of this study with the ultimate goal of making the communities of the Khumbu Valley and other high-altitude communities more resilient in the face of climate change.
Data Availability Statement
All datasets generated and analyzed for this study are included in the article/Supplementary Material or are available from the authors upon request, without undue reservation, to any qualified researcher.
Author Contributions
LW, KNe, KNi, BB, CD, and SS contributed conception and design of the study. LW organized the database. LW, KNe, and BB performed the statistical analysis. LW wrote the first draft of the manuscript. KNe and KNi wrote sections of the manuscript. All authors contributed to manuscript revision, read, and approved the submitted version.
Conflict of Interest
The authors declare that the research was conducted in the absence of any commercial or financial relationships that could be construed as a potential conflict of interest.
Acknowledgments
We would like to acknowledge Ball State University for financially supporting this research. We also thank the Nepal National Park Service, Kathmandu University, and Ang Nurbu Sherpa of Holiday Namche for making this work possible.
Supplementary Material
The Supplementary Material for this article can be found online at: https://www.frontiersin.org/articles/10.3389/feart.2020.00128/full#supplementary-material
References
Ako, A. A., Shimada, J., Hosono, T., Ichiyanagi, K., Nkeng, G. E., Fantong, W. Y., et al. (2011). Evaluation of groundwater quality and its suitability for drinking and agricultural uses in the banana plain (mbanqa, njombe, penja) of cameroon volcanic line. Environ. Geochem. Health 33, 559–575. doi: 10.1007/s10653-010-9371-1
Asahi, K. (2010). Equilibrium-line altitudes of the present and last glacial maximum in the eastern nepal himalayas and their implications for SW monsoon climate. Quat. Int. 212, 26–34. doi: 10.1016/j.quaint.2008.08.004
Bajracharya, S., Maharajan, S., and Shrestha, F. (2011). “Climate change – geophysical foundations and ecological effects,” ed Blanco, J. (InTech), 445–458. Available online at: http://www.intechopen.com/books/climate-change-~geophysical-foundations-and-ecological-effects/glaciers-shrinking-in-nepal-himalaya
Balestrini, R., Polesello, S., and Sacchi, E. (2014). Chemistry and isotopic composition of precipitation and surface waters in Khumbu valley (Nepal himalaya): N dynamics of high elevation basins. Sci. Tot. Environ. 485–486, 681–692. doi: 10.1016/j.scitotenv.2014.03.096
Barry, R. G., and Chorley, R. J. (1982). Atmosphere, Weather and Climate, 4th Edn. London; New York, NY: Methuen.
Bocchiola, D., Diolaiuti, G., Soncini, A., Mihalcea, C., D'Agata, C., Mayer, C., et al. (2011). Prediction of future hydrological regimes in poorly gauged high altitude basins: the case study of the upper Indus, Pakistan. Hydrol. Earth Syst. Sci. 15, 2059–2075. doi: 10.5194/hess-15-2059-2011
Bolch, T., Shea, J. M., Liu, S., Azam, F. M., Gao, Y., Gruber, S., et al. (2019). “Status and change of the Cryosphere in the extended Hindu Kush Himalaya region,” in The Hindu Kush Himalaya Assessment, eds P. Wester, A. Mishra, A. Mukherji, and A. Shrestha (Cham: Springer).
Byers, A. (2005). Contemporary human impacts on alpine ecosystems in the sagarmatha (Mt. Everest) national park, Khumbu, Nepal. Ann. Assoc. Am. Geograp. 95, 112–140. doi: 10.1111/j.1467-8306.2005.00452.x
Clark, I. (2015). Groundwater Geochemistry and Isotopes. Boca Raton, FL: CRC Press; Taylor & Francis Group.
Craig, H. (1961). Isotopic variation in meteoric waters. Science 133, 1702–1703. doi: 10.1126/science.133.3465.1702
Dansgaard, W. (1964). Stable isotopes in precipitation. Tellus 16, 436–468. doi: 10.3402/tellusa.v16i4.8993
Florea, L., Bird, B., Lau, J. K., Wang, L., Lei, Y., Yao, T., et al. (2017). Stable isotopes of river water and groundwater along altitudinal gradients in the high himalayas and the eastern nyainqentanghla mountains. J. Hydrol. 14, 37–48. doi: 10.1016/j.ejrh.2017.10.003
Immerzeel, W. W., van Beek, L. P. H., and Bierkens, M. F. P. (2010). Climate change will affect the Asian water towers. Science 328, 1382–1385. doi: 10.1126/science.1183188
Kang, S., Kreutz, K. J., Mayewski, P. A., Qin, D., and Yao, T. (2002). Stable-isotopic composition of precipitation over the northern slope of the central himalaya. J. Glaciol. 48, 519–526. doi: 10.3189/172756502781831070
Kerstel, E., and Gianfrani, L. (2008). Advances in laser-based isotope ratio measurements: selected applications. Appl. Phys. B 92, 439–449. doi: 10.1007/s00340-008-3128-x
Kerstel, E., Van Trigt, R., Dam, N., Reuss, J., and Meijer, H. A. J. (1999). Simultaneous determination of the 2H/1H, 17O/16O, and 18O/16O isotope abundance ratios in water by means of laser spectrometry. Anal. Chem. 71, 5297–5303. doi: 10.1021/ac990621e
Kump, L. R., Kasting, J. F., and Crane, R. G. (2014). The Earth System, 3rd Edn. Harlow: Pearson Education. ISBN-13: 978-0321597793
La Frenierre, J., and Mark, B. G. (2014). A review of methods for estimating the contribution of glacial meltwater to total watershed discharge. Prog. Phys. Geograp. 38, 173–200. doi: 10.1177/0309133313516161
Mani, A. (1981). “The climate of the himalaya,” in The Himalaya: the Aspects of Change, eds R. Lall, and A. D. Moddie (New Delhi: Oxford University Press, 3–15.
Mark, B., and Seltzer, G. (2003). Tropical glacier meltwater contribution to stream discharge: a case study in the Cordillera Blanca, Peru. J. Glaciol. 49, 271–281. doi: 10.3189/172756503781830746
Müller, F. (1959). “Eight months of glacier and soil research in the Everest region.” in The Mountain World 1958/59, ed. M. Barnes, (London: George Allen & Unwin Ltd, 191–208.
Müller, F. (1980). “Present and late pleistocene equilibrium line altitudes in the Mt. Everest region – an application of the glacier inventory,” in Riederalp Workshop 1978 – World Glacier Inventory, Vol. 126 (IAHS Publisher), 75–94. Available online at: https://iahs.info/uploads/dms/iahs_126_0075.pdf
Nganje, T. N., Hursthouse, A. S., Aniekan, E., Stirling, D., and Adamu, C. I. (2017). Hydrochemistry of surface water and groundwater in the shale bedrock, cross river Basin and Niger Delta region, Nigeria. Appl. Water Sci. 7, 961–985. doi: 10.1007/s13201-015-0308-9
Nicholson, K., Hayes, E., Neumann, K., Dowling, C., and Sharma, S. (2016). Drinking water quality in the Sagarmatha national park, Nepal. J. Geosci. Environ. Protect. 4, 43–53. doi: 10.4236/gep.2016.44007
Nijampurkar, V. N., and Bhandari, N. (1984). Oxygen isotopic ratios of some himalayan glaciers. Tellus 36B, 300–302. doi: 10.1111/j.1600-0889.1984.tb00250.x
NOAA National Centers for Environmental Information (2020). State of the Climate: Global Climate Report for Annual 2019. Available online at: https://www.ncdc.noaa.gov/sotc/global/201913 (accessed March 20, 2020).
Panzeri, D., Caroli, P., and Haack, B. (2013). Sagarmatha park (Mt Everest) porter survey and analysis. Tour. Manage. 36, 26–34. doi: 10.1016/j.tourman.2012.11.003
Salerno, F., Buraschi, E., Bruccoleri, G., Tartari, G., and Smiraglia, C. (2008). Glacier surface-area changes in Sagarmatha national park, Nepal, in the second half of the 20th century, by comparison of historical maps. J. Glaciol. 54, 738–752. doi: 10.3189/002214308786570926
Salerno, F., Guyennon, N., Thakuri, S., Viviano, G., Romano, E., Vuillermoz, E., et al. (2015). Weak precipitation, warm winters and springs impact glaciers of south slopes of Mt. Everest (central himalaya) in the last 2 decades (1994–2013). Cryosphere 9, 1229–1247. doi: 10.5194/tc-9-1229-2015
Salerno, F., Viviano, G., Manfredi, E. C., Caroli, P., Thankuri, S., and Tartari, G. (2013). Multiple carrying capacities from a management-oriented perspective to operationalize sustainable tourism in protected areas. J. Environ. Manage. 128, 116–125. doi: 10.1016/j.jenvman.2013.04.043
UNESCO [United Nations Educational Scientific and Cultural Organization] (2009). Case Studies on Climate Change and World Heritage. Paris.
Van Geldern, R., and Barth, J. A. C. (2012). Optimization of instrument setup and post-run corrections for oxygen and hydrogen stable isotope measurements of water by isotope ratio infrared spectroscopy (IRIS). Limnol. Oceanograp. Methods 10, 1024–1036. doi: 10.4319/lom.2012.10.1024
Viviroli, D., Dürr, H. H., Messerli, B., Meybeck, M., and Weingartner, R. (2007). Mountains of the world, water towers for humanity: typology, mapping, and global significance. Water Resour. Res. 47:W07447. doi: 10.1029/2006WR005653
Williams, M. W., Wilson, A., Tshering, D., Thapa, P., and Kayastha, R. B. (2016). Using geochemical and isotopic chemistry to evaluate glacier melt contributions to the Chamkar Chhu (river), Bhutan. Ann. Glaciol. 57, 339–348. doi: 10.3189/2016AoG71A068
Wilson, A. M., Williams, M. W., Kayastha, R. B., and Racoviteanu, A. (2016). Use of a hydrologic mixing model to examine the roles of meltwater, precipitation and groundwater in the Langtang river basin, Nepal. Ann. Glaciol. 57, 155–168. doi: 10.3189/2016AoG71A067
Xiang, Y., Yao, T., Gao, Y., Zhang, G., Wang, W., and Tian, L. (2018). Retreat rates of debris-covered and debris-free glaciers in the Koshi river basin, central Himalayas, from 1975 to 2010. Environ. Earth Sci. 77:285. doi: 10.1007/s12665-018-7457-8
Keywords: climate change, drinking water, meltwater, glaciers, isotopes, two-component mixing model, Himalayas, high-altitude
Citation: Wood LR, Neumann K, Nicholson KN, Bird BW, Dowling CB and Sharma S (2020) Melting Himalayan Glaciers Threaten Domestic Water Resources in the Mount Everest Region, Nepal. Front. Earth Sci. 8:128. doi: 10.3389/feart.2020.00128
Received: 13 January 2020; Accepted: 03 April 2020;
Published: 29 April 2020.
Edited by:
Chunqiao Song, Nanjing Institute of Geography and Limnology (CAS), ChinaReviewed by:
Qianggong Zhang, Institute of Tibetan Plateau Research (CAS), ChinaXander Wang, University of Prince Edward Island, Canada
Copyright © 2020 Wood, Neumann, Nicholson, Bird, Dowling and Sharma. This is an open-access article distributed under the terms of the Creative Commons Attribution License (CC BY). The use, distribution or reproduction in other forums is permitted, provided the original author(s) and the copyright owner(s) are credited and that the original publication in this journal is cited, in accordance with accepted academic practice. No use, distribution or reproduction is permitted which does not comply with these terms.
*Correspondence: Leah R. Wood, leahwood@iupui.edu