A Case Study of Highly-Engaged Educators' Integration of Real-Time Seismic Data in Secondary Classrooms
 Tammy Bravo
 John Taber
 Hilarie Davis2
- 1Incorporated Research Institutions for Seismology, Washington, DC, United States
- 2Technology for Learning Consortium, Stuart, FL, United States
The Incorporated Research Institutions for Seismology (IRIS) Seismographs in Schools (SIS) program has supported teachers in the use of educational seismometers and real-time seismic data in the classroom for the past 20 years. To better understand how the seismographs and seismic data are being used in the classroom, we sent a survey to 770 past or current program participants. The survey asked about their seismometer, seismic data use, software use, the impact of seismic data on their classroom, and what additional seismology-related resources or instruction they provide to their students. Four highly-engaged teachers were then recruited from this larger pool for a case study. The purpose of this study was to better understand these highly-engaged teachers, their experiences with seismic instrumentation, software, and data in the classroom, how and to what degree seismic data has impacted their curriculum and instruction, and their perceptions of the impact of the SIS program on their students' understanding of Earth Science concepts. The case study results show that each of the highly-engaged teachers values data driven instruction, instrument science, and the integration of seismic data into the classroom more than just during their earthquake units. They have made it part of everyday class activities by having students be aware of data coming in, noting earthquakes in the news, and helping students learn more about analyzing data for advanced investigations. While there were differences in their implementations, in all cases a critical feature of their engagement with students was use of a variety of seismology-related resources which connected the seismic data to the rest of the curriculum. Thus, the use of seismic data was just one component of their seismology-related teaching. This study also highlights the value of a local sensor, as all four highly-engaged teachers stressed that students as stewards of the seismometer linked them to the science in an engaging and dynamic way. Thus, while the highly-engaged teachers had a primary responsibility to promote learning, their focus on student engagement is also helping to create young citizen scientists.
Introduction
The Incorporated Research Institutions for Seismology (IRIS) have supported low-cost seismic systems in schools for over 20 years through the Seismographs in Schools (SIS) program. IRIS's SIS program serves teachers across the country and around the world using seismic instruments or real-time seismic data in kindergarten (age 5 years) through undergraduate (ages 19–22 years) classrooms. Additionally, our website (www.iris.edu/earthquake) includes tools to share seismic data in real-time, classroom activities, and technical support documents for seismic instruments. IRIS began the SIS program with the goal of increasing the quality and quantity of Earth science education in the classroom. While that is still the main goal of the program, the rapid advances of technology allowing easier access to real-time seismic data over the past 20 years have allowed the program to expand to reach a wider audience so that students and citizen scientists can be involved globally with or without access to a local seismograph. Since much of the US is not very seismically active, the focus of the program has been on the science and the recording of regional and distant earthquakes rather than promoting local seismic hazards awareness.
IRIS's early program (Braile et al., 2003) grew in collaboration with other educational seismology networks in the US, which included an effort to coordinate activities (Hamburger et al., 2001; Hamburger and Taber, 2003). Educational seismometers were distributed to classrooms across the country after teachers participated in training workshops that included two full days of training about the instrument, seismic data, and seismology concepts. In subsequent years, the distribution of instrumentation expanded to seismographs operating in such venues as libraries and other public places, as well as supporting citizen scientists who operate seismographs privately. Collaborations with international educational networks [e.g., Denton (2008)] also developed during this time. As the program expanded with increased participation, IRIS realized the limitation of requiring an instrument to participate as not all teachers were equipped or interested in operating an educational seismometer or meeting the challenges of equipment maintenance. IRIS believed students could experience the benefits of working with seismic data if we could facilitate easy sharing of data, initially between educational stations and then expanded to sharing real-time research station data. IRIS's focus has slowly shifted to support transferrable data manipulation and analysis skills as part of the process of science. Through software development and data storage and transfer enhancements that built on the original Amaseis software (Jones et al., 2003), IRIS's educational software jAmaSeis (www.iris.edu/hq/jamaseis; Drago et al., 2009) allows teachers to operate an educational seismometer locally and share data, as well as to view and manipulate data from over 3,500 global research quality seismic stations that stream data to the IRIS Data Management Center. The original design goals for the software were to provide an operating system-independent way for schools to display and analyze data from a local sensor, and to compare their data to other educational seismographs. As the software became more widely used, ability was added to be able to stream data from research stations and a wider variety of educational and citizen science sensors.
The types of educational seismometers available on the market has increased since the early days of the program, allowing a growth in the models employed by programs and users. Empirically however, programs often followed a consistent path: steady growth and excitement, plateau of station numbers, and then difficulty maintaining station operation and encouraging interactions/collaborations between stations. As the IRIS SIS network grew, the challenges to support and mentor the growing network became apparent. Regional networks, often with a University lead, became models of success keeping teachers engaged and instruments operating. In summarizing the European experience in educational seismology, Zollo et al. (2014) identified the scientific support and relationship between teachers and researchers as a key to success. However, in the US, calls to action for seismologists to provide support for local teachers often went unanswered, and we learned that while we had a number of exceptional individuals leading regional school networks [e.g., Kafka et al. (2006); Kafka and Fink (2019)], leadership in new areas was not something we could easily recruit.
An inventory of the current status of seismic stations in schools across Europe was completed in 2011 and revealed “many ‘wrecks’ of former seismic stations, web pages and e-learning experiments” (Zollo et al., 2014). This was also true in the US. After a decade of distributing educational seismometers and training teachers across the country, the US network was struggling with issues of equipment failure or damage, teacher turnover, and the difficulty of retraining new teachers who inherited instruments. What remained consistent was the presence of a small group of successful highly engaged users, which we will refer to as superusers, who have been with the program for many years. These superusers integrate the use of their seismograph and seismic data into their science curriculum in a manner which is far beyond how the typical teacher (from our experience) treats seismology-related topics. In some cases, they have relocated and reinvented their implementations, but they have remained the most visible success stories, examples of the goals that the program is striving to achieve.
The purpose of this study was to better understand these superusers, their experiences with seismic instrumentation, software, and data in the classroom, how and to what degree seismic data has impacted their curriculum and instruction, and their perceptions of the impact of the SIS program on their students' understanding of Earth Science concepts. Our goal was then to attempt to determine characteristics and situations in common across the superusers that supported the long-term successes they have had engaging their students. This information can then be used by our program and other programs to help other teachers be more successful in their use of seismic data with students.
Online Survey and Case Study Design and Methods
In 2019, an 11-question survey including multiple choice, Likert-style, and free response questions, was sent to 770 SIS program participants who were currently or had been registered users in the IRIS SIS database. The survey asked about their educational seismometer, seismic data use, software use, the impact of seismic data on their classroom, and what additional seismology-related resources, or instruction they provide to their students (Davis and Bravo, 2020). There were 92 respondents to the survey request geographically distributed between the US and the UK (Figure 1). Descriptive statistics were calculated for closed-ended items. Open-ended items were coded using discourse analysis (Gee, 2010).
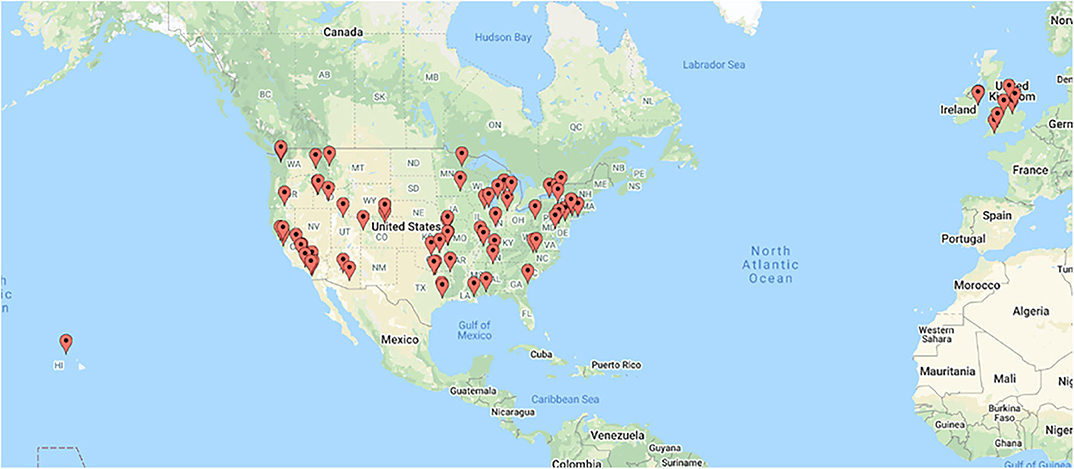
Figure 1. Geographical distribution of zip codes of survey respondents. Map data: Google.
Four superuser teachers were then recruited from this larger pool for the case study (Stake, 1978), based on their long-term connection to the SIS program as innovative engaged users. Since the IRIS SIS program is based in the US, only US teachers were considered for the case study. The criteria for being considered a superuser included being employed as a teacher, having eight or more years of experience operating educational seismometers, and having regularly used seismic data from educational seismometers in formal classroom instruction. Each superuser took part in an individual ~ 60-min semi-structured interview conducted via the telephone or skype regarding their experience in the SIS program, how they have used seismic data and the educational seismometer in the classroom, and the effect on their curriculum and students. After the interview, interview notes were summarized and emailed back to the superuser for review and clarifications as needed. The interviews were conducted by an outside evaluator who created subject reports from those interviews. Superusers signed informed consent forms and were not compensated for their participation and were happy to contribute to a better understanding of their integration of seismic data and instrumentation into the classroom.
Online Survey Results
About half of the respondents (47%) teach grades 9–12 (ages 14–17), 27% teach 6–8 (ages 11–13), 11% teach K-5 (ages 5–10), 11% teach undergraduate (ages 18–22), and 5% teach graduate school (ages 22+). Key results from the survey include:
• The sources of seismic data teachers use are their classroom seismometer (57%), jAmaSeis (51%), USGS (34%), other (21%), IRIS SIS website (18%), and IRIS DMC (11%).
• Teachers use seismic data in different ways: show the data to the class after an earthquake (83%), use the data to discuss earth science topics (73%), plot recorded earthquakes on a map (45%), encourage students to work with seismic data (42%), calculate distance (40%). calculate magnitude of at least 1 earthquake (28%), and other (21%).
• Teachers report high impact of seismic data on student subject knowledge on a scale of 1–10, with one being no impact and 10 being very high impact (8.2/10), on student learning (8.0/10), and on the quality of their curriculum (8.2/10).
• Teachers would recommend seismic data to another teacher as worthwhile for having students learn to: recognize earthquakes in streaming jAmaSeis data (77%), use jAmaSeis to look at an earthquake (79%), and upload and share data through the SIS website (61%).
• Teachers responded that they would like more instruction on using jAmaSeis (63%), seismometer hardware (61%), how to calculate the magnitude of a recorded earthquake (58%), how to locate the epicenter of a recorded earthquake (49%), advanced data analysis (46%), information about earthquakes they record (41%), how to determine if a recording is an earthquake (38%), and other (21%) such as calibration instructions, more filtering options, replacement parts, lesson plans for Mars seismic data, how to calculate depth of focus.
Overall, the feedback from this survey came from only 12% of our network, which was disappointing considering this is a dedicated community of users bonded by training and equipment. However, in hindsight the single survey invitation was sent in an email that also contained other news items which could have resulted in it being overlooked. Additionally, delivery failed to 15% of the email addresses we had on file, highlighting the turnover in the program. Those that responded spanned a wide range of grade levels, and even with such a wide age range of students, teachers indicated varied use of seismic data in the classroom and overwhelmingly valued its contribution to their classroom and students. However, only half of those that responded are using our jAmaSeis software and less than half encourage students to work with the data. Thus, there appear to be limitations for some teachers in the use of real seismic data in the classroom, which led us to interview our superusers to try to identify approaches we could employ ourselves or recommend to teachers to increase student engagement.
The Superuser Interviews
Our four superusers were all male US school teachers with an average of 12 years participating in our SIS program. Their interviews described below explored their experiences with integrating educational seismology into their classrooms. All of their schools except for western US school near the San Andreas Fault are in regions of low seismic hazard. The percentage of students receiving free/reduced price meals is a means of estimating the socio-economic status of the students in the school. Across the US, ~50% of public school students are eligible for free/reduced price meals.
Subject 1: Middle School in Suburban Mid-Atlantic Region
This superuser heard about IRIS at the National Science Teaching Association's National Conference in 2008, signed up to receive a seismometer, and went to an IRIS run 2-days training workshop. The seismology background from the workshop is still useful and the superuser has gotten refreshers at conferences that IRIS attends. This school serves ~800 students in grades seven and eight (ages 12 and 13), of which 14% are minority. Test scores at this school are above the state average. Six percent of students receive free/reduced price meals under the Federal School Lunch program. The addition of the seismometer to the classroom created opportunities for students to work with real-time seismic data.
Eighth graders have a novice view of how science data is collected, used, and analyzed. We're trying to expand that. Having this device in the room, it's real science, so it's messy. Textbooks show perfect curves. Our actual data is messy. That's why seismologists look at multiple data sources. The world is messy—it's not always easy to know what you are looking at, that's important to know. It may be a mystery. You can't always have all the answers.
The seismograph is connected to the school's science network so data from the single instrument is shared with three other science teachers. To reach as many students as possible and the community, a seismogram for the last 24 h is fed to the school website and is updated every 10 min. Making this data available introduces all students to the frequency that earthquake occur.
I start the plate [tectonics] lesson by showing where earthquakes are.
During the earthquake unit, students make use of seismic data from their educational seismometer. A few students are asked to extract data from previous earthquakes using jAmaSeis. The students then analyze the data by measuring the distance between the P and S waves and calculating the distance from their seismic station to the earthquake epicenter. Also, in the jAmaSeis software, students are able to use data for a single earthquake from three seismic stations to triangulate an earthquake location. This superuser also uses a number of hands-on curricular resources to explore earthquake concepts, including using the earthquake machine (Hubenthal et al., 2008), to show the buildup of stress leading to earthquake rupture. To demonstrate waves traveling through solids and liquids, 10 students line up with their arms rigid (solid) or slack (liquid) and feel the reaction when someone shakes the person on the end. Student teams also build earthquake towers, using balsa wood and weighted plywood floor plates to simulate the weight of concrete poured flooring, test them on a shake table, adjusting the width and height parameters of the tower based on the feedback from the tests. The addition of a seismometer to the classroom has afforded students multiple opportunities to work with data.
We use data from the device to connect seismology to data collection and as a current event like weather systems. Snow and wind also affect the ground and the seismograph picks that up. Not a week goes by that we don't talk about it. I have telescopes, weather stations, but the seismometer is the coolest thing ever.
Students in environmental science classes are encouraged to monitor the seismogram and connect what is happening on the seismogram to reports in the news. The seismograph has real science data that is displayed directly to the students all the time. They are now doing a weekly video report for Channel 1 news. When there is a big earthquake, the superuser incorporates another IRIS product into the classroom, Teachable Moments (Bravo and Hubenthal, 2016), slide shows that contain interpreted USGS regional tectonic maps and summaries, computer animations, seismograms, press photos, and other event-specific information. This superuser also follows IRIS on twitter because it is “superb with a constant stream of information” and has reminders about classroom resources. This superuser reports that having the seismometer has helped students understand the structure of the Earth and that the Earth is actually moving underneath them. They talk to their parents about it. The local news came in and talked to the students as “local experts” when large earthquakes were in the news (Figure 2).
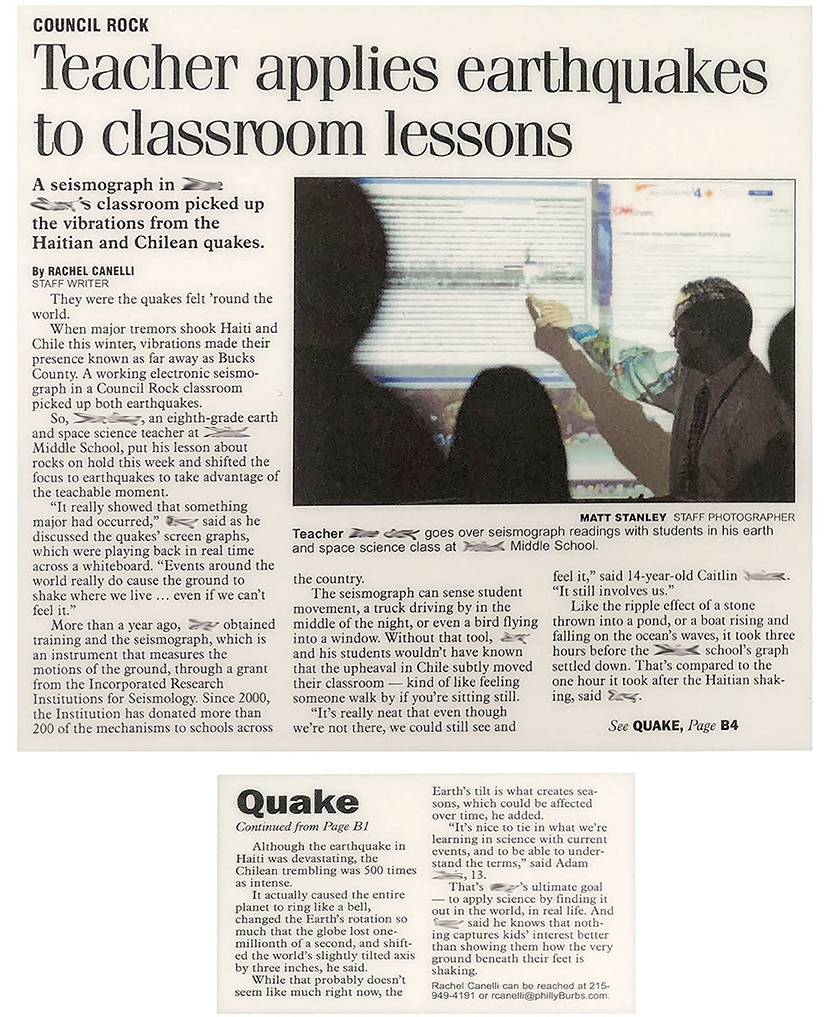
Figure 2. Example of local media coverage after large earthquakes (Haiti and Chile, 2010) for Subject One and their classroom seismograph display. Article from the Bucks County Courier Times used under a Creative Commons license.
In addition to the classroom, the superuser has supported students wanting to go further with the seismic instrument and data. Over the years, a couple of students have done science fair projects on how their locally recorded data compares with USGS data. Working with the classroom seismometer has inspired students to want to build their own seismometer. One student has been trying to build one that uses a vertical slinky as the spring inside a clear plastic tube. They found the directions online for a design by Channel and van Wijk et al. (2013) that is in use by schools in the US and New Zealand and that the students learned had recorded a recent New Zealand volcanic eruption.
Subject 2: Elementary School on The West Coast
This technology education superuser received a seismometer in 2005 and has two working seismographs set up in an office off the library. This school serves ~1,700 students in kindergarten through grade eight (ages five to 13). Minority enrollment is 53% of the student body. Students at this school perform about average on state tests. Fifty-three percent of students receive free/reduced price meals under the Federal School Lunch program. This school's two seismometers have a really clean signal and turn their gain way up so their data is coveted by a lot of other people since they are 17 miles from the San Andreas fault. One of the school counselors keeps an eye on the data from a public safety standpoint. The seismometers increase seismic awareness both in the school and the community.
We know our data is being used because if there is a power outage the seismometer goes offline and people I don't even know email me to ask what's going on.
This superuser attended an IRIS Seismographs in Schools workshop at Cal State Northridge in 2007. They also keep up with new equipment and software, and noted that jAmaSeis was a big improvement in usability and reliability over the earlier AmaSeis software. The school has their software set up to feed the seismology data to their school website. Instructionally, there is a great deal of potential that is created with access to real-time data.
We have a great school. I'd like to see more emphasis on data collection in real life in Earth science through operating things like a greenhouse and weather station, as well as our seismology station. I'm so turned on by the idea of kids and data. You can use math to do cool things. You can figure things out and they make sense logically. Another thing is the realization that by having the right tools, you can observe things that you can't observe with your senses. We look at squiggles that you can feel and that you can't feel. The idea is that you don't have to be at the center of the action to study it.
Seismology fits into the curriculum in 4th grade. This superuser has students come to the setup, see how the equipment works, then go online to see the data. They look at three locations and talk about why the earthquake shows up at different times in dispersed locations. They see how the hardware works to detect, amplify, and display seismic signals. In addition, students engage with physical activities to explore earthquake concepts. Using extralong Slinkys, students explore how waves behave. Students are also asked to think about runners running around a track at different speeds to simulate how different waves travel at different speeds and how to determine their starting point. With this background, these young students are able to work directly with seismic data. Students try to pinpoint where a quake happened by looking at the P and S wave arrival times and drawing a circle around them and two other locations to pinpoint where the earthquake originated. Students are also able to look at the traces to qualitatively see what the event was like (Figure 3).
I say to students, “If you think you felt something locally, go to our site. It will look big—REALLY BIG. The seismograph trace would be so big that the top and bottom of the trace is flattened out. If you feel something and it doesn't show up, it is something else maybe a large truck passing by. Big events happen so seldom, and we haven't had any big events in SoCal in a long time. Not a day goes by that we don't see something on there though, sometimes even seismic swarms with 100 s of events.
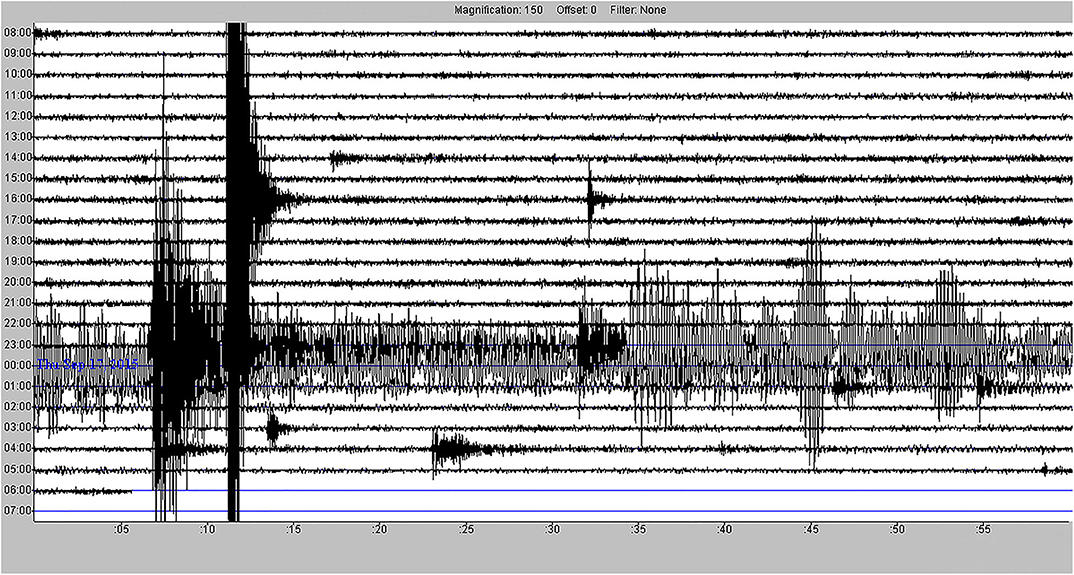
Figure 3. Webicorder display of 24 h of recording from Subject Two's seismograph. The webicorder images are generated automatically by the jAmaseis software and displayed on the IRIS Seismographs in Schools website. This screenshot shows both local short-duration events and a large distant earthquake which generated ground motion at the sensor that was easily visible on the display for over 2 h.
Seismology helps students understand the Earth just like we can use X-rays and MRIs that see inside the body by having waves pass through it, the waves from an earthquake tell us what's inside the Earth. Having the seismograph helps increase the students' hazard awareness, as they regularly see local earthquakes on their seismograph, which connects them to their regional hazard.
We have the Great California Shakeout every fall. The whole state at the same time pretends there is an earthquake to make sure the procedures and communications are in place (chain of command, chain of communication). Kids are aware we live in earthquake country but I don't' think they understand that we are “overdue.” I think it brings it down to something that is more tangible and accessible to them. They don't remember the ones that did not happen in their lifetimes.
Outside the classroom, even at the elementary school level, seismology captured the interest of a student. A student was interested in what was causing a weak but sustained signal on the seismometers that was lasting around 5 min at fairly regular intervals. The student compared a train schedule to the recorded signal, determining the seismometers were recording train traffic from three miles away from the school.
Subject 3: High Schools in The Us Southwest and Asia
This superuser said an IRIS run 2-day seismograph training at the University of Missouri in Kansas City in 2010 was great and allowed him to start on using seismic data with high school students. The Southwest US school serves ~2,300 students in grades eight through 12 (ages 13 to 18), of which 99% are minority. Students at this school perform above average on state tests. Sixty-eight percent of students receive free/reduced price meals under the Federal School Lunch program. Students enjoy the challenges of working with real data—taking an earthquake, doing triangulation, looking at additional sources, even visiting an area and doing “felt reports” after a quake. In the Southwest, the superuser and a few students worked with a local university after a local earthquake to go into the field for 3 days going door to door in the most damaged areas to create intensity maps and identify the earthquake epicenter. The students who did the field work, then reported out to other students and the college researchers. Awareness of regional seismicity created this unique experience.
It definitely gave them the skills to be able to do other data collection and analysis. They told me that the research they did on earthquakes made a huge difference in everything else they did.
In the classroom students worked extensively with seismic data. Students learned to recognize P and S waves, calculate travel-time, triangulate, determine location, and calculate magnitude, then look up USGS information. The superuser values the seismometer as an educational tool to teach a broad range of scientific concepts in subjects like physics and computer science at all grade levels. Incorporating seismic data in the classroom helped students realize the planet is in constant motion through processes like continental drift and plate tectonics, resulting in mountain building, ocean trenches, and mid-ocean ridges.
The data opens a window to the world! It's not something they are reading in a textbook. It's tangible to the students. It's live, first-hand information. Working with data from jAmaSeis makes students feel like they are part of a larger science research community; that they are contributing to a meaningful endeavor.
The superuser is now in Asia at a STEM-focused international school serving ~400 students in grades seven through 12 (ages 12 to 18). Tuition is required to attend this school, although there are some scholarships available. At this school his superuser has formed a seismology club. Through this work, students are beginning to understand how earthquakes occur, how they are studied, how they impact people and economies, and better construction techniques. Through IRIS they feel part of a worldwide community of people studying earthquakes. The students thought earthquakes did not occur in Thailand until their seismograph picked up an earthquake on the Laotian border. The students will go on a field trip to the university to the geology and engineering departments to learn more, then eventually do “felt reports” on nearby quakes. The students have studied peer-reviewed article reviews on recent earthquakes for the Pacific Rim to help them understand the geology of the region.
Subject 4: Middle School in Suburban New England
This superuser is teaching sixth grade Earth science at a school that serves 941 students in grades six through eight (ages 11–13), of which 21% are minority. Students at this school perform above average on state tests. Ten percent of students receive free/reduced price meals under the Federal School Lunch program. The seismograph, received in 2007, is set up in a quiet workroom, connected to a computer in the classroom. This superuser says students are always very engaged with the seismograph data, figuring out what they are seeing, and what it means. Students learn transferable skills like using latitude and longitude to identify places and map them. In mathematics, the GPS vector gives them an understanding of coordinate graphs. This transfers to the study of weather, where they look at relationships in the data of temperature and relative humidity. They develop a clear understanding of what happens with different kinds of waves, why we use the seismograph, why we need to triangulate, and make the geology connection (rock cycle related to the movement of the plates). The seismograph creates a real-time connection to the Earth.
The neat thing about having it running is that every day the kids are checking it. 1 day a kid yelled out, “We're having an earthquake right now.” We all stopped and took a look at it.
This superuser utilizes a range of IRIS animations to introduce students to seismic data including visualizing how S and P waves travel, why multiple stations are needed to locate an earthquake, and how you can see the subduction zones if you look at the global distribution and depth of earthquakes. Students' progress to working with seismic data, calculating distance from the earthquake to the school, determining the great circle arc, and determining the location of the earthquake. Students advance in working with the seismic data, learning about amplitude and wave periods to calculate magnitude. Students extend their knowledge even more, working with GPS data from all over the world, using vectors to get a sense of Iceland's motion relative to the North American and Eurasian Plate. Students have been able to use data to see the rising of the caldera in Yellowstone. This superuser also incorporates hands on curriculum to explore earthquake concepts. Students build structures with clay and building materials like straws, washers, and rubber bands. By researching modern construction methods, students use the simple materials to make buildings that are stable in an earthquake, then test out their designs on a shake table.
The students are much more aware of seismic hazards because of constructing their own buildings. At first, they don't know what to do with the rubber bands or washers. Then they learn that in 1906 San Francisco was all leveled and building methods changed to provide more cushioning.
This superuser has supported more activities by students who showed a lot of interest. When the superuser was out on leave, he set up a seismometer at a student's house and supported him in reporting to the class on the data he was seeing and analyzing. Other students have done more with the software as part of the earthquake unit. Overall, hazard awareness has increased among students and even their families.
Looking back at previous years, they were really connected when we were doing earthquakes and volcanoes. One family changed their April trip to visit a volcano.
Reflections on Superusers
Each of the superusers values data driven instruction, instrument science, and authentic experiences as shown in their use of their seismometer with students, and in other programs that afford students access to data. For superusers, the integration of seismic data into the classroom happens more than just during their earthquake units, they have made it part of everyday class activities by having students be aware of the data coming in, noting earthquakes in the news, and helping students to learn more about how to analyze the data for advanced investigations. Superusers all discussed the observation that utilizing data from across the world gave students a better understanding of earthquakes, how they are studied, and their effects, and allowed students to generate multiple questions to interrogate seismic data. Each superuser emphasized a philosophy of exposing as many students as possible to draw them into thinking like a scientist, and extending activities with those who get excited. All of the superusers appear comfortable with the uncertainty of using messy, real data with their students. One advantage our superusers had is they all applied for and attended a professional development workshop run by IRIS where they learned the basics of seismology along with focused training on the use of their seismograph. They all valued the training they received, and sought out continuing education on concepts and equipment. They also all mentioned the value of ongoing support. Additionally, all of the superusers were highly personally motivated to ensure the technical conditions were met for instrument integration into the classroom.
Each superuser described positive experiences among all their students in their courses, and also extended student involvement outside of the classroom. They described the instrument and data as a tool to reach and encourage interested students to explore concepts further. Students engaged with seismic data, and saw the relevant connection to their lives. There was no doubt on any of their parts that having the seismograph and the software connected students to the world of seismology through getting data from faraway events revealing the structure of the Earth, and allowing students to query the data to learn more. While there was some discussion of collaboration between schools, IRIS could do more to connect students and teachers to facilitate more collaboration and sharing of data, ideas, and experiences within our network.
Among the superusers, there were differences in their implementations. However, in all cases, a critical feature of their engagement with students was to use a variety of seismology-related resources which connected the use of seismic data to the rest of the curriculum. Thus, the use of seismic data was just one component of their seismology-related teaching. Many of the resources are available via the IRIS Education and Public Outreach Program (www.iris.edu/earthquake; Taber et al., 2015), but the superusers also used other resources, and in one case even included students in the collection of felt reports from the community. The grade-level of implementation was more varied than we expected, stretching from 4th grade to 10th grade. Even among this wide age range, students were able to make personal connections to the data and use age-appropriate curriculum to learn about the Earth with seismic data.
The regional seismic hazard of the communities where the superusers were teaching also varied widely, with three of the four teachers working in low seismic hazard regions. What was surprising was that even in the most seismically active area, students didn't have a personal experience or memory of a large event, which created a disconnection from recognizing and understanding their regional seismic hazard. Seismographs in schools have the ability to raise earthquake hazard awareness and preparedness among students which can help communities prepare for future earthquakes (Subedi et al., 2020). In these multiple implementations, students were interested to learn the local impact of their regional seismicity, and were engaged when they realized they could record global seismicity as well. Through this program, students were given the opportunity to speak as local experts, passing on the lessons they were learning to their parents, the community, and even the media.
Discussion and Future Directions
After 20 years of the Seismographs in Schools program, data from both our user survey as well as the in-depth case studies of program superusers, show that integrating seismic data into classroom lessons is engaging students in Earth Science. By collecting and analyzing real data, students experience roles that require technical expertise with instruments, data analysis, teamwork, and other twenty-first century workplace skills (Dede, 2009; National Research Council, 2012). They experience firsthand some ways in which we use data to understand Earth processes in ways that we cannot observe directly. Students seem to easily take ownership of both monitoring and analyzing data, asking their own questions from the data. Their engagement is enhanced by the relationships they develop within the seismology community, as well as the validation they receive from their community. However, the current study has inferred student engagement from surveys and interviews of teachers. A more quantitative analysis of student engagement and learning could be obtained by surveying the students directly.
Both superusers and the sample of users surveyed responded positively to the effect of seismic data on student subject knowledge, student learning, and curriculum quality. Real data from a real instrument of unseen and often unfelt phenomena draw students into thinking more about how an event on the other side of the world can possibly be picked up at their location. What is going on inside the Earth? The fingerprints of waves from the earthquake begin to reveal the structure of Earth's interior. The patterns of earthquakes tell the story of the plates. Students begin to understand how we know about Earth and its phenomena.
Having initial and ongoing access to seismology-focused professional development was one of common factors mentioned by the superusers, and half of the teachers that responded to the initial survey would like additional training on one or more topics such as the software, seismology topics, and seismographs. A lack of adequate professional development was also one of the key barriers cited by teachers interested in using inquiry-based teaching techniques (Fitzgerald et al., 2019). Thus, IRIS could consider whether there are ways of providing broader professional development support for teachers. One way to do this may be to move to more online training. As an initial trial of such an approach, IRIS partnered with the University of Alaska-Fairbanks to run a successful online seismology course for Alaska teachers (Bravo et al., 2017), though scaling up such an initiative to reach large numbers of teachers would require significant resources.
Having insufficient time to cover a particular curriculum topic was highlighted as another barrier to using active learning techniques by Fitzgerald et al. (2019). While we lack quantitative data to show that the superusers spend more time on seismology-related topics than the average teacher, the superusers appear to use a larger number of IRIS resources than the typical workshop attendee, along with spending more time working with seismic data, based on follow-up surveys of teachers who have attended other IRIS professional development workshops. Thus, another superuser characteristic appears to be the ability to flex their school's curriculum to use seismology examples when teaching about other topics. In the US, the curriculum is set at the state and local level, so a teacher's ability to modify the curriculum varies considerably from state to state. However, all of the superusers used their instrument and the data it recorded as a process of science tool, using it to teach about data collection and analysis, thereby incorporating an awareness of global seismicity into students' daily experience. This approach fits well with the new Next Generation Science Standards which are being adopted by many states (National Research Council, 2013). The NGSS focus more on science and engineering practices and cross-cutting concepts than on specific content, so there is more opportunity to weave seismology examples into the curriculum. Providing such examples to other teachers might help them see ways that they could make more use of seismic data.
Reflecting on superusers long-term engagement of their students, it appears to depend both on the use of seismic data to explore concepts of data manipulation and analysis skills, as well as the existence of a local physical sensor, given the value to these superusers of their instrument and local recordings of large earthquakes. This was true in 1998 when a UK teacher explained how recording real data from real events was inspiring students at his school to think about science in a positive and engaging manner (Bullen, 1998). Paul Denton reiterated this observation 10 years later in an evaluation of the UK School Seismology Project (Denton, 2008). This study also shows the value of a local sensor, as all four superusers interviewed stressed that students as stewards of the seismometer links them to the science in an engaging and dynamic way. Thus, while the superusers had a primary responsibility to promote learning, their focus on student engagement is also helping to create young citizen scientists.
Data Availability Statement
The datasets generated for this study are available on request to the corresponding author.
Ethics Statement
The studies involving human participants were reviewed and approved by Human Subjects Research Review Office Binghamton University. The patients/participants provided their written informed consent to participate in this study. Written informed consent was obtained from the individual(s) for the publication of any potentially identifiable images or data included in this article.
Author Contributions
TB, JT, and HD contributed to the design of the research. TB and HD created the online survey and designed the interview protocols. HD conducted the interviews and analyzed both the survey and interview results. All authors contributed to the interpretation, writing, and revision of the manuscript.
Conflict of Interest
The authors declare that the research was conducted in the absence of any commercial or financial relationships that could be construed as a potential conflict of interest.
Acknowledgments
This manuscript was greatly improved via comments and suggestions from Michael Hubenthal, and the research was funded by the National Science Foundation's Seismological Facilities for the Advancement of Geoscience (SAGE) Award to IRIS under Cooperative Service Agreement EAR-1851048.
References
Braile, L., Hall-Wallace, M., Aster, R., and Taber, J. (2003). The IRIS education and outreach program. Seismol. Res. Lett. 74, 503–510. doi: 10.1785/gssrl.74.5.503
Bravo, T., and Hubenthal, M. (2016). Using earthquakes as “teachable moments.” Sci. Teach. 83:14. doi: 10.2505/4/tst16_083_03_14
Bravo, T. K., Gardine, L., Taber, J., and West, M. E. (2017). “Developing an online seismology course for Alaska,” in GSA Annual Meeting in Seattle (Washington). doi: 10.1130/abs/2017AM-308093
Bullen, S. (1998). Seismology in schools. Astron. Geophys. 9, 4.25–4.26. doi: 10.1093/astrog/39.4.4.25
Davis, H. B., and Bravo, T. (2020). Seismographs in Schools Survey Summary. Available online at: www.iris.edu/hq/files/programs/education_and_outreach/Evaluation/SISSurvey19.pdf (accessed May 1, 2020).
Dede, C. (2009). Comparing Frameworks for 21st Century Skills. Harvard Graduate School of Education. Available online at: http://sttechnology.pbworks.com/f/Dede_(2010)_Comparing%20Frameworks%20for%2021st%20Century%20Skills.pdf (accessed March 4, 2020).
Denton, P. (2008). Seismology in schools: 10 years on. Astron. Geophys. 49, 6.13–6.14. doi: 10.1111/j.1468-4004.2008.49613.x
Drago, J., Ginther, J., Viglione, P., Wicklund, E., and Coleman, B. (2009). “Amaseis: seismology software meeting the needs of educators,” in Midstates Conference for Undergraduate Research in Computer Science and Mathematics (Milwaukee, Wisconsin).
Fitzgerald, M., Danaia, L., and McKinnon, D. H. (2019). Barriers inhibiting inquiry-based science teaching and potential solutions: perceptions of positively inclined early adopters. Res. Sci. Educ. 49, 543–566. doi: 10.1007/s11165-017-9623-5
Gee, J. P. (2010). An Introduction to Discourse Analysis: Theory and Method. New York, NY: Routledge. doi: 10.4324/9780203847886
Hamburger, M., Astwood, P., Boone, W., Boyd, T., and Hall-Wallace, M. (2001). A white paper for the U.S. Educational Seismology Network. Available online at: http://www.indiana.edu/usesn/about.html (accessed March 4, 2020).
Hamburger, M., and Taber, J. (2003). Towards integration of educational seismology programs: the U.S. educational seismology network. Seismol. Res. Lett. 74, 603–604. doi: 10.1785/gssrl.74.5.603
Hubenthal, M., Braile, L., and Taber, J. (2008). Redefining earthquakes and the earthquake machine. Sci. Teach. 75, 32–36.
Jones, A. L., Braile, L. W., and Braile, S. J. (2003). A suite of educational computer programs for seismology. Seismol. Res. Lett. 74, 605–617. doi: 10.1785/gssrl.74.5.605
Kafka, A. L., Ebel, J. E., Barnett, M., Macherides Moulis, A., Campbell, L., and Gordon, S. E. (2006). Classroom seismographs and the challenge of encouraging a culture of scientific inquiry in K-12 schools. Seismol. Res. Lett. 77, 74–86. doi: 10.1785/gssrl.77.6.734
Kafka, A. L., and Fink, K. R. (2019). Raspberry Shake, EQ1, and Research-Grade Seismographs: Pros and Cons of Different Types of Seismographs for Education, Citizen Science, and Earthquake Monitoring. New England and Texas. Eastern Section Meeting, Seismological Society of America (Columbus, OH).
National Research Council (2012). Education for Life and Work: Developing Transferable Knowledge and Skills in the 21st Century. Washington, DC: The National Academies Press. doi: 10.17226/13398
National Research Council (2013). Next Generation Science Standards: For States, By States. Washington, DC: The National Academies Press. doi: 10.17226/18290
Stake, R. E. (1978). The case study method in social inquiry. Educ. Res. 7, 5–8. doi: 10.3102/0013189X007002005
Subedi, S., Hetényi, G., Denton, P., and Sauron, A. (2020). Seismology at school in Nepal: a program for educational and citizen seismology through a low-cost seismic network. Front. Earth Sci. 8:73. doi: 10.3389/feart.2020.00073
Taber, J., Hubenthal, M., Bravo, T., Dorr, P., Johnson, J., McQuillian, P., et al. (2015). Seismology education and public outreach resources for a spectrum of audiences, as provided by the IRIS consortium. Leading Edge 34, 1178–1184. doi: 10.1190/tle34101178.1
van Wijk, K., Channel, T., Viskupic, K., and Smith, M. L. (2013). Teaching geophysics with a vertical- component seismometer. Phys. Teach. 51, 552–554. doi: 10.1119/1.4830072
Zollo, A., Bobbio, A., Berenguer, J. L., Courboulex, F., Denton, P., Festa, G., et al. (2014). “The European experience of educational seismology,” in Geoscience Research and Outreach. Innovations in Science Education and Technology, Vol. 21. ed. V. Tong (Springer, Dordrecht), 145–170. doi: 10.1007/978-94-007-6943-4_10
Keywords: educational seismology, seismographs in schools, educational seismographs, classroom data analysis, Earth science education
Citation: Bravo T, Taber J and Davis H (2020) A Case Study of Highly-Engaged Educators' Integration of Real-Time Seismic Data in Secondary Classrooms. Front. Earth Sci. 8:180. doi: 10.3389/feart.2020.00180
Received: 09 March 2020; Accepted: 07 May 2020;
Published: 18 June 2020.
Edited by:
Remy Bossu, European-Mediterranean Seismological Centre, FranceReviewed by:
Laure Fallou, European-Mediterranean Seismological Centre, FranceGyörgy Hetényi, Université de Lausanne, Switzerland
Copyright © 2020 Bravo, Taber and Davis. This is an open-access article distributed under the terms of the Creative Commons Attribution License (CC BY). The use, distribution or reproduction in other forums is permitted, provided the original author(s) and the copyright owner(s) are credited and that the original publication in this journal is cited, in accordance with accepted academic practice. No use, distribution or reproduction is permitted which does not comply with these terms.
*Correspondence: Tammy Bravo, tkb@iris.edu