Chemical, Textural and Thermal Analyses of Local Interactions Between Lava Flow and a Tree – Case Study From Pāhoa, Hawai’i
 Jonas Biren1,2*
  Andrew Harris1
  Hugh Tuffen3
  Magdalena Oryaëlle Chevrel1
  Lucia Gurioli1 Ivan Vlastélic1
  Federica Schiavi1 Mhammed Benbakkar1 Claire Fonquernie1
  Laura Calabro1
- 1Laboratoire Magmas et Volcans, Université Clermont Auvergne, CNRS, IRD, OPGC, Clermont-Ferrand, France
- 2Institut des Sciences de la Terre d’Orléans, UMR7327, Université d’Orléans, CNRS, Orléans, France
- 3Lancaster Environment Centre, Lancaster University, Lancaster, United Kingdom
Because many volcanoes are densely vegetated, understanding of the interactions between active lava flows and trees is essential for robust hazard modeling. Tree molds − lava flow features generated when advancing lava engulfs and combusts trees − are widely documented but have, to date, only been described qualitatively. Detailed, quantitative studies of molds can, however, provide insights into the nature of lava-forest interactions. Here, we present a unique characterization of the chemical, textural and thermal interactions between lava and a tree (an Albizia), taking as a case type a basaltic pāhoehoe lava flow that traveled 20 km through Hawaiian rainforest on Kilauea’s East Rift Zone between June and December 2014. The dataset includes chemical analyses of lava (major, trace and volatile species) at the lava-tree contact, quantitative descriptions of lava texture (density, vesicle and crystal populations), and thermal analysis to fingerprint the devolatilization and combustion of wood as well as with cooling and crystallization of lava around the tree. We use these results to construct a three-stage thermal model to describe heat transfer between the lava and the tree, showing how the interaction facilitates combustion of wood and release of its volatile species (CO2 and H2O) into the lava, whilst triggering enhanced cooling and crystallization of lava surrounding the tree. Chemical analyses reveal that the inflating pāhoehoe at the lava-tree contact was strongly CO2-enriched (up to 1200 ppm), and textural data show that lava is denser at the contact. Moreover, lava crystallinity indicates a cooling rate of ∼70°C min–1 at the lava-tree contact, a rate well above the expected cooling rates (30°C min–1) for pāhoehoe more distant (40 m away) from the tree. We conclude that the tree had a local cooling effect on the lava that could potentially influence lava properties at larger scale if tree density, trunk diameter and moisture content are sufficiently high.
Introduction
Many effusive centers (e.g., Hawaii, Etna, the Virunga region, La Réunion) are densely vegetated and in climatic settings that favor rapid vegetation regrowth after inundation by lava (e.g., Ziegler, 2002; Smathers and Mueller-Dombois, 2007). Forest inundation by lava flows is thus a common phenomenon, which has been frequently described during eruptions at, for example, Etna (Andronico et al., 2005; Carveni et al., 2011), Piton de la Fournaise (Bertile, 1987) and Kilauea (Moore and Richter, 1962; Lockwood and Williams, 1978; Bell and Williamson, 2017; Chevrel et al., 2019). As a result, it is well known that when lava invades a forest, it causes widespread combustion of the trees, shrubs and undergrowth comprising the biotic system as, for example, during the eruption of Kilauea Iki (Kilauea, Hawaii) in 1959 (Richter et al., 1970). In a film, taken by the U.S. Geological Service and the National Park Service, of lava flooding the crater of Kilauea Iki at the onset of the 1959 eruption1, flaming trees in and around the active lava flows are clearly visible: “their bright yellow flames flashing like giant sparklers” (Richter et al., 1970). Regarding trees and forest litter buried by lava, the narrator of the film1 comments that “for some time individual tree trunks give off super-heated organic gases that burst into bright yellow flame as they explode from the surface of the lake” (U.S. Geological Service and the National Park Service, 1959). The question is: does this interaction have an effect on the lava thermal, chemical and textural properties?
When relatively low viscosity lava (< 103 Pa s, Chevrel et al., 2019) contacts a cold, damp tree, it has been long established that the engulfing lava cools rapidly to form a cast around the tree trunk (Finch, 1931; Jaggar, 1945; Moore and Richter, 1962; Lockwood and Williams, 1978; Macdonald et al., 1983). Isolated within its cast, the tree heats to combustion and burns slowly to leave a mold with the same size and form as the trunk within the solidified lava flow (Finch, 1931; Lockwood and Williams, 1978). This creates a tree mold and if the lava level drops during emplacement then the tree cast will instead remain as a standing “lava-tree” (Finch, 1931; Hazlett, 1993; Lockwood and Hazlett, 2010). Although the formation of such structures and their associated cave systems are well described (e.g., Finch, 1931; Ogawa et al., 1999; Bella and Gaal, 2007), thermal and physio-chemical interactions between the tree and the lava during heating, drying and combustion have not been described or modeled. To date, lava-trees and tree molds have been mainly used to determine lava dynamics in terms of flow direction and thickness (Moore and Richter, 1962; Lockwood and Williams, 1978; Macdonald et al., 1983; Lockwood and Hazlett, 2010; Jones et al., 2017). However, Searle (1958), Honda (1998, 1999) and Wasilewski et al. (2000) have hinted at potential chemical and thermal interactions between a combusting tree and the engulfing lava. Chevrel et al. (2019) constrained the possible influence of a forest on the emplacement of an entire lava flow system, showing that lava-trees and tree molds can act as obstacles capable of locally diverting the flow path. Although no impact on the overall cooling of the lava flow was found, a distinction was noted between the down-flow cooling rate of lava that was deposited against tree trunks and lava that cooled in the far field (Chevrel et al., 2019). Thus, several key questions remain unanswered. These include:
• What thermal and physio-chemical processes occur at the lava-tree contact?
• Is there any chemical exchange between the lava and the tree?
• How much heat is transferred between the tree and lava, and in which direction?
• Can the presence of trees enhance lava cooling rates?
• Could heat and chemical exchanges between trees and lava affect the whole flow field?
Here, we aim to provide answers to these questions. To do this, we detail the formation of a tree mold in an engulfing lava, providing quantitative data for the chemical and thermal exchanges between the lava and the tree via employment of a number of analytical techniques. These data provide a basis for a thermal model that examines lava ↔ tree heat exchanges, and allows evaluation of possible lava cooling (and heating) effects.
Based on a survey of available sites at La Réunion, Etna and Hawaii, obtaining a sample set that can define the interaction around a single tree, and with depth in the flow, is not straightforward. This is due to four main reasons. First, tree molds are often too narrow to access for sampling. Second, the cost of installing a drill rig to extract an entire tree or mold is prohibitively expensive and logistically more difficult to deploy than traditional (hammer and chisel) sampling. Thirdly, many potential cases (e.g., on Etna and Kilauea) are in National Parks and the destructive sampling of a lava tree in such a protected environment would be against Park permit rules. Finally, good examples are often buried by subsequent flow units and/or inflation, as was the case for all potential sites we visited on Piton de la Fournaise; which was our first (initial) site chosen for this study. All of these points make suitable sampling cases relatively rare, and hence likely explains the lack of data in the literature to qualify and quantify the thermal interaction between a tree and an active lava. This is why we focus on a particularly well-exposed and large (meter-diameter) tree-mold in Kilauea’s 2014 lava flow field just north of the town of Pāhoa (Hawaii, United States).
Hypothesis and Study Area
One of the most visited sites to observe lava-trees and tree molds is the July 1974 lava flow of Kîlauea, which flowed through two kilometers of Ohia forest leaving behind more than a thousand lava-trees (Lockwood and Hazlett, 2010; Jones et al., 2017; Chevrel et al., 2019). However, Ohia trees have thin trunks and the wood is relatively dry, both of which are factors that likely restrict their influence on lava flow cooling (cf. Anderson and Rothermel, 1965; Anderson, 1968; Uhl and Kauffman, 1990; Bilbao et al., 2001; Dickinson and Johnson, 2001; Babrauskas, 2002). Therefore, we chose the most recent eruptive episodes of Kilauea, i.e., the events that emplaced the 1983–2018 lava flow field (Heliker and Mattox, 2003). Across this lava flow field, the lava is relatively unweathered and the lava interacted with trees that are both larger and wetter than those of the July 1974 eruption. In this regard, following Thomas et al. (1964) and Van Wagner (1967), the presence of larger, wetter trees should also enhance any thermal interactions.
By 2002, Kilauea’s eruption that began in January 1983 had already covered an area of 105 km2 (Heliker and Mattox, 2003). Most of this lava area was emplaced onto vegetated land (Figure 1) that ranged from “wet forest and woodland” around the vent zone (700 m above sea level) to “lowland dry and mesic forest, woodland and shrubland” at sea level (Pratt and Gon, 1998). The interaction between active lava and trees was well-known (cf. Weisel and Stapleton, 1992), where between 12 May and 1 June 2002, alone, ingress of active lava flows into forest ignited fires that burned over 1,000 hectares (Global Volcanism Program, 2002). However, no study coming out of this long-lived eruption has, to date, considered interactions between lava and vegetation. Instead, the publications (more than 1,000 references between 1983 and early 2002; Heliker and Mattox, 2003) included provision of data and insights into:
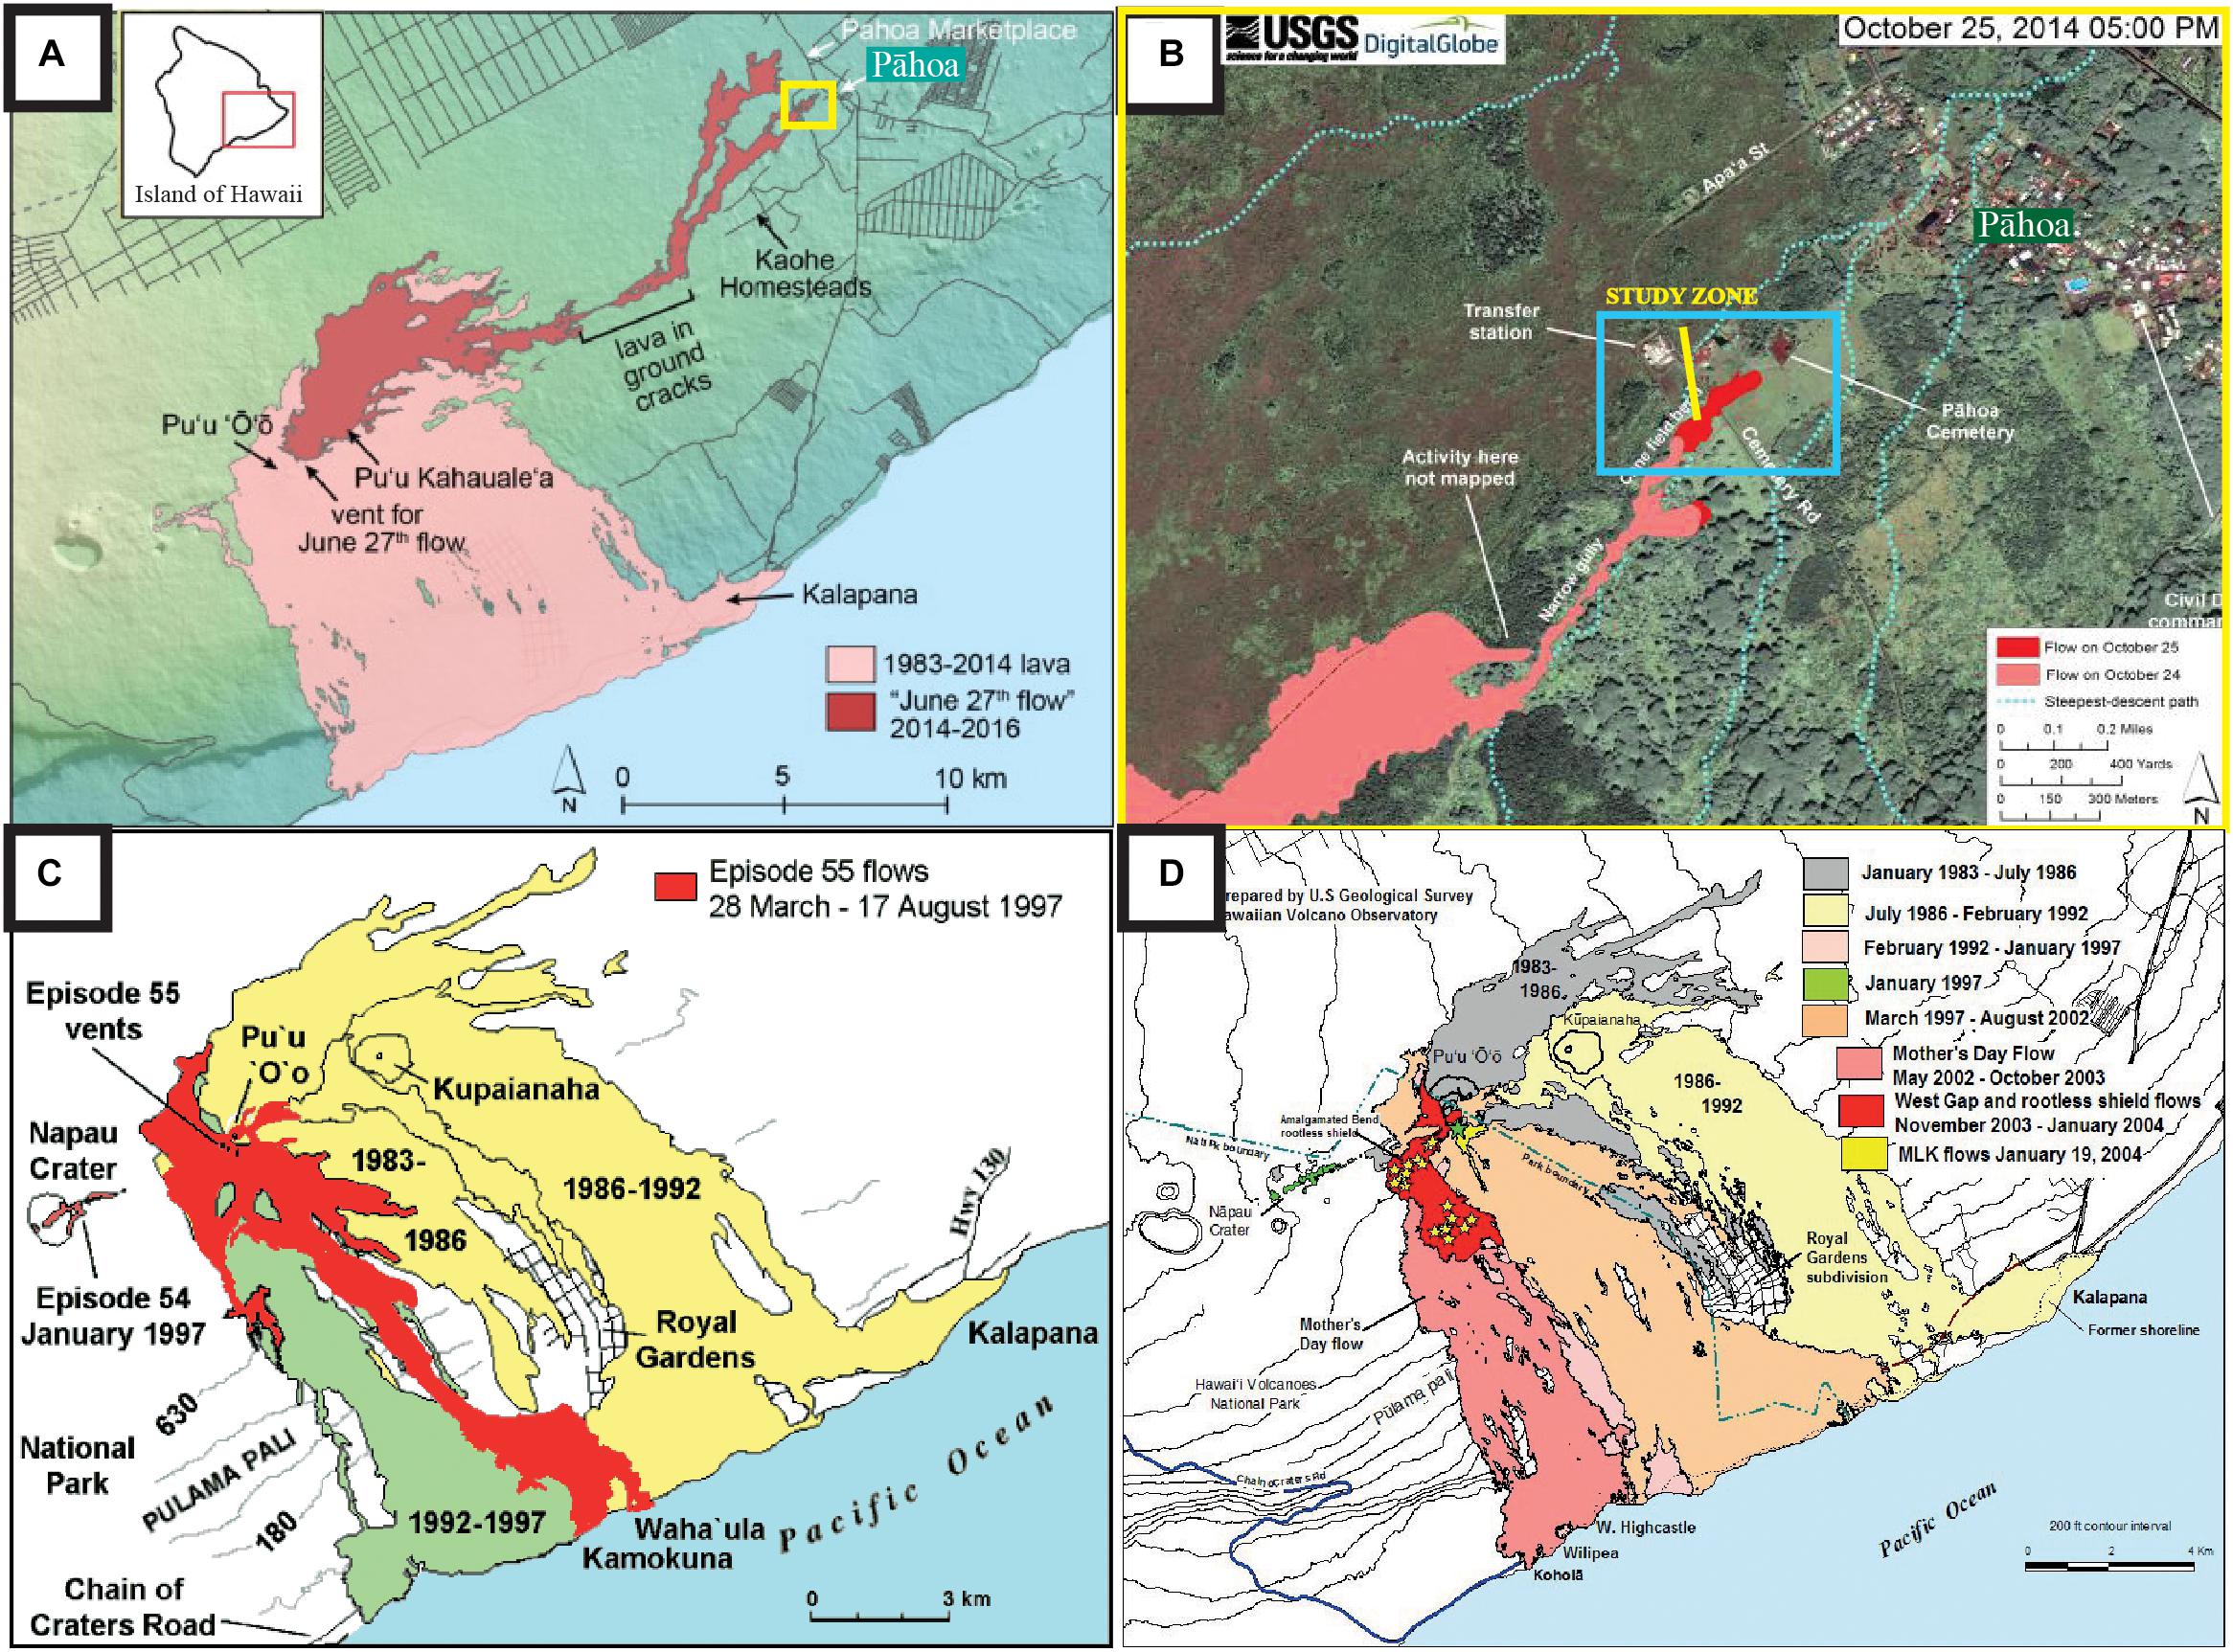
Figure 1. (A) Map of the “27th June” 2014-2016 lava flow field within the context of the Pu’u ‘O’o-Kupaianaha lava flow field (courtesy of USGS Hawaiian Volcano Observatory); location of map on the Big Island of Hawaii is given as inset (yellow box gives the enlargement given in (B). (B) Flow front positions of the “27th June” lava flow approaching Pāhoa the day before (24 October 2014) and after (25 October 2014) it engulfed the studied Albizia tree (map courtesy of Matthew Patrick, USGS Hawaiian Volcano Observatory). Blue box gives fields of view of helicopter-based photos given in Figure 3. (C,D) Maps of the Pu’u ‘O’o-Kupaianaha lava flow field as of August 1997 and January 2004 (courtesy of USGS Hawaiian Volcano Observatory).
(i) Cooling and crystallization down an active lava channel (Cashman et al., 1999);
(ii) Cooling rates down lava tubes (Helz et al., 2003);
(iii) Cooling rates of active pāhoehoe surfaces and interiors (Hon et al., 1994),
(iv) Variation of eruption temperatures with time (Thornber et al., 2003), and
(v) Validated heat loss models for lava flowing in tubes (Keszthelyi, 1995), inflating pāhoehoe (Keszthelyi and Denlinger, 1996) and tube-fed ocean entry lava flow (Harris et al., 1998).
Although detailed information on interaction between lava and vegetation were not provided, these publications allow a hypothesis for lava-tree interaction to be built and generation of a model to be compared with the tree-free cases cited above. We here use two examples to illustrate this. The first was ingress of lava into groves of Ohia trees around Pu’u ‘O’o during January 1997 and 2004 (Harris et al., 1997; Figure 1c), the second was invasion of palm trees at the Waha’ula Heiau and on Pulama Pali in 1997 and 1999, respectively (Harris and Thornber, 1999; Figure 1d). These observations allowed definition of a qualitative model whereby a tree mold is formed in three stages involving:
(i) Heating and drying of the tree (cf. Van Wagner, 1967);
(ii) Onset of combustion (cf. Bilbao et al., 2001);
(iii) Complete combustion to create a skylight (cf. Keszthelyi, 1995).
These three stages are illustrated in our collation of archived photographs given in Figure 2 which cover the invasion of:
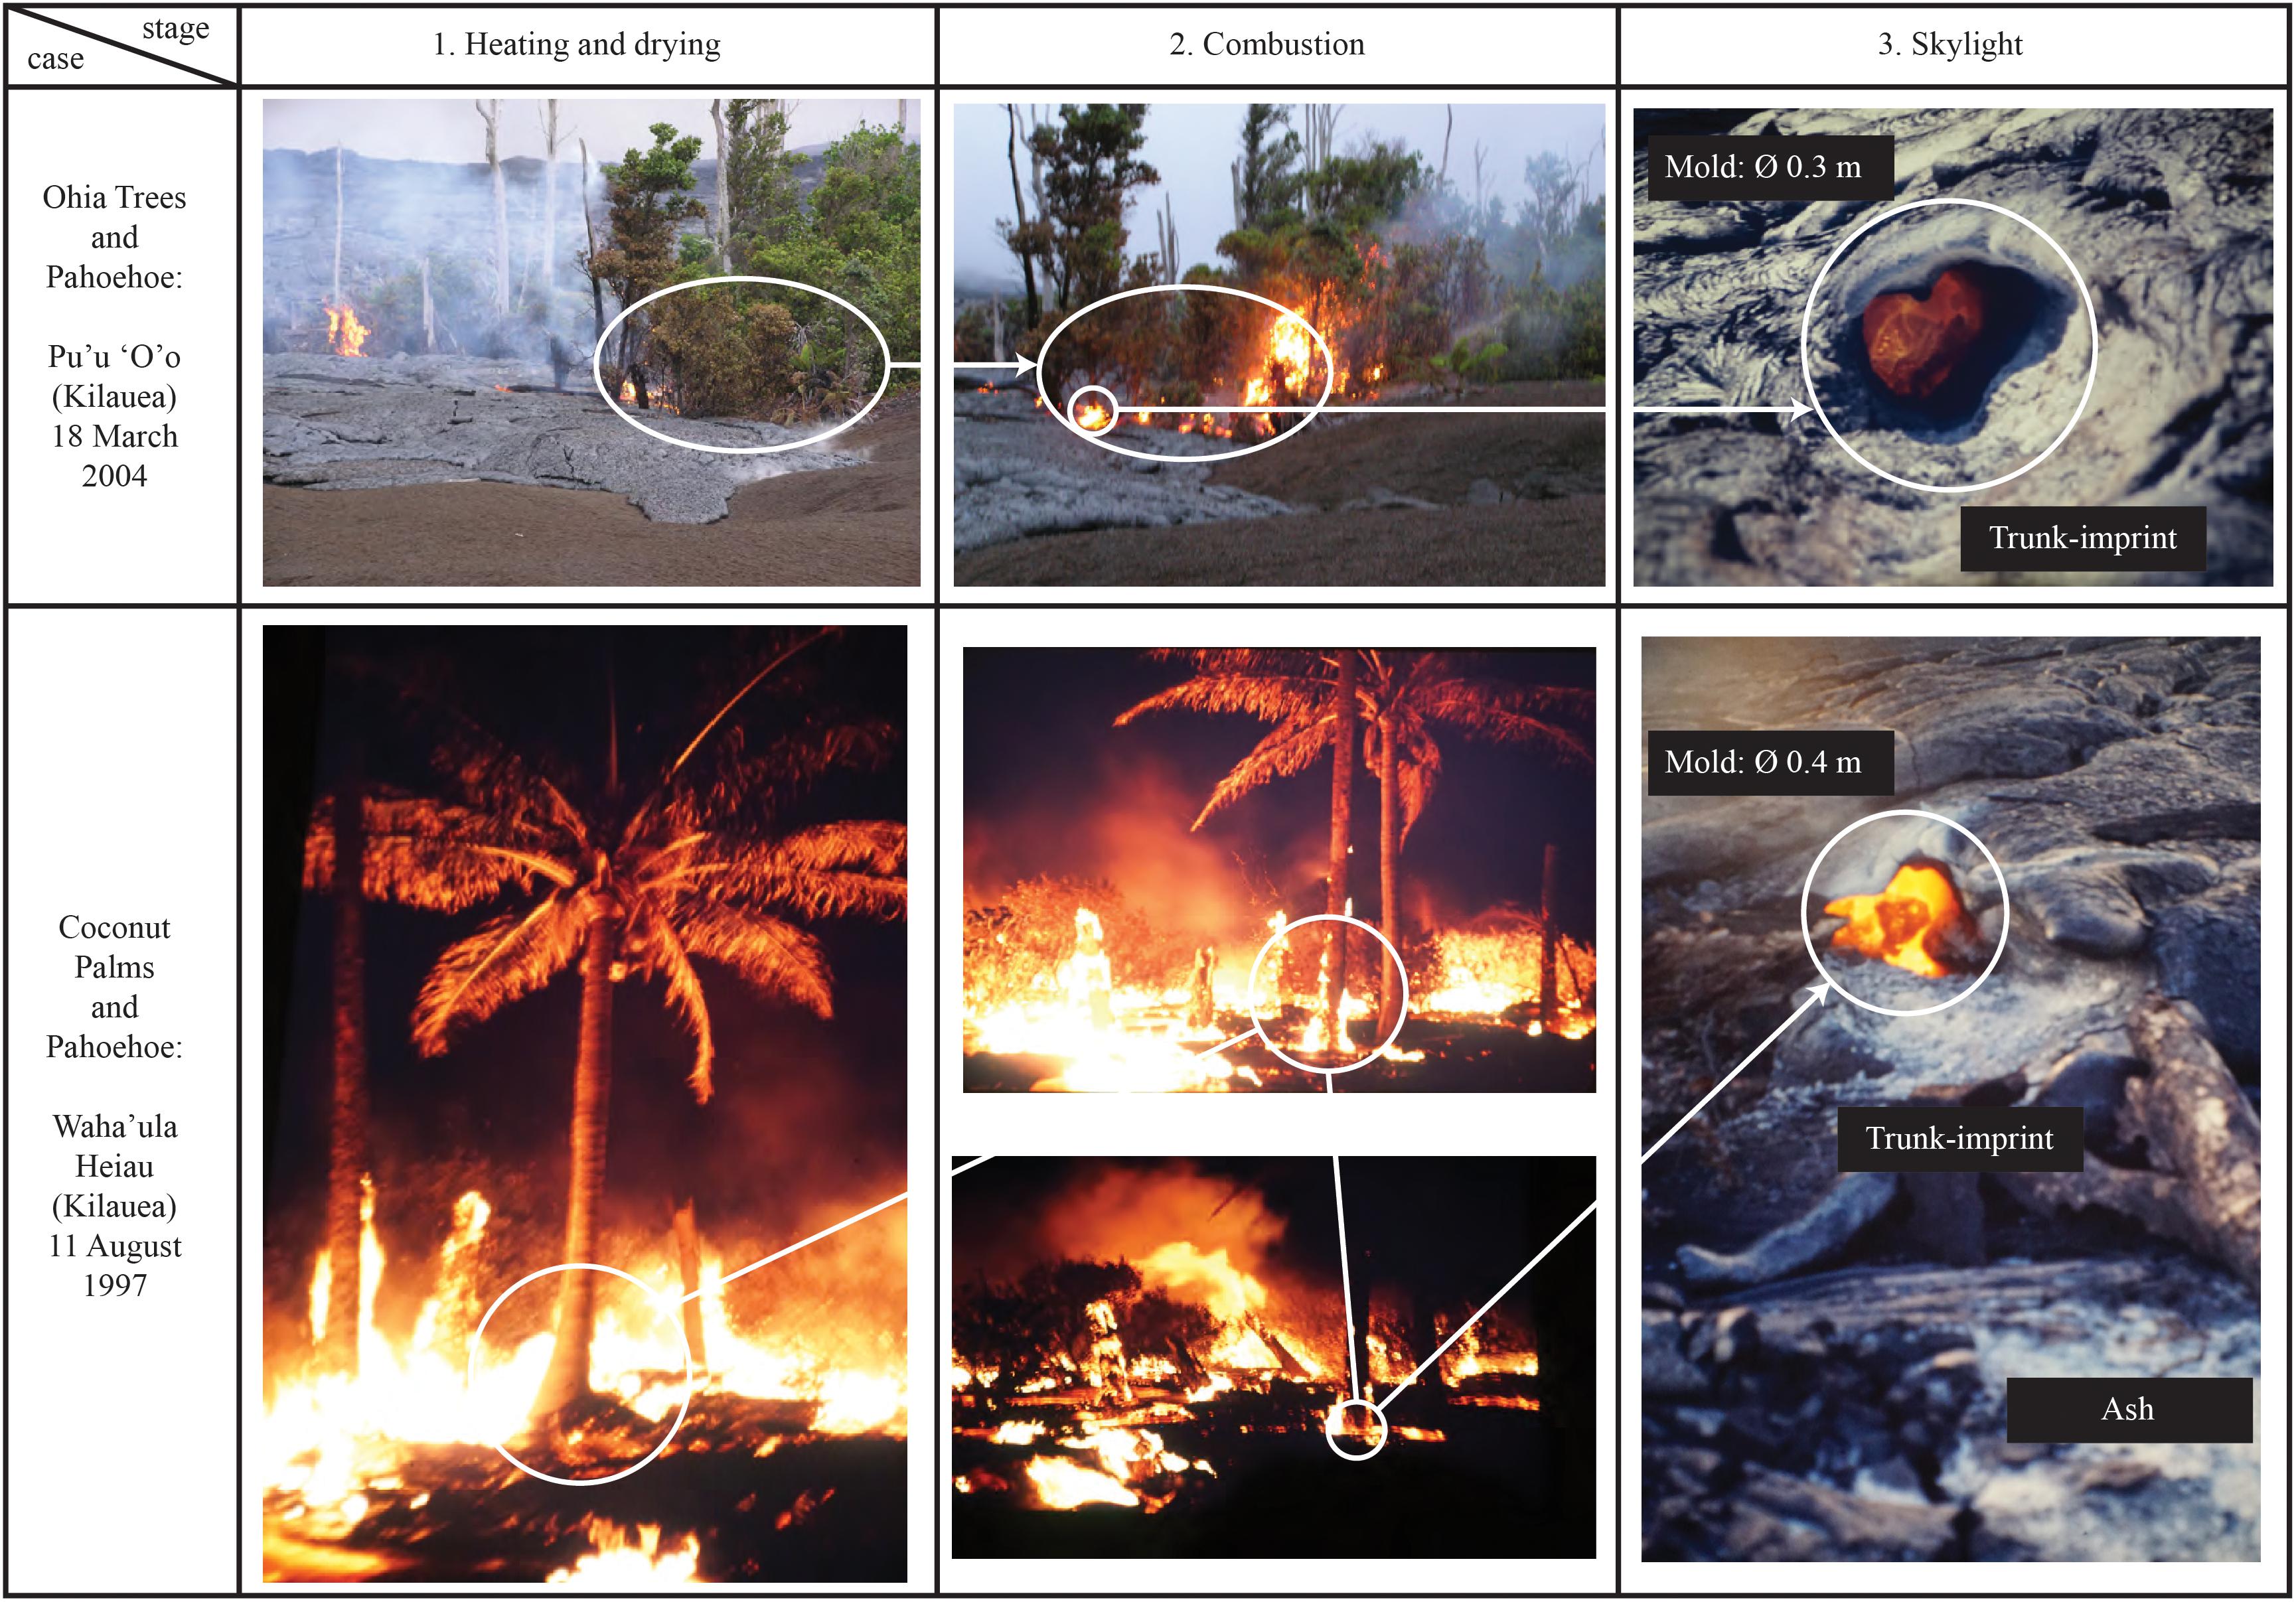
Figure 2. Two examples illustrating the three stages of the thermal model for heat losses involved in tree combustion and mold formation. In the upper example, pāhoehoe is moving through a stand of Ohia trees 1.5 km west of Pu’u ‘O’o (Kilauea). For scale, the trunk diameter of the highlighted tree is around 0.3 m. In the lower example, pāhoehoe is moving through coconut palms in the (now buried) Waha’ula Heiau site. Situated 120 m from the coast in Kilauea’s Puna district, this was one of Hawaii’s most important temple sites and included a sacred grove (Stokes, 1991), through which lava is here moving. For scale, the trunk diameter of the highlighted tree is around 0.4 m. In column 1 (Stage 1), trees are surrounded by lava, and are undergoing heating and drying, but combustion has not yet begun: no flames are yet apparent on the circled trunk(s). Column 2 includes images at the onset of combustion (Stage 2) where flames are now apparent on the trunks (small circle indicates zone of eventual tree mold site). In Column 3, combustion is complete and an open, incandescent mold remains in the lava representing a skylight of the same diameter as the original tree trunk and through which heat is lost from the interior of the lava during the third and final stage of the lava-tree interaction (stage 3). In both cases, the trunk has fallen onto the flow surface before burning away. Pāhoehoe inflating around the slow-burning wood lying on the surface has left an imprint of the trunk, which contains unburnt wood and tree ash.
1. Ohia trees by lava from the “amalgamated bend rootless shield” lava flow of March 2004 (Figure 1c), and
2. Coconut palms during burial of Waha’ula Heiau during the night of 10–11 August 1997 to set up the “Waha’ula ocean entry” (Figure 1d).
The Waha’ula Heiau burial event was particularly iconic as it involved burial of one of the most important Heiau (i.e., Hawaiian temple) in Hawaii, which included a sacred grove that contained at least one specimen of every tree growing on the Hawaiian island group (Stokes, 1991). In each lava-tree interaction event, we saw three stages (Figure 2). The first stage lasted tens of minutes to an hour or more, and involved surrounding of the tree by lava. During this stage the tree was heated and dried (hissing and sizzling could be heard due to the boiling of water), but no flames were observed (Figure 2). During the second stage, which lasted for a similar period and involved combustion, flames were seen emanating from the trunk (Figure 2). In the final phase (stage 3), the tree burnt through at its base (as buried in the lava) and fell onto the inflating lava flow surface to burn away in situ. The hole left in the lava flow then remained incandescent for several days (Figure 2). Thermocouple measurements made inside such a mold five days after the 30–31 January 1997 lava flow at Napau Crater (Figure 1c) recorded temperatures in excess of 900°C, at which point the connection to the thermocouple failed. In the first part of this paper (i.e., in the section “RESULTS”) we aim to quantify these interactions in terms of textural, chemical and thermal effects. In the second part (i.e., in the section “DISCUSSION”), we use these results to furnish and build a heat loss model for lava interacting with a living tree.
Albizia Tree Mold in the 2014 Pāhoa Lava Flow
We focus on a tree mold left by an Albizia tree engulfed by the 2014 lava flow (Pu’u ‘Ō’ō, Kīlauea) near Pāhoa village (Figure 1). This lava flow, called hereafter the Pāhoa lava flow, was active for 24 months between June 27, 2014 and June 8, 2016 (Poland, 2016; Patrick et al., 2017). It was erupted from Kilauea’s upper East Rift Zone, in the vicinity of Pu’u ‘Ō’ō and moved north-east through 20 km of rainforest for six months (Patrick et al., 2017; Figure 1). By August 6, the flow had arrived at the eastern extent of the Pu’u ‘Ō’ō lava flow field and started to enter the tropical rainforest. In late October, the flow advanced north-eastwards toward Pāhoa at 400 m/day, crossing Cemetery Road and covering Pāhoa’s cemetery (Patrick et al., 2017; Figure 3). As the flow approached Pāhoa it moved through partly wooded grassland where the studied Albizia tree stood (Figure 3), and began to threaten private properties and houses. A resurgence of lava supply, associated with summit inflation, created new breakouts that destroyed one house on November 10 (Patrick et al., 2017). Soon after, the lava supply to the flow front waned and, except for one large breakout, the flow front remained stalled during December 2014 and throughout 2015 (Patrick et al., 2017). According to pictures taken by the Hawaiian Volcano Observatory2, the tree, that is the focus of this study, was engulfed by lava during October 24–25, 2014 (Figures 3a–d). The tree was situated within 1 km of the final flow front that reached its maximum extent around three weeks later in mid-November (Patrick et al., 2017). The mold formed in inflated pāhoehoe about 35 m west of Cemetery Road and 150 m south of Pāhoa’s recycling (transfer) station (Figure 3). We chose this tree for two reasons: first, it was the only tree mold large enough to permit access down to its roots, thus allowing us to sample the entire lava flow thickness exposed in the mold walls from the top to the bottom of the flow (Figures 3f,g). Secondly, the unburnt part of the tree allowed the tree species to be identified as Albizia Saman. In this regard, the zone of Pāhoa is a well-known location of tree mold formation due to lava ingress into stands of large, mature Albizia trees (R. Hazlett, personal communication). It is a common species growing on substrates of old, weathered basaltic lavas found on the island of Hawai’i (Kepler, 1990), and is well known for its fire resistance which is, in turn, related to its high moisture content of up to 60% (mean = 54%)3 (Wood Data Base, 2019). Albizia is a genus of about 150 species of fast-growing subtropical and tropical trees and shrubs in the subfamily of Mimosoideae of the family Leguminosae (Kepler, 1990). Also known as the “Monkeypod”, Albizia typically grows up to a height of 15–24 m (Kepler, 1990). In addition to samples of the 2014 flow collected around the Albizia tree, we used some samples collected from lava-trees formed during the July 1974 eruption of Kilauea (here after called J74) that inundated a forest of Ohia trees (Chevrel et al., 2019). Ohia trees, or Mestrosideros polymorpha of the Myrtaceae (Myrtle) family, are different from Albizia trees in that they are endemic to Hawaii (Ziegler, 2002), and are smaller (being as short as 3 m; Greenwell et al., 2009) and denser (dry wood density3 : 915 versus 600 kg m–3) (Wood Data Base, 2019).
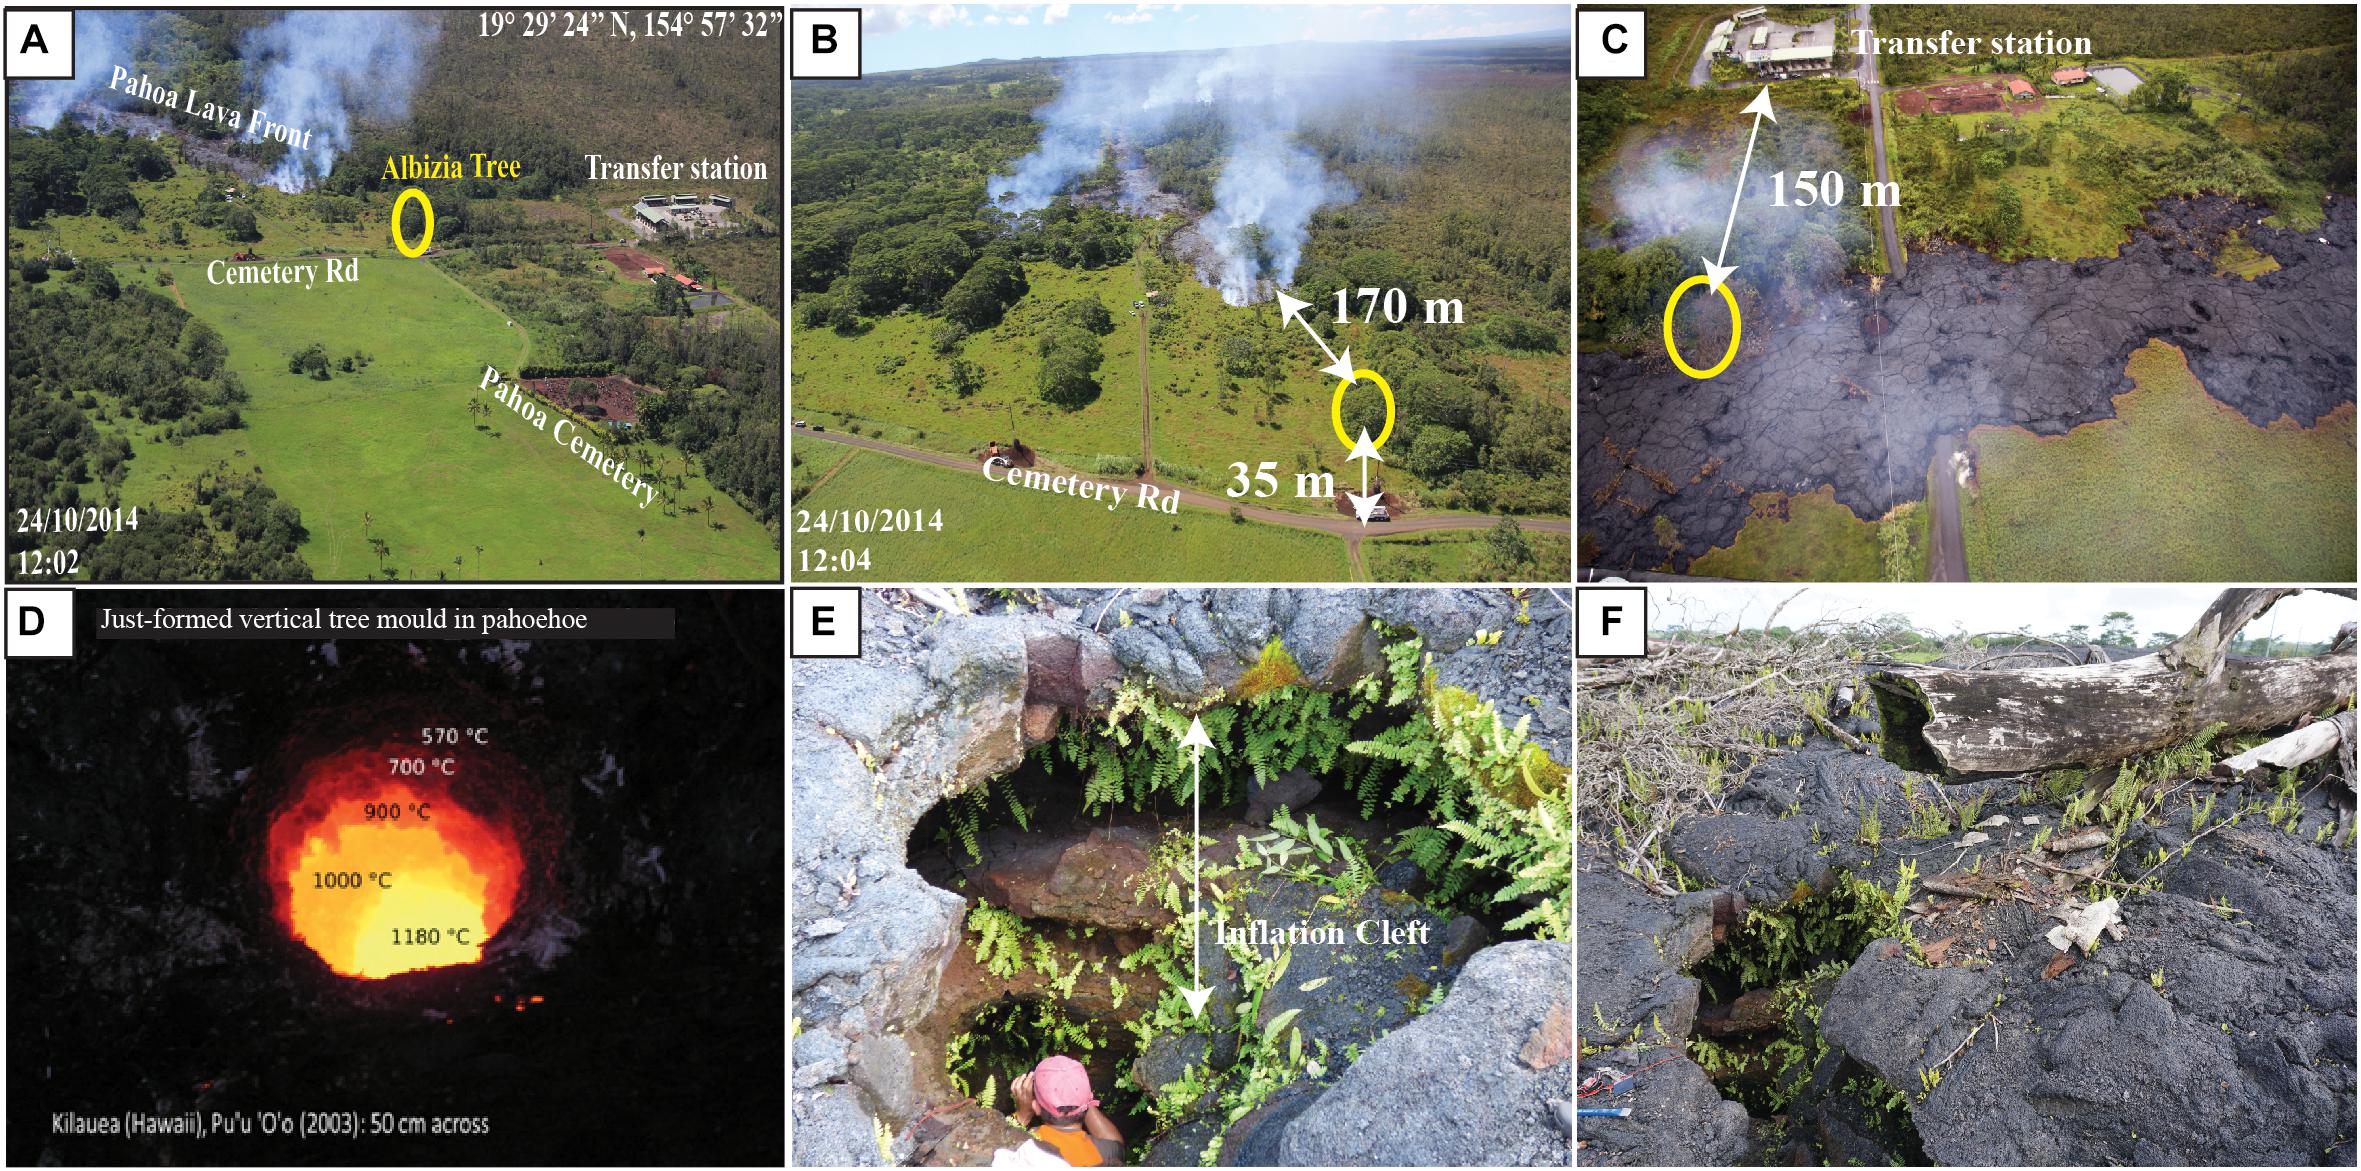
Figure 3. (A,B) Helicopter-based photos of the lava flow front, transfer station, cemetery road and the studied tree location (yellow circle) taken on the 24 October by M. Patrick (USGS Hawaiian Volcano Observatory). (C) Helicopter-based photo of the “27th June” lava flow in the vicinity of Cemetery Road with the distance between the transfer station and the studied tree mold (photo courtesy of M. Patrick, USGS Hawaiian Volcano Observatory). (D) Recently created tree mold in a cooling pāhoehoe lava flow from Pu’u ‘Ô’ô (2003) with color-based temperatures (cf. Appendix of Harris, 2013). (E) View into the tree mold examined here in its inflation cleft (for scale, width of mold at base is 0.9 m). (F) View of the burned and felled tree portion (for scale trunk is 0.6 m in diameter).
Materials and Methods
Mapping and Sampling
The tree mold and unburnt remains (i.e., the trunk left felled on the lava flow surface) of the studied Albizia tree were mapped in vertical and basal cross sections, and all dimensions were measured (Figure 4). Six decimeter-sized samples were collected around the tree mold, including four from where the tree was in contact with the lava (Figure 4). These were collected from the bottom (BOT), middle (MID), about 20 cm from the top (TOP2) and at the top (TOP1) of the tree mold. All samples included the lava surface that was in contact with the tree plus a 10–20 cm thickness of lava behind the contact (Figure 4). The sample collected in the middle (MID) was large enough to be cut into two, separating the part in contact with the tree (MID-A) from a part that was 10 cm away from the tree-lava contact (hereafter named MID-B; Figure 4). For two of these samples (BOT and TOP2) we extracted the contact with the tree surface, hereafter referred to as tree mould surface (TMS) samples. The TMS samples were either selected by slicing the 5 mm layer of the rock sample at the contact (TOP2-TMS) or by handpicking chips of the tree mold surface (< 1 mm) (BOT-TMS, TOP2-TMS2). Additionally, a sample was collected from within the root bowl (2BO; Figure 4). Finally, another lava sample was collected 40 m from the tree to serve as a control sample (CN), where textures were typical of the non-affected lava flow − a smooth surfaced, S-Type pāhoehoe following the classification of Wilmoth and Walker (1993). We also collected a sample from a small log of a living Albizia growing 200 m from the mold site.
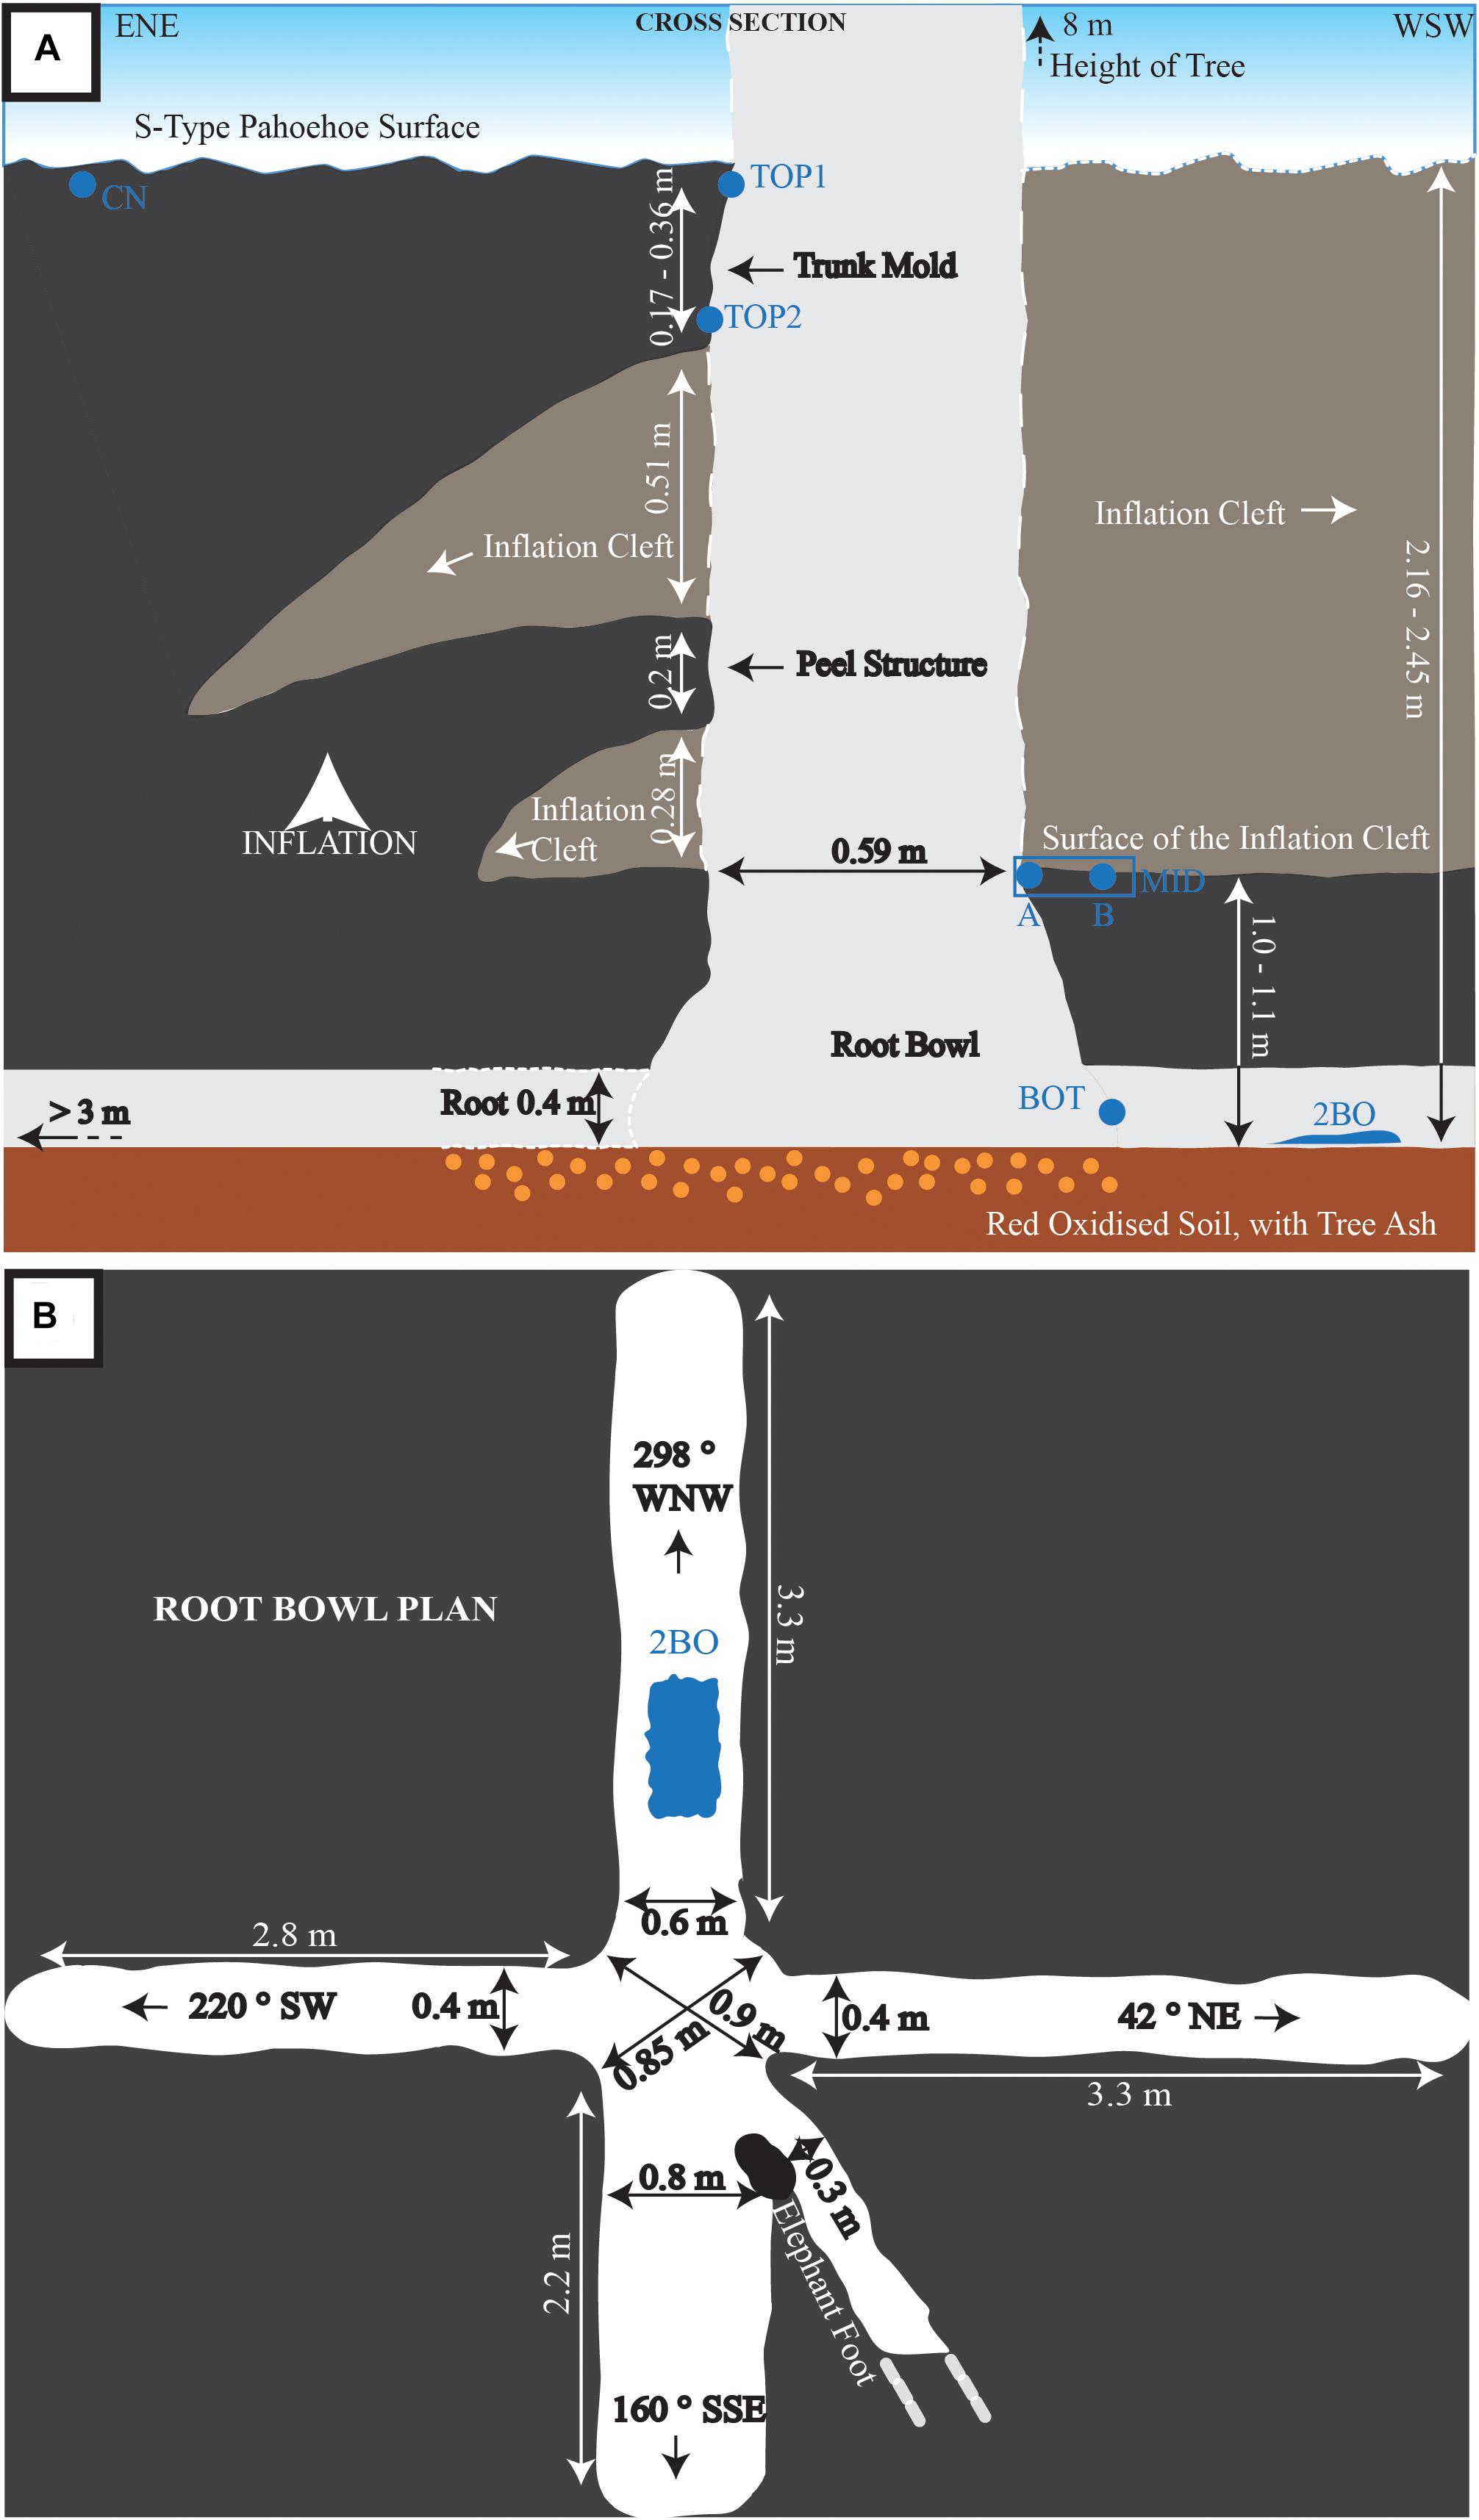
Figure 4. (A) Plan in vertical section of the studied tree mold and its inflation cleft (light brown). In blue are the sample locations. The area once occupied by the standing of tree and its root system is given in gray, and new lava is black. Orange dots denote location of tree ash. (B) Plan in basal cross section of the root bowl.
Two other samples were taken from the J74 lava flow from two lava-trees situated at 0.9 and 1.5 km from the vent (T5 and T3, as respectively named in Chevrel et al., 2019). These samples are described in detail in Chevrel et al. (2019) and represent the best-preserved, least-weathered tree mold surfaces from this sample set. Chips from the layer that was in direct contact with the tree were also handpicked (T3-TMS and T5-TMS). A complete table defining the analyses conducted on each sample is given in Supplementary Table 3.
Textural Analyses
To quantify the proportion and size distribution of vesicles and crystals, thin sections and cut surfaces of CN, TOP1, TOP2, MID-A, BOT and 2BO were digitally scanned and backscatter SEM images collected. For each sample, three to six images were taken at a magnification of 25× (for a total of 32 images), and three at 100× were taken from each 25× image, (for a total of 56 images, see example for BOT in Supplementary Materials 1Supplementary Figure 3). Images were then processed using the MATLAB-based program FOAMS (Shea et al., 2010) to obtain the spatial arrangement, size, and number of vesicles and crystals, thus allowing construction of vesicle and crystal size distributions (VSD and CSD, respectively). The minimum size that could be measured by FOAMS was 6 μm for crystals, and 50 μm for vesicles. The CSD values were acquired from 2D raw data, characterizing crystal major and minor axis values. These data were transformed into a 3D crystal habit (long, intermediate and short axis) through the CSDslice database (Morgan and Jerram, 2006) and processed in the frequency data input section of the CSDcorrections 1.52 program of Higgins (2000). Following Thivet et al. (2020a, b), there are three key parameters that can be constrained following such processing. The first is the crystal number per unit area or normalised size frequency data (Na). This is the most appropriate input to use in the frequency data section of CSDcorrections, as the raw data of crystals from FOAMS are obtained from several nested image magnifications, while CSDcorrections is based on just one magnification. The second parameter is the measured area corrected for porosity as measured with FOAMS, with a correction factor between zero (100 vol.% porosity) and one (0 vol.% porosity). The third parameter is crystal shape, which was approximated by an ellipse major axis with a roundness factor of 0.3 based on visual observations [crystals are not perfectly euhedral, and are intermediate within the range 0 (block) and 1 (ellipsoid)]. This procedure is a requirement to enable correct stereological conversion of 2D crystal size measurement to 3D CSDs by combining FOAMS and CSDcorrections. Here we considered the crystals in terms of their quantity, distribution, size and shape, as these rigid element parameters will affect the rheology (cf. Pinkerton and Stevenson, 1992; Mader et al., 2013) and reflect cooling processes in the lava (cf. Crisp et al., 1994; Cashman et al., 1999; Kolzenburg et al., 2017). Density measurements were conducted on rock samples that were dried in an oven at 70°C for 24 h. The bulk density of the samples was measured via the Archimedes method using samples wrapped with Parafilm (Shea et al., 2010). The dense rock equivalent (DRE) was then determined by measuring the volume of the powdered samples using an Accupyc 1340 Helium Pycnometer. Finally, the porosity of all rock samples was derived by applying the formula of Houghton and Wilson (1989).
Chemical Analyses
Bulk rock major element analyses were carried out on four samples (TOP2, TOP2-TMS, 2BO and CN) to characterize any compositional differences between tree-contact lava (TOP2) and the control sample (CN), as well as between the tree mold and the root bowl (2BO). Additionally, sample TOP2-TMS was analyzed to compare with the bulk TOP2 sample. Samples were powdered (≤ 100 μm) with a PM100 Retsch planetary crusher at the Laboratoire Magmas et Volcans (LMV, Université Clermont Auvergne, France). Bulk rock major elements were analyzed using Inductively Coupled Plasma-Atomic Emission Spectroscopy (ICP-AES).
Trace element concentrations were analyzed for four bulk samples (CN, TOP2, T5 and T3) and for five TMS samples (TOP2-TMS, TOP2-TMS2, BOT-TMS, T5-TMS, T3-TMS). Trace elements were analyzed using an Inductively Coupled Plasma-Mass Spectrometer (ICP-MS). For major element analysis, powdered samples were mixed with LiBO2, placed in a graphite crucible, and melted in an induction oven at 1050°C for 4.5 min, resulting in a homogeneous glass bead. The glass was then dissolved in a solution of deionized water and nitric acid (HNO3) and finally diluted by a factor of 2000. The final solutions were analyzed using a Jobin-Yvon Ultima-C ICP-AES. Trace element concentrations were analyzed following a method modified from Vlastélic et al. (2013). About 100 mg of sample (powder and chip) was dissolved in 2 mL of 28 M HF and 1 mL of 14 M HNO3 in a Teflon beaker for 36 h at 70°C. Solutions were evaporated to dryness at 70°C. The fluoride residues were reduced by repeatedly adding and evaporating a few drops of concentrated HNO3 before being fully dissolved in ca. 20 mL of 7 M HNO3. These solutions were diluted by a factor of 15 with 0.05 M HF (to reach a rock dilution factor of ca. 4000) and trace element abundances were determined with an Agilent 7500 ICP-MS. The analyses were performed in plasma robust mode (1550 W). The reaction cell (He mode) was used to reduce interference on masses ranging from 45 (Sc) to 75 (As). The signal was calibrated externally (every four samples) with a reference basaltic standard (USGS BHVO-2) prepared similarly to the other samples, and using the GeoReM recommended values4. For elements that are not well characterized in the literature (As, Bi, Tl), or which show evident heterogeneity (e.g., Pb) in BHVO-2 powder, the signal was calibrated using the certified concentrations of a synthetic standard, which was also repeatedly measured. The external reproducibility (2σ error) of the method is 6% or less for lithophile elements and 15% or less for chalcophile elements.
Additionally, we carried out volatile analysis on the same set of samples as for trace element analysis, using a CHNS-O Flash analyzer 2000 equipped with an MAS200R autosampler (Thermo Fischer Inc.). For this analysis, 10 mg of powdered sample was mixed with 10 mg of V2O5 to optimize combustion, and flash combustion was carried out at 1800°C. Volatiles were then separated by a chromatographic column and analyzed with a thermal conductivity detector.
Mineral and glass chemistry analyses were carried out on the polished thin sections of CN, TOP1 and BOT using an electronic microprobe CAMECA SX 100 (at 15 KeV with a 15 nA and 8 nA current beam for minerals and glass, respectively). Compositional data were then used to determine lava temperature using the Helz and Thornber (1987) and Putirka et al. (2007) geothermometers. Chemical maps were also produced from thin sections or polished chips with the Scanning Electron Microscope JEOL JSM-5910 LV. Additionally, we prepared double-polished samples (TOP1 and TOP2-TMS2) to characterize any spatial heterogeneity in H2O and CO2 concentration at the tree contact using Fourier Transform Infrared Spectroscopy (FTIR). This was carried out using a Bruker Vertex 70 spectrometer coupled with a Hyperion microscope system following the methods given in Mercier et al. (2010).
Thermal Analyses
To better constrain the cooling effect on lava textures, measure the dissolved water content in partially crystallized samples, and characterize the different steps of wood combustion, we used simultaneous thermo-gravimetric analysis (TGA) and differential scanning calorimetry (DSC). These analyses were carried out on samples CN, TOP1, TOP2-TMS and BOT-TMS, together with the wood sample. We used a TA Instruments SDT Q600 and a NETZSCH STA449C Jupiter TGA-DSC-MS at Lancaster University (United Kingdom), employing methods already used for analysis of volatile-poor volcanic rocks by Tuffen et al. (2010), Denton et al. (2012), and Applegarth et al. (2013), and to wood samples by Gašparovič et al. (2010).
The TGA technique continuously measures sample weight during a controlled heating program, providing total volatile concentrations and characterization of degassing patterns. DSC data characterizes heat flow within the sample, recording events such as crystallization, with peak areas directly proportional to the enthalpy change during the phase transition (Applegarth et al., 2013).
In parallel with the TGA-DSC analysis, three qualitative experiments of wood combustion were performed at Lancaster University. Three different-sized (2 × 1.5 mm diameter, 3 × 5 mm and 5 × 5.5 mm) cylinders were prepared from the collected sample of Albizia wood and their weight and volume recorded. Cylinders were then individually placed in a Carbolite Gero 30–3000°C oven and heated in air from ambient to 400°C at 30°C min–1. The duration of wood combustion and post-combustion sample mass were recorded. In order to examine the effect of wood grainsize on the decomposition reaction we carried out two experiments on wood powder with different grainsizes (500–125 μm and 250–106 μm). Sample preparation, measurement error and reproducibility, heating programmes, and DSC calibration are described in detail in Supplementary Materials 3 Supplementary Figures 5, 6 and Supplementary Table 4.
Results
Morphology of the Tree Mold
The studied tree mold, where the trunk stood while being heated and burnt by the surrounding lava flow, is approximately cylindrical and is 2.2 m deep and 0.59 m wide. A cavity at the base of this vertical mold is approximately circular in plan and semi-circular in section (Figures 3f, 4a,b). This cavity is a root bowl of 0.9 m diameter and 1 m in height, and has four major roots spreading radially away from it along the lava-substrate interface (see Figure 4b for exact measurements). Cavities left by the burnt-out roots are as wide as 0.8 m, can be followed for up to 3.3 m, and wood-ash covers a red oxidized soil along the floor of each root. The mold itself displays two inflation clefts on one side of the mold (0.5 and 0.3 m high, respectively) and one large open inflation crack on the opposite side, giving access to the root bowl (Figure 4a). The tree mold displayed oxidation rings, with lava color changing from red/brown near the surface to more metallic tones toward the base (i.e., TOP2 is less metallic than 2BO), and a gray/black color away from the contact. The top of the tree mold shows clear imprints of the tree bark with remnant charcoal and ash within samples.
Next to the mold, the unburnt trunk remains (Figure 3f). Immersed in inflating S-type pāhoehoe, the base of the tree eventually burnt through and the 5.4 m long exposed part of the trunk fell onto the lava flow surface. In total, the entire trunk was thus 7.6–7.9 m high (mold length plus unburnt trunk lying on the lava flow surface). The combusted length of the trunk thus varies between 2.2–2.5 m (equal to the mold depth), where the non-combusted length was 5.4 m long. The lowermost 1.15 m of the felled trunk was charred; the uppermost 4.25 m was gray and barkless. Branches and canopy of the felled tree added a further 18 m to the height, meaning the total height of the tree was 24–25 m.
Petrography and Texture
All lava samples (CN, TOP1, TOP2, MID, BOT) have a porphyritic to glomeroporphyritic texture with phenocrysts and microlites of olivine, plagioclase and minor pyroxene, within a glassy or microlithic matrix. Most phenocrysts are euhedral, with zoned plagioclases and frequently broken, subhedral olivines. Vesicles are typically extensively interconnected and characterized by convoluted, irregular shapes. The two samples away from the tree contact (CN and MID-B) are qualitatively distinguishable from the TMS samples. Sample CN displays higher crystallinity and vesicularity, whereas MID-B contains rounder, non-connected vesicles. In contrast, the tree-contact samples (TOP2, MID-A and BOT) have a distinctive, thin (0.5 mm) vesicle-rich layer that is not observed in far-field sample CN. There are no other significant textural variations from the top to the bottom of the tree mold (see Supplementary Materials 1Supplementary Figure 3). Root bowl sample 2BO presents a markedly different texture from the other samples, with a metallic, non-glassy surface. The veneer of this sample is similar to that found in lava tube linings, which often have smooth, glazed red-to-gray surfaces (cf. Allred, 1998; Calvari and Pinkerton, 1999).
Sample densities vary between 1550 and 2230 kg m–3, with a mean of 1895 ± 200 kg m–3 (Table 1). The Dense Rock Equivalent (DRE) is 3010 ± 10 kg m–3 (measured with four powdered samples; CN, TOP2, TOP2-TMS and 2BO). Sample CN is the least dense sample (mean of 1550 kg m–3), while TOP1 density (mean of 1790 ± 100 kg m–3) is intermediate between CN and all other samples (Table 1). There are no other vertical variations in density within the remainder of the tree mold.
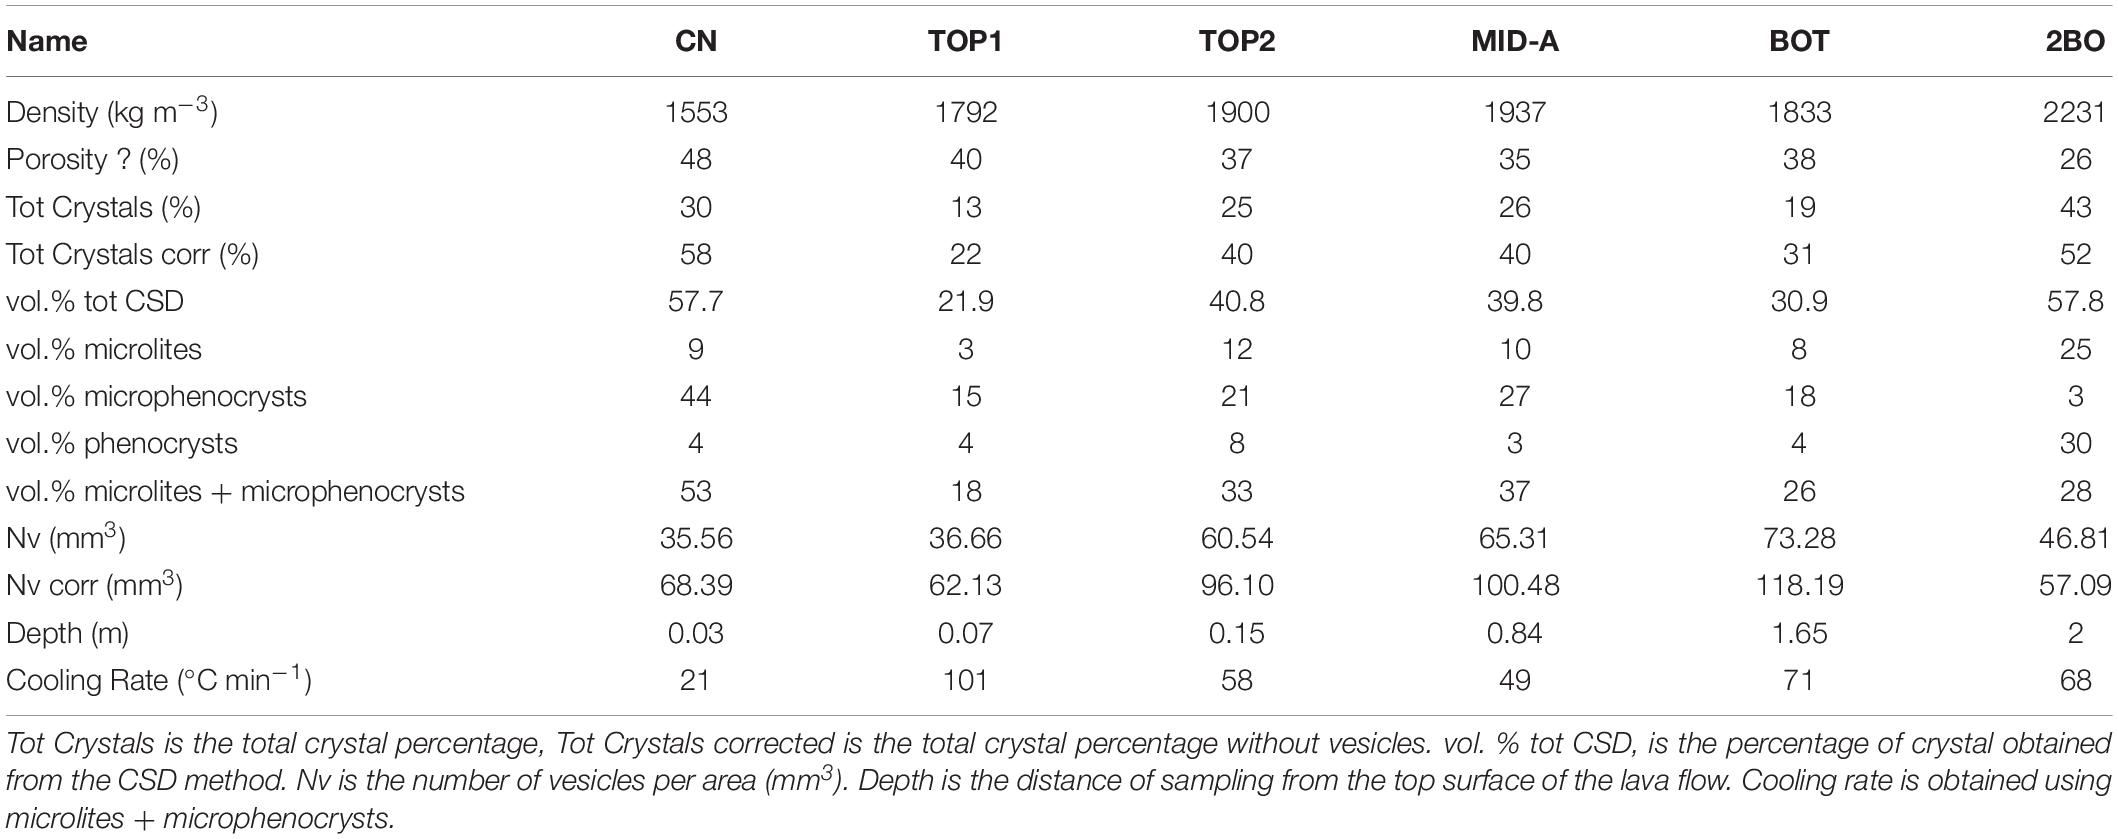
Table 1. Summary table for textural parameters measured in this study.
Sample porosities span 26–48% (mean values in Table 1) and are shown in Figure 5. Heterogeneous porosity is observed with distance from the tree and occurs over two spatial scales: firstly, between the lava-tree contact samples (TOP1, TOP2, MID, 2BO) and distal sample CN, and secondly, within each sample at the tree mold. CN and TOP1 samples are more porous (48% and 40%, respectively), which may reflect buoyant rise of vesicles toward the lava flow surface (Wilmoth and Walker, 1993). Otherwise, all samples collected at the tree mold have a lower porosity (close to, or in, the P-Type pāhoehoe field) than CN (which is in the S-Type field; Figure 5). In this regard, we use S-Type and P-Type pāhoehoe to define the density or degassing state of the lava, where the “S” in S-type stands for “spongey” to evoke the vesicle-rich nature of the sample, and the “P” in P-type stands for “pipe-(vesicle-bearing)” as such lava sometimes contains vertical pipes (Wilmoth and Walker, 1993). The key distinction is that P-Type is more degassed, and hence denser, than S-Type (Harris et al., 2017), where we use the vesicle content of 30–40% to distinguish between the two, based on data collated in Harris and Rowland (2015). Porosity at the tree contact varies between 26–40%, with the highest values at the surface (TOP1) and the lowest value in the root mold (2BO; Table 1). The latter sample has very small (0.5 mm) rounded vesicles that appear largely isolated. However, the connectivity measurements performed with the He-pycnometer give values of vesicle connectivity and/or fracturing of 99% for all samples.
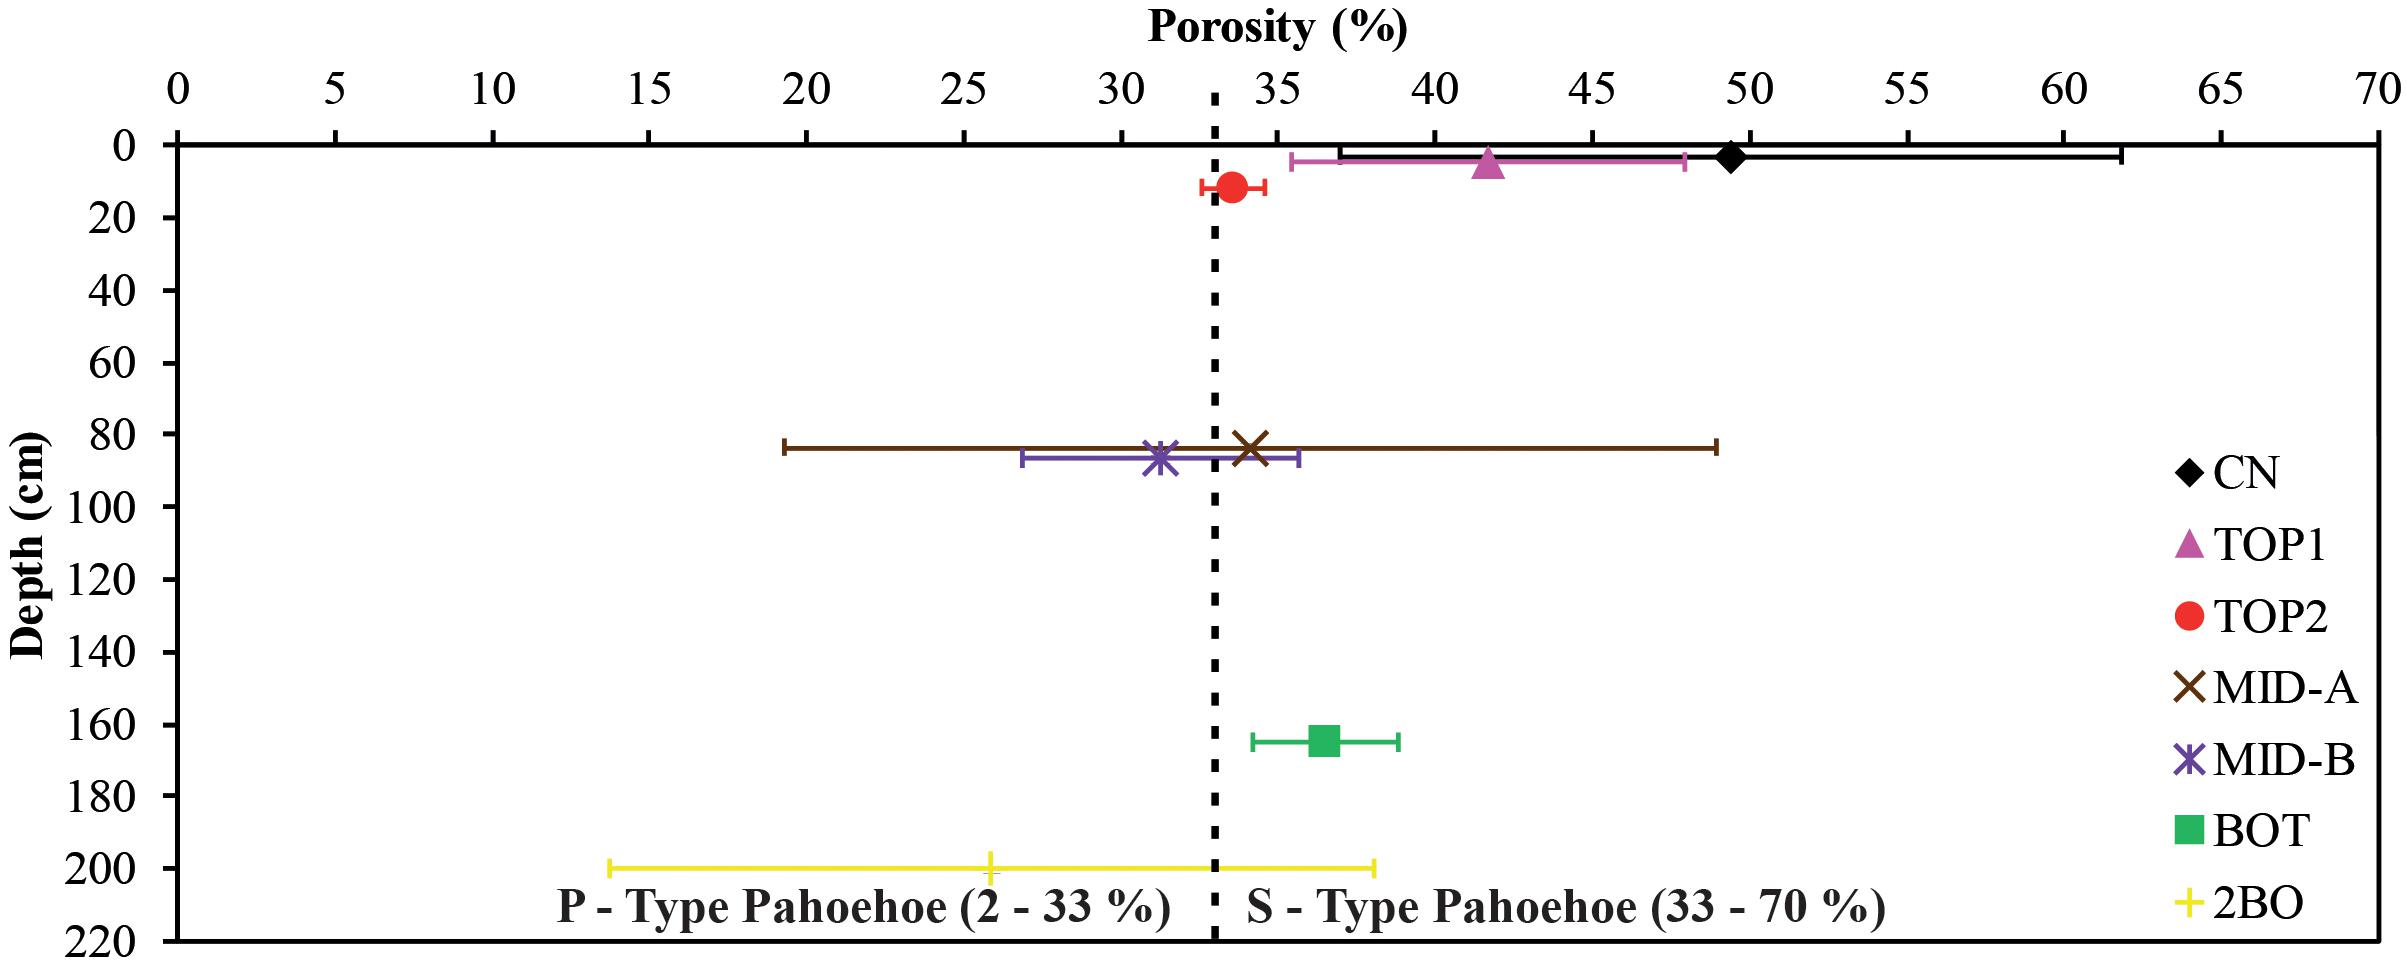
Figure 5. Density-derived porosity as a function of depth in the mold (median value with range for each sample). The vertical-dashed line defines the porosity-defined limit between S-Type and P-Type pāhoehoe lava, as taken from data in Cashman et al. (1994), Harris and Rowland (2015), and Harris et al. (2017).
Cumulative vesicle size distribution, normalized to the control sample CN, shows differences between tree-contact and far-field lava (Figure 6). All tree-contact samples have a higher vesicle volume fraction, and, with the exception of surface sample TOP1, the enrichment factor of vesicles in the predominant 2–3 mm range is 30–55 times that found in CN. However, the proportion of vesicles between 3–4 mm is lower than CN. The root bowl sample (2BO) is enriched in 0.5 mm vesicles relative to CN. The full vesicle size distributions for each sample are provided in Supplementary Materials 1Supplementary Figure 1.
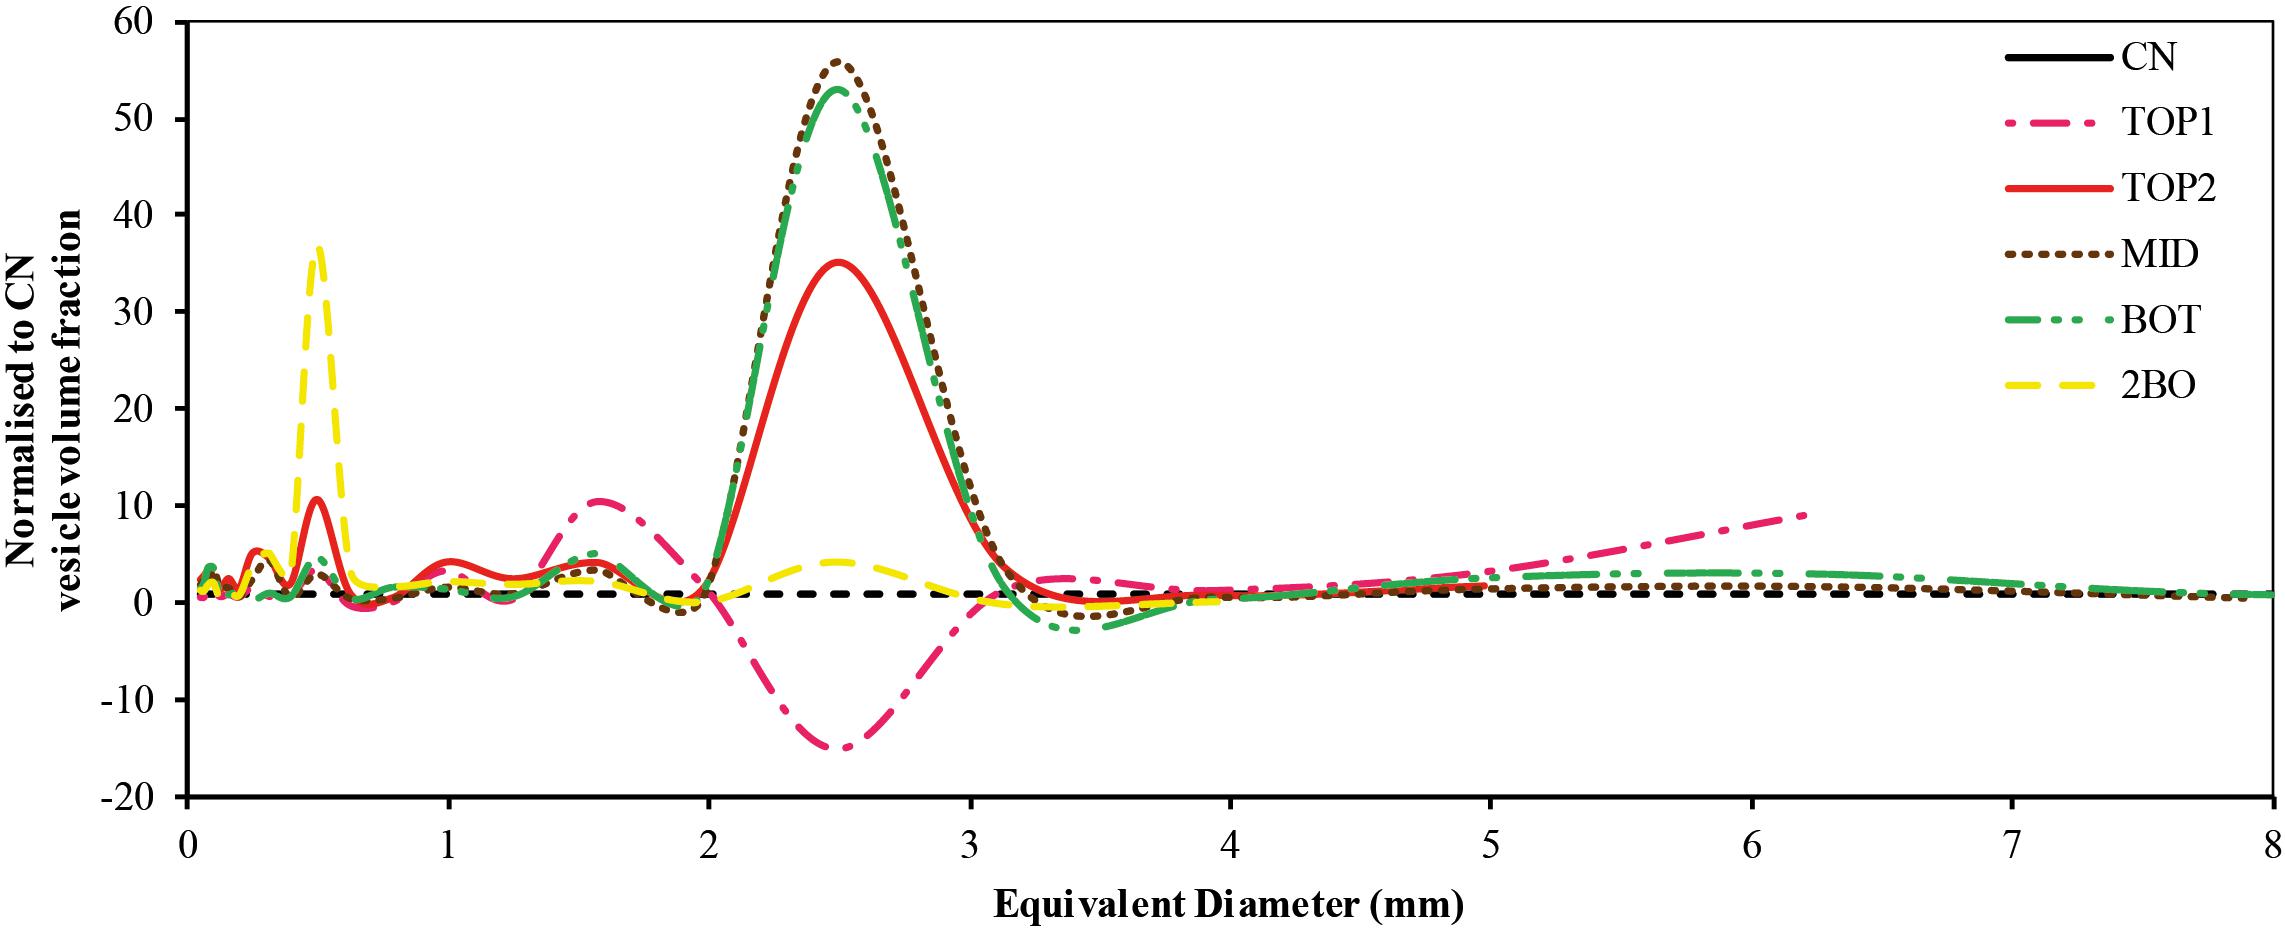
Figure 6. Cumulative vesicle size distribution normalized to the control sample (CN). Most of the samples show an enrichment in vesicle size between 2 and 3 mm. TOP1 has seen a coalescence phenomenon which explains the depletion in the 2–3 mm range and increase > 5 mm (Thivet et al., 2020a).
The total vesicle-free crystal volume proportion varies between 22% (TOP1) and 58% (CN), with a mean of 42% (Table 1). The crystal population densities (CSD, Figure 7) for all the samples range from −10.3 to 13.2 (ln of population density, mm4) and are, as typical, inversely correlated with crystal length (i.e., the trends indicate smaller populations of larger crystals). The CSD slopes are not linear, with all lava samples displaying upwardly concave CSD curves, a pattern that has been observed in other volcanic rocks (Marsh, 1998; Witter et al., 2016). Population densities are relatively consistent between samples in the < 0.5 mm size fraction (TOP2 and 2BO show the highest crystal density per mm4, i.e., 12.6 and 13.2 respectively, Supplementary Materials 1Supplementary Figure 1), but greater inter-sample variation occurs at larger size fractions (> 1 mm). Three samples (CN, TOP1 and BOT) have crystals > 10 mm in length. CSDs can be divided into at least three crystal families (microlites, micro-phenocrysts and phenocrysts in Figure 7), following the terminology of Gurioli et al. (2014) and Salisbury et al. (2008), where crystals of plagioclase in size ranges < 0.11 mm, 0.11–1.2 mm and > 1.2 mm are considered to be microlites, microphenocrysts and phenocrysts, respectively. A major change in crystal size is represented by a change in slope in the CSD curve (Figure 7), where each break in slope reflects a discrete nucleation event (Thivet et al., 2020a). The exact crystal size at which the slope change occurs differs from sample to sample. The lower slope change occurs at 0.18 mm for TOP2, below which all crystals are microlites, up to 0.47 mm for BOT. The upper limit varies from 0.92 (TOP2) to 5 mm for CN, above which all crystals are considered to be phenocrysts. Both limits concur with the description of Marsh (1998). A fourth population is distinguishable in three samples (CN, TOP1 and MID-A; see Supplementary Materials 1Supplementary Figure 2 for each detailed sample CSD) with a break in slope at 1.2 − 2 mm. It thus lies within the microphenocryst range, shows a possible sub-division in the microphenocrysts, and extends the number of nucleation events to four.
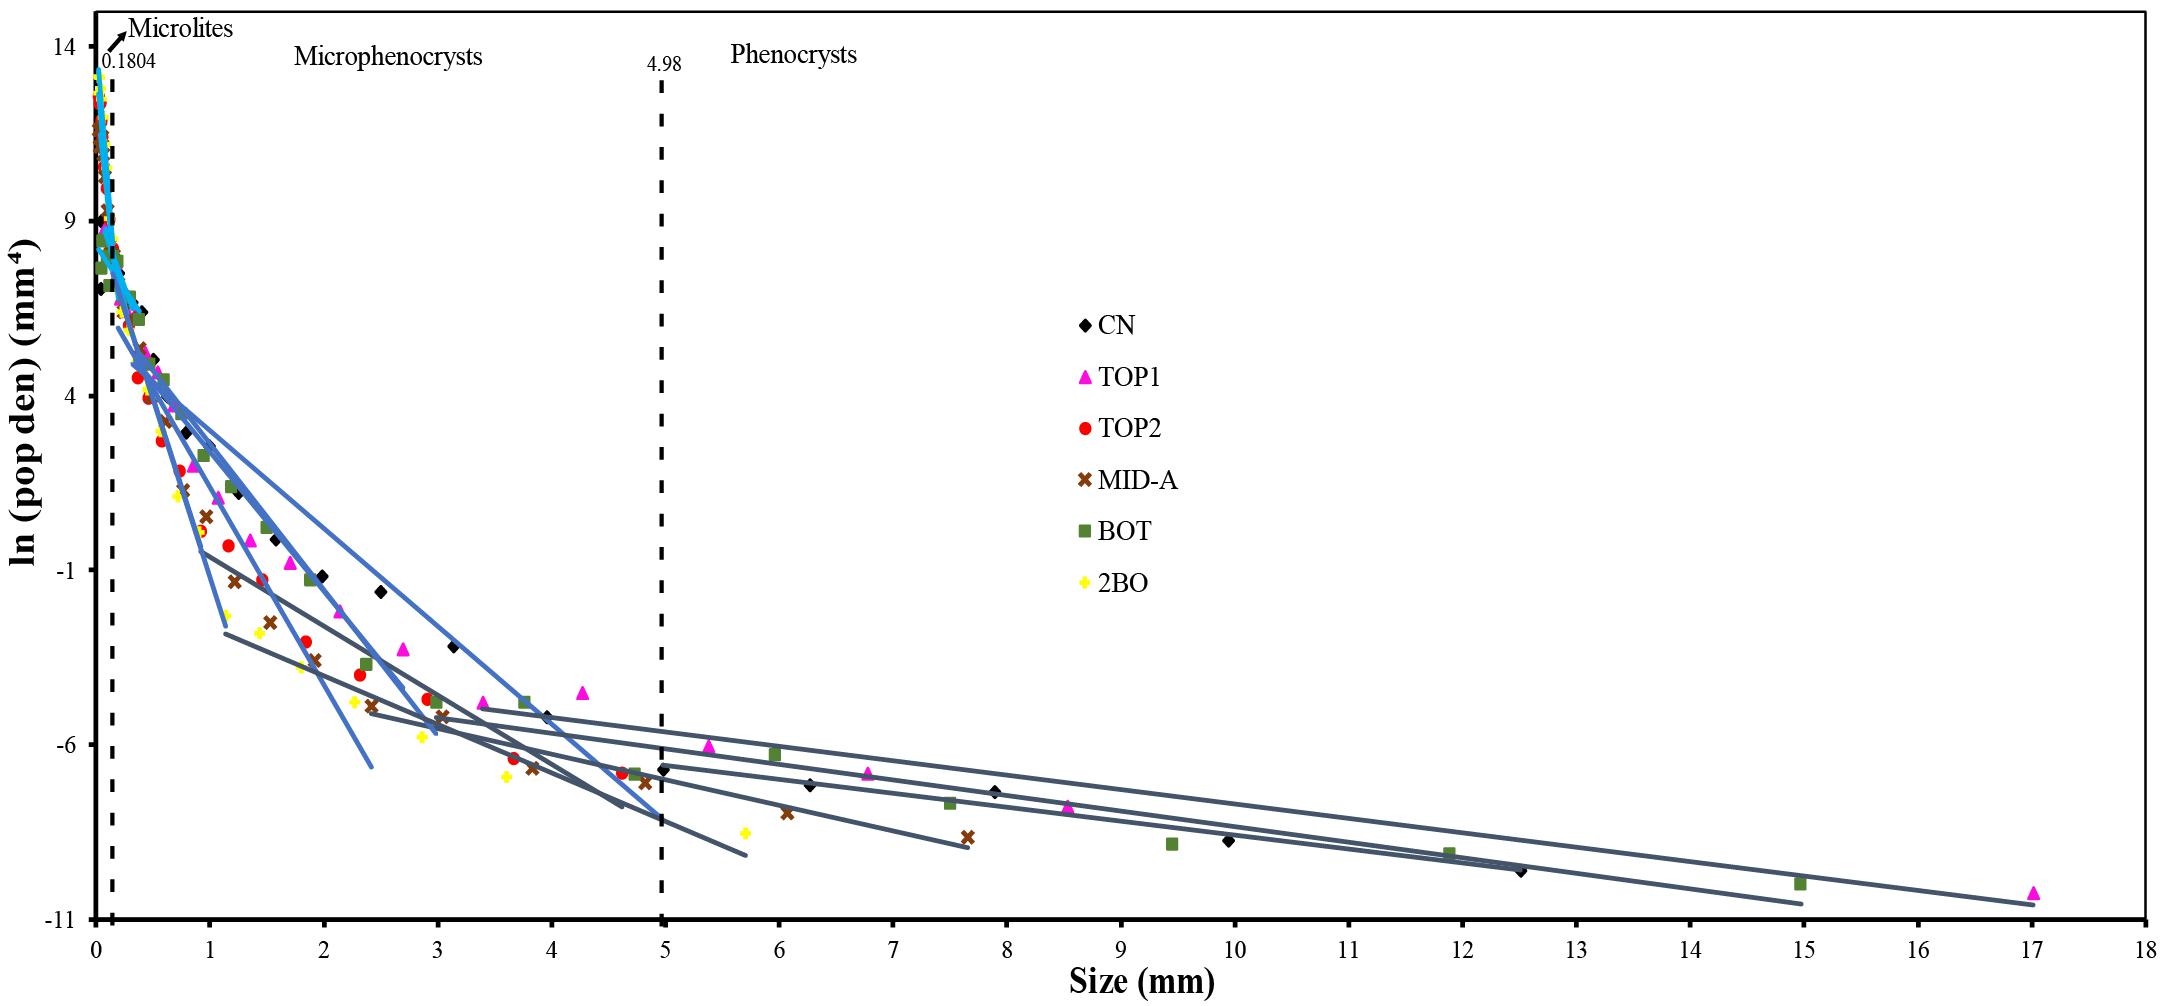
Figure 7. CSD for each sample showing the population density (pop den) fraction versus the size of crystals. Dotted lines delimit the crystals families: microlites, microphenocrysts and phenocrysts.
CSDs of CN, TOP, MID-A and BOT are characterized by a break in slope at the transition between microlites and microphenocrysts, which occurs between 0.18 mm (MID-A) and 0.47 mm (BOT; see Supplementary Materials 1Supplementary Figure 2). The microphenocryst population is volumetrically the most important, accounting for > 75% of the total crystal volume. The phenocryst population is the smallest of the three crystal populations, accounting for < 8% vol. for all samples (CN, TOP1, TOP2, MID, BOT and 2BO). Sample 2BO is texturally distinct, having a larger fraction of microlites (25 vol.%, as opposed to ≤ 12 vol.% in all other samples), and phenocrysts (30 vol.%, as opposed to ≤ 8 vol.%), and being poor in microphenocrysts (3 vol.%; Table 1).
Chemical Analyses
Bulk chemistry results reveal a basaltic composition with a mean of 50.1 wt.% SiO2 and 3.0 wt.% alkalis (Mg# = 0.75), except for sample 2BO, which is slightly more alkali-rich (3.7 wt.%; Table 2). Trace element analyses are presented in Figure 8, with concentrations normalized to the control sample or the bulk composition, to highlight any heterogeneity attributable to interactions with the tree. Results show that tree-contact samples (TMS) are significantly enriched in chalcophile elements with respect to the control sample (Figure 8). In particular, enrichment factors (CN normalized concentrations) for Pb, Tl and Cd are 2.5, 3.5 and 3.4 respectively in TOP2-TMS. Similarly, samples T3 and T5 from the J74 lava-trees display enrichment factors (Figure 8; concentration ratio of tree mold surface/control samples) of 4.5 (Tl), 2 (Cr), 2.5 (Ag and Sn) and 1.5 (Rb). Other trace elements show no divergence between the bulk compositions and CN (see Supplementary Materials 2Supplementary Table 1 for all data).
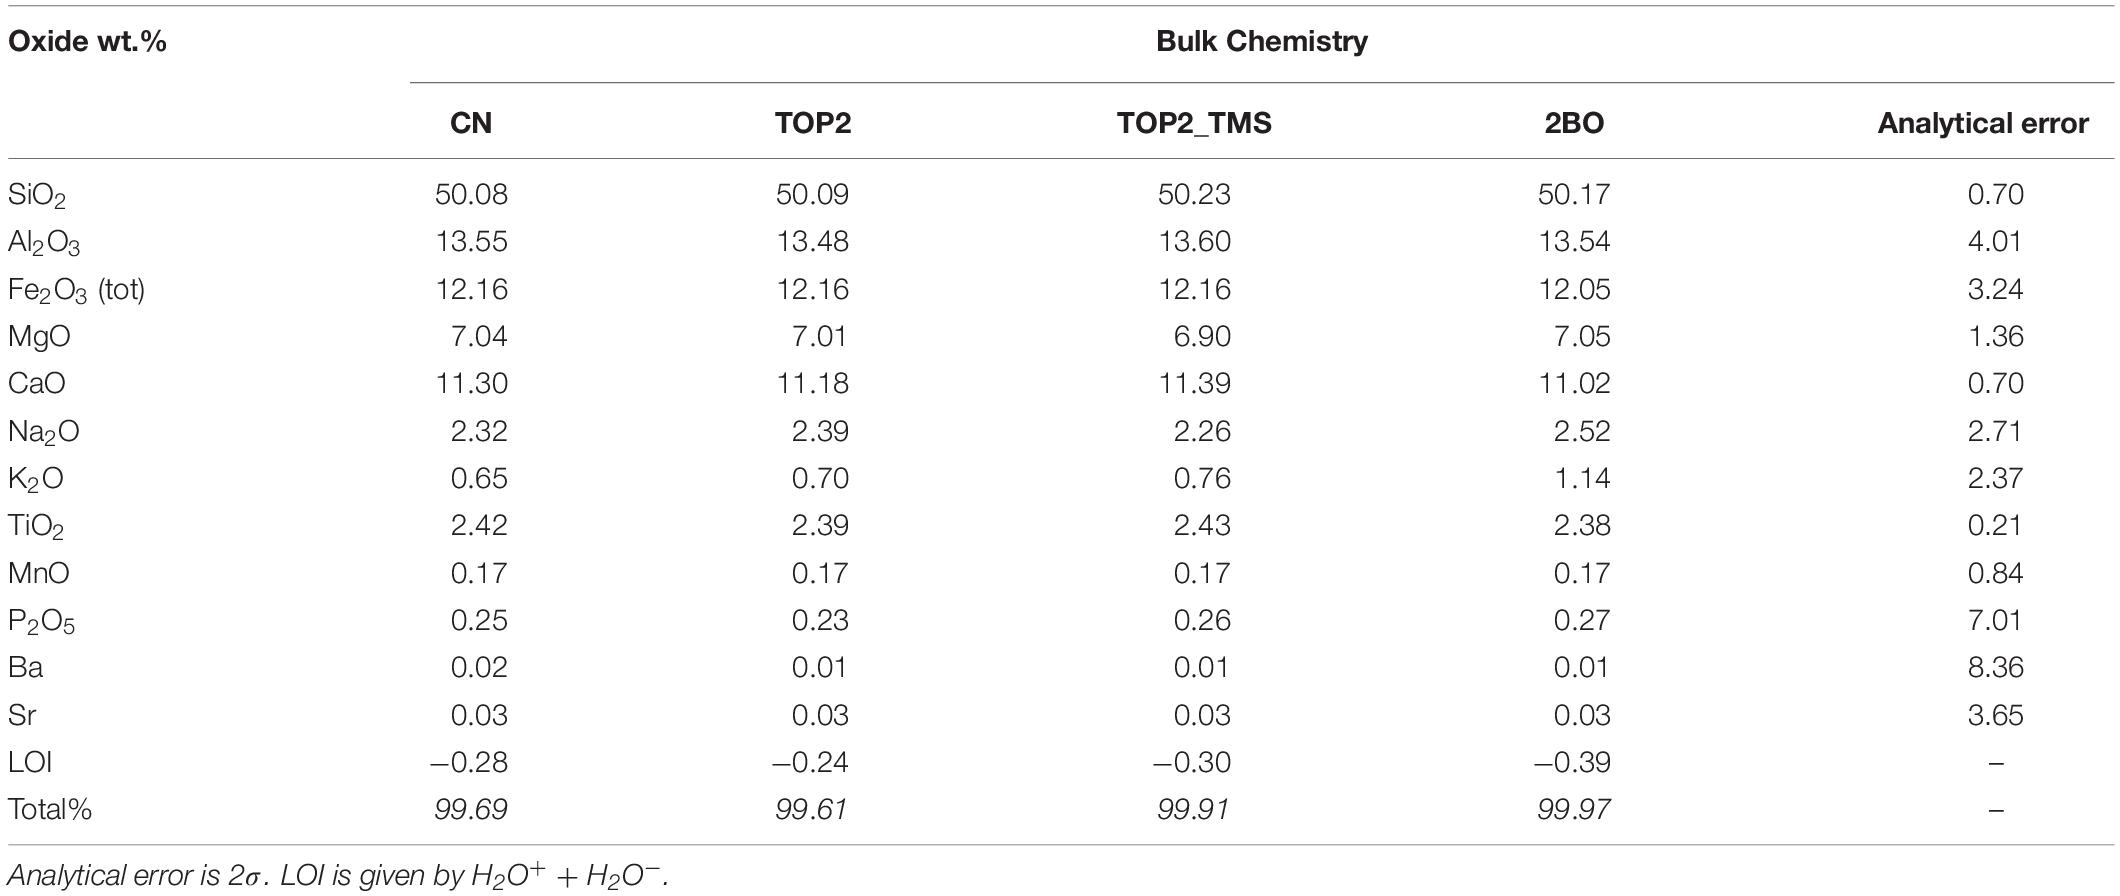
Table 2. Bulk composition (ICP-AES) of the collected samples from the 27th June Pāhoa lava flow, near the tree-mold (TOP1, TOP2, MID-A, BOT).
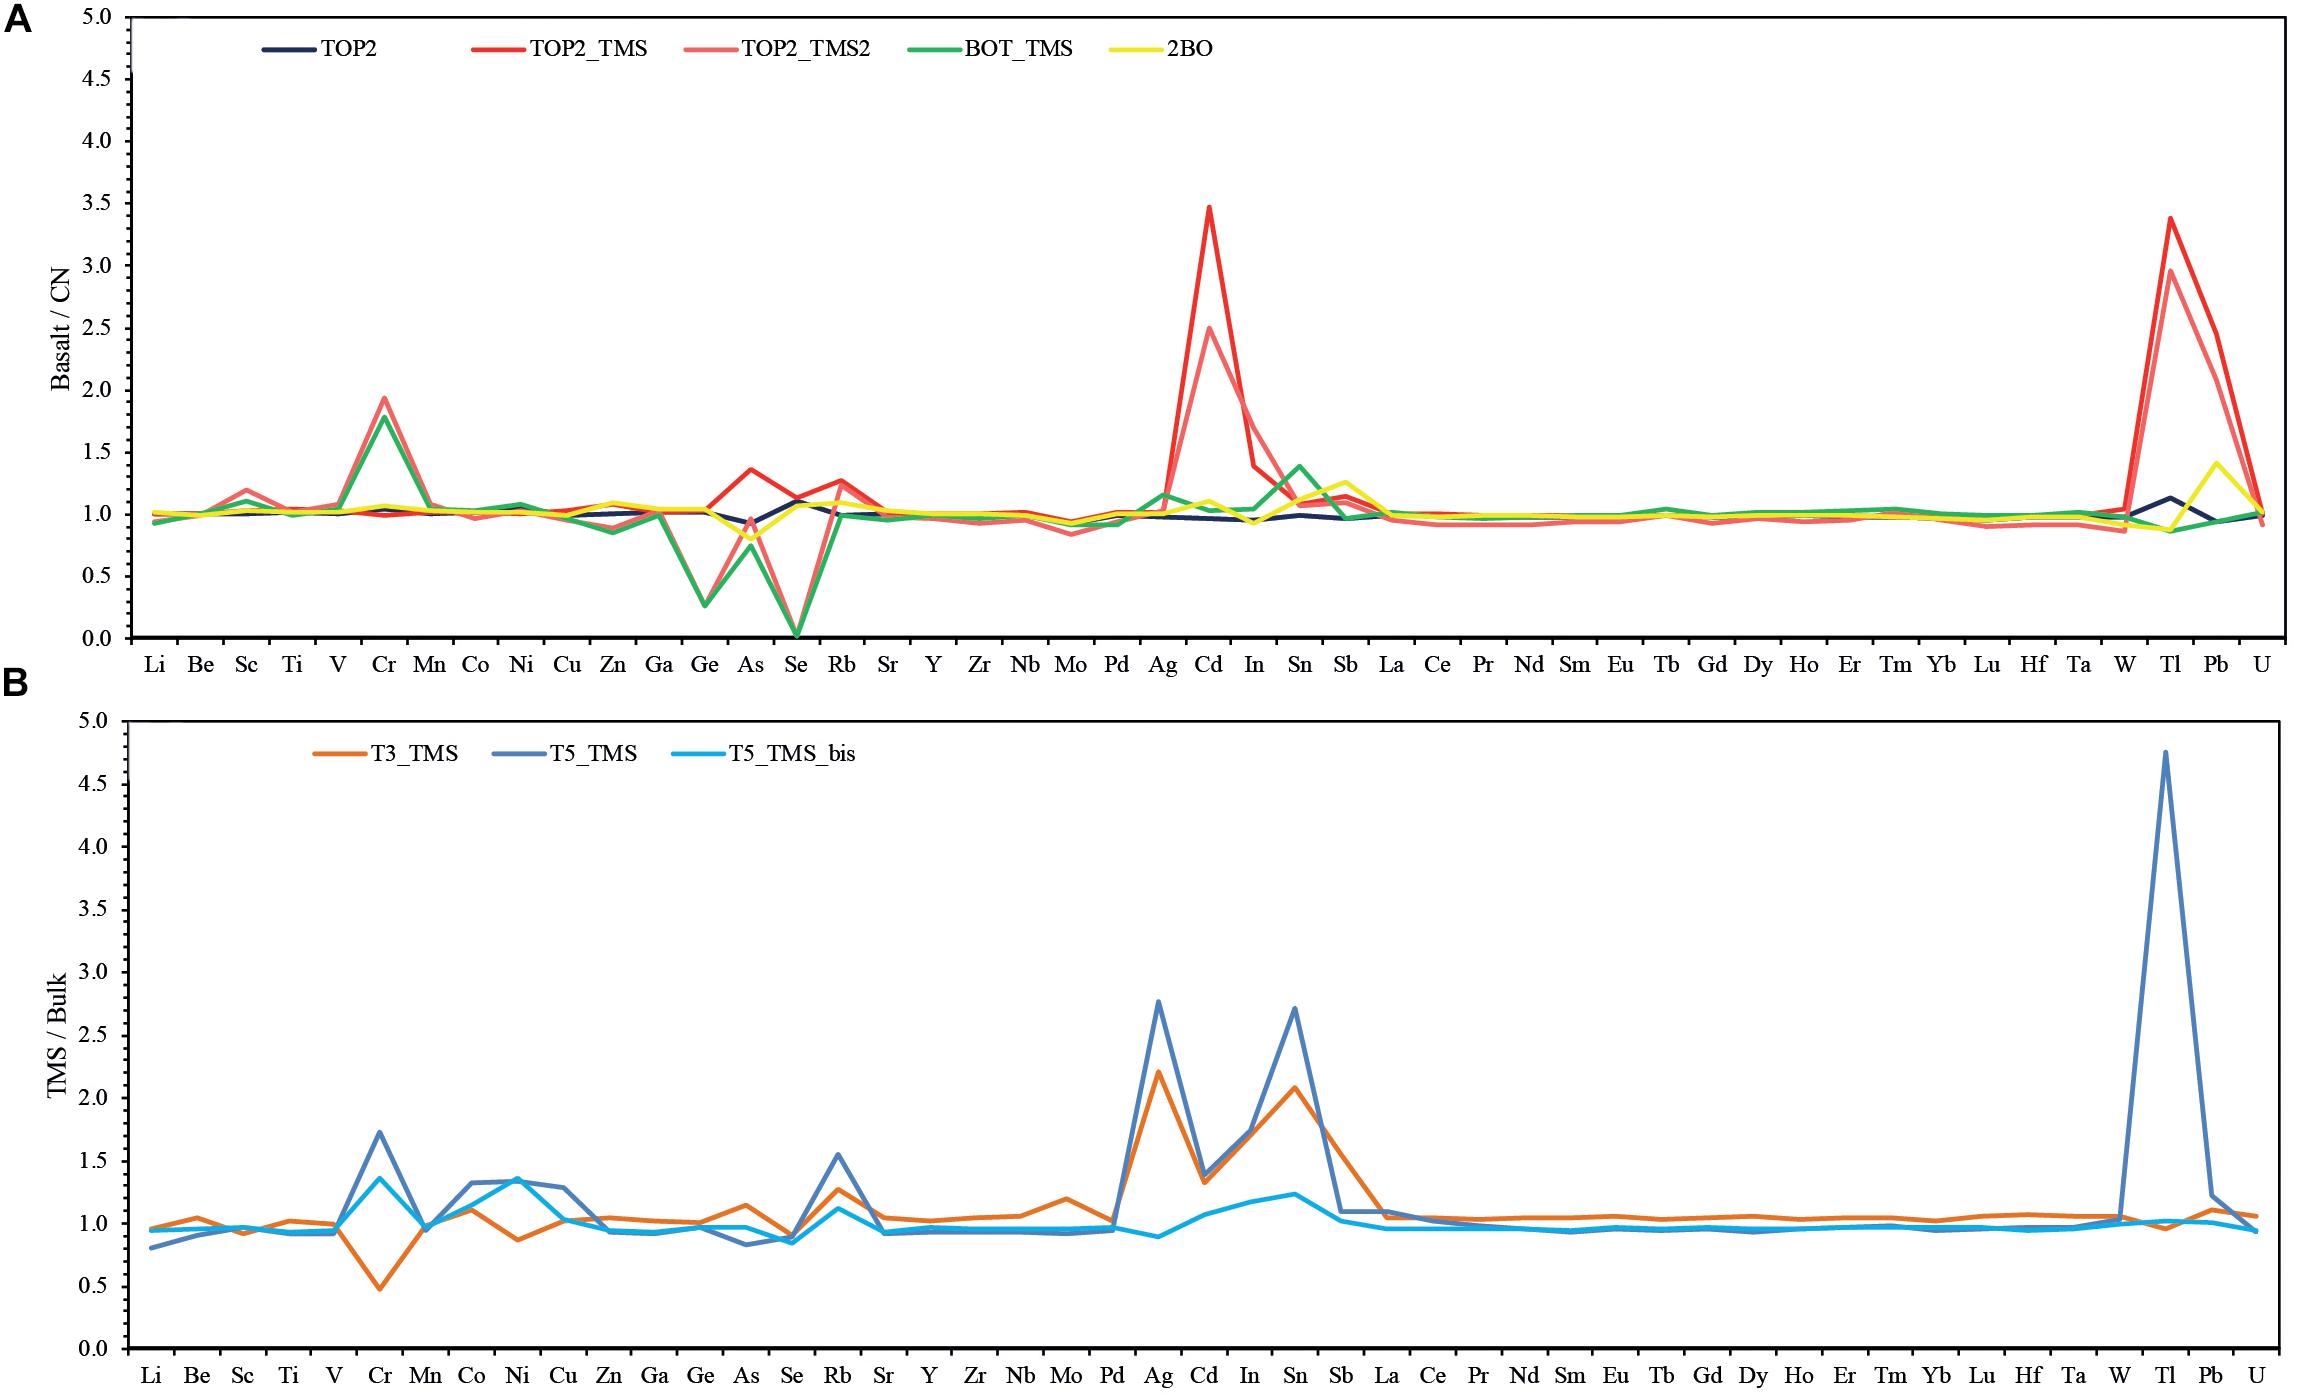
Figure 8. Trace element diagrams for (A) samples in contact with tree as normalized to the control sample (CN); (B) the J74 lava flow: two samples in contact with tree (T3-TMS and T5-TMS) as normalized to their bulk composition (T3-bulk and T5-bulk, respectively).
CHNS-O analyses reveal that all TMS samples (TOP2-TMS, BOT-TMS, T3-TMS, T5-TMS) are enriched in CO2 (0.22 vs 0.12 wt.%) relative to bulk samples (CN, 2BO, T3 and T5), and all are significantly more CO2-rich than the control sample (< 0.05 CO2 wt.%, Figure 9). Small glassy chips carefully handpicked from the irregular tree-contact surface have even higher CO2 concentrations (0.28 wt.% for TOP2-TMS2). Similarly, the J74 tree-contact samples (T5-TMS and T3-TMS) are enriched in CO2 (0.35 and 0.41 wt.%), in comparison to bulk sample concentrations of 0.13 and 0.26 wt.%, respectively (Figure 9). Conversely, H2O concentrations are constant (∼0.13 wt.%) in all Pāhoa lava samples (including TOP2-TMS, TOP2-TMS2 and BOT-TMS), whereas the J74 samples show clear enrichment at the tree surface contact (i.e., T3-TMS and T5-TMS), reaching up to 0.37 wt.%. Overall, the Pāhoa samples are less volatile-rich than those from lava-tree contacts of the J74 lava trees. SO2 and NO2 concentrations were below detection limits.
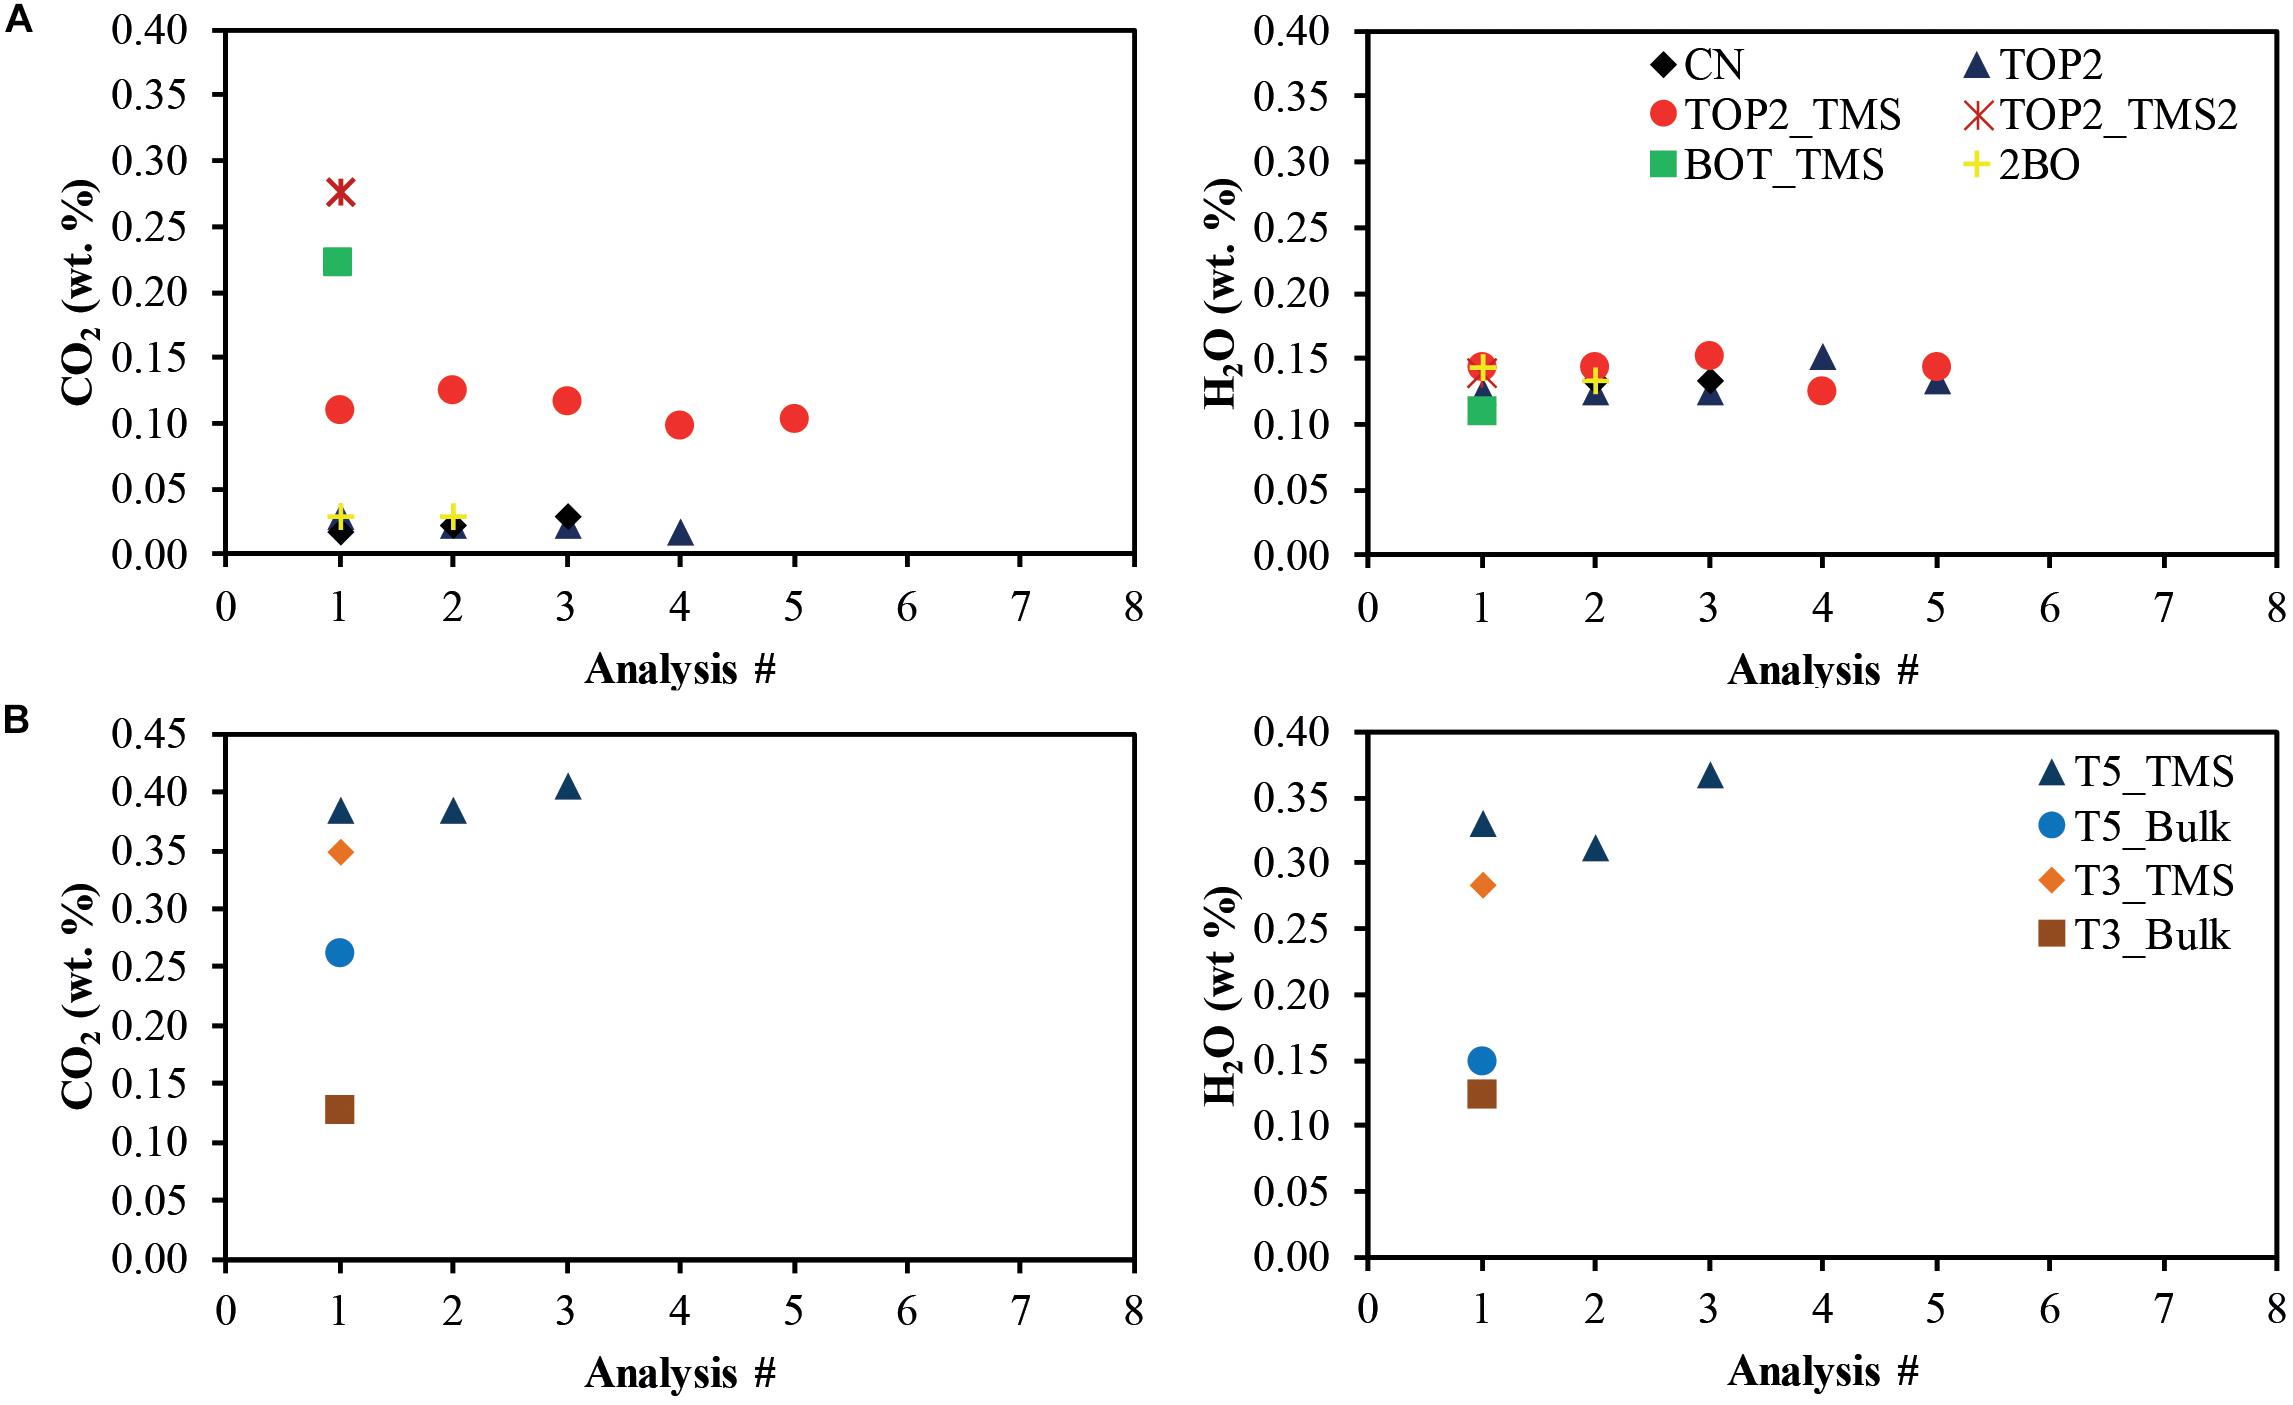
Figure 9. CHNS-O values for CO2 and H2O for (A) samples in contact with tree, and (B) the J74 samples. Samples in contact with tree are enriched in meteoric volatiles (CO2). The handpicking method increases this discrepancy, as shown by the concentration in CO2 for BOT-TMS and TOP2-TMS2 affects.
Backscattered electron image and semi-quantitative chemical maps were produced for TOP2-TMS sample, chosen due to its large diversion from the bulk lava composition (see Supplementary Materials 2Supplementary Figure 4). These images show a clear contrast between the tree-contact rim of the sample and its interior. The rim, which is ≤ 10 μm wide, is enriched in Fe, S and K and contains abundant oxide microlites. Beyond this rim, a 50–100 μm-wide zone appears Na-depleted, while further way the sample is enriched in Na and Ca. Mg remains constant everywhere (Supplementary Materials 2Supplementary Figure 4).
Lava flow emplacement temperatures calculated using olivine-glass geothermometers range between 1125–1145°C and absolute error is 60°C (see Supplementary Materials 2Supplementary Table 2). This compares with typical eruption temperatures of around 1155°C (mean from Table 1 of Helz et al., 2003), where cooling by 1°C km–1 is expected for a mature tube (Keszthelyi, 1995; Helz et al., 2003; Witter and Harris, 2007), so that temperatures of around 1135–1140°C are expected at the end of a tube system extending 15–20 km, which is the case here.
Thermal Measurements and Combustion
TGA results reveal a distinction between degassing of volatiles from meteoric sources at low temperature, and magmatic volatiles at high temperature (Denton et al., 2012; Figure 10). Predominant mass loss occurring at relatively low temperatures, around 365°C, is greater for TMS samples (loss of ∼0.06 wt.% for TOP2-TMS) than the equivalent loss for far-field samples (e.g., 0.01 wt.% for CN). This is clearly illustrated by the rate of weight loss (dTGA) curve, which shows a stronger degassing peak at ∼365°C for TOP2 (Figure 10). The second major (but smaller-magnitude) mass loss event occurs around 1100°C, with similar amplitude for both TMS and far-field samples (TOP2 and CN). The total mass loss from samples ranges from 0.10–0.14 wt.% and is similar to the loss range measured with the CHNS-O method (0.10–0.28 wt.% for TOP2-TMS).
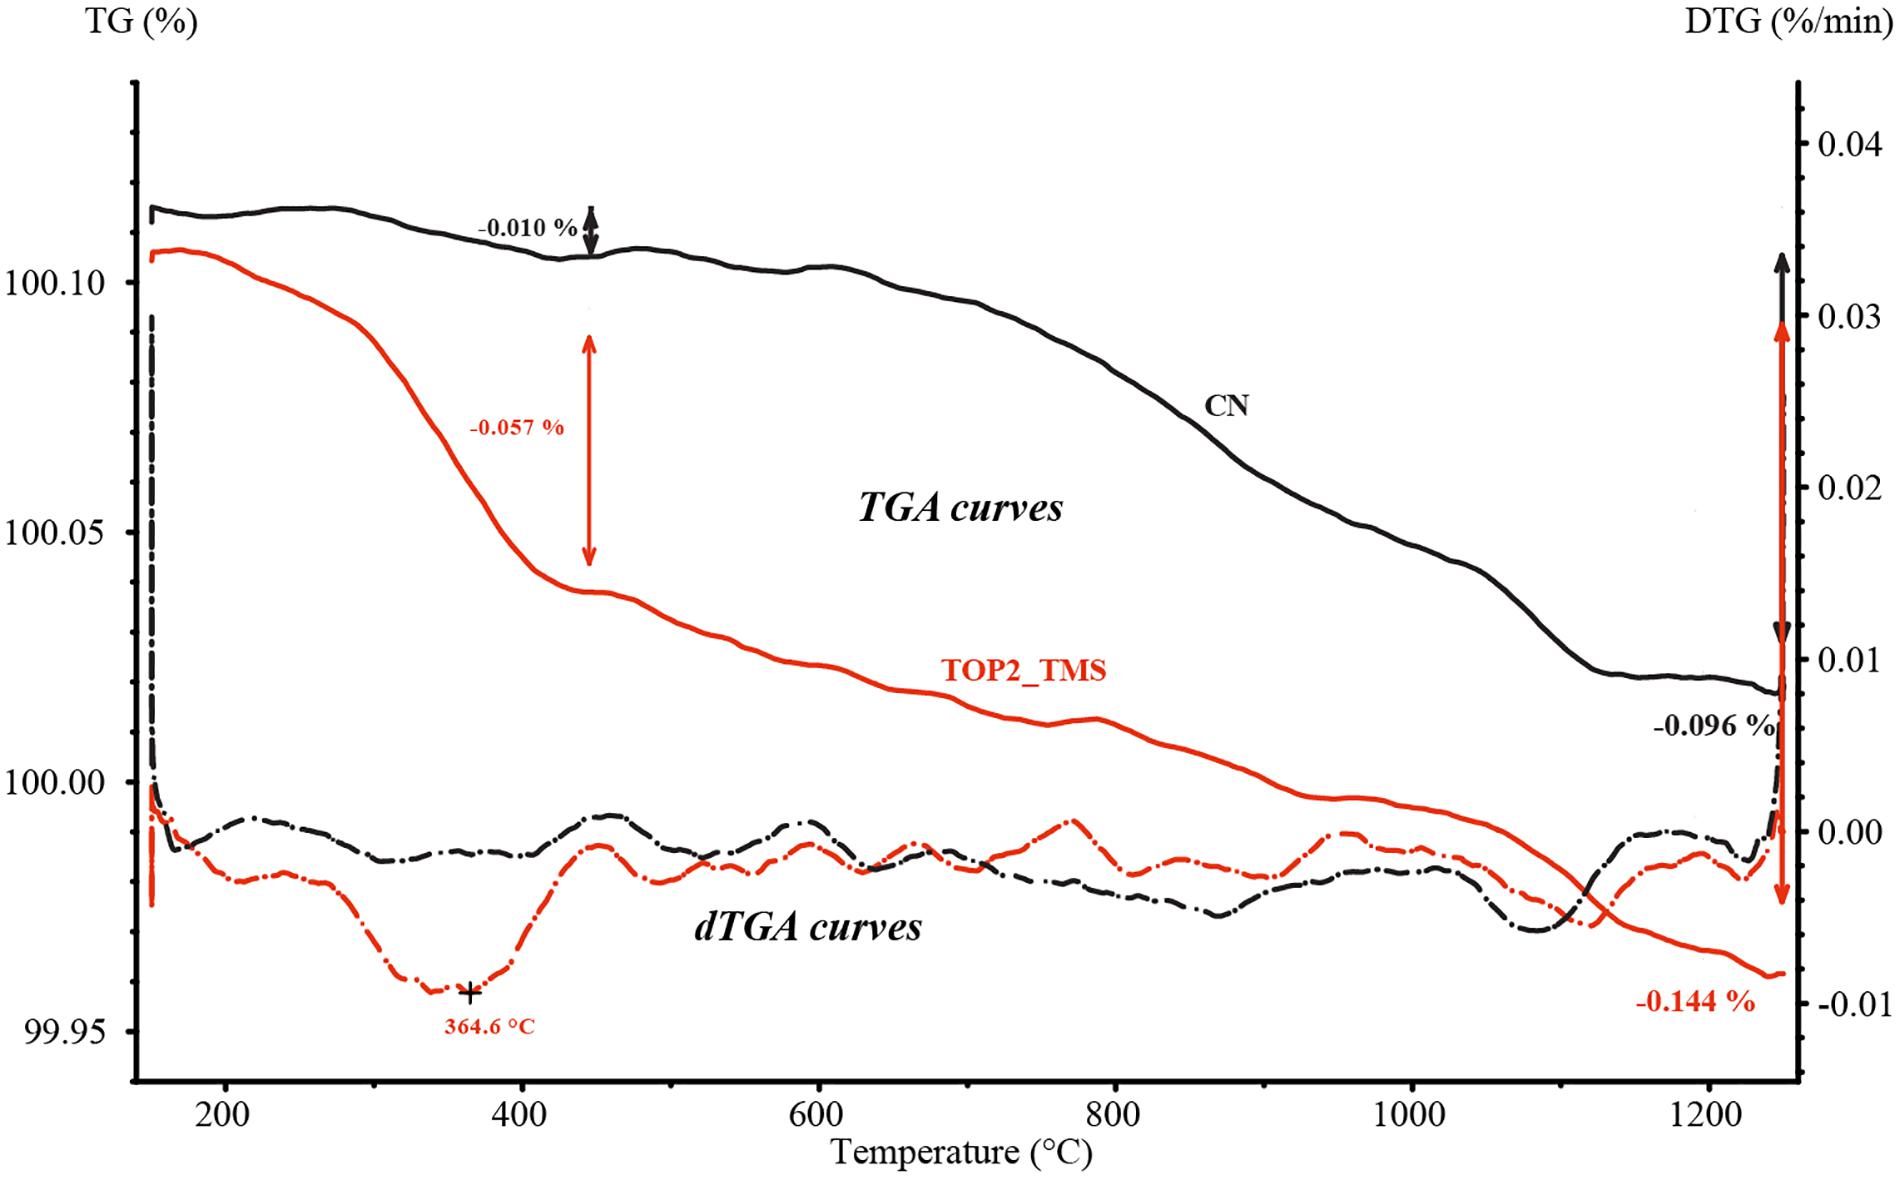
Figure 10. TG and dTGA curves with temperature for TOP2-TMS and CN. Major mass loss occurred at low T (i.e., between 300 and 450°C with a peak at 364.6°C) and is far greater for TOP2-TMS (–0.057%, red arrows) than for CN (–0.010%, black arrows), which corresponds to meteoric degassing. The second mass loss occurred at high T (i.e., ± 1100°C) and is in the same range for both samples, which corresponds to a magmatic degassing.
The DSC results characterize the exothermic peak related to crystallization during cooling, over a range of cooling rates (2–80°C min–1) relevant to subaerial lavas (Figure 11). The measured enthalpy is converted to a volumetric proportion of crystallization as given by Applegarth et al. (2013), where complete crystallization releases 209 J g–1:
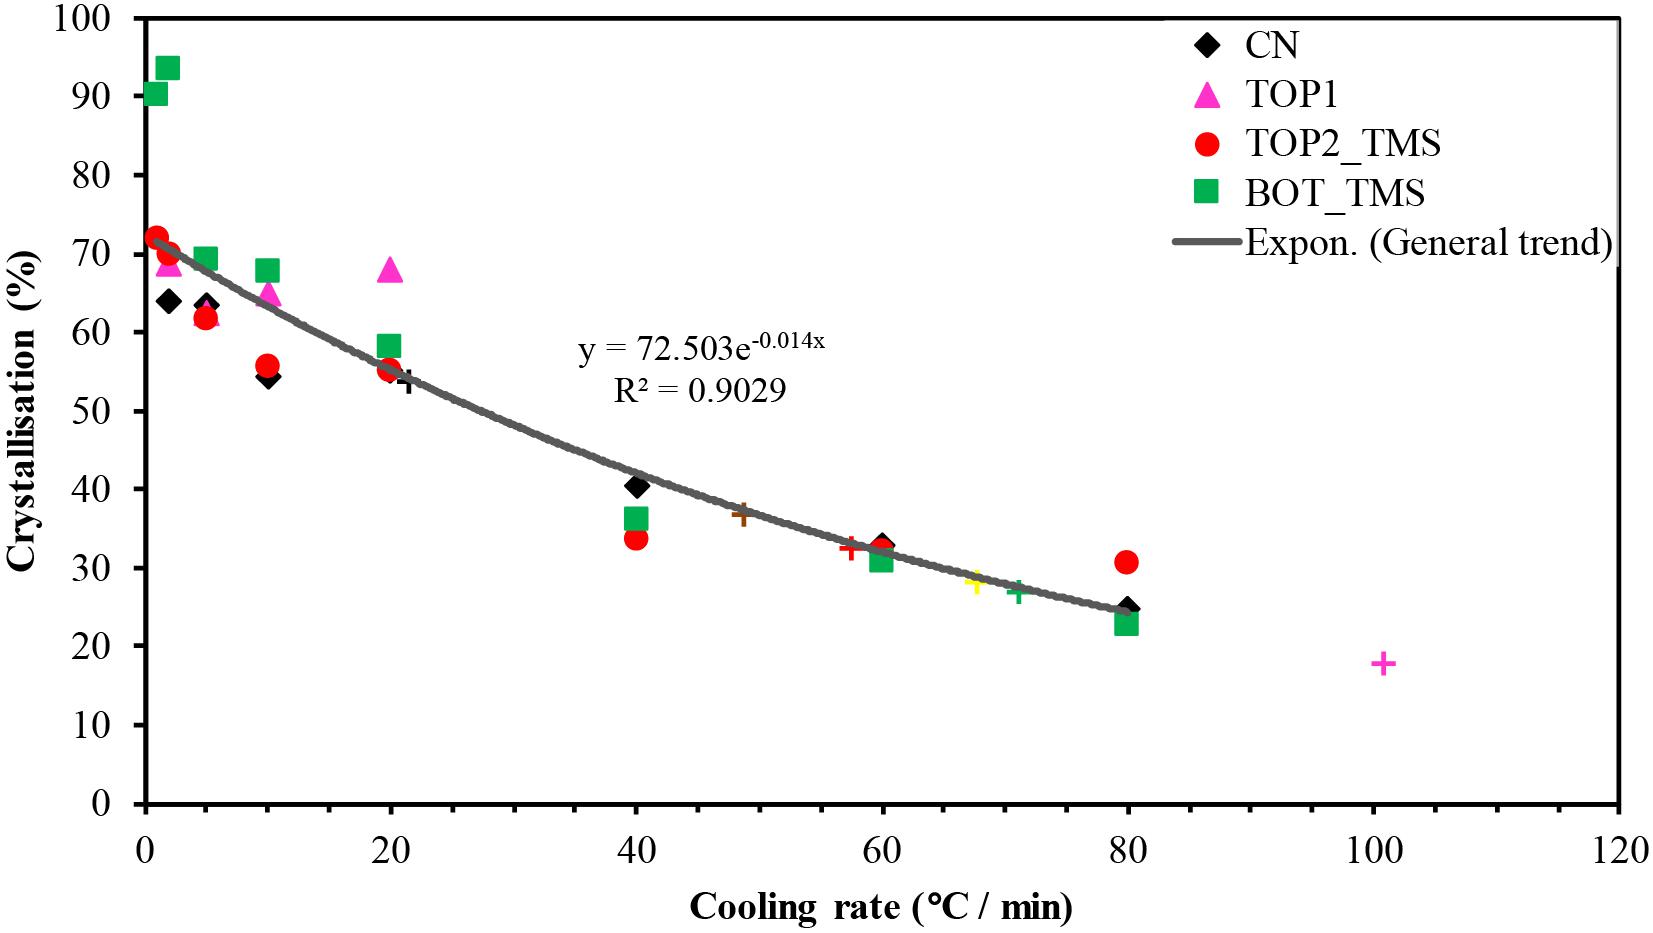
Figure 11. Crystallization percentage with cooling rate for TGA-DSC values, obtained with both machines. The color of the symbols corresponds to the different samples. The triangles, circles, squares, and diamonds represent the individual experimental results, whereas the crosses are inferred natural cooling rates based on the measured crystallinity of samples (using CSD method and the general trend equation). Most of the samples in contact with tree show a higher cooling rate than CN not in contact with tree.
Our experiments reveal that there is an inverse relationship between the cooling rate (dT/dt) and extent of in situ crystallization during cooling (Table 1), which is best expressed with an exponential trend X = 72.503e−0.014(dT/dt) (Figure 11). Experiments at the lowest cooling rate (1–2°C min–1) induce almost complete crystallization (up to 80–90% in some samples), whereas only 20–30% crystallization occurs at higher cooling rates of 80°C min–1. At cooling rates between 80 and 5°C min–1 the proportion of crystallization is largely consistent between samples (Figure 11; variation of < 15% crystallization at a given cooling rate), but greater discrepancy occurs at the slowest cooling rates (e.g. ∼63 to ∼90% crystallization at 1–2°C min–1). Experimental results can be related to natural sample textures when the crystallinity is calculated with CSDcorrection, and thus the approximate natural cooling rate can be retrieved using the exponential trend. In reality the conditions are slightly different, in that the experimental lava is completely degassed during crystallization and cooling (e.g., Applegarth et al., 2013), whereas the natural lava retains some volatiles as characterized in the final quenched samples. However, this mismatch is not expected to significantly influence the relationship between crystallization percentage and cooling rate for the lower volatile concentrations involved. Inferred cooling rates (Figure 11) range from low values for crystal-rich, far-field sample (CN, ∼30°C min–1) to higher values for tree-contact samples (63 and 95°C min–1 respectively for BOT and TOP1; see Table 1 for inferred cooling rate values). Lower cooling rates are regarded as typical for the upper surface of a lava flow without tree interactions.
The DSC signal during wood heating (Figure 12A) indicates a strongly endothermic event with a peak at 366.7°C. This closely corresponds with the degassing peak (dTGA in Figures 12A,B) and indicates a common process. The mean enthalpy of devolatilization from five sub-sample repeats is 261.58 ± 21.04 J g–1 (see Supplementary Materials 3Supplementary Figure 5a). Note that this experiment was conducted in an oxygen-free (N2) environment, so the exothermic combustion phase was not characterized – this experiment therefore most appropriately simulates the anoxic part of the tree mold, where insignificant atmospheric ingress occurs. Nonetheless, the temperature range of devolatilization in our anoxic experiments, with ignition at 367°C, broadly matched that of Babrauskas (2002), who give ignition temperatures in the presence of oxygen over the range 300–365°C, and Fons (1950) (345°C). The TGA results for the Albizia wood sample (Figure 12B) show the onset of major mass loss at 250–280°C, which corresponds with the initiation of visual smoke emission (around 280°C). The degassing event of Figure 12B involved a total mass loss of 81.6 wt.% (mean for all runs was 86.1 ± 3.2 wt.%; see Supplementary Materials 3Supplementary Figure 5b), with a maximum mass loss rate (dTGA peak) at 365°C. There is insignificant mass loss above 400°C, indicating that thermal breakdown reactions have approached completion. To investigate potential kinetic effects at the imposed heating rates of 40°C min–1 we characterized the influence of wood grainsize (500–125 μm and 250–106 μm) on the degassing peak position, and found a degassing lag of 20-30°C for the larger grainsizes (i.e., 500–125 μm; see Supplementary Materials 3Supplementary Figure 5c).
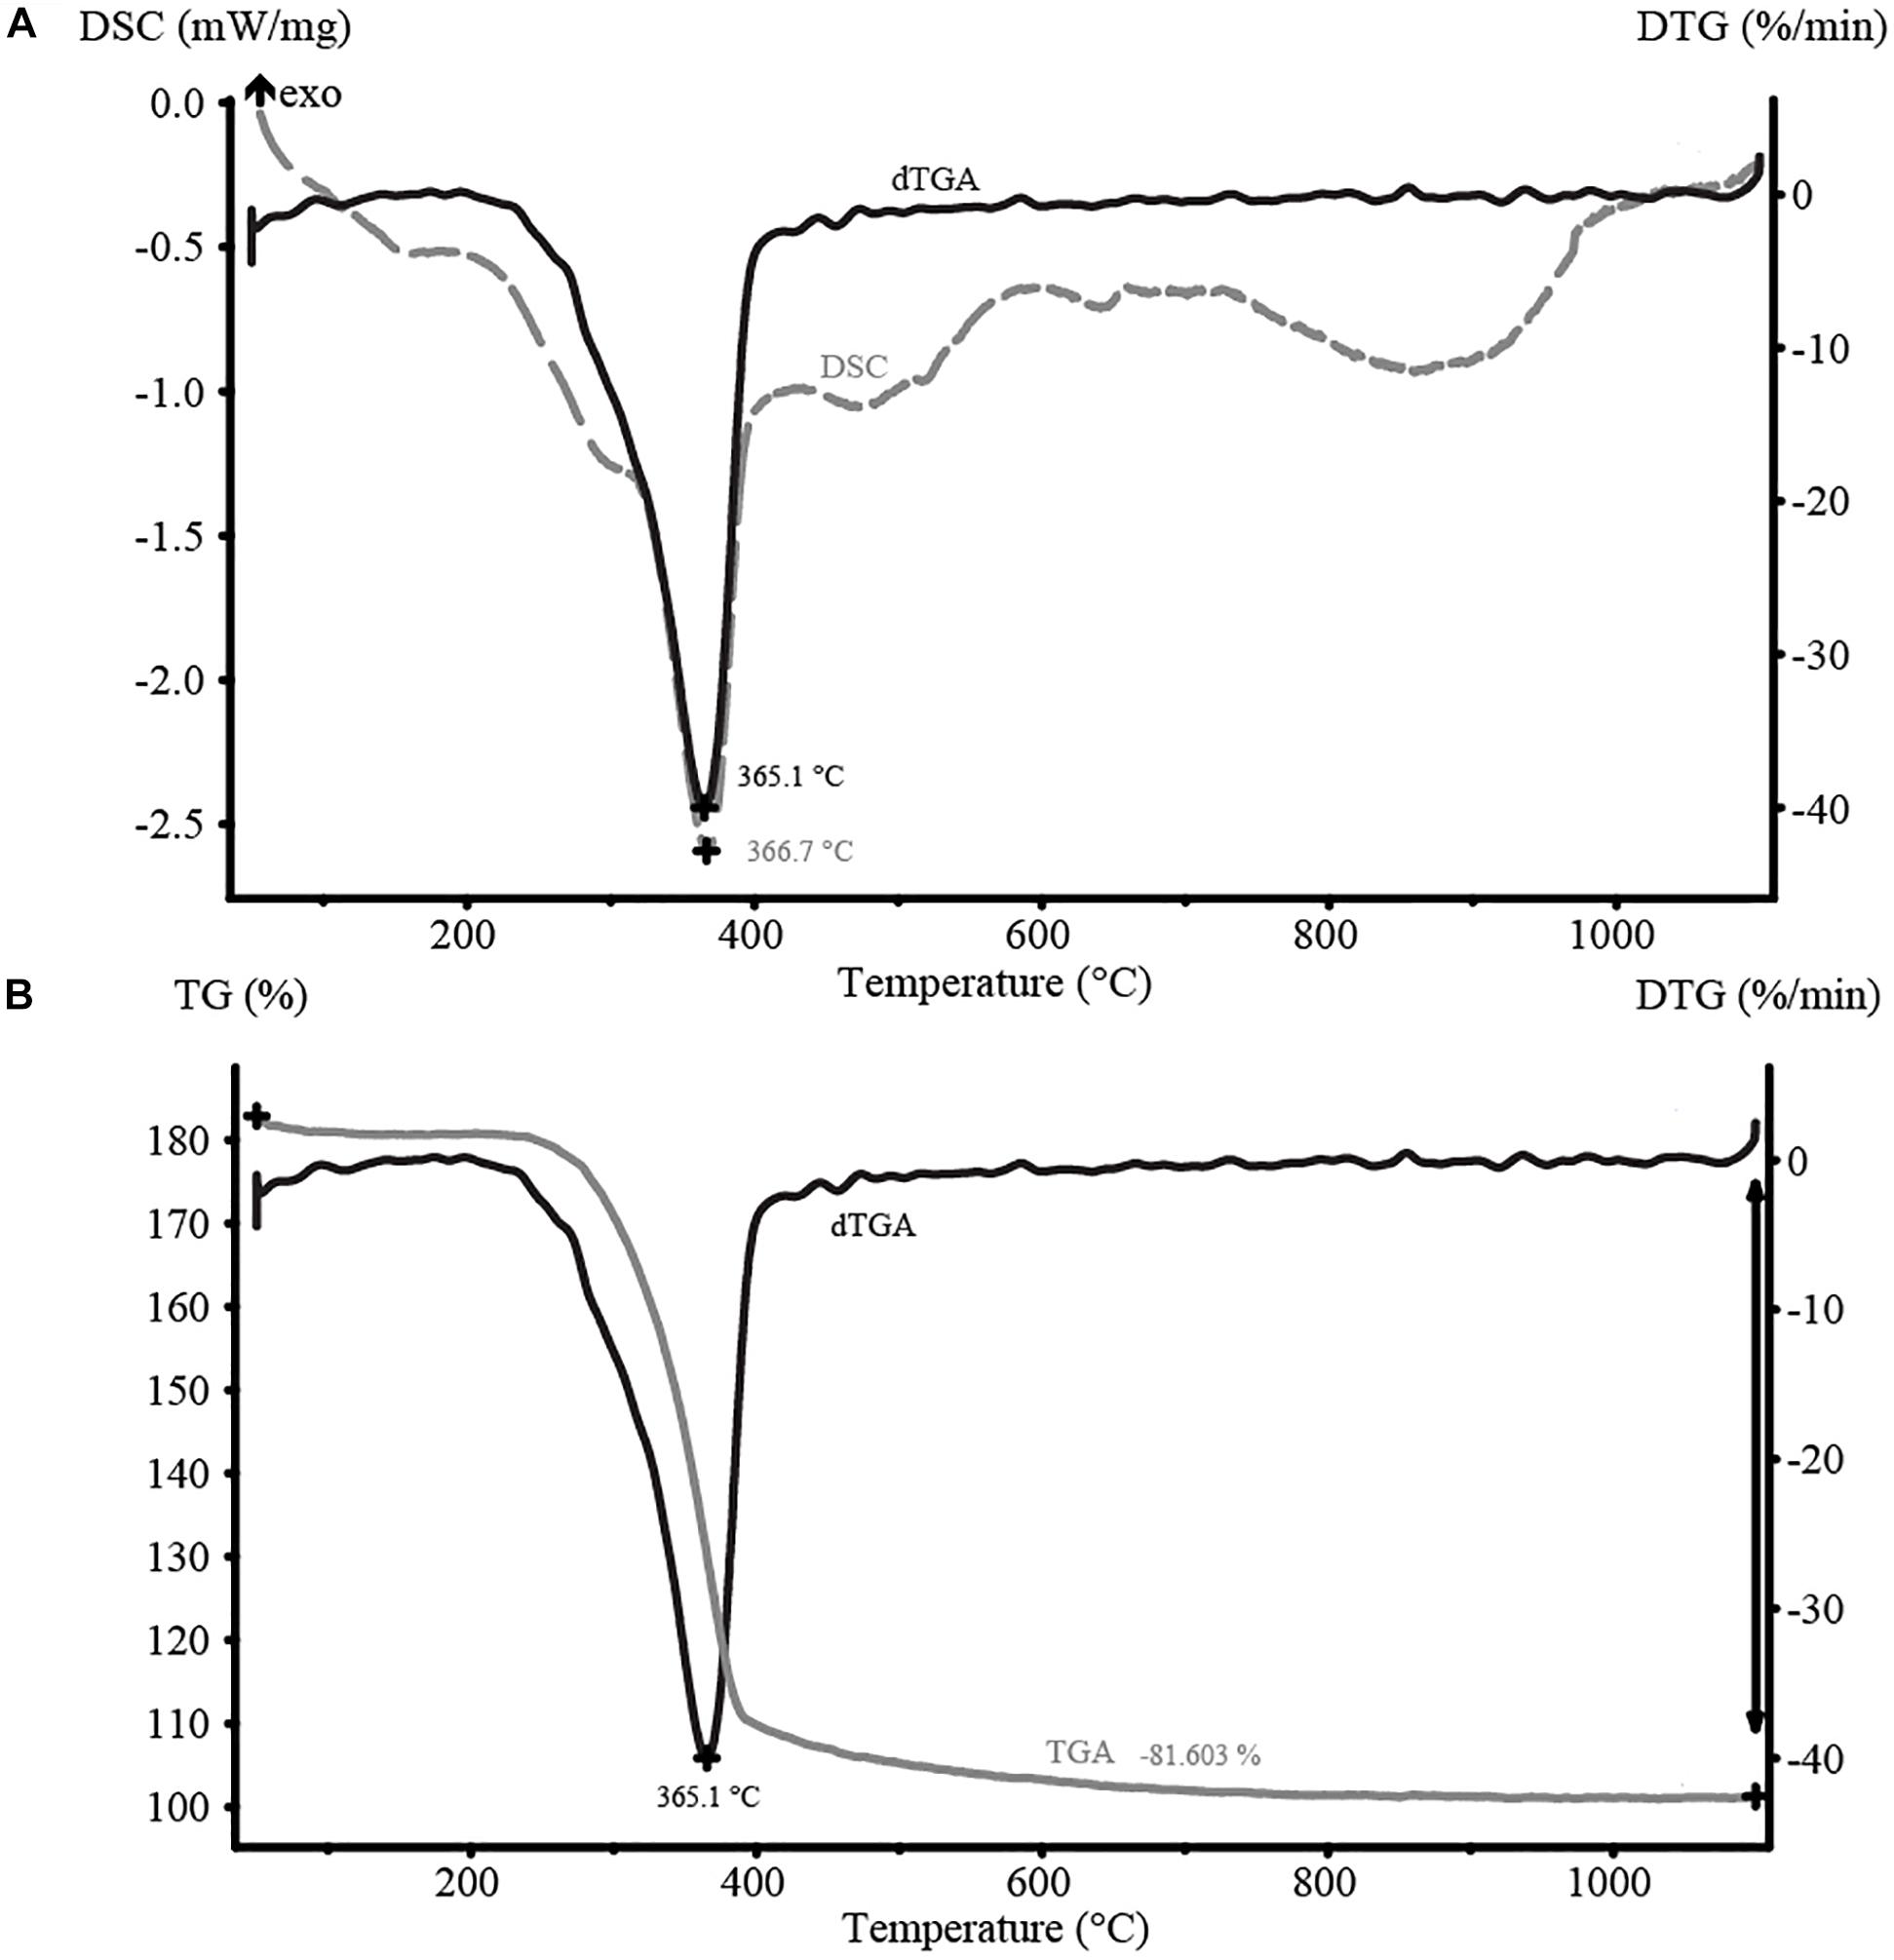
Figure 12. TGA and DSC curves with temperature for the Albizia tree wood sample. (A) DSC curve shows a trough at the same temperature as dTGA which means that most of the heat is being produced by volatilization. (B) TGA curve corresponding to mass loss, which is correlates with devolatilization. Most of the mass (mean −81%) is lost at low temperature (365.3°C).
Discussion
Textural and DSC analyses indicate that a thin (≤ 5 mm) layer around the tree mold underwent faster cooling than the surrounding (far-field) lava and the flow surface, due to heat transfer from lava into the tree. The Albizia tree studied here is a poor thermal conductor and has a high heat capacity due to its high water content (∼54% moisture content in a growing tree5; Wood Data Base, 2019), which leads to the strongly endothermic devolatilization reaction quantified via DSC. Its presence thus appears to have enhanced lava cooling at the lava-tree contact – an effect that is quantified below in Stage 1 of our thermal model. We also observe that endothermic devolatilization accompanied the major phase of mass loss of the tree, as revealed by the wood TGA analysis, which involves drying and devolatilization. This mass loss of 86% is somewhat higher than that encountered for Douglas Fir trees during exposure to fire (10–50%; Mell et al., 2009), but likely relates to the transitory/short-term exposure to fire heat during passage of a wild fire, with thus incomplete combustion, as opposed to permanent/long-term exposure of the tree to the heat source during flooding by lava.
As the tree loses its mass, the released volatiles (predominantly H2O and CO2) will interact with neighboring lava. This is indicated by the elevated CO2 concentrations in a TMS sample (TOP2-TMS) as determined with CHNS-O analysis (0.10–0.28 wt.%, vs. < 0.04 for CN; Figure 9), and by the greater volatile mass loss in TGA experiments: 0.14 wt.% (TOP2-TMS) vs 0.10 wt.% (CN; Figure 10). Variations between J74 (T3-TMS and T5-TMS) and Pāhoa (TOP2-TMS, TOP2-TMS2, BOT-TMS) lava tree samples may reflect a variable interaction depending on tree type, size, density and water content. Our experimentally derived constraints on CO2 uptake are the diffusivity of CO2 in the lava, which is strongly temperature-controlled, and the solubility of CO2 in basalt. At relevant magmatic temperatures (1125–1145°C, Table 2) CO2 solubility is negligible, both at atmospheric pressure and over the restricted range of plausible pressures encountered within a thin lava flow (< 2 bar). Therefore, the uptake of detectable CO2 by the lava may require either (1) retrograde CO2 solubility so as to increase cooling lava, as established for water (Ryan et al., 2015) but not yet proven for CO2, or (2) physical incorporation of carbon-rich wood or charcoal into the lava, e.g., during energetic streaming of exsolved volatiles into the still low-viscosity neighboring melt prior to its quenching.
Thermal perturbations at the tree-lava contact are significant, as demonstrated by three observations. First, the thin (≤ 5 mm) quenched TMS lava layer proves that a large temperature gradient existed between the hot lava (∼1135°C) and tree (∼25°C, the typical ambient temperature for Pāhoa). Second, the heating phase of combustion allows devolatilization, an endothermic reaction, to occur, as shown by the DSC experiment. Third, the experimentally determined relationship between crystallinity and cooling rate, combined with measurements of sample crystallinity using CSDcorrection, demonstrates faster cooling at the tree-lava contact around the walls of the mold than at the lava flow surface. According to the lava cooling model of Hon et al. (1994) and our data for CN, the lava surface cools at a rate of 10–30°C min–1 during the first hour after emplacement, whereas the tree-contact lava surface cooled at ≥ 70°C min–1 during the first hour.
The slight discrepancy between crystallization proportions in different samples at the same cooling rates reflects the more silicic residual melt composition at high degrees of crystallization (Forbes et al., 2014), which slows crystal growth and makes final crystallinity more sensitive to the density of nucleation sites. Nucleation site density will be influenced by the number density of existing crystals that remain incompletely melted during the initial heating to 1250°C (Applegarth et al., 2013), and then act as nucleii for cooling-triggered crystallization. This density is likely to vary from sample to sample with subtle variations in CSD. The sharp size variation at ∼0.5 mm in the CSD of CN, TOP1, MID-A and BOT (Figure 7) is considered a nucleation phenomenon, which is missing from the other distribution curves (Supplementary Materials 1Supplementary Figure 2). At small sizes (< 0.4 mm), decreasing crystal density was most likely caused by physical processes such as crystal coalescence and Ostwald ripening (Schiavi et al., 2009). Extreme slope changes within CSDs strongly indicate separate nucleation events (Marsh, 1998) and, therefore, different populations. Rapid changes in cooling rate, induced by events such as an active lava encountering a tree, may produce breaks in slope in CSD plots and thus produce two distinct populations as the nucleation rate of the lava varies before and after the encounter. Phenocrysts are taken to represent crystals that grew prior to the lava emplacement, and thus inform on the crystal content in the magmatic chamber and/or the conduit prior the eruption, rather than processes in operation during flow emplacement (cf. Lipman and Banks, 1987). Instead, the microphenocrysts and microlites nucleated during cooling of the lava flow (cf. Crisp et al., 1994; Cashman et al., 1999) or due to enhanced cooling when placed in direct contact with the tree. However, isolation of the effect of tree-contact on nucleation and crystallization is not possible. This is because the fraction of nucleation and crystallization prior the contact with the tree is entangled with the fraction of nucleation and crystallization due to the interaction with the tree.
We find that lava in contact with the tree is less porous (33%) than the far-field lava (i.e., 59% for CN, at 40 m distance; Figure 4), but with larger vesicles, and matches the definition of a P-Type pāhoehoe (< 30–40% porosity), i.e., it is degassed. Instead, CN is described as a S-Type pāhoehoe (> 30–40% porosity). We suggest that the dominant, large vesicle population witnessed in proximity to the tree relates to the passage of a large volume of released gas from the tree into the lava, which may have also acted to trap and extract the smaller bubble population. This passage of gas into the surrounding lava may also have helped to create anomalies in the chemical composition of the lava at the tree-contact, where we see here an enrichment in CO2 and H2O at the lava-tree contact. Previously characterized chemical anomalies in lava related to interactions with trees have also included enrichment in native iron, ilmenite and fO2 (Searle, 1958; Wasilewski et al., 2000).
Retarded cooling may also occur if a significant phase of exothermic combustion followed the initial endothermic heating phase, as suggested by the texture of the thin tree mold surface, together with the thermometry estimates. The temperature of samples collected from close to the tree mold do appear to be systematically higher than far-field sample CN (1127–1138°C as opposed to 1125–1132°C). Although this temperature difference is significantly smaller than the absolute error in temperature reconstruction (∼60°C; Putirka, 2008), the relative differences are consistent with the lava having undergone a phase of localized heating in proximity to the burning tree. In this regard, maximum temperatures in wood fuels can be as high as 1430–1530°C, with thick flames normally burning at around 1030°C (Vines, 1981; Robinson, 1991). Fires burning in the tree mold thus may have a heating effect if a flame sustained for long enough in contact with the lava (Anderson, 1968; Dickinson and Johnson, 2001). We consider how long each of these heating and cooling phases may have lasted below in the thermal model.
Finally, whereas all samples have a bulk composition consistent with products of the last twenty years of rift zone eruptions from Kilauea (Thornber et al., 2003), the lava at the tree contact is enriched in the chalcophile trace elements. This can be explained by fast cooling preventing release of these elements, as inferred for scoriae (Vlastélic et al., 2013) or by chemical contamination from wood ash (Zhan et al., 1996). Quenching then stalls species diffusion within the lava, preventing widespread ingress of volatile species into the surrounding lava and instead creating a thin (≤ 5 mm) quenched and enriched layer at the tree contact surface. Moreover, the dendritic form of the oxide is due to a fast growth effect in response to a fast cooling (e.g., Applegarth et al., 2013). These observations and measurements allow us to build a three-stage thermal model for the temporal evolution of the heat loss from (and cooling of) lava encountering and engulfing a tree.
A Thermal Model for Heat Losses Involved in Tree Combustion and Mold Formation
Here we develop a thermal model that incorporates our textural, chemical and thermal results to provide a first quantitative description of heat transfer during tree mold formation. Following our observations (Figure 2), we divide the model into three stages (Figure 13). The first stage is tree-heating and drying, during which heat flows from the lava to the tree (Figure 13A). The second is tree-combustion, during which heat flows from the tree to the lava due to exothermic reactions ongoing during combustion (Figure 13B). The third, and final, stage is that of mold-formation, during which heat escapes through the cave (or pipe) system left in the cooling lava flow by complete combustion of the tree trunk and its root bowl (Figure 13C).
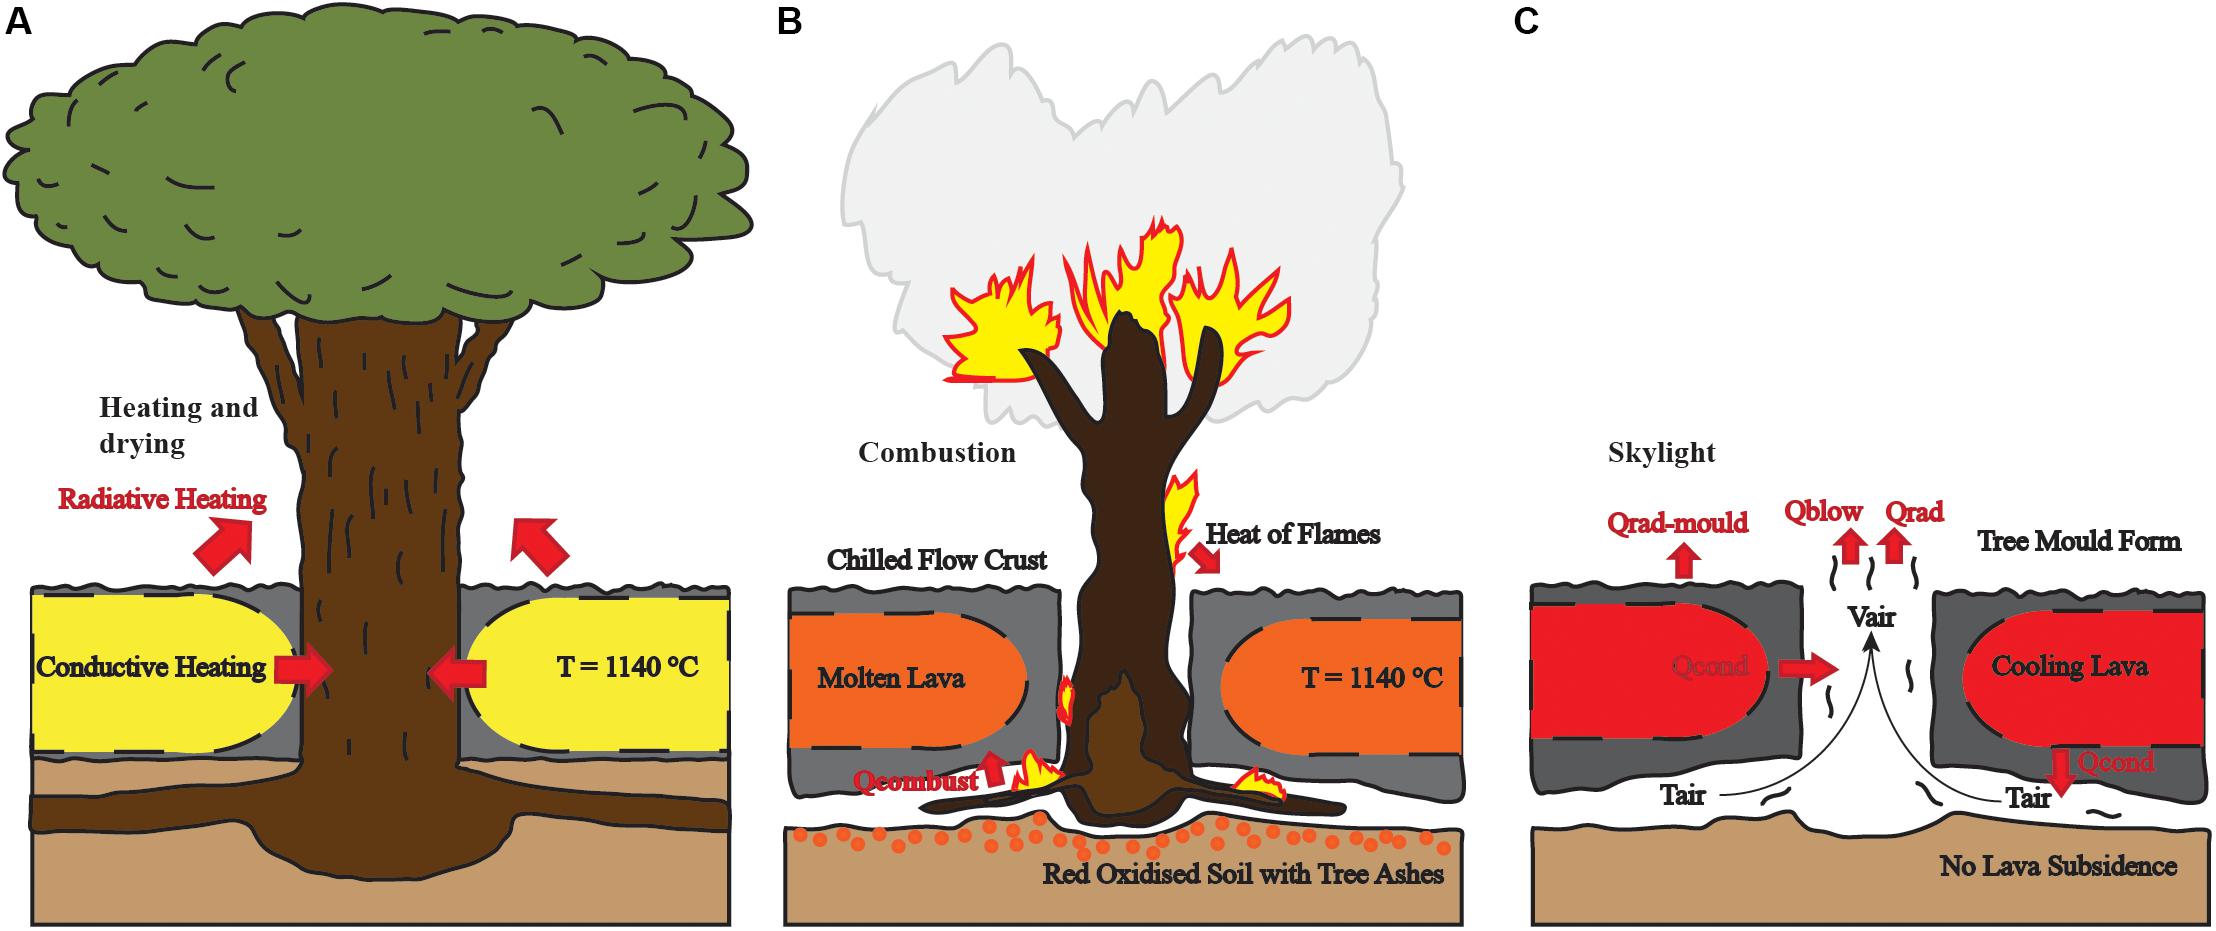
Figure 13. Cartoon showing the three-step model for tree mold formation (cf. Figure 2): (A) heating and drying, (B) combustion, (C) skylight. Qheat, combustion heat loss; Qblow, tree mold heat loss; Qrad, radiative heat loss; Qconv, convected heat loss; Qcond, conducted heat loss; Vair, air exit speed; Tair, air temperature in the root mold (see text).
Stage 1: Heating and Drying
The first stage of the thermal model (Figure 13A) describes the initial heat exchange between the lava and the tree to dry and heat the tree prior to combustion. Hence, this flux is Qdry. Following the forest fire literature (Thomas et al., 1964; Van Wagner, 1967), when engulfed by lava, the above-surface part of the tree (trunk and canopy) will be heated by radiation, and the buried part will be heated by conduction (cf. Anderson, 1968; Dickinson and Johnson, 2001). In both cases energy is transferred from the lava to heat and then evaporate water within the tree-wood, which our results show lead to a loss of ∼54% of the tree’s bulk mass (wood + volatiles). Energy is also transferred from the lava to the tree to heat the tree from ambient temperature to its ignition temperature. This all draws heat from the lava by either radiation or conduction (cf. Honda, 1998).
Van Wagner (1967) gives a solution for the heat transferred from an approaching forest fire to nearby trees, where the fire dries and heats the tree before initiating combustion:
The first term describes the energy required to heat the water in the tree to boiling point, in which M is the wood moisture content (54%), w is the weight of fuel per unit area, Cp(H20) is the specific heat capacity of water (4.18 kJ/kg K), and Tboil is 100°C [see Byram et al. (1952), TenWolde et al. (1988) and Ragland et al. (1991) for temperature-dependent thermal properties of wood]. The second term describes the energy involved in vaporizing water contained within the tree, where LH20 is latent heat of evaporation (2260 kJ/kg). Finally, the third term describes energy involved in heating from ambient (Tamb, 25°C) to ignition (Tign, ∼400°C) temperature, in which Cp(wood) is the specific heat capacity of the wood (1.76 kJ/kg K). The advantage of this solution is that it includes both radiative and conductive losses, and avoids the difficult-to-solve issue of defining flame emissivity (cf. Hottel, 1954; Yuen and Tien, 1977; Harris, 2013).
Given the total height of the main tree trunk (mold depth + non-combusted trunk length) of 7.6 m and the trunk radius of 0.3 m, we have a trunk volume of 2.1 m3 which, for wet and dry wood densities of 950 and 600 kg m–3, converts to a mass of 1975 kg for the water-charged tree (for use in terms 1 and 2) and 1250 kg for the dried-out tree trunk (for use in term 3). For our tree surface area of 14 m2, this gives a weight of fuel per unit area of 140 kg m–2 for the wet case, and 90 kg m–2 for the dry case. This yields 2500, 17100 and 5900 kJ m–2 required to (1) heat the tree-water to boiling point, (2) vaporize the water, and (3) heat the wood to combustion point, respectively.
While Babrauskas (2002) gives 4.3 kW m–2 as the minimum energy flux required for ignition of a tree, Bilbao et al. (2001) give a value of 10–55 kW m–2 to trigger the transition from smoldering to ignition. Given that this transition occurred over a period of 11 to 900 s (Bilbao et al., 2001), this converts to a typical value of 50–9000 kJ m–2 required to trigger combustion. Our total value for Qdry (25 500 kJ m–2) is well in excess of this threshold, and so we have a heat flux environment highly favorable to combustion.
Following our experiments, we can also write the heat budget for stage 1 in terms of work consumed in the vaporization process (Qvap), heat of enthalpy (Qenth) and work done in heating the wood to ignition temperature (Qheat). Here,
in which mH2O is the mass of water heated and vaporized, LH2O+ is the energy involved in heating the water to boiling point and then vaporizing it (2600 kJ kg–1, Keszthelyi, 1995), E is enthalpy, mH2O+CO2 is the mass of tree converted to water and carbon dioxide, and mwood is the mass of dry wood. Given that (1) 54% of the mass of the tree is water, and (2) 86% of the wet wood mass is converted to volatiles (H2O and CO2) we obtain mH2O, mH2O+CO2 and mwood of 1065, 1700 and 175 kg, respectively. This, with our measured value for enthalpy (500 kJ kg–1), gives Qvap, Qenth and Qheat of 2.8, 0.9 and 0.1 GJ, respectively. The total of 3.8 GJ (Supplementary Materials 4Supplementary Table 5) compares with 3.6 GJ calculated using the Van Wagner (1967) method. While the Van Wagner (1967) approach is theoretical, our approach is measurement driven. If the theory and measurement are in-line, then we have more confidence in both. The consistency between the two results thus gives us confidence in there being around 3.7 GJ of energy lost from the lava during drying and heating of the tree, and that the equations given here are appropriate to be applied to model stage 1.
To convert the energy (in Joules) to heat flux (in Watts) we need to constrain the duration of stage 1. At 12:02 (Hawaiian Standard Time) on October 24, 2014, the lava flow front was just 170 m west of the tree (Figure 3). Given an advance rate of 400 m/day (Patrick et al., 2017), the lava would have reached the tree around 10 h later at 22:00. This is not consistent with a thermal image acquired around 22:00 that shows the tree had already been felled. That is, the lower part of the tree had dried, heated and burnt, removing support to the trunk so that the tree had been felled by 22:00. Harris and Thornber (1999) describe pāhoehoe advance on Kilauea during the night of 10–12 August 1997, showing that advance rates can be highly variable over a period of just a few hours, recording an increase from 200 to 1000 m/day over 9 h. Given a value of 1000 m/day as the shorter endmember for the arrival time, the flow front would have advanced the 170 m to the tree in 4 h, for a more likely arrival time of around 16:30. This means that stage 1 lasted no more than six hours. That is, interaction began around 16:30 when the lava arrived at the tree, and was over 6 h later, by 22:00, when stage 1 was observed to have been completed. This means that heat fluxes during stage 1 (Qtree–stage1) were of the order of 105 W.
Following Hon et al. (1994), surface temperatures (Tsurf) on a cooling pāhoehoe crust can be calculated to have declined from around 800°C upon emplacement to 195°C after six hours. Thus, the standing tree would have been exposed to temperatures in excess of 200°C for the best part of the six hours. According to Martin (1963), injury to a tree will occur (i.e., damage to plant tissue will begin) in just a few minutes after first exposure to the hot lava flow surface. Injury will then become progressively worse until the interaction becomes fatal to the tree (Martin, 1963). Thus between exposure to high temperatures through the time the tree was still standing, the tree was undergoing increasing degrees of injury until what Martin (1963) terms “lethal” conditions were reached, and stage 1 ended. That is the intensity and duration of the heating was sufficient so as to allow the tree to complete stage 1 (drying and heating) and enter into stage 2 (combustion).
Stage 2: Combustion
The second stage of our thermal model involves combustion of the tree wood remaining in the tree mold (Figure 13B). Once the ignition temperature is reached, the cellulose, hemicellulose and lignin components of the wood are exothermically transformed into volatiles and charcoal (our data). This stage may have thus added chemical elements to the lava surrounding the tree mold. In this regard, although Searle (1958) reports penetration of basalt into shrinkage cracks in charcoal, we are not aware of reports of mixing of combustion-liberated volatiles with the lava itself. Moreover, heat released from combustion likely acted to arrest post-quenching lava cooling at the tree-contact, potentially providing more time for degassing and facilitating the transition from S-Type to P-Type pāhoehoe adjacent to the tree mold.
In such a combustion system reactions become exothermic (Kuo, 2005; Glassman et al., 2014) and heat transfer from flames and combusting wood to the surrounding environment is by radiation and conduction (cf. Anderson, 1968; Viskanta, 1987; Dickinson and Johnson, 2001). Our wood DSC analysis shows that the energy released during this exothermic combustion stage is of the order of 104 W m–2. The heat transfer back into the lava (Qcombust) can thus be described by:
in which mcombust is the mass of wood combusted and Lcombust is the latent heat of combustion (20 MJ kg–1). We apply this to the mass of wood that was entirely combusted, as given by the space vacated by the trunk to create the tree and root mold system. This has a volume of 1.4 m3, which when wet (density = 950 kg m–3) would have had a mass of 1325 kg. Our experiments give a mass reduction factor due to combustion by 0.088, so that mcombust would have been 120 kg for a Qcombust of 2.4 GJ. This is consistent with Honda (1998, 1999) who showed that a larch tree engulfed by lava at Mt. Fuji (Japan) was capable of generating 120 and 10 MJ kg–1 due to combustion of H2 and CO, respectively; which were together capable of giving out 42 GJ of energy.
With an energy release of 104 W m–2 (the energy of combustion calculated here) and a perimeter surface area of 9.4 m2 (for the tree mould and root system, i.e., the perimeter of the space vacated by combusted material), we obtain a heat flux of 95 kW. This is consistent with burn simulations by McGrattan et al. (2000) who give heat release rates due to combustion of 50–1200 kW. These results (2.3 × 10⁹ J of energy released at a flux of 95 kW) give a seven-hour burn time. This period is consistent with our burn experiments (Supplementary Materials 4Supplementary Figure 7), which can be best fitted (R2 = 0.8) with the relation y = 111 ln(x) + 522, in which y is time in minutes to convert all remaining mass to ash and x is trunk diameter in meters. Given a trunk diameter of 0.6 m, this gives a burn time of 7.75 h. This means that the section of the trunk and its root system buried by the lava took between 7 and 8 h to fully combust. During this time, thermal conditions inside the mold would have been held at flame temperature. This would have caused the lava cooling trend to be placed on hold, and even reversed, that is, the contact surface lava could have been reheated by the flames, during this second stage of tree mold formation.
Stage 3: Skylight
In the last stage of the thermal model the Albizia tree has entirely combusted, and an open pipe system is created in which temperatures are high, and in which the vertical tree-mold acts as a skylight in a lava tube system (cf. Witter and Harris, 2007; Figure 13C). At this point, there is no chemical or textural interaction between tree and lava, but the presence of the tree mold affects the lava cooling. As with the model of Keszthelyi (1995), the residual heat in the cooling lava around the mold will heat the air in the tree-root mold system, where the hot air will then blow out of the skylight. This will remove heat from the lava surrounding the mold, once again accelerating cooling rates (cf. Witter and Harris, 2007). However, the effect of fluxing hot air through the root mold part of the system may hold the temperature at a level high enough to further enhance the creation of a glazed veneer as observed around the root mold (cf. Allred, 1998).
Following Keszthelyi (1995) and Witter and Harris (2007) the heat flux from such a system can be expressed in terms of heat carried by the hot air blowing out of the mold-system (Qblow) and radiation direct to space (Qrad–mold):
Here, Uair is the velocity of the air blowing out of the tree mold, ρair is the hot air density (0.24 kg m–3) and Cp(air) is the specific heat capacity of the hot air (1223 J/kg K), ε is emissivity and σ is the Stefan-Boltzmann constant. For a typical Uair encountered at skylights in lava tubes (2 m s–1; Witter and Harris, 2007) and Tair–heated of 1000°C, this gives Qblow of 0.6 MW m–2 and Qrad–mold of 0.1 MW m–2. Given a perimeter area of 9.4 m2 for the horizontal and vertical pipes making up the trunk and root mold system, and a cross-sectional area to the vertical portion of the mold these convert to 5.44 and 0.04 MW, for a total loss from the open system of 5.48 MW. Following Hon et al. (1994), the interior of a 2.2 m thick lobe of pāhoehoe will take 660 hours to cool below 1070°C. This will approximately be the time that the tree mold will be subject to heating by air at such temperatures. Thus, during this phase, 1270 GJ (= 5.48 MW × 660 hours) will be liberated.
Comparison With “Tree-Free” Conditions
We now assess to what extent the heat flux from the lava would have been enhanced by the presence of the tree over a tree-free case, and whether the presence of the tree, theoretically, could have increased the lava cooling rate. Following Keszthelyi and Denlinger (1996), radiative (Qrad) and convective (Qconv) heat fluxes from tree-free lava can be approximated by Stefan Boltzmann,
and the convective heat transfer coefficient (hc),
Using an emissivity (ε) of 0.95 and hc of 50 W m–2 K (Keszthelyi, 2003), we obtain a total heat flux from the pāhoehoe surface, for a tree-free scenario, of 105 W upon emplacement (Tsurf = 800°C). This would have declined to 104 W after six hours (Tsurf = 195°C). This means that, locally, the presence of the tree would have caused total heat fluxes to have been doubled upon arrival of the lava at the tree during stage 1, where the additional heat flux due to the presence of the tree is also 105 W (Supplementary Materials 4Supplementary Table 5). By the end of stage 1 (i.e., after a maximum of six hours), the presence of the tree would have enhanced the total heat flux by up to an order of magnitude (over tree-free conditions) as the additional heat loss due to the presence of the tree would still have been 105 W (Supplementary Materials 4Supplementary Table 5).
Cooling rates of the interior of the flow per unit distance (dT/dx) can be approximated from total heat loss (Qtot) in Keszthelyi and Self (1996),
in which v is flow velocity (0.01 m s–1 in this case, from 1000 m day–1), d is flow depth (2 m, the typical depth of inflated pāhoehoe after six hours following Hon et al., 1994), ρ is lava bulk density (2000 kg m–3, our values), and cp is lava specific heat capacity (1225 J/kg K; Keszthelyi and Denlinger, 1996). For the tree-free case where Qtot is 105 W, we obtain 1.95°C m–1. If we add the tree-related heat flux, as argued above, Qtot doubles to 2 × 10⁵ W and the cooling rate increases to 5.00°C m–1. In the tree-free case, the decline in Qtot to 104 W after six hours should mean that the cooling rate declines to 0.21°C m–1 at this time. However, the effect of continued heat exchange between the lava and the tree at a rate of 105 W would increase the value at 3.26°C m–1. Thus, at the lava-tree contact, enhanced heat transfer from the lava should increase the cooling rate, and then maintains the cooling rate at higher-than-normal levels until the tree begins to combust and enter stage 2. In this regard, Searle (1958) also evokes “rapid cooling” of lava around a tree due to “passage through the lava of gases distilled from the green timber.” Such processes thus explain the elevated cooling rates found for lava surfaces in contact with the tree trunk during stage 1, as well as chemical anomalies.
Implications for Thermal Effects of Tree Mold Formation
While stages 1 and 3 serve to accelerate cooling and crystallization around the tree (over the tree-free condition), stage 2 reverses cooling and crystallization trends potentially heating the lava, albeit very locally at the tree-lava contact. In terms of flow emplacement dynamics, stage 1 has the greatest effect on lava cooling as it occurs upon lava emplacement and while lava is flowing around the drying tree. It has the potential to enhance cooling and crystallization rates, while also modifying the lava major element chemistry within 0.1 mm of the contact (Supplementary Materials 2Supplementary Figure 4) and volatile content within 5 mm (Figure 9). However, whether this effect can be transmitted beyond a few cm of the tree mold system, to affect the whole lava flow, depends on several factors including trunk size, tree spatial density and tree moisture content, as well as parameters not tested here such as bark thickness (Vines, 1968) and wind speed (Anderson and Rothermel, 1965). Through analogy with heat exchanges between forest fires and trees, to maximize lava-tree interactions a dense network of thin, water-rich trunks is needed (cf. Van Wagner, 1967). In the cases considered here, despite the considerable effects at the lava-tree contact, the tree density and type was insufficient to influence broader lava cooling, crystallization, vesicularity, and chemistry in the far field (i.e., beyond a few cm). For the 1974 lava flow system, we saw no abnormal cooling or crystallization with distance from the vent, cooling rates being 4°C km–1 (Chevrel et al., 2019), which compare with rates of 4–7°C km–1 recorded for tree-free lava channels (Cashman et al., 1999; Riker et al., 2009; Robert et al., 2014). This was in spite of the presence of a lava-tree density of 20–30 trees/ha for the J74 case (Chevrel et al., 2019). For the 2014 case, creation of the tree mold did play a role in modifying thermal, physical and chemical conditions at the contact between the mold and the lava, changing the lava morphology by transforming S-Type pāhoehoe to P-Type pāhoehoe and creating glazed surfaces. However, a control sample taken 40 m from the tree mold indicated no effect. If, however, we increase the fuel load from that obtained here (20 Mg/ha, trunk diameter = 0.6 m) to that expected for tropical rainforests, i.e., 180 Mg/ha where the majority of the trunks have a diameter of > 0.76 m (Uhl and Kauffman, 1990), we increase the energy loss in our quantitative model (for stage 1) by two orders of magnitude (i.e., from 4 × 10⁹ J to 6 × 10¹¹ J) during stage 1. We may thus witness a far-field effect in such a scenario, as could be envisaged in zones around the Big Island of Hawaii or on Piton de la Fournaise where tropical rain forest cover applies.
Conclusion
Many active volcanoes are forest-clad, so that understanding the physical, chemical and thermal interaction between a lava and the trees it encounters is essential if we are to adequately understand and model lava flow emplacement. To fill this knowledge-gap, we present here a detailed textural, chemical and thermal description of a lava-tree interaction, focusing on a single tree mold that formed in Kilauea’s Pāhoa 2014 lava flow. Results show an enrichment in volatiles (in particular H2O and CO2) and a decrease in vesicularity (and hence increase in density) for lava samples in contact with the tree. This is accompanied by an increase in the population of large vesicles, lower crystallinity and higher concentration of dendritic oxides. Lava surrounding the tree also cooled faster (at > 70°C min–1) than the lava surface (10–30°C min–1). All samples collected at the tree contact behaved similarly as a thin quenched layer formed where accelerated cooling rates applied during the first hours of emplacement due to heating of the tree and vaporization of tree fluids. The exception is a sample from the root bowl, which evolved in a different cooling environment where temperatures were first elevated due to combustion, and then held at high (∼1000°C) levels for around 660 h.
To begin to build a useable thermal model for lava-tree interaction, we have used thermal analyses of the wood engulfed by the lava so as to characterize its mass loss during drying and volatilization, and have identified, described and parameterized three combustion stages in the interaction process: tree drying and fluid volatilization, dry wood combustion and heat loss through an open “cave” (cf. Ogawa et al., 1999; Bella and Gaal, 2007) or “tube-skylight” system (cf. Keszthelyi, 1995 and Witter and Harris, 2007). All results converge on the same conclusion, that the analyzed tree had a local cooling effect on its surrounding lava, but this appears to be limited to the 5 mm layer of lava quenched against the tree. Fast cooling and slow diffusivity within this layer act as a strong insulating cover, stifling further interaction between the lava and the tree. However, given a sufficient number, size and water content of trees, a far field effect may be expected. This now needs to be tested and, potentially, included in thermo-rheological models for lava flow advance over forested terrain, where the equations given here provide a basis for this next step.
Several models exist to simulate the theoretical thermo-rheological evolution of lava down-system such as SCIARA (Crisci et al., 1986), FLOWGO (Harris and Rowland, 2001), LavaSIM (Hidaka et al., 2005) and MAGFLOW (Del Negro et al., 2005). Others exist that are flow path based (e.g., Young and Wadge, 1990; Kauahikaua et al., 1995; Favalli et al., 2005) or use an isothermal Bingham rheology to recreate emplacement of a fluid on an inclined plane (e.g., Dragoni et al., 1986; Balmforth et al., 2006; Bernabeu et al., 2016). However, with the exception of Bernabeu et al. (2018), none of these model tree-interactions. This is because, unlike in the tree-free case where data exist to assess down flow cooling and crystallization (e.g., Cashman et al., 1999; Riker et al., 2009; Robert et al., 2014) and the theoretical basis of cooling is well-defined (e.g., Keszthelyi, 1995; Keszthelyi and Denlinger, 1996), no such treatment exists for interaction with a tree. We here provide data to fill this gap, and draw on the forest fire literature to build the components of a thermal model that could be incorporated into future attempts to simulate and link lava flow cooling, crystallization and rheology, and the thermo-rheological effects on lava flow dynamics, for a lava moving through a forest from proximal through distal portions of a lava flow system.
Data Availability Statement
All datasets presented in this study are included in the article/Supplementary Material.
Author Contributions
JB prepared the samples, carried out the experiments, analyzed the data and wrote the manuscript with support from AH, HT, MC, and LG. All authors provided critical feedback and helped shape the research, analysis and manuscript. MB carried out ICP-AES experiments. IV carried out ICP-MS experiments. CF carried out CHNS-O experiments with support from JB. FS supervised FTIR experiments. HT contributed to TGA-DSC experiments. LC analyzed FOAMS data. AH supervised the project and developed the thermal model with support from HT.
Conflict of Interest
The authors declare that the research was conducted in the absence of any commercial or financial relationships that could be construed as a potential conflict of interest.
Funding
This work is based on JB Master’s thesis at LMV, Université Clermont-Auvergne and was funded by the Agence National de la Recherche through project ANR-LAVA (DS0902 2016; Project: ANR-16 CE39-0009). Fieldwork was supported by Laboratory of Excellence ClerVolc program 6. This is ANR-LAVA contribution n° 14 and ClerVolc contribution no 416.
Acknowledgments
The authors gratefully acknowledge the support of Matthew Patrick of the Hawaiian Volcano Observatory and the National Park Service for granting us research and sampling permit (Special Use Permit for the Natural Area Reserves System: December 1, 2016 – November 30, 2017). HVO (M. Patrick and T. Orr) are also gratefully acknowledged for the maps and photos that contribute to Figures 1, 3, as well as (unpublished) information regarding activity during the time of tree-inundation. The “pole technique” of LMV (Christophe Constantin, Jean-Luc Devidal, Jean-Marc Henot) is acknowledged for sample preparation and sample analyses. The authors gratefully acknowledge Rick Hazlett for guiding us to a tree mold large enough to climb into, Simon Thivet for image processing, and Ken Koga for translating Honda (1998) for us. HT was supported by a Royal Society University Research Fellowship and thanks Dr. Catherine Wearing for assistance with thermal analysis. Finally, they also thank the two reviewers for their thorough reviews that greatly improved the clarity of this presentation.
Supplementary Material
The Supplementary Material for this article can be found online at: https://www.frontiersin.org/articles/10.3389/feart.2020.00233/full#supplementary-material
Footnotes
- ^ https://www.youtube.com/watch?v=WpQyjVEfx5c
- ^ M. Patrick pers.comm.
- ^ www.wood-database.com, last accessed the 22/05/2019
- ^ http://georem.mpch-mainz.gwdg.de/, last accessed the 28/02/2020.
- ^ www.wood-database.com, last accessed the 22/05/2019.
References
Allred, K. (1998). Lava tube remelt by radiant heat and burning gasses. Int. J. Speleol. 27, 125–134. doi: 10.5038/1827-806X.27.1.13
Anderson, H. E. (1968). Fire spread and flame shape. Fire Technol. 4, 51–58. doi: 10.1007/BF02588606
Anderson, H. E., and Rothermel, R. C. (1965). Influence of moisture and wind upon the characteristics of free-burning fires. Int. Combust. 10, 1009–1019. doi: 10.1016/S0082-0784(65)80243-0
Andronico, D., Branca, S., Calvari, S., Burton, M., Caltabiano, T., Corsaro, R. A., et al. (2005). A multi-disciplinary study of the 2002?03 etna eruption: insights into a complex plumbing system. Bull. Volcanol. 67, 314–330. doi: 10.1007/s00445-004-0372-8
Applegarth, L. J., Tuffen, H., James, M. R., Pinkerton, H., and Cashman, K. V. (2013). Direct observations of degassing-induced crystallization in basalts. Geology 41, 243–246. doi: 10.1130/G33641.1
Babrauskas, V. (2002). Ignition of wood: a review of the state of the art. J. Fire Prot. Eng. 12, 163–189. doi: 10.1177/10423910260620482
Balmforth, N., Craster, R., Rust, A., and Sassi, R. (2006). Viscoplastic flow over an inclined surface. J. Non Newton. Fluid Mech. 139, 103–127. doi: 10.1016/j.jnnfm.2006.07.010
Bell, B. R., and Williamson, I. T. (2017). Fossil trees, tree moulds and tree casts in the palaeocene mull lava field, nw scotland: context, formation and implications for lava emplacement. Earth Environ. Sci. Trans. R. Soc. Edinburgh 107, 53–71. doi: 10.1017/S175569101700007X
Bella, P., and Gaal, L. (2007). Tree mould caves within the framework of cave genetic classification. Nat. Conserv. 63, 6–11.
Bernabeu, N., Saramito, P., and Harris, A. J. L. (2018). Laminar shallow viscoplastic fluid flowing through an array of vertical obstacles. J. Nonnewton. Fluid Mech. 257, 59–70. doi: 10.1016/j.jnnfm.2018.04.001
Bernabeu, N., Saramito, P., and Smutek, C. (2016). Modelling lava flow advance using a shallow-depth approximation for three-dimensional cooling of viscoplastic flows. Geol. Soc. Lond. Spec. Publ. 426, 409–423. doi: 10.1144/SP426.27
Bertile, W. (1987). Des Coulées Volcaniques a Saint-Philippe (Mars 1986): Gestion d’une Catastrophe Naturelle. Auckland: AGM.
Bilbao, R., Mastral, J. F., Aldea, M. E., Ceamanos, J., Betrán, M., Lana, J. A., et al. (2001). Experimental and theoretical study of the ignition and smoldering of wood including convective effects. Combust. Flame 126, 1363–1372. doi: 10.1016/S0010-2180(01)00251-6
Byram, G. M., Sauer, F. M., Wallace, L., and Arnold, R. K. (1952). Thermal Properties of Forest Fuels. Interim Technical Report Report AFSWP-404. Washington, DC: USDA Forest Service.
Calvari, S., and Pinkerton, H. (1999). Lava tube morphology on etna and evidence for lava flow emplacement mechanisms. J. Volcanol. Geotherm. Res. 90, 263–280. doi: 10.1016/S0377-0273(99)00024-4
Carveni, P., Mele, G., Benfatto, S., Imposa, S., and Salleo Puntillo, M. (2011). Lava trees and tree molds (‘cannon stones’) of Mt. Etna. Bull. Volcanol. 73, 633–638. doi: 10.1007/s00445-011-0446-3
Cashman, K., Mangan, M., and Newman, S. (1994). Surface degassing and modifications to vesicle size distributions in active basalt flows. J. Volcanol. Geotherm. Res. 61, 45–68. doi: 10.1016/0377-0273(94)00015-8
Cashman, K. V., Thornber, C., and Kauahikaua, J. P. (1999). Cooling and crystallization of lava in open channels, and the transition of pāhoehoe lava to ‘A’ā. Bull. Volcanol. 61, 306–323. doi: 10.1007/s004450050299
Chevrel, M. O., Harris, A. J. L., Ajas, A., Biren, J., Gurioli, L., Calabrò, L., et al. (2019). Investigating physical and thermal interactions between lava and trees: the case of kīlauea’s July 1974 flow. Bull. Volcanol. 81:6. doi: 10.1007/s00445-018-1263-8
Crisci, G. M., di Gregorio, S., Pindaro, O., and Ramieri, G. (1986). Lava flow simulation by a discrete cellular model: first implementation. Int. J. Model. Simul. 6, 137–140. doi: 10.1080/02286203.1986.11759975
Crisp, J., Cashman, K. V., Bonini, J. A., Hougen, S. B., and Pieri, D. C. (1994). Crystallization history of the 1984 mauna loa lava flow. J. Geophys. Res. 99, 7177–7198. doi: 10.1029/93JB02973
Del Negro, C., Fortuna, L., and Vicari, A. (2005). Modelling lava flows by cellular nonlinear networks (CNN): preliminary results. Nonlinear Process. Geophys. 12, 505–513. doi: 10.5194/npg-12-505-2005
Denton, J. S., Tuffen, H., and Gilbert, J. S. (2012). Variations in hydration within perlitised rhyolitic lavas—evidence from torfajökull, Iceland. J. Volcanol. Geotherm. Res. 223–224, 64–73. doi: 10.1016/j.jvolgeores.2012.02.005
Dickinson, M. B., and Johnson, E. A. (2001). Fire Effects on Trees. In Forest Fires. Amsterdam: Elsevier, 477–525.
Dragoni, M., Bonafede, M., and Boschi, E. (1986). Downslope flow models of a Bingham liquid: implications for lava flows. J. Volcanol. Geother. Res. 30, 305–325. doi: 10.1016/0377-0273(86)90059-4
Favalli, M., Pareschi, M., Neri, A., and Isola, I. (2005). Forecasting lava flow paths by a stochastic approach. Geophys. Res. Lett. 32:L03305. doi: 10.1029/2004GL021718
Fons, W. L. (1950). Heating and ignition of small wood cylinders. Ind. Eng. Chem. 42, 2130–2133. doi: 10.1021/ie50490a035
Forbes, A. E. S., Blake, S., and Tuffen, H. (2014). Entablature: fracture types and mechanisms. Bull. Volcanol. 76:820. doi: 10.1007/s00445-014-0820-z
Gašparovič, L., Koreňová, Z., and Jelemenský, L’ (2010). Kinetic study of wood chips decomposition by TGA. Chem. Pap. 64, 174–181. doi: 10.2478/s11696-009-0109-4
Global Volcanism Program (2002). “Report on Kilauea (United States),” in Bulletin of the Global Volcanism Network, Vol. 27, ed. R. Wunderman (Washington, DC: Smithsonian Institution). doi: 10.5479/si.GVP.BGVN200205-332010
Greenwell, A., Holdsworth, B., Lincoln, N., and Van Dyke, P. (2009). Garden Ethnobotanical Guide to Native Hawaiian Plants & Polynesian-Introduced Plants. Bernice: Bishop Museum Press.
Gurioli, L., Colo’, L., Bollasina, A. J., Harris, A. J. L., Whittington, A., Ripepe, M., et al. (2014). Dynamics of strombolian explosions: inferences from field and laboratory studies of erupted bombs from stromboli volcano: dynamics of strombolian explosions. J. Geophys. Res. Solid Earth 119, 319–345. doi: 10.1002/2013JB010355
Harris, A. J. L. (2013). Thermal Remote Sensing of Active Volcanoes: A User’s Manual. Cambridge, MA: Cambridge Univ. Press.
Harris, A., Flynn, L., Keszthelyi, L., Mouginis-Mark, P., Rowland, S., and Resing, J. (1998). Calculation of lava effusion rates from landsat tm data. Bull. Volcanol. 60, 52–71. doi: 10.1007/s004450050216
Harris, A. J. L., Keszthelyi, L., Flynn, L. P., Mouginis-Mark, P. J., Thornber, C., Kauahikaua, J., et al. (1997). Chronology of the episode 54 eruption at Kilauea volcano, Hawaii, from GOES-9 satellite data. Geophys. Res. Lett. 24, 3281–3284. doi: 10.1029/97gl03165
Harris, A. J. L., and Rowland, S. (2001). FLOWGO: a kinematic thermo-rheological model for lava flowing in a channel. Bull. Volcanol. 63, 20–44. doi: 10.1007/s004450000120
Harris, A. J. L., and Rowland, S. K. (2015). “FLOWGO 2012: an updated framework for thermorheological simulations of channel-contained lava,” in Hawaiian Volcanoes: From Source to Surface, Geophysical Monograph, Vol. 208, eds R. Carey, V. Cayol, M. Poland, and D. Weis (Washington, DC: American Geophysical Union).
Harris, A. J. L., Rowland, S. K., Villeneuve, N., and Thordarson, T. (2017). Pāhoehoe, ‘a‘ā, and block lava: an illustrated history of the nomenclature. Bull. Volcanol. 79:7. doi: 10.1007/s00445-016-1075-7
Harris, A. J. L., and Thornber, C. R. (1999). Complex effusive events at kīlauea as documented by the GOES satellite and remote video cameras. Bull. Volcanol. 61, 382–395. doi: 10.1007/s004450050280
Hazlett, R. W. (1993). Geological Field Guide at Kilauea Volcano. Honolulu: Hawaii Natural History Association.
Heliker, C., and Mattox, T. N. (2003). The First Two Decades of the Pu’ u ‘Ō’ō-Kūpaianaha Eruption: Chronology and Selected Bibliography. Reston: US Geological Survey, 1–20.
Helz, R. T., Heliker, C., Hon, K., and Mangan, M. (2003). Thermal efficiency of lava tubes in the pu‘u ‘o‘o - kupaianaha eruption. Paper Presented at The Pu‘u ‘O‘o-Kupaianaha Eruption of Kïlauea Volcano, Hawai‘i: The First 20 Years U.S. Geological Survey Professional Paper, (Reston: US Geological Survey), 105–120.
Helz, R. T., and Thornber, C. R. (1987). Geothermometry of Kilauea Iki Lava Lake, Hawaii. Bull. Volcanol. 49, 651–668. doi: 10.1007/BF01080357
Hidaka, M., Umino, S., and Fujita, E. (2005). VTFS project: development of the lava flow simulation code LavaSIM with a model for three-dimensional convection, spreading, and solidification. Geochem. Geophys. Geosyst. 6:Q07008. doi: 10.1029/2004GC000869
Higgins, M. D. (2000). Measurement of crystal size distributions. Am. Mineral. 85, 1105–1116. doi: 10.2138/am-2000-8-901
Hon, K., Kauahikaua, J., Denlinger, R., and Mackay, K. (1994). Emplacement and inflation of pahoehoe sheet flows: observations and measurements of active lava flows on kilauea Volcano, Hawaii. Geol. Soc. Am. Bull. 106, 351–370. doi: 10.1130/0016-7606(1994)106<0351:eaiops>2.3.co;2
Honda, T. (1998). Physico-chemical explanation for remeleting process of inner surface wall of Tainai tree molds located on the flank of Mt. Fuji. J. Speleol Soc. 23, 29–38.
Honda, T. (1999). “Classification of lava tree molds with/witout remelted inner surface according to its formation process,” in Proceedings of the 9th International Symposium on Volcanospeleology, Catania.
Hottel, H. C. (1954). “Radiant heat transmission,” in Heat Transmission, third Edn, ed. W. H. McAdams (USA: McGraw - Hill Book Company Inc).
Houghton, B. F., and Wilson, C. J. N. (1989). A vesicularity index for pyroclastic deposits. Bull. Volcanol. 51, 451–462. doi: 10.1007/BF01078811
Jones, T. J., Llewellin, E. W., Houghton, B. F., Brown, R. J., and Vye-Brown, C. (2017). Proximal lava drainage controls on basaltic fissure eruption dynamics. Bull. Volcanol. 79:81. doi: 10.1007/s00445-017-1164-2
Kauahikaua, J., Margriter, S., Lockwood, J., and Trusdell, F. (1995). “Applications of GIS to the estimation of lava flow hazards on Mauna Loa Volcano, Hawai’i,” in Mauna Loa Revealed: Structure, Composition, History and Hazards, eds J. M. Rhodes and J. P. Lockwood (Washington, DC: American Geophysical Union), 315–325. doi: 10.1029/gm092p0315
Keszthelyi, L. (1995). A preliminary thermal budget for lava tubes on the earth and planets. J. Geophys. Res. Solid Earth 100, 20411–20420. doi: 10.1029/95JB01965
Keszthelyi, L. (2003). Observations of the effect of wind on the cooling of active lava flows. Geophys. Res. Lett. 30:1989. doi: 10.1029/2003GL017994
Keszthelyi, L., and Denlinger, R. (1996). The initial cooling of pahoehoe flow lobes. Bull. Volcanol. 58, 5–18. doi: 10.1007/s004450050121
Keszthelyi, L., and Self, S. (1996). Some physical requirements for the emplacement of long basaltic lava flows. J. Geophys. Res. 27, 447–464.
Kolzenburg, S., Giordano, D., Thordarson, T., Höskuldsson, A., and Dingwell, D. B. (2017). The rheological evolution of the 2014/2015 Eruption at holuhraun, central Iceland. Bull. Volcanol. 79:16. doi: 10.1007/s00445-017-1128-6
Lipman, P. W., and Banks, N. G. (1987). A‘a Flow Dynamics, Mauna Loa 1984. Reston: U.S. Geological Survey, 1527–1567.
Lockwood, J. P., and Hazlett, R. W. (2010). Volcanoes: Global Perspectives. Hoboken, NJ: John Wiley & sons Inc.
Lockwood, J. P., and Williams, I. S. (1978). Lava trees and tree moulds as indicators of lava flow direction. Geol. Magazine 115:69. doi: 10.1017/S0016756800041005
Macdonald, G. A., Abbott, A. T., and Peterson, F. L. (1983). Volcanoes in the Sea: The Geology of Hawaii, Second Edn. Honolulu: University of Hawaii press.
Mader, H. M., Llewellin, E. W., and Mueller, S. P. (2013). The rheology of two-phase magmas: a review and analysis. J. Volcanol. Geotherm. Res. 257, 135–158. doi: 10.1016/j.jvolgeores.2013.02.014
Marsh, B. D. (1998). On the interpretation of crystal size distributions in magmatic systems. J. Petrol. 39, 553–599. doi: 10.1093/petroj/39.4.553
Martin, R. E. (1963). A Basic Approach to Fire Injury of Tree Stems. Tallahassee, FL: Tall Timbers Research, Inc, 151–162.
McGrattan, K. B., Baum, H. R., Rehm, R. G., Hamins, A., and Forney, G. P. (2000). Fire Dynamics Simulator- Technical Reference Guide. NIST IR 6467. Gaithersburg, MD: National Institute of Standards and Technology.
Mell, W., Maranghides, A., McDermott, R., and Manzello, S. L. (2009). Numerical simulation and experiments of burning douglas fir trees. Combust. Flame 156, 2023–2041. doi: 10.1016/j.combustflame.2009.06.015
Mercier, M., Di Muro, A., Métrich, N., Giordano, D., Belhadj, O., Mandeville, C. W., et al. (2010). Spectroscopic analysis (FTIR, Raman) of water in mafic and intermediate glasses and glass inclusions. Geochim. Cosmochim. Acta 74, 5641–5656. doi: 10.1016/j.gca.2010.06.020
Moore, J. G., and Richter, D. H. (1962). Lava tree molds of the September 1961 Eruption, Kilauea Volcano, Hawaii. Geol. Soc. Am. Bull. 73:1153. doi: 10.1130/0016-7606(1962)73[1153:ltmots]2.0.co;2
Morgan, D. J., and Jerram, D. A. (2006). On estimating crystal shape for crystal size distribution analysis. J. Volcanol. Geotherm. Res. 154, 1–7. doi: 10.1016/j.jvolgeores.2005.09.016
Ogawa, T., Tachihara, H., and Oosako, T. (1999). “Results of survey on ganno-ana cave system, example of co-existence of lava caves and tree molds,” in Proceedings of the 9 th International Symposium on Volcanospeleology, Catania.
Patrick, M., Orr, T., Fisher, G., Trusdell, F., and Kauahikaua, J. (2017). Thermal mapping of a pāhoehoe lava flow, Kīlauea Volcano. J. Volcanol. Geotherm. Res. 332, 71–87. doi: 10.1016/j.jvolgeores.2016.12.007
Pinkerton, H., and Stevenson, R. J. (1992). Methods of determining the rheological properties of magmas at sub-liquidus temperatures. J. Volcanol. Geotherm. Res. 53, 47–66. doi: 10.1016/0377-0273(92)90073-M
Poland, M. (2016). The 2014–2015 Pāhoa Lava Flow Crisis at Kīlauea Volcano, Hawai’i: Disaster Avoided and Lessons Learned. Washington, DC: GSA, 4–10. doi: 10.1130/GSATG262A.1
Pratt, L., and Gon, S. M. III (1998). Terrestrial Ecosystems. Honolulu: University of Hawaii Press, 121–129.
Putirka, K. D. (2008). Thermometers and barometers for volcanic systems. Rev. Mineral. Geochem. 69, 61–120. doi: 10.2138/rmg.2008.69.3
Putirka, K. D., Perfit, M., Ryerson, F. J., and Jackson, M. G. (2007). Ambient and excess mantle temperatures, olivine thermometry, and active vs. passive upwelling. Chem. Geol. 241, 177–206. doi: 10.1016/j.chemgeo.2007.01.014
Ragland, K. W., Aerts, D. J., and Baker, A. J. (1991). Properties of wood for combustion analysis. Bioresour. Technol. 37, 161–168. doi: 10.1016/0960-8524(91)90205-X
Richter, D. H., Eaton, J. P., Murata, K. J., Ault, W. U., and Krivoy, H. L. (1970). Chronological Narrative of the 1959-60 Eruption of Kilauea Volcano, Hawaii. Report 537E. Professional Paper. Reston: USGS Publications Warehouse.
Riker, J., Cashman, K., Kauahikaua, J., and Montierth, C. (2009). The length of channelised lava flows: insight from the 1859 eruption of Mauna Loa Volcano. Hawaii. J. Volcanol. Geotherm. Res. 183, 139–156. doi: 10.1016/j.jvolgeores.2009.03.002
Robert, B., Harris, A. J. L., Gurioli, L., Médard, E., Sehlke, A., Whittington, A., et al. (2014). Textural and rheological evolution of basalt flowing down a lava channel. Bull. Volcanol. 76:824. doi: 10.1007/s00445-014-0824-8
Robinson, J. M. (1991). Fire from space: global fire evaluation using infrared remote sensing. Int. J. Remote Sens. 12, 3–24. doi: 10.1080/01431169108929628
Ryan, A. G., Russell, J. K., Nichols, A. R. L., Hess, K.-U., and Porritt, L. A. (2015). Experiments and models on H2O retrograde solubility in volcanic systems. Am. Mineral. 100, 774–786. doi: 10.2138/am-2015-5030
Salisbury, M. J., Bohrson, W. A., Clynne, M. A., Ramos, F. C., and Hoskin, P. (2008). Multiple plagioclase crystal populations identified by crystal size distribution and in situ chemical data: implications for timescales of magma chamber processes associated with the 1915 Eruption of Lassen Peak, CA. J. Petrol. 49, 1755–1780. doi: 10.1093/petrology/egn045
Schiavi, F., Walte, N., and Keppler, H. (2009). First in situ observation of crystallization processes in a basaltic-andesitic melt with the moissanite cell. Geology 37, 963–966. doi: 10.1130/G30087A.1
Searle, E. J. (1958). A note on the formation of native iron and other effects associated with contact of basalt and carbonized wood at auckland, New Zealand. New Zeal. J. Geol. Geophys. 1, 451–458. doi: 10.1080/00288306.1958.10422774
Shea, T., Houghton, B. F., Gurioli, L., Cashman, K. V., Hammer, J. E., Hobden, B. J., et al. (2010). Textural studies of vesicles in volcanic rocks: an integrated methodology. J. Volcanol. Geotherm. Res. 190, 271–289. doi: 10.1016/j.jvolgeores.2009.12.003
Smathers, G. A., and Mueller-Dombois, D. (2007). Hawai’i the Fires of Life; Rebirth in Volcano Land, Five Decades of Vegetation Development in the Devastation Area, Site of the 1959 Kīlauea Iki Eruption, Hawaii’s Volcanoes National Park. Honolulu: Mutual Publication.
Stokes, J. F. G. (1991). Heiau of the Island of Hawaii: A Historic Survey of Native Hawaiian Temple Sites. Honolulu: Bishop Museum Press.
TenWolde, A., McNatt, J. D., and Krahn, L. (1988). Thermal Properties of Wood and Wood Panel Products for Use in Buildings. DOE/USDA-21697/1; ORNL/Sub-87-21697/1. Oak Ridge National Lab, TN: Forest Products Lab.
Thivet, S., Gurioli, L., and Di Muro, A. (2020a). Basaltic dyke eruptions at Piton de La Fournaise: characterization of the eruptive products with implications for reservoir conditions, conduit processes and eruptive dynamics. Contrib. Mineral. Petrol. 175:26.
Thivet, S., Gurioli, L., Di Muro, A., Derrien, A., Ferrazzini, V., Gouhier, M., et al. (2020b). Evidences of plug pressurization enhancing magma fragmentation during the september 2016 Basaltic Eruption at Piton de la Fournaise (La Réunion Island, France). Geochem. Geophys. Geosyst. 21:30. doi: 10.1029/2019GC008611
Thomas, P. H., Simms, D. L., and Wraight, H. G. H. (1964). Fire spread in wooden cribs. Fire Res. Notes 537:40.
Thornber, C. R., Heliker, C., Sherrod, D. R., Kauahikaua, J. P., Miklius, A., Okubo, P. G., et al. (2003). Kilauea east rift zone magmatism: an episode 54 perspective. J. Petrol. 44, 1525–1559. doi: 10.1093/petrology/egg048
Tuffen, H., Owen, J., and Denton, J. (2010). Magma degassing during subglacial eruptions and its use to reconstruct palaeo-ice thicknesses. Earth Sci. Rev. 99, 1–18. doi: 10.1016/j.earscirev.2010.01.001
Uhl, C., and Kauffman, J. B. (1990). Deforestation, fire susceptibility, and potential tree responses to fire in the eastern amazon. Ecology 71, 437–449. doi: 10.2307/1940299
U.S. Geological Service and the National Park Service (1959). Eruptions of Kilauea: Kilauea Iki 1959 & Kapoho 1960. Limited Editon DVD Presented by the U.S. Dept. of the Interior and Hawaii Volcanoes National Park. Filmed by the U.S. Geological Service and the National Park Service: 27 Minutes, in Color, Subtitled. Volcano, HI: Hawaii Pacific Parks Association. Available online at: https://shop.hawaiipacificparks.org/products/dvd-kilauea-iki (accessed March 17, 2020).
Van Wagner, C. E. (1967). Calculations on Forest Fire Spread by Flame Radiation. Ottawa: Queen’s Printer and Controller of Stationery. ODC 431.6.
Vines, R. G. (1968). Heat transfer through bark, and the resistance of trees to fire. Austral. J. Bot. 16:499. doi: 10.1071/BT9680499
Vines, R. G. (1981). “Physics and chemistry of rural fires,” in Fire and the Australian Biota, eds R. H. Groves, I R. Noble, and A. M. Gill (Canberra: Australian Academy of Science), 129–151.
Viskanta, R. (1987). Radiation heat transfer in combustion systems. Prog. Energy Combust. Sci. 13, 97–160. doi: 10.1016/0360-1285(87)90008-6
Vlastélic, I., Menard, G., Gannoun, A., Piro, J.-L., Staudacher, T., Famin, V., et al. (2013). Magma degassing during the April 2007 collapse of piton de la fournaise: the record of semi-volatile trace elements (Li, B, Cu, In, Sn, Cd, Re, Tl, Bi). J. Volcanol. Geotherm. Res. 254, 94–107. doi: 10.1016/j.jvolgeores.2012.12.027
Wasilewski, P., Kletetschka, G., and Dickinson, T. (2000). Magnetic characterization of reduction in mount fuji basaltic tree-mold. Geophys. Res. Lett. 27, 1543–1546. doi: 10.1029/1999GL008462
Wilmoth, R. A., and Walker, G. P. L. (1993). P-type and S-type pahoehoe: a study of vesicle distribution patterns in hawaiian lava flows. J. Volcanol. Geotherm. Res. 55, 129–142. doi: 10.1016/0377-0273(93)90094-8
Witter, J. B., and Harris, A. J. L. (2007). Field measurements of heat loss from skylights and lava tube systems. J. Geophys. Res. 112:B01203. doi: 10.1029/2005JB003800
Witter, M., Furman, T., LaFemina, P., and Feineman, M. (2016). Understanding magmatic processes at telica volcano, nicaragua: crystal size distribution and textural analysis. Am. Mineral. 101, 1052–1060. doi: 10.2138/am-2016-5379
Wood Data Base (2019). Monkeypod. Available online at: https://www.wood-database.com/monkeypod/ (accessed May 22, 2019).
Young, P., and Wadge, G. (1990). FLOWFRONT: simulation of a lava flow. Comput. Geosci. 16, 1171–1191. doi: 10.1016/0098-3004(90)90055-x
Yuen, W. W., and Tien, C. L. (1977). A simple caclulation scheme for the luminous-flame emissivity. Fire Explos. Res. 16, 1481–1487. doi: 10.1016/s0082-0784(77)80430-x
Zhan, G., Erich, M. S., and Ohno, T. (1996). Release of trace elements from wood ash by nitric acid. Water Air Soil Pollut. 88, 297–311. doi: 10.1007/BF00294107
Keywords: tree mold, basaltic pāhoehoe-lava flow, Albizia tree, combustion, cooling rate, crystallization, Thermal model
Citation: Biren J, Harris A, Tuffen H, Chevrel MO, Gurioli L, Vlastélic I, Schiavi F, Benbakkar M, Fonquernie C and Calabro L (2020) Chemical, Textural and Thermal Analyses of Local Interactions Between Lava Flow and a Tree – Case Study From Pāhoa, Hawai’i. Front. Earth Sci. 8:233. doi: 10.3389/feart.2020.00233
Received: 25 March 2020; Accepted: 29 May 2020;
Published: 30 June 2020.
Edited by:
Antonio Costa, National Institute of Geophysics and Volcanology, ItalyReviewed by:
Sonia Calvari, National Institute of Geophysics and Volcanology, ItalyAlessandra Pensa, Roma Tre University, Italy
Copyright © 2020 Biren, Harris, Tuffen, Chevrel, Gurioli, Vlastélic, Schiavi, Benbakkar, Fonquernie and Calabro. This is an open-access article distributed under the terms of the Creative Commons Attribution License (CC BY). The use, distribution or reproduction in other forums is permitted, provided the original author(s) and the copyright owner(s) are credited and that the original publication in this journal is cited, in accordance with accepted academic practice. No use, distribution or reproduction is permitted which does not comply with these terms.
*Correspondence: Jonas Biren, jonas.biren@cnrs-orleans.fr