Volcaniclastic Dispersal During Submarine Lava Effusion: The 2012 Eruption of Havre Volcano, Kermadec Arc, New Zealand
 Arran P. Murch1,2*
  James D. L. White2
  Thibaut Barreyre3
  Rebecca J. Carey4
  Rhiannon Mundana4
  Fumihiko Ikegami4
- 1Department of Geology and Paleontology, National Museum of Nature and Science, Tsukuba, Japan
- 2Department of Geology, University of Otago, Dunedin, New Zealand
- 3Department of Earth Science, University of Bergen, Bergen, Norway
- 4School of Physical Sciences, Centre of Excellence in Ore Deposits, University of Tasmania, Hobart, TAS, Australia
Understanding clast dispersal from subaqueous volcanism is hampered by uncertainty in the source and extent of seafloor deposits. Extensive sampling in situ of seafloor deposits from the 2012 submarine eruption of Havre volcano provides an ideal opportunity to assess subaqueous dispersal. The 2012 Havre eruption produced 14 lavas/domes, a pumice raft, and three seafloor clastic deposits. At Havre the source of clastic deposits can be confidently identified, and deposit thickness, grain size, and distribution are also well-constrained. We examine a seafloor deposit termed subunit 3 (S3) generated in the 2012 Havre eruption to investigate dispersal of fine lapilli and ash, and the eruption conditions that generated this deposit. Subunit 3 is the third from bottom of four subunits that make up the Ash with Lapilli unit. Subunit 3 is composed of ash with highly elongate shapes, unique within the 2012 Havre deposits. It thickens and coarsens toward Lava G, also generated in the 2012 eruption, located on the southwest wall of Havre caldera. Lava G is the only lava produced during the 2012 Havre eruption that has a glassy carapace with elongated vesicles and a fibrous texture. We infer the source of unit S3 is Lava G, due to the spatial pattern of deposit thinning and fining away with distance from this lava, and the morphological and microtextural similarity of ash with the Lava G carapace rock. Grain size and transport distance of ash from S3 are used to test a simple 1D model addressing both clast dispersal by a buoyant thermal plume above an explosive eruption, and by penetrative convection during effusive lava emplacement. Comparison of calculated maximum dispersal distances with grain size and transport distance show that a jet forming eruption generating a turbulent plume is required to generate S3. We suggest that S3 was generated by hybrid explosive-effusive activity during the effusion of Lava G. Using model results we calculate maximum clast dispersal distances across a range of grain sizes for both dispersal mechanisms. The calculated maximum clast dispersal distance has wide implications globally for interpretation of ash deposits from subaqueous eruptions.
Introduction
The generation of ash is typically associated with energetic fragmentation during explosive volcanism (e.g., Walker, 1981; Zimanowski et al., 2003), though ash formation during effusive activity by non-explosive brecciation and comminution of a brittle crust has also long been noted (e.g., Fink, 1983; Manley, 1996). More-recent work has highlighted hybrid explosive-effusive activity producing synchronous lava effusion and weakly pyroclastic activity (Castro et al., 2012; Schipper et al., 2013), also referred to as ash venting (Cole et al., 2014; Black et al., 2016).
The physical properties of water in subaqueous settings complicates the interpretation of both formation by fragmentation and dispersal of ash, even for deposits dispersed by a plume (White et al., 2003, 2015; Cas and Giordano, 2014). Deep subaqueous eruptions (>500 m depth) are significantly modulated by the physical properties of water both indirectly (hydrostatic pressure, increased viscosity of water relative to air) and directly (rapid heat transfer) (Wohletz, 1983; Head and Wilson, 2003; White et al., 2003, 2015; Cas and Giordano, 2014). Rapid heat transfer on contact of magma with water may lead to both non-explosive and explosive fragmentation of magma through quenching (e.g., van Otterloo et al., 2015) and fuel coolant interaction independent of any involved magmatic volatiles (Wohletz, 1983). The higher viscosity and density of water compared to air means that convective plumes driven by heat from the underlying lava flow could conceivably disperse non-explosively formed ash over long distances (Barreyre et al., 2011).
Havre is a fully submerged volcano located along the Kermadec Arc, west of the Kermadec Ridge (Wright et al., 2006) that produced a complex large volume (~1.2 km3) silicic deep subaqueous eruption in 2012 (e.g., Carey et al., 2018; Ikegami et al., 2018; Manga et al., 2018a; Murch et al., 2019a). A range of observations from remotely operated and autonomous underwater vehicles and physical and chemical data sets have been collected from the volcano and eruption deposits (Wright et al., 2006; Carey et al., 2014, 2018; Jutzeler et al., 2014; Rotella et al., 2015; Mittal and Delbridge, 2019). Here we examine a deposit termed Subunit 3 (S3), part of a larger “Ash with Lapilli” unit at Havre (Murch et al., 2019a). Results from morphological and microtextural examination of the lava and S3 ash are used to infer eruption mechanisms. The subunit is closely associated with a lava emplaced during the 2012 eruption, and macroscopic deposit features are used to test a simple 1D model of a thermal plume and assess the eruption process by which S3 was probably generated. The results of this study have wide implications for the interpretation of other subaqueously generated ash deposits.
The 2012 Havre Eruption and Its Seafloor Products
Havre volcano forms a 1 km high edifice that is truncated by a summit caldera 3.5 by 4.5 km in diameter (Figure 1). The caldera floor is relatively flat at ~1,519 meters below sea level (mbsl) with the walls rising at least 500 m on all sides (Figure 1). A multibeam seafloor survey conducted with the autonomous underwater vehicle (AUV) Sentry and remotely operated vehicle (ROV) Jason in 2015 revealed that large-scale seafloor changes relative to a ship multibeam survey in 2002 (Wright et al., 2006) resulted from the emplacement of 14 lavas and domes from vents at depths between 900 and 1,220 mbsl (Carey et al., 2018; Ikegami et al., 2018). Three major seafloor clastic units were also identified; “Giant Pumice (GP) unit,” “Ash Lapilli and Block (ALB) unit,” and the “Ash with Lapilli (AL) unit,” (Carey et al., 2018). The ash deposit we examine here is a subunit of the AL unit.
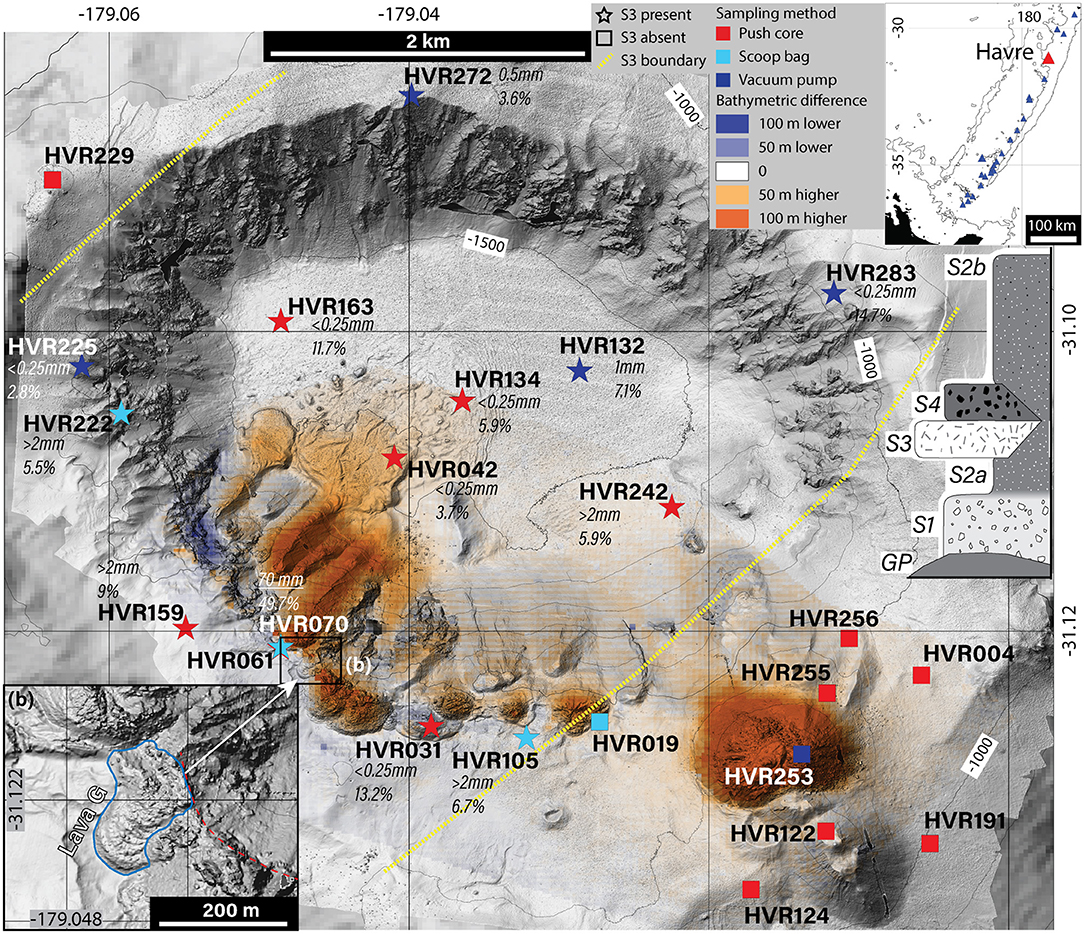
Figure 1. Bathymetry of Havre caldera. Clastic samples categorized by sampling method and presence (star) or absence (square) of significant amounts of particles unique to S3, a subunit of the Ash with Lapilli unit formed during the 2012 eruption. The modal grains size and the weight percentage that elongate tube-vesicle grains make up are shown for each sample that contains grains from S3. From the distribution of samples containing S3 we infer the depositional limits of S3 (yellow dashed lines). Lava G, inferred S3 source, is highlighted in the inset. Lava G has a lobe like shape with concentric surface ridges and is truncated on its north eastern edge by a scarp (red dashed line). Inset top right shows regional context of the Kermadec Arc north of New Zealand, with Havre volcano in red, other Kermadec volcanoes in blue.
The Ash With Lapilli Unit
The AL unit extends across the entire surveyed area and is composed dominantly of sub-mm sized ash with few lapilli. The four subunits that comprise the AL unit each have distinct granulometry and/or componentry signatures that allowed their individual distribution and contribution to the deposit to be identified from mixed samples of the whole AL deposit at each sampling site (Figure 1) (Murch et al., 2019a). S3 is the third deposit from the base of the AL unit, overlying Subunit 1 and 2a. Subunit 1 and 2a are inferred to have been produced by particle settling from a plume, and from extremely dilute density currents, respectively during the phase of eruption that generated the pumice raft observed on the 18-19th July 2012. We infer that following a time gap of days to weeks (?) S3 was deposited. ROV observed sharp contacts between S3 and locally overlying S4 indicates that deposition of S3 ceased abruptly. Subunit 4w was subsequently deposited in response to a caldera wall collapse that destroyed the source of Lava G and generated a debris avalanche, as well as exposing internal core of the hot lava to fragmentation driven by magma-water interaction (Murch et al., 2019b).
Methods
Samples of the fragmental deposits were taken from around the caldera (Figure 1) employing mechanical “arms,” push-cores, scoops and vacuum-like “slurp” samplers using ROV Jason. The samples used in this study and the methods by which they were collected are summarized in Supplement 1, with details of the sampling devices provided in Supplement 2.
Dried samples were hand sieved from −4 to 4 ϕ (16 to 0.063 mm) in ½ ϕ steps. The smaller than 0 ϕ (1 mm) fraction was analyzed in a Mastersizer 2000® laser analyzer, with the average of three runs per sample taken. Merging of the sieving and Mastersizer curves was undertaken on a sample by sample basis, with the point of merging chosen as to minimize offsets between sieve and Mastersizeer results, with the chosen overlap point generally around 0.5 ϕ (1.5 mm). We scaled rebinned Mastersizer data to the fraction of the sieved sample below the chosen point (i.e., if 20% of the sieved sample was less than 1 ϕ {the chosen merger point} then the Mastersizer data was rescaled so that its wt% reflected the fraction below the merger point in the whole sample).
The generally small particle size in S3, and also some sampling methods used (particularly the pushcores) meant particles larger than ~-4 ϕ were rarely collected. At site HVR061 and HVR070 maximum particle size in the seafloor deposit was therefore estimated independently using images taken by ROV Jason. A scale was provided by two lasers spaced 10 cm apart on ROV Jason.
Componentry was conducted at whole ϕ steps on material from −1 to 2 ϕ (2 to 125 μm). For larger particles, −1 to 0 ϕ (2 to 1 mm), categorization and identification were done with the naked eye and for 1 and 2 ϕ (500 to 250 μm) fractions, by binocular microscope. For each size fraction, either the entire sample, or at least 300 grains were analyzed. The componentry size range was chosen because in our samples particles sized −2 ϕ and larger were typically too few to provide statistically robust results. Grains smaller than 2 ϕ could not be reliably categorized using an optical microscope.
Particle morphology and microtextures were investigated using secondary electron (SE) and back-scattered electron (BSE) methods on a Zeiss Sigma VP® Field-Emission-Gun Scanning Electron Microscope at the University of Otago. For SE (morphological) imaging, grains were mounted on a SEM stub using carbon tape and then carbon coated. BSE imaging was undertaken on a carbon coated polished briquette. In both cases imaging was undertaken using a 15 keV accelerating voltage and a working distance of 8.5 mm. Samples of Lava G were visually described. In addition, a polished thin section of each sample was made and analyzed for crystal and vesicle textures using optical microscopy and SEM BSE imaging. Vesicle and microlite percentage areas were also estimated using both thin sections and SEM BSE imaging.
Results
Macroscopic Deposit Characteristics of Subunit 3
In all but two seafloor ash samples collected at Havre, grains from all layers sampled at a single site became mixed together, and no original sedimentary structures or deposit stratification were preserved in the samples. In Murch et al. (2019a) we presented a method of distinguishing which units were contained in mixed samples using characteristics that were revealed in one strata-preserving core to be distinct to each unit. This allowed us to map unit distributions around the Havre caldera. The grains that compose S3 are distinctive, with elongate rod-like morphologies that imply high degrees of shearing; the grains are termed elongate tube-vesicle clasts, and are characterized in more detail below. Using componentry, the distribution of these distinctive grains in mixed samples was tracked around the Havre caldera establishing the dispersal footprint of S3 (Figure 1).
The very distinctive clasts of S3 were also observed in situ on the seafloor in several locations (Figure 2). The thickness of S3 was determined using ROV-derived images of the AL unit on the seafloor at sample sites HVR061, HVR070, HVR132, HVR163, and HVR272, and by direct measurement of push core HVR159 (Figure 1, Table 1). Results show S3 is thickest near Lava G, on the SW caldera rim (Figure 1), and thins away from it. At HVR061 and HVR070, 300 m away from Lava G, S3 is at least 50 cm thick (Figure 2b) and visually identified in ROV images. In push core HVR159, 1010 m from Lava G, S3 forms a diffuse layer 2 cm thick within the upper part of S2a. In samples more distal than HVR159, the S3 deposit could not be identified as a distinct layer in seafloor images (HVR132, HVR163, and HVR272 which are 2,890, 2,520, and 4,240 m away from Lava G, respectively). S3 is instead indicated to be present by componentry results (Figure 3). Nine hundred and eighty meters from source vent, scattered Elongate tube-vesicle clasts are visible in images of the seafloor deposit (Figure 2c) and in componentry results (Figure 3). At these more distal sites S3 is not visible in ROV imagery, and is inferred to form a diffuse layer within the upper part of S2a (Murch et al., 2019a). The grain size distribution of S3 cannot be directly measured since all collected samples were mixed (even in HVR159 the S3 layer was not individually subsampled). Componentry results, however, reveal broad changes in modal and maximum grainsizes of S3, based on changes in the number and aggregate mass of Elongate tube-vesicle clasts in the −1 to 2 ϕ (2 to 125 μm in dimeter) grainsize range, over which componentry was conducted (Figure 3). In addition, at sites HVR061 and HVR070 visual observations of S3 were used to determine approximate maximum grain size.
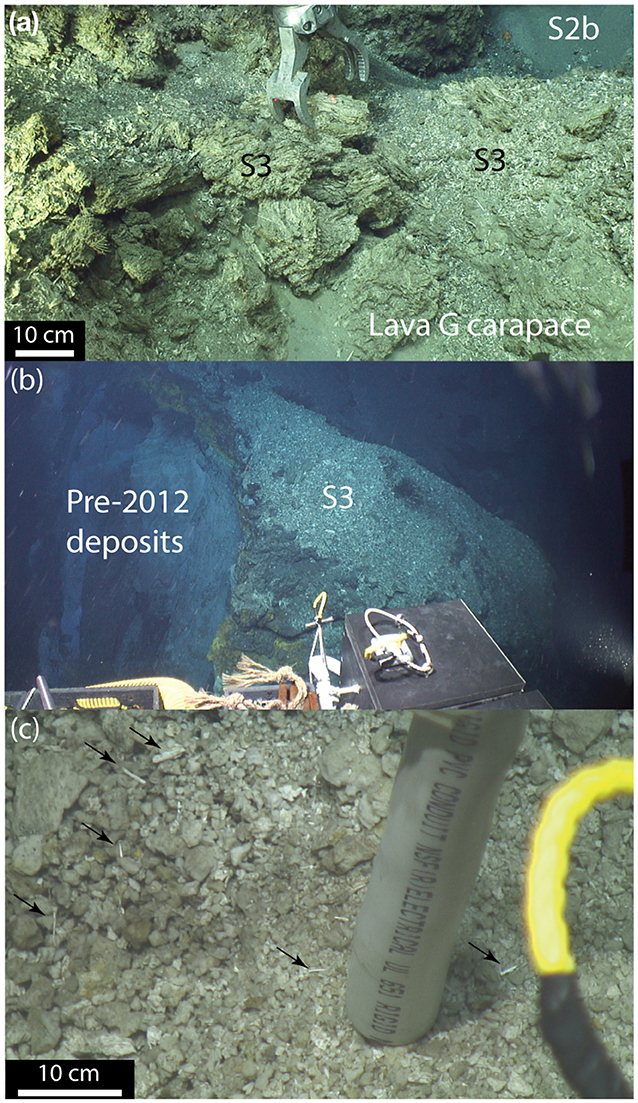
Figure 2. (a) Subunit 3 overlies the Lava G carapace and is overlain by Subunit 2b deposits. Decimeter scale blocks are the largest grains of S3, and sit on top of Lava G. (b) Subunit 3 at sampling site HVR070 has no overlying deposits and is underlain by pre-2012 deposits (c) Sample location HVR033, on top of Lava G where dome sample HVR031 was taken (Figure 1). Elongate tube-vesicle particles can be seen in this talus slope, demonstrating that S3 deposits overlie this pre-2012 lava dome, ~ 47 m higher than Lava G.
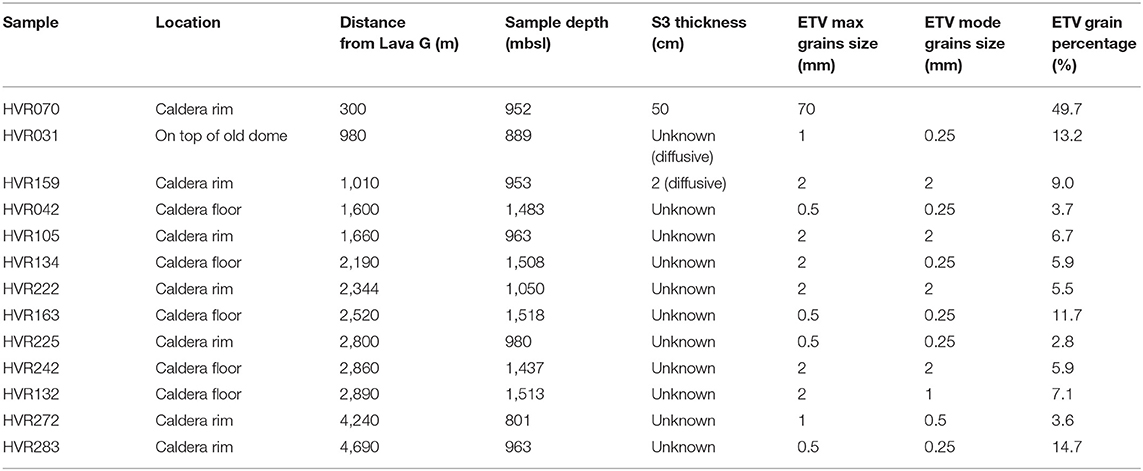
Table 1. Characteristics of samples containing Elongate tube-vesicle particles (S3) at Havre.
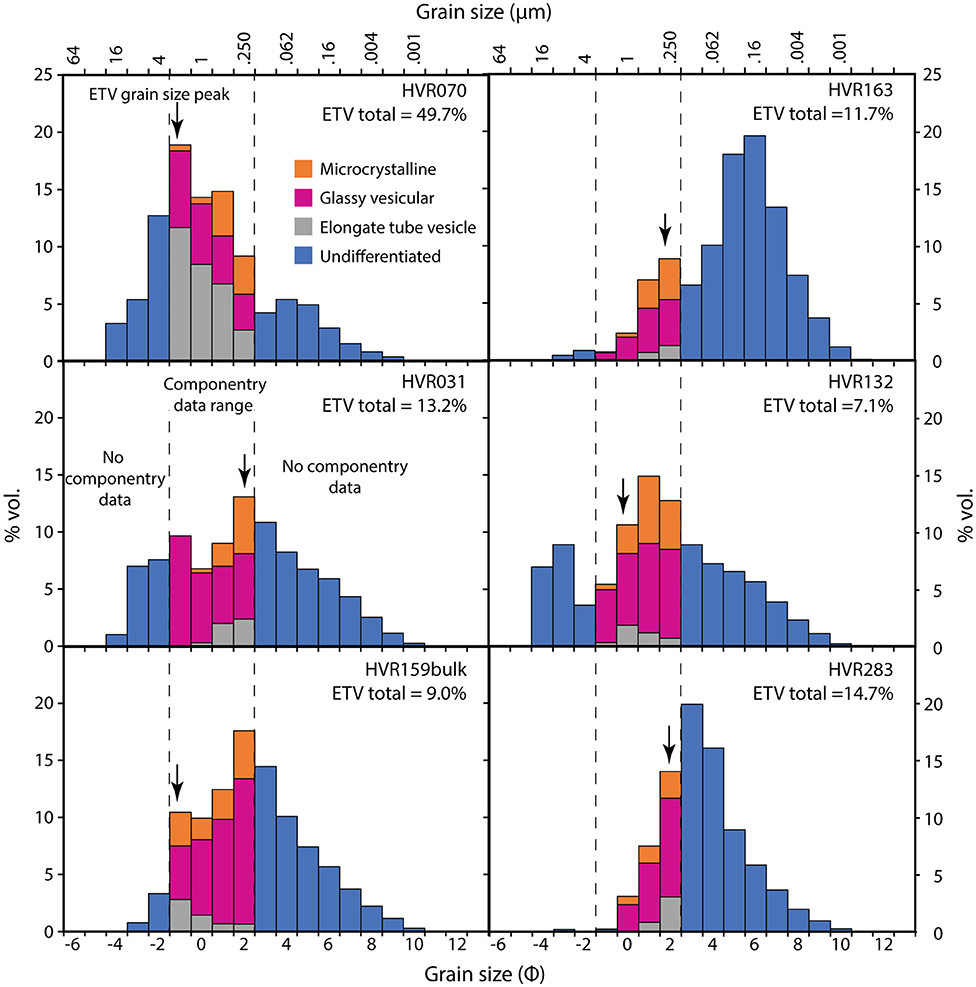
Figure 3. The granulometry of six samples containing Elongate tube-vesicle particles indicates the presence of S3. Componentry results for grainsize fraction fractions from −1 to 2Φ (2 to 250 μm) in 1Φ steps are shown; Elongate tube-vesicle (ETV) particles=gray, glassy vesicular particle=pink, and microcrystalline particles=orange. ETV total indicates the wt% percentage of Elongate tube-vesicle particles in each componentry range. ETV particles of median (arrows) and maximum size are indicated.
Grainsize measurements indicate that S3 broadly fines away from Lava G, and that the S3 Elongate tube-vesicle clasts also make up less of the overall sample at significant distances from Lava G (Figures 1, 3; Table 1). In sample HVR070, 300 m west of Lava G, S3 has a maximum grain size of ~70 mm, a modal grain size of ≥ 2 mm, and the S3 Elongate tube-vesicle clasts make up 49.7 wt% of the deposit in the size range for componentry (Figures 1, 3; Table 1). At HVR159, 1,010 m from Lava G, the maximum and modal grain size are ≥ 2 mm in diameter and S3 makes up 9.0 wt% of the deposit. Sample HVR105, acquired 2,945 m SE from Lava G on the caldera rim, has maximum and modal grain of unit S3 size are ≥ 2 mm, and S3 particles make up 6.7 wt% of the deposit. In samples HVR163 and HVR042 on the caldera floor 2,520 and 1,600 NNE of Lava G, respectively, the maximum grainsize is 500 μm, modal grainsize is ≤ 250 μm, and S3 makes up 11.7 and 3.7 wt% of the samples respectively. Samples HVR272 and HVR283, 4,240 and 4,690 m from Lava G, respectively, on the far caldera rim, have maximum grain size of 1 mm and 0.5 mm; modal grain sizes are 500 and ≤ 250 μm, and S3 makes up 3.6 and 14.7 wt% of the samples, respectively.
Grain Types
Subunit 3 is dominated by elongate tube-vesicle clasts, based on seafloor and sample-processing images (Murch et al., 2019a). Based on the abundance of such clasts in the imaged unit, we equate S3 deposits with elongate tube-vesicle clasts. Elongate tube-vesicle clasts show both simple and complex forms but are defined as having tube vesicles and elongated morphologies with alignment of both vesicle and clast elongation directions (Figures 4, 5). Simple grains display a single elongation axis and have hair like morphologies. In complex elongate tube-vesicle clasts, tube vesicle elongation direction changes over small distances, resulting in distinctive spiky grains (Figure 4).
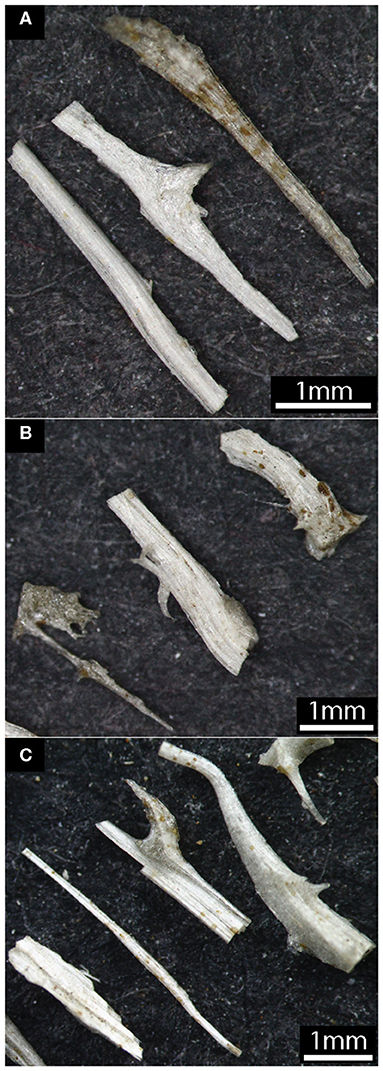
Figure 4. Optical microscope images of 0 and 1 ϕ Elongate tube-vesicle particles from HVR070. Clasts are relatively simple with highly elongate shapes and typically a single shearing fabric. Clasts with more-complex forms display abrupt changes in shearing fabric (A), delicate hair-like strands of glass (B), or twisted ribbon shapes (C). The particle shapes were produced by varied deformation prior to solidification.
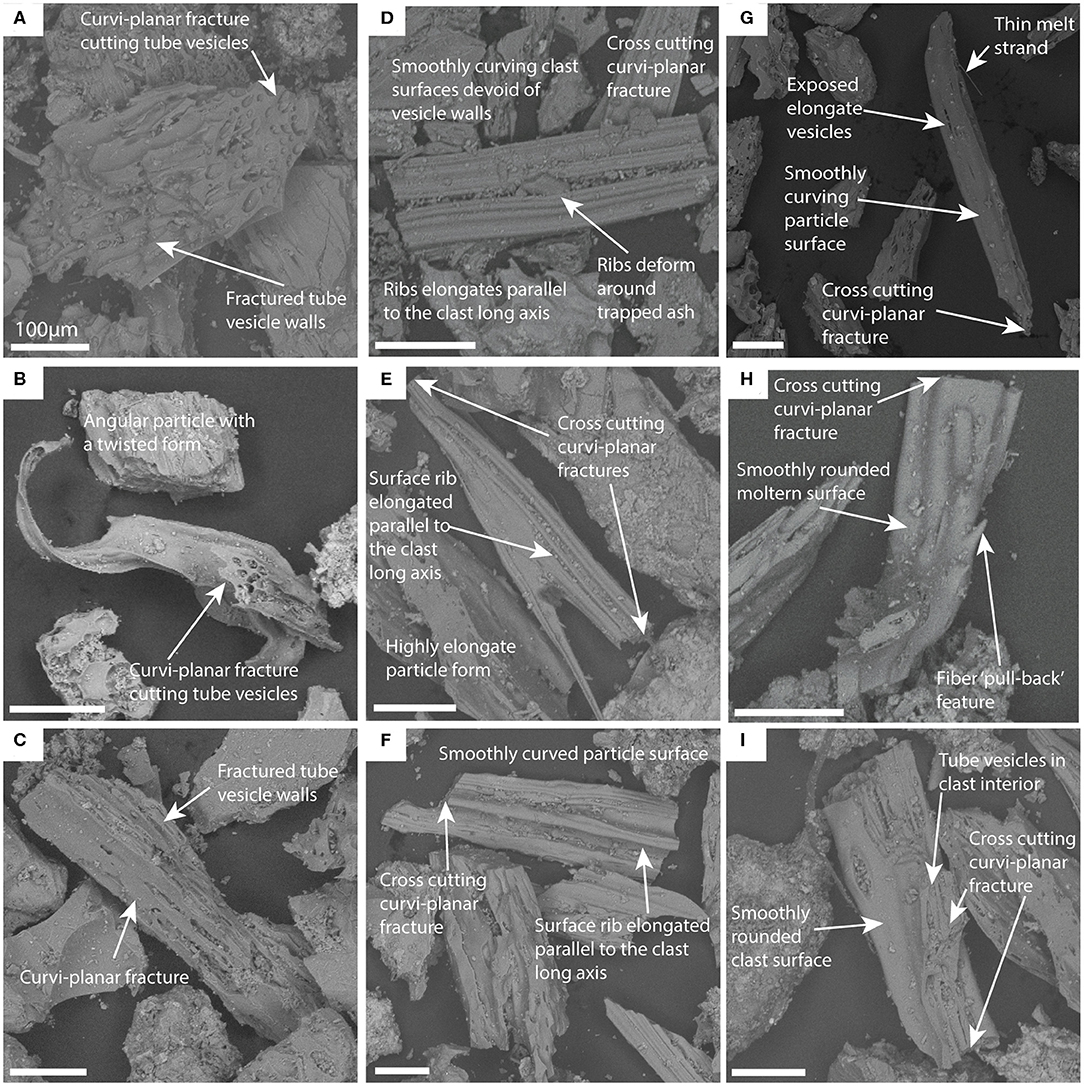
Figure 5. SEM SE images showing elongate tube-angular (A–C), -ribbed (D–F), and -fluidal particles (G–I) from a range of samples; HVR070—(A,D,I); HVR031—(B); HVR159—(C); HVR283—(F,H); HVR163—(E); HVR105—(G). Grains from each componentry class show features associated with that class. Elongate tube-angular particles show brittle fractured bubble walls crosscut by curvi-planar fracture surfaces (A–C). (C) Particle with a twisted shape. Elongate tube-ribbed particles are varied, with ribs that may not extend the full particle length (E) and variable spacing (F). Fluidal grains show a wide range of features including drips and pull-back features (G–I), and evidence of ductile necking (I).
We have defined three groups for elongate tube-vesicle clasts, based on particle-surface morphology (Figure 5). Elongate tube-angular particles show cross-cutting curvi-planar surfaces defined by brittle-fractured bubble walls (Figures 5A–C). Elongate tube-ribbed particle surfaces are defined by surface ribs parallel to the vesicle- and clast-elongation direction and have surfaces that are smoothly undulating and typically unmarked by vesicles (Figures 5D–F). Elongate tube-fluidal particles have surfaces unmarked by vesicles, with flowing smooth surfaces that form peaks or droplet like features and show evidence of ductile necking (Figures 5G–I). The peaks or droplets may be “pull back” features where a molten connection to another fiber was broken and reformed by surface tension. In the case of ribbed and fluid grains, thin unbroken delicate fibers are also attached to some particles (Figure 4B). Curvi-planar brittle fracture surfaces commonly cut sharply across the elongation direction of both elongate tube-ribbed and -fluidal clasts (Figures 5D–I).
Microtextural Descriptions
Phenocrysts in elongate tube-vesicle clasts are rare, and generally comprise clusters of euhedral 70–120 μm plagioclase and pyroxene. Clast groundmasses are >95% glass with ~5% microliters (Figure 6) of acicular pyroxene and swallowtail/hopper plagioclase. Microlites typically are aligned parallel to tube vesicles and clast margins.
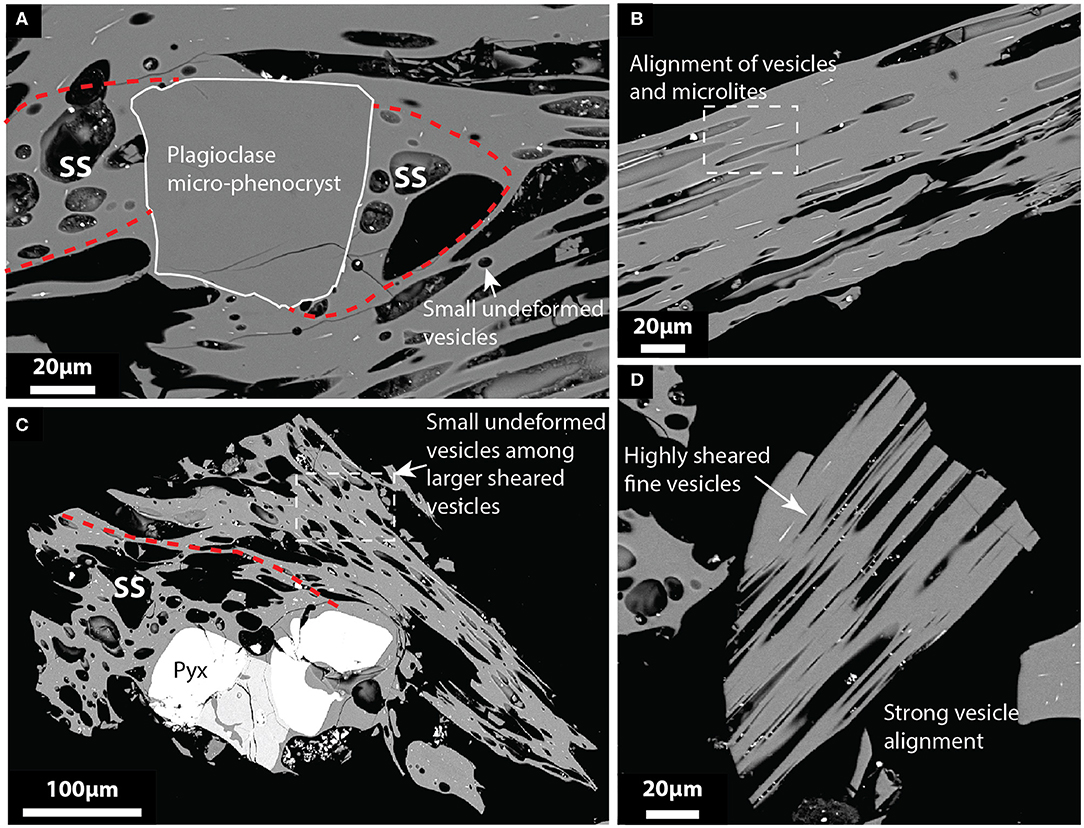
Figure 6. Microtextural characteristics of Elongate tube-vesicle grains. SEM images taken approximately along the vesicle-elongation axis. (A) Asymmetrical strain shadow defined by undeformed vesicles around a euhedral plagioclase micro-phenocryst. Outside the area of the strain shadow small undeformed vesicles are also scattered within areas of highly sheared vesicles. (B) Highly elongate needle-like vesicles are aligned with microlites within a particle that appears to have a smooth unbroken surface. (C) Half a strain shadow can be observed around a micro-phenocryst cluster. Small, undeformed vesicles are present in the sheared domain. (D) shows strong vesicle deformation over a range of vesicle sizes.
Vesicles in elongate tube-vesicle particles have circular through oblong to needle like morphologies in cross section, with strong variation depending on the plane of intersection. Vesicle cross-sectional apparent length varies from ~10 μm up to ~4 mm where ~1 mm diameter pipes traverse the entire length the particles. Vesicles with cross-sectional apparent lengths more than ~80 μm show complex sub-angular to sub-elliptical shapes, with features indicating bubble-wall retraction following coalescence (Figures 6A,C). Vesicles with apparent long axes of less than 80 μm typically have simple oblong shapes (Figures 6B,D). In most particles vesicles <10 μm in dimeter have circular cross-sections and appear undeformed (Figures 6A,C), though in a small fraction of clasts vesicles in this apparent length/size range are highly elongate (Figure 6D). Asymmetrical strain shadows are observed around phenocrysts, defined by areas in which vesicles show little to no evidence of deformation and randomly oriented microlites (Figures 6A,C).
Characteristics of the Pumiceous Carapace and Core of Lava G
Lava G lies on the southwest rim of the Havre caldera (Figure 1) at 935 to 980 mbsl. The lava is ~200 m long and ~160 m wide with a volume of ~4 x 10⁵ m3 (Carey et al., 2018; Ikegami et al., 2018). Lava G is characterized by large pressure ridges and is sharply truncated at its northern edge along a large scallop-shaped headscarp (Figure 7) interpreted to be the result of a mass wasting event following emplacement of Lava G (Carey et al., 2018). The 30 m high northern scarp permitted ROV observations and sampling from 937 (HVR287), 941 (HVR288), and 949 (HVR289) mbsl, at distances of ~6, 11, and 19 m, respectively below the surface of the lava (Figure 7). Two samples were also taken of the pumiceous carapace from the surface of Lava G, at depths of 936 m (HVR085), and 960 m (HVR286) (Figure 7).
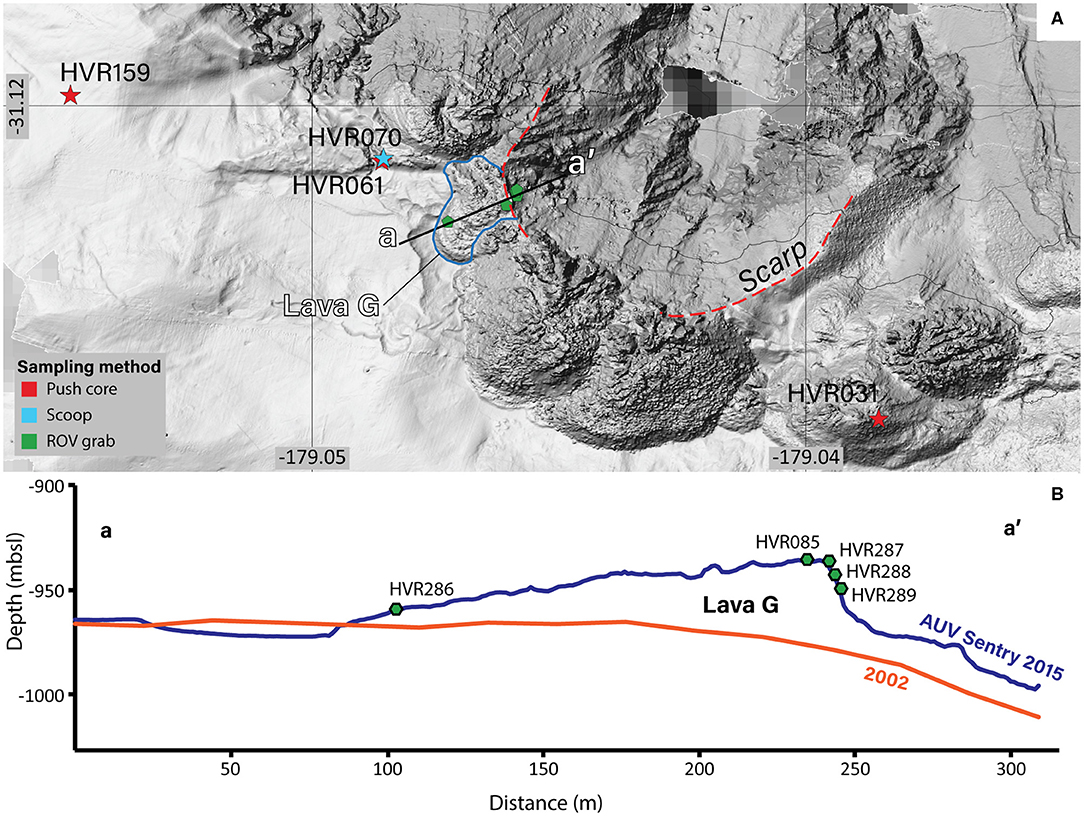
Figure 7. (A) Detailed map of Lava G with locations of clastic samples (stars) and grab samples of Lava G (pentagons). Scarp cutting the northern edge of Lava G is seen as a sharp break in topography at the head of a gully in the caldera wall (red dashed line). In (B) pre-eruption (2002) and post-eruption (2015) AUV Sentry profiles through Lava G, locations indicated in (A). Sites of Lava G samples indicated on the AUV Sentry profile.
Phenocryst types and abundances are similar in all Lava G samples with ~15% euhedral plagioclase and alkali feldspar, irregular magnetite, anhedral quartz, and minor amounts of tabular pyroxene. Phenocrysts are 0.25–1 mm and are commonly in clusters (Figure 8).
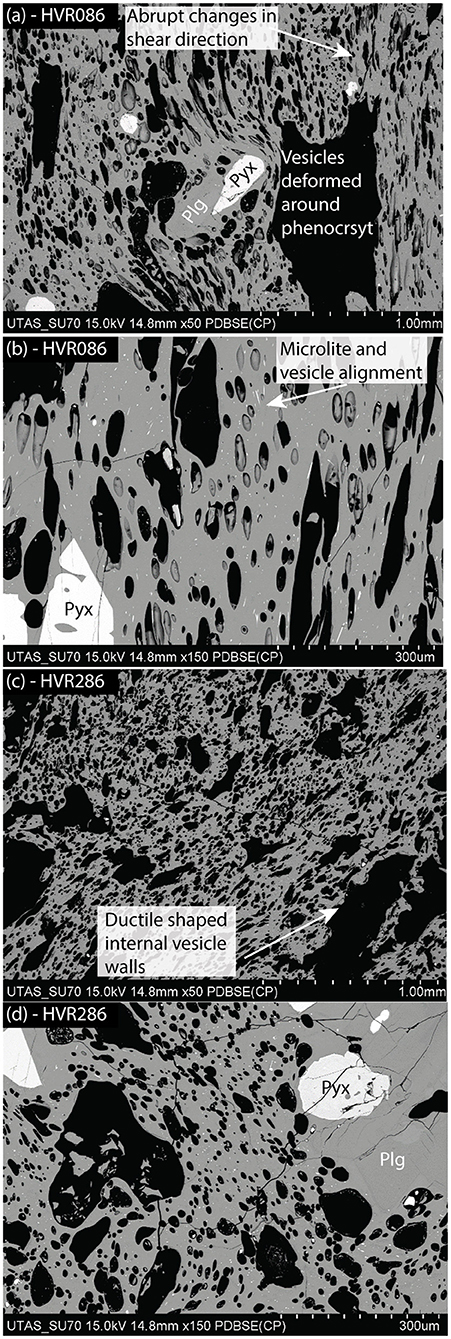
Figure 8. Images (SEM BSE) showing microtextures of the Lava G pumiceous carapace from samples HVR086 (a,b) and HVR286 (c,d) at different magnifications. (a) Shear direction/amount varies with vesicle deformation across the picture; at center a micro-phenocryst cluster disrupts the shear orientation. (c) Internal walls of fluidal vesicles rarely present isolated hairs. The smallest vesicles always appear undeformed and spherical to subspherical.
The pumiceous carapace of Lava G has a vesicularity of 60–65% and a glassy groundmass containing ~4% microlites by area. Vesicles are highly elongate to cylindrical, with long axes greater than ~100 μm typically showing more-complex forms resulting from bubble coalescence and shearing. Microlites are dominantly acicular plagioclase and minor clinopyroxene, the former showing swallowtail and hopper forms (Figure 8). Texturally, the carapace varies over small length scales of about 100 μm in terms of apparent shear direction and vesicularity. A breccia of unknown thickness composed of block to ash sized clasts is scattered overlying the solid pumiceous carapace of Lava G with particles showing the same microtextural characteristics.
Vesicularity decreases and groundmass microlite abundance increases significantly with increasing depth in Lava G. In sample HVR287, 6 m below surface of Lava G, vesicularity of the lava is ~40% by area and groundmass crystal content is 40%. In HVR288, 11 below surface of Lava G, vesicularity of the lava is 35% and groundmass crystal content is 49%. In HVR289, 19 below surface of Lava G, vesicularity is 30% and groundmass crystal content is 70%. All vesicles show irregular to circular morphologies. Microlites in the three samples from the interior of the lava are dominantly acicular swallowtail and hopper-form plagioclase, with minor acicular clinopyroxene. Vesicle- and groundmass-hosted cristobalite occur in both HVR288 and HVR289.
Particle Dispersal Modeling
Particle dispersal distance and trajectories were calculated using the simple conceptual model defined in Barreyre et al. (2011) (Figure 9). From the source, a particle is initially entrained and dispersed vertically in the plume. Upward dispersal continues while particle settling velocity (Vs) is less than vertical velocity of the plume (Vp). Once Vs ≥ Vp a particle begins to settle out of the plume and falls to the ocean floor. From the plume's vertical velocity profile, a particle's rise time (tr) and maximum rise height (hr) (height at which Vs = Vp) can be calculated. The time for a particle to settle to the seafloor (ts) is then calculated as . Addition of tr and ts then gives an overall dispersal time (td) from source to deposition. Lateral dispersal of particles is driven by a horizontal current of velocity Vc that laterally deflects both ascending particles in a plume and during settling (Figure 9). The maximum particle dispersal distance (d) can then be calculated from Vc × td.
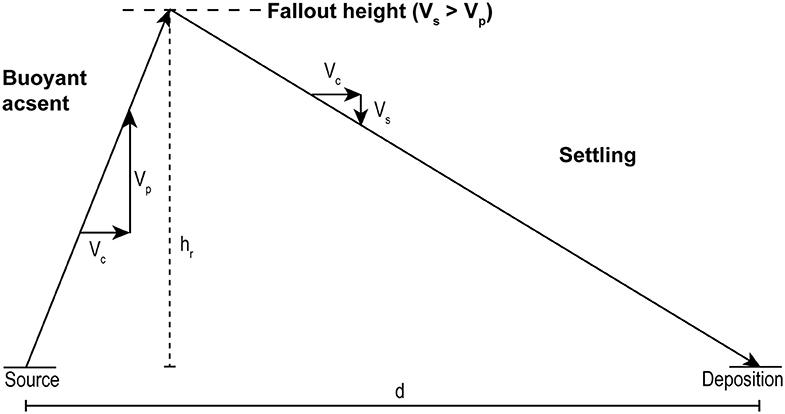
Figure 9. A schematic view of the simplified dispersal process that we considered here and the variables that are calculated.
Lava G was erupted at a depth of ~950 mbsl, and the sea surface is a hard ceiling to vertical ascent of particles. Estimates and measurements of seafloor current velocity Vc from various sources for the Kermadec region are used here. Values for Vp, Vs, tr, hr, and ts are calculated using a universal equation particle settling rates and two convective plume models for differing possible eruptive styles for S3 outlined below. The calculated variables are defined both in the text and in Supplement Table 3.
Lateral Current Velocity
A constant lateral current velocity of 0.2 m s−1 is used over the entire water column as a simplification; details of current-depth dependency at Havre are not known. The velocity of 0.2 m s−1 used is consistent with measurements of maximum current speeds in the Kermadec region at 1,000 mbsl of 0.2 m s−1 recorded by Argos floats (Sutton et al., 2012). In addition, bedforms on seamounts in the southern Kermadec region indicate maximum short-term seafloor current speeds of 0.1–0.5 m s−1 (Wright, 2001).
Particle Settling Rates
The settling rate (Vs) of Elongate tube-vesicle clasts was calculated using a universal equation (Equation 4; Ferguson and Church, 2004).
Where the specific gravity of a particle is R, g is the acceleration due to gravity, D is particle diameter, v is the kinematic viscosity of the fluid, and C1 and C2 are particle shape factors (Ferguson and Church, 2004).
When calculating R a particle vesicularity of 30% is used, with all vesicles in the small, highly permeable grains assumed to be water-filled (Allen et al., 2008; Fauria et al., 2017), giving a waterlogged particle density of 2,126 kg m−3. Values of C1 and C2 were estimated by Ferguson and Church (2004) for a range of particle shapes: smooth spheres as 18 and 0.4, extremely angular as 24 and 1.2, and intermediate shapes as 18 and 1.0. However, to reflect the extreme variability and eccentricity of Elongate tube-vesicle particles values of 30.7 and 3.7 for C1 and C2 are used, equivalent to values determined experimentally by Barreyre et al. (2011), for natural basaltic highly elongate ash grains. Calculated terminal particle settling rates over a range of grain sizes are shown in Table 2.
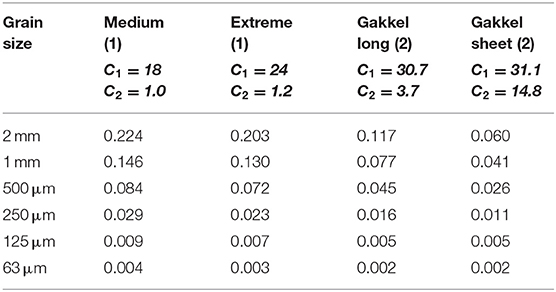
Table 2. Particle settling rates in m s−1 calculated using Equation (4) from Ferguson and Church (2004) across a range of grain sizes for a range of particle morphologies with shape factors (C1 and C2) defined by Ferguson and Church (2004) (1) and Barreyre et al. (2011) (2).
Thermal Plume Models
Models are used to estimate vertical velocity profiles of the thermal plume which are then compared with Vs to allow calculation of tr and hr for a range of grain sizes.
Given uncertainty about mechanisms of the eruption that generated S3, two different models are tested against the inferred convective behavior above (1) a weak jetting eruption (Morton et al., 1956; Woods, 2010; Hunt and Van Den Bremer, 2011) vs. (2) dispersal of lava-flow-generated ash in a plume driven by heating of ambient water (Estoque, 1968; Stull, 1973; Kaminski et al., 2011). During a jet-forming eruption (1) a flux of hot material (mixture of gas and pyroclasts) is injected into a density stratified fluid. The initial impetus of the erupted mixture imparts momentum to the overlying fluid. Heating of the same fluid reduces its density leading to buoyant ascent as a turbulent convective plume (Morton et al., 1956; Speer and Rona, 1989). In contrast, above a lava flow free or natural convection occurs (2) entirely in response to fluid density reductions driven by heating of an overlying fluid; this results in more-muted buoyant ascent (Estoque, 1968; Stull, 1973; Kaminski et al., 2011).
Turbulent plume model – dispersal from hybrid pyroclastic-effusive activity
A turbulent plume from explosive volcanism can be broadly split into two regimes; a basal gas-thrust section, driven by momentum of expanding volatiles, and an upper buoyant section, driven by the density contrast between the ambient fluid and fluid entrained and heated (e.g., Bonadonna and Costa, 2015). High ambient pressures on the seafloor, and rapid steam condensation driven by water's high heat capacity, ensure that the height of any subaqueous gas-thrust jet will be severely restricted (Head and Wilson, 2003; White et al., 2003, 2015; Deardorff et al., 2011; Cas and Giordano, 2014). This allows a simplification in the model whereby the likely few meters of particle transport in the gas-thrust region is ignored (Barreyre et al., 2011; Deardorff et al., 2011).
In the convective section of a turbulent plume, ascent occurs as a result of the lower density of the plume relative to the ambient fluid (e.g., Morton et al., 1956; Speer and Rona, 1989; Woods, 2010; Hunt and Van Den Bremer, 2011). Entrainment of ambient fluid during plume ascent results in widening of the plume, cooling, and an increase in its density. The loss of initial momentum due to drag and then increasing plume density leads to a decrease in plume vertical velocity with height (Figure 10A). In a density-stratified medium a buoyant plume will eventually reach a height of neutral buoyancy at which point it will lose momentum and spread laterally (e.g., Morton et al., 1956; Speer and Rona, 1989; Woods, 2010; Hunt and Van Den Bremer, 2011).
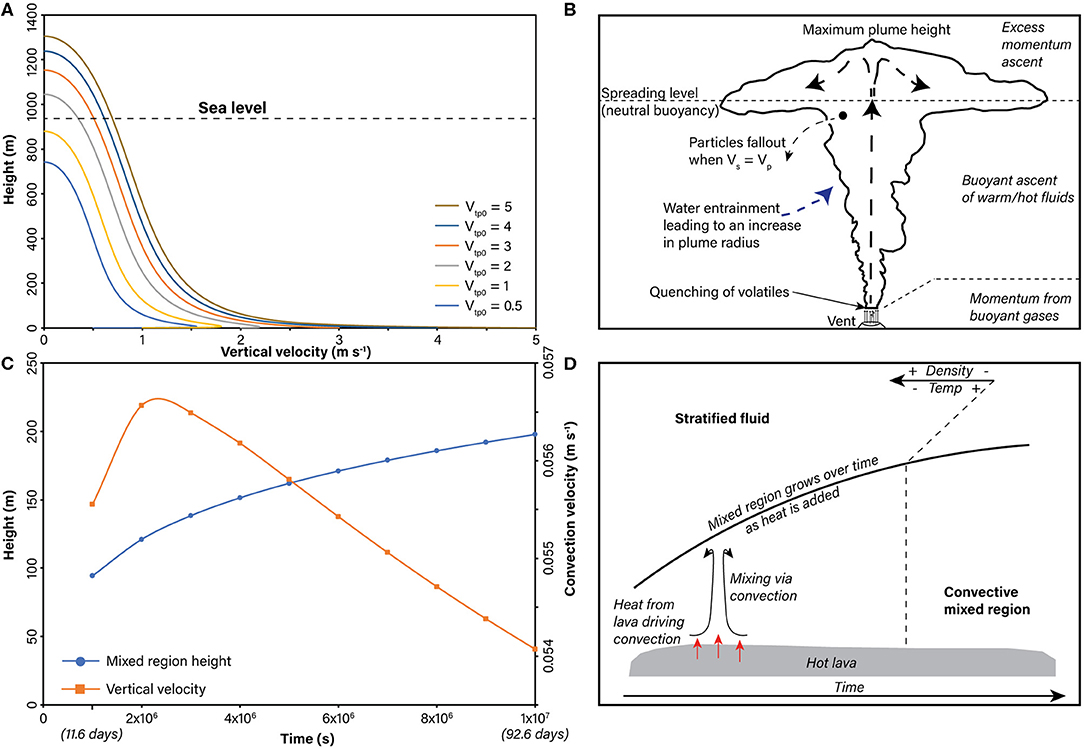
Figure 10. Vertical velocity results for both a turbulent plume and penetrative convection, and schematic diagrams of the physical processes driving convection and dispersal. (A) Vertical velocity profiles through turbulent plumes for a range of Vtp0. Initial values for source area, temperature, and salinity are lain out in the text. The height of the ocean surface above Lava G is shown. The processes occurring in a turbulent plume over its height are illustrated in (B) using the profile of the plume from a source of Vtp0 = 5 m s−1. The height and average vertical velocity of a mixed region generated by penetrative convection over time are shown in (C). The source conditions are included in Table 3. (D) Diagram outlining the process by which convection above a lava flow leads to the generation and growth of a zone of convective mixing in an originally stratified fluid.
To calculate the velocity profile through the convective section of a plume we use an existing model defined by Speer and Rona (1989) for a plume driven by the release of hydrothermal fluids. Speer and Rona (1989) present a 1-dimensional model based on the physics of turbulent plumes in stratified media defined by Morton et al. (1956), and has previously been applied by Barreyre et al. (2011) to calculate particle dispersal during deep sea eruptions at Axial Seamount, and on Gakkel ridge. The model described by Speer and Rona (1989) is also appropriate for the case examined here of a plume initiated by an eruptive jet. In both cases the jet is driven by sustained injection of an initially hot fluid mixture into a density stratified environment. Heating of ambient fluid produces a low-density particle-carrying turbulent plume that rises and cools until it becomes neutrally buoyant (Figure 10B).
Variables in the Speer and Rona (1989) model are plume vertical velocity (Vtp), potential temperature (dT), area (A), and salinity (S), all considered as average horizontal integrations across the plume. Following (Speer and Rona, 1989) the conservation equations for mass, momentum, heat, and salinity are:
E is an entrainment coefficient set as 0.255, g is the acceleration due to gravity, ρp is the plume density, and subscript z is the vertical derivative (height). The plume rises through a stratified fluid, with background potential temperature () and salinity () that results in a density stratification characterized by buoyancy frequency (N2). No local density profile was collected. Instead the density profile for the Pacific Ocean from Barreyre et al. (2011) is used.
Initial salinity of the plume was equal to the background. An initial plume temperature of 300°C was estimated based on the transfer of heat energy from a 850°C rhyolite magma to water with a volume ratio of 1:2. Initial plume diameter was 3 m following the observations by Schipper et al. (2013) that the source areas were a few meters in diameter during ash venting in the 2011-12 Cordon Caulle eruption suggesting an area of ~7 m2. Initial plume velocity (Vtp0) was varied from 0.5, 1, 2, 3, 4, and 5 m s−1 due to the uncertainty of eruptive flux during such activity and based on maximum initial plume velocities observed at NW Rota 1 Seamount (Deardorff et al., 2011). Dispersal from plumes with source areas of 2, 5, and 9 m2 with a consistent were also considered to assess the impact of variable source area. A vertical ascent limit of 950 m was used to match the water column depth overlying Lava G. Particle load is assumed to be sufficiently low as to not have had significant impacts on plume mechanics.
The source heat flux (Qp) in watts based on initial plume conditions can be calculated as
Where Cpsw is heat capacity of the seawater set as 4,200 kJ/kg °C, and ρ0 is the initial density of the plume set as 1,000 kg m−3. Using initial source parameters described above gives a range of Qp from 0.5 to 44 GW roughly equivalent to the heat flux range estimated for hydrothermal megaplumes associated with lava eruptions (Cann and Strens, 1989; Palmer and Ernst, 1998).
Free convection above lava flow
Free convection describes the motion of fluid resulting from differences in density typically produced by a change in temperature. Here we consider a form of free convection called penetrative convection (Estoque, 1968; Stull, 1973; Kaminski et al., 2011). Penetrative convection describes the growth of a well-mixed layer above a hot horizontal plate in a density stratified fluid. Upwelling thermals released from a heated boundary layer mix a previously stratified fluid through convection over time, eroding the pre-existing density stratification (Figures 10C,D). The convective region grows in height if the heat source is maintained. A natural example of this is the growth of an atmospheric boundary layer during the day as the sun heats the ground. The rate of growth of the mixed layer and the velocity of the thermals are strongly dependent on the source heat flux (Qf) and the density stratification of the fluid.
Here we consider in 3D a cooling lava dome as an idealized hot smooth flat plate heating a stratified infinite ambient fluid (ocean). Local variations in heat flux and changes in size and geometry of a growing lava dome or flow (Calkins et al., 2008; Bernstein et al., 2013) are ignored to simplify calculations. The dome simply appears on the seafloor at T0, which provides the maximum initial heating surface. It is likely that dome-like shapes of many, especially silicic, lava flows/domes would result in some flow focusing that increases thermal velocity and convective height; however this is not captured in our first-order calculations.
The heat flux driving convection above a lava flow is estimated directly by modeling heat loss over time from a 50 m radius dome of lava with initial temperature (Tm) of 850°C in ambient water at 5°C, using a python script from Clarke et al. (2019), based on the equations of Buttsworth (1997) and Schiesser (1991). A thermal diffusivity (m2/s) of 3.8 x 10⁻⁷ is used, calculated from (Bagdassarov and Dingwell, 1994) where k is thermal conductivity (1.5 kcal/m h °C), ρ is density (2,600 kg m−3), and Cpm is heat capacity for a rhyolite magma (1,500 J K−1) (Lesher and Spera, 2015). A heat transfer coefficient (hc) of 2,000 (Dürig et al., in press) is used, along with a thermal conductivity of 1.5 (Lesher and Spera, 2015), and a black body emissivity (W/m2/K4) of 5.669 x 10⁻⁸ (Thomas and Sparks, 1992). Temperature (Tt) is then calculated for points in 0.5 m steps from the core of the dome to its edge every 1,000,000 s (~11.6 days). The model is stopped at 8,000,000 s, ~90 days with heat flux calculated for each time step using
Where ΔT is the difference in temperature over each time step (Tt−1 and Tt), m is the mass of magma from which the heat was lost (calculated using a magma density of 2,350 kg m−3), t is the time (s) over which cooling occurred, and A is the dome surface area over which heat energy was lost. Heat flux estimates over time shown in Table 3 match closely with those made by (Hoskuldsson and Sparks, 1997).
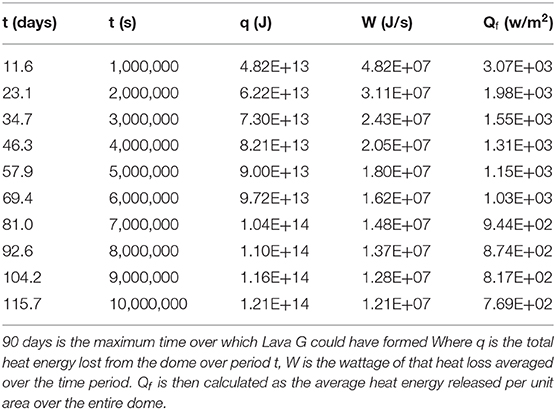
Table 3. Heat flux (Qf) values for cooling of a 50 m radius silicic lava dome over ~116 days.
Estimated Q can then be used to calculate the average vertical velocity of thermals (Vpc) generated by the hot lava and the thickness of the turbulent layer in penetrative convection (ht) using equations 7.21
And 7.6
from Cushman-Roisin (2019) where α is the thermal expansion coefficient of water, g is acceleration due to gravity, N2 is the density stratification gradient or frequency. ρsw is the density of seawater, and Cpsw is the heat capacity of water.
Dispersal Modeling Results
Results of modeling a turbulent buoyant plume, vs. penetrative convection above a lava flow yield significant differences in the vertical plume velocity and maximum plume height. In the jet-initiated turbulent plume model maximum heights range from ~740 to 1,300 m (Figure 10A), for Vtp0 of between 0.5 to 5 m s−1. When applied to the formation of S3 these are limited to 950 m by the ocean surface.
Vertical velocity of a turbulent plume initiated by a jet decreases rapidly over the first 100 m to ~60 to 40% of Vtp0 as drag erodes the plume's initial momentum (Figure 10C). Following the initial rapid drop in velocity, there is a slower decrease over most of the plume height that results from the increasing density of the plume due to cooling and water entrainment, and the decrease in density of the ambient stratified fluid. The rapid decay of vertical velocity to 0 in the final 100 m results from reaching the point of neutral buoyancy, after which the plume overshoots with ascent driven only by momentum (Figure 10A).
In contrast to the jet-initiated plume, the mixed region formed by penetrative convection grows from an initial height of 94 m after ~11 days to 197 m after 9 months (Figure 10C). Only the average vertical velocity in penetrative convection was calculated, which gives a consistent rate of between 0.054 m s−1 at 9 months to 0.057 m s−1 at 2 months (Figure 10C). We take the average vertical velocity as a constant across the entire convective region. Because of this, the maximum grain size that can be entrained by penetrative convection is underestimated; however, maximum dispersal distances of grains whose settling velocities are slightly lower than the average ascent rate are overestimated.
The calculated dispersal distances (Figure 11) clearly demonstrate that once a jet initiates a plume with Vtp0 > 1 m s−1 the resulting turbulent plume is capable of generating the observed seafloor deposit S3. In contrast, simple penetrative convection alone can neither disperse clasts far enough, nor entrain clasts large enough, to have produced the S3 deposit. The maximum grain size transportable by penetrative convection is ~600 μm, whereas a jet-initiated plume can entrain particles up to 1 m in size (although clasts larger than 50 cm rapidly fall out of the plume). For grains of the same diameter, a jet-initiated plume results in significantly greater maximum dispersal distances, for example a 250 μm grains travels 8 km further in the modeled current (Figure 11).
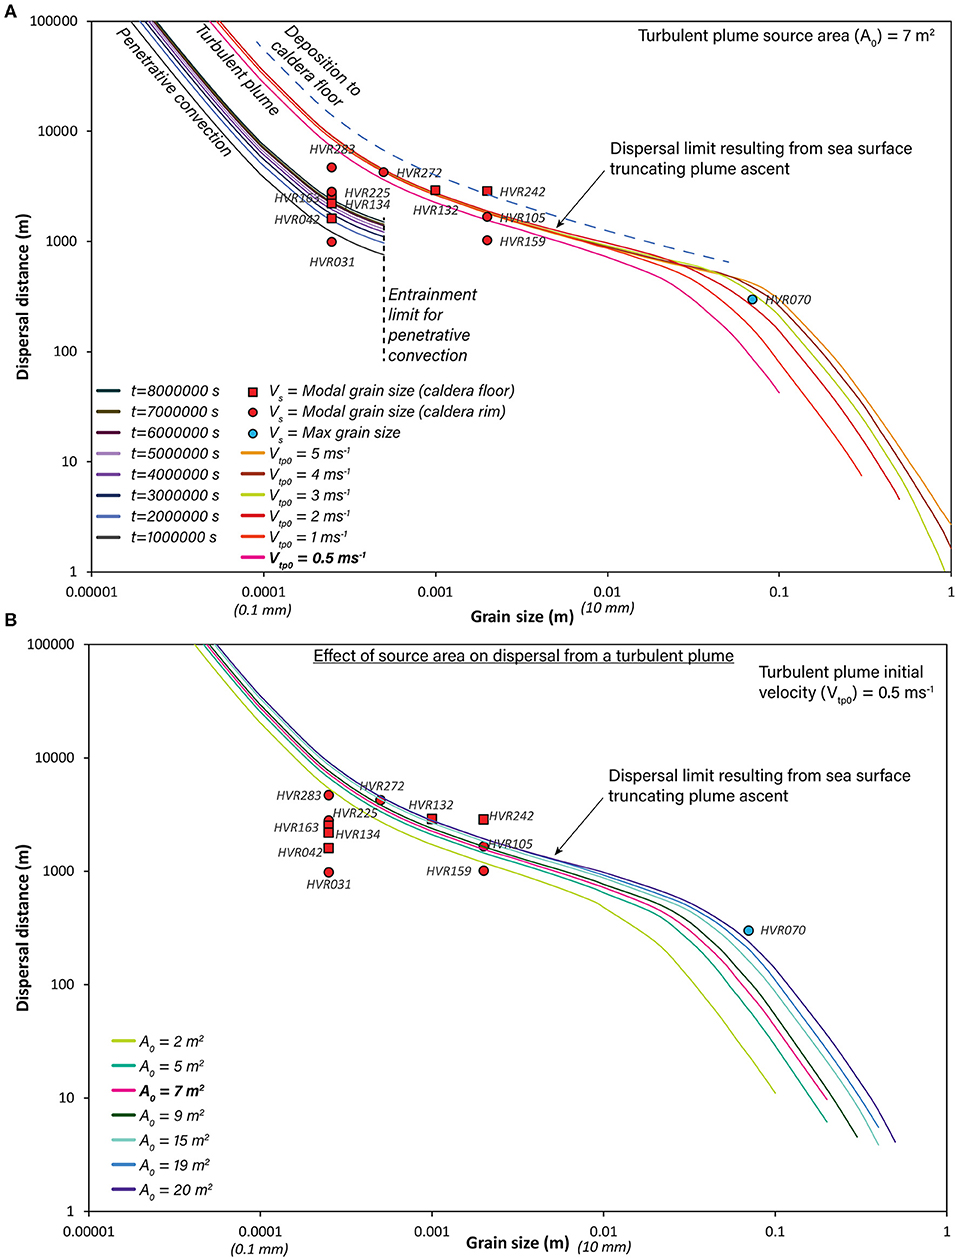
Figure 11. (A) Graph of grain size plotted vs. maximum dispersal distance calculated for both a turbulent plume and penetrative convection using the methods outlined in the text and in Figure 9. The distances from Lava G and the modal grain sizes of ETV grains from samples that contain S3 are also plotted. The symbols indicate those that were collected from the caldera rim (circles) and those that were collected from the caldera floor (squares). The majority of samples plot below the line for dispersal from a turbulent plume when Vtp0 > 1 m s−1. The only samples that plot above the line are two deposited on the caldera floor. The dispersal model presented assumes deposition on a flat plane the same depth as the source, however at Havre there is a 500 m difference in height between the caldera rim and caldera floor. The dashed line therefore shows the position of the Vtp0 > 1 m s−1 max dispersal limit for the same model calculated for deposition on a surface 500 m lower than the eruption source. (B) Comparison of particle dispersal distances from plumes with source areas of 2, 5, 7, and 9 m2 and a Vtp0 of 0.5 m s−1. In both (A,B) the line bold in the key is the same. Differences in dispersal distance resulting from variable source area are generally small. However, once the plume height is restricted by the sea surface there is little difference in the dispersal distance for grain sizes smaller than ~0.05 m unless source area is significantly smaller.
Changes to the source area (A0) driving a turbulent plume can have a large impact on the maximum plume height and velocity profile (Figure 11B). However, in the subaqueous environment plume height can be limited by the sea surface. This limiting of plume height strongly buffers the impact changing source area has on particle dispersal. As a result, particle dispersal distance remains similar for grains greater than ~0.05 m in size. In the case of S3 once Vtp0 > 1 m s−1 (Figure 11A) or A0 > 19 m2 (Figure 11B) plume height is limited by the sea surface 950 m above the source and differences in dispersal distance are negligible.
In both models for grains smaller than ~100 μm (0.0001 m), particle dispersal distance increases dramatically, due to the rapid decrease in particle settling rates for these small grains (Figure 11). Particles smaller than ~100 μm entrained into any plume may be dispersed over 100's or 1000's of kilometers, even at low lateral current velocities.
Limitations
Application of analytical models to natural data and samples is challenging. We outline below some of the more significant limitations of this study.
In neither model is the effect of potentially significant, and definitely non-zero, volumes of volcaniclastic particles in the plume accounted for. The additional mass of volcanic particles in a convecting plume would result in a higher plume density, thereby producing slower ascent rates and lower maximum plume heights. However, the modeled turbulent plumes when Vtp0 > 1 m s−1 are strongly height-limited by the 950 m water depth. There is therefore significant leeway in the turbulent plume model for some reduction in maximum height or vertical velocity while still generating a plume capable of producing S3.
Lateral dispersal in the model is driven by a simplified unidirectional current extending across the entire depth of the water column. Current profiles in the ocean are hard to model, especially in regions with significant bathymetric relief (i.e., seamounts) where interaction of tides, large ocean currents and the seafloor can produce temporally variable large eddies or localized currents along the seafloor (Wright, 2001; Xu and Lavelle, 2017). However, we believe that the assumption of a unidirectional current is an acceptable simplification due to the extensive evidence of preferential dispersal to the north west during the 2012 Havre eruption (Carey et al., 2014, 2018).
Calculated particle settling rate assume no turbulence. The effect of this simplification is to underestimate depositional time, especially of fine irregularly shaped particles (Sørensen et al., 2007), such as those that compose S3.
Discussion
Source and Timing of the Formation of Subunit 3 During the 2012 Havre Eruption
Visual comparison of the pumiceous carapace and breccia on Lava G (Figure 2) with elongate tube-vesicle grains of S3 (Figure 4) shows striking morphological and microtextural (Figures 6, 8) similarities. S3 additionally displays a strong thinning trend away from the area of Lava G and along with a broad fining trend (Figure 3). Noise in the fining trend of S3 can be explained by seafloor currents. At several locations during ROV dives at Havre localized currents were encountered with velocities of between ~0.1 and 0.3 m estimated by pilots based on the reduction in ROV speed on entering the current. There are also many areas where ash deposits are strongly rippled. The steep and substantial topography of Havre seamount and its caldera will generate a complex shifting pattern of sea floor currents that would modify dispersal patterns of particle settling through them.
Based on the thinning and fining trends, the uniqueness of the highly elongate ash grains among the Havre eruption products (Murch et al., 2019a), and the similarity in microlite textures of Lava G carapace with S3, we interpret that the source location of S3 was on Lava G or was Lava G's carapace. No other lava identified on the seafloor at Havre is glassy with a similar fibrous texture defined by elongate vesicles to that of Lava G (Ikegami et al., 2018).
S3 was observed both as a continuous unit in stratigraphy and as diffuse elongate tube-vesicle grains within the upper part of S2a (Figure 2) (Murch et al., 2019a). The position of S3 within the stratigraphy of the Havre eruption laid out by Murch et al. (2019a) indicates the relative timing of its deposition. The units underlying S3 (S1 and S2a) are inferred to be associated with the eruptive phase which formed the pumice raft on 18-19th July 2012. The deposition of S2a is inferred to have occurred over an extended period due to the extremely low settling rates associated with the fine ash that composes S2a (Murch et al., 2019a). That S3 is found in the upper part of S2a suggests some time had elapsed following the formation of the fine ash that would form S2a during the 18-19th July 2012 eruption before S3 was deposited, potentially days to weeks (?). The timing of S3 correlates with that inferred for Lava G in Ikegami et al. (2018) as having formed after deposition of the seafloor Giant Pumice unit, itself formed during the 18-19th July 2012 pumice raft-forming eruption phase (Manga et al., 2018a,b) or possibly before it. Lava G was truncated by a collapse along the NE caldera wall that occurred prior to the 15th Oct 2012 bathymetric survey of Havre (Carey et al., 2018; Ikegami et al., 2018). This caldera-wall collapse is also suggested to have abruptly ended the formation of S3 (Murch et al., 2019b). We therefore infer that S3 formed synchronously with the eruption of Lava G at some time following 18-19th July 2012 (pumice raft) (Jutzeler et al., 2014), and prior to 15th October 2012 (bathymetry survey) (Carey et al., 2014).
The spatial and temporal association of S3 with Lava G, as well as the microtextural similarity of the material produced by each, is strongly suggestive of a common or related formation mechanism. We therefore infer that S3 was formed as part of the eruption of Lava G.
Formation Mechanism of Subunit 3
The depositional characteristics of S3 imply vertical settling following rise and horizontal transport of particles from their source within the footprint of Lava G. The presence of S3 in sample HVR031, 47 m higher than the top of Lava G, and in HVR272 and HVR283, on the north caldera rim >4 km away at the same depth as Lava G across the 500 m deep caldera (Figure 1), strongly implies significant vertical and horizontal transport of grains. The implied vertical transport of particles, along with S3's draping of topography and thinning and fining trends away from the inferred source (Figure 3), suggests that S3 formed by subaqueous “fallout,” similar to fall deposits from a subaerial eruption.
In the subaqueous environment significant vertical convective dispersal of volcaniclastics does not imply an explosive source eruption (White et al., 2003, 2015; Barreyre et al., 2011; Cas and Giordano, 2014; Walker et al., 2019). Both air and water undergo convection when heated, however water's higher density and viscosity means it can more readily entrain and transport particles at lower fluid velocities (Ferguson and Church, 2004; Kaminski et al., 2005; Barreyre et al., 2011). Thus, any heat source capable of producing convection in the overlying water can drive vertical dispersal of ash (Palmer and Ernst, 1998; Barreyre et al., 2011; Cas and Simmons, 2018). First order depositional characteristics of S3 (i.e., thinning and fining trends, draping topography, etc.) indicating “fallout” deposition from suspension are consistent with a range of eruptive scenarios.
The source of S3 is identified as Lava G. Particle-dispersal modeling demonstrates that seawater convection driven solely by a cooling lava flow is insufficient to have generated S3 (Figure 11), but a weak jet forming eruption could have done so. We infer that eruption of Lava G was associated with formation of weak sustained jets, which generated ash and widely dispersed it in a convective plume. Comparison of ash from S3 with that produced by hybrid pyroclastic-effusive activity during the rhyolitic eruption of Cordón Caulle, Chile (2011-2012) reveals strong similarities in particle morphology and microtextures (compare our Figures 4, 5 with Figures 6A,B from Schipper et al., 2013). Hybrid pyroclastic-effusive activity, also termed syn-extrusive ash venting, is a style of volcanism in which vigorous outgassing occurs through a permeable network of tuffisite channels penetrating a conduit that is simultaneously extruding lava (e.g., Castro et al., 2012; Schipper et al., 2013; Cole et al., 2014; Black et al., 2016; Kendrick et al., 2016; Saubin et al., 2016). This style of eruptive activity subaerially ranges from gas jetting at low flux, to ash jetting at medium flux, to weak Vulcanian activity at the highest fluxes (Schipper et al., 2013).
Ash venting at Cordón Caulle produced elongate particles ~2.5 mm— < <0.1 mm long and defined by tube vesicles that run parallel to each clast's long axis (Schipper et al., 2013). The ash is mostly aphyric and shows high along-axis permeabilities. Morphologically the ash from S3 and that generated by hybrid activity at Cordón Caulle are almost identical and they are also microtexturally extremely similar.
Both 2011-12 Cordón Caulle and Havre 2012 magmas are of rhyolitic composition (Castro et al., 2013). Hybrid activity observed during the rhyolitic eruptions of Chaitén (2008-09) and Cordón Caulle (2011-12) occurred at a similar stage in the eruption sequence to the inferred timing of Lava G. At Chaitén and Cordón Caulle, hybrid activity followed a Plinian eruptive phase, during transitions to simple effusion of outgassed lava (Castro et al., 2012; Schipper et al., 2013; Kendrick et al., 2016; Saubin et al., 2016). Formation of Lava G and S3 in the 2012 Havre eruption following the intense eruption phase inferred to have generated the pumice raft, GP unit, ALB unit, and S1 and S2a (Murch et al., 2019a). The absence of S3 ash on adjacent Domes H and I suggests that deposition of S3 and hybrid activity had ended prior to the end of the effusive phase at Havre. Lava G and S3 were therefore erupted during a transitional phase between intensive pyroclastic activity and simple lava effusion.
Hybrid pyroclastic-effusive activity during eruption of Lava G is consistent with the inferred spatial and temporal source of S3, the modeled dispersal of S3, and the characteristics of elongate tube-vesicle grains. S3 is inferred to have formed following the 18-19th July 2012 pumice raft-forming eruption phase. During the effusion of Lava G vigorous outgassing through open tuffisite channels produced a small jet carrying ash and lapilli (Figure 12A). The extremely weak convection driven by cooling of a lava flow suggests that heat from the carapace of Lava G did not drive distribution of elongate tube vesicle grains. Instead, rapid heat transfer from ash-venting jets to the surrounding water drove a vigorous turbulent plume that dispersed the particles produced. Based on modeled plume strength (Figure 10A) ash particles were probably carried to the sea surface before plume spreading and particle settling. This inferred plume would have been too dilute to be observed on satellite imagery. Ocean currents deflected the plume, with particles settling from the NE-drifting plume generating the S3 deposit (Figure 12B). Thermal convection of the seawater above Lava G was only able to disperse extremely fine ash (<600 μm) and did not generate a recognized deposit (Figure 12A).
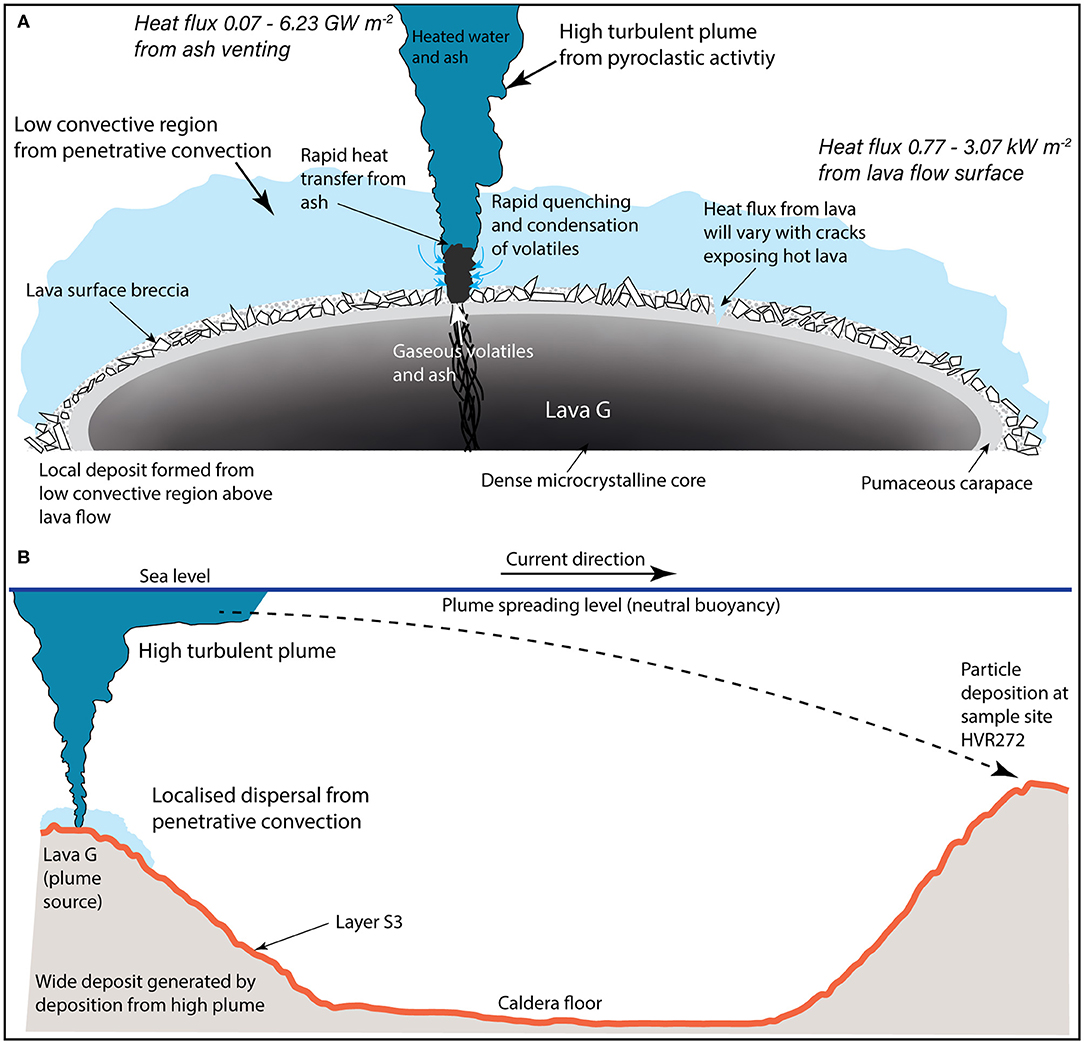
Figure 12. Schematic model of eruption processes S3. (A) Lava G being erupted onto the sea floor. Heat flow from the lava surface to the ambient water column is relatively low due to the formation of an insulating quenched carapace and overlying breccia. The low rate of heat transfer drives weak penetrative convection above the lava flow forming a convecting region up to about 200 m thick, shown in light blue. Syn-extrusive pyroclastic activity driven by outgassing through tuffesite networks forms a small jet of volatiles and ash that rapidly condenses and quenches on contact with the ambient water. Rapid heat transfer from the jet to the ambient water drives a buoyant turbulent plume that would reach the sea surface, shown in dark blue. (B) A wider view of the dispersal process. Particles entrained in the buoyant turbulent plume are dispersed in a lateral current to form the observed seafloor deposit of S3. Localized dispersal of fine ash occurs as a result of penetrative convection likely forming a minor component of the overall deposit.
Deep Subaqueous Hybrid Explosive-Effusive Activity
We infer that despite a vent depth of ~950 mbsl, the impact of the water column on hybrid pyroclastic-effusive processes was relatively restricted. Impacts of the water column on submarine eruptions can be broadly considered as direct or indirect. Direct impacts result from magma-water contact (quenching, granulation, MFCI, etc.) (Kokelaar, 1986; Austin-Erickson et al., 2008; van Otterloo et al., 2015), while indirect impacts arise from the different physical properties of water compared to air (hydrostatic pressure, higher viscosity, etc.) (Cas, 1978; Allen et al., 2010).
The high hydrostatic pressure at the erupting vent would have decreased the amount of H2O exsolution during magma ascent, and thus magma viscosity would have been lower during shallow ascent (e.g., Cas and Simmons, 2018). There is no obvious evidence for direct magma-water interaction in ash of S3. We infer that direct impacts of water during the formation of S3 were restricted to quenching of ash. Volatiles outgassed during the effusion of Lava G drove ash venting and the continuous flux of volatiles and high temperatures within the outgassing channels would have kept seawater from entering the permeable channels where S3 particles were formed (Figure 12A). Formation and initial transport of ash in hot, volatile-filled outgassing channels, along with reduced magma viscosity from hydrostatic suppression of volatile exsolution, explains the highly fluidal morphology of particles in S3 (Murch et al., 2019a).
Particle Dispersal From Subaqueous Eruptions
The dispersal models and inferences presented here are specific to Lava G and the 2012 Havre eruption, but this approach can be more widely applied to assessment of seafloor ash deposits or the eruption of lava in other subaqueous eruptions.
We have shown quantitatively that clasts from submarine lavas can be entrained and significantly dispersed simply by heating of ambient water, as has been theorized (Leybourne and Van Wagoner, 1991; Maicher et al., 2000; White, 2000; Cas and Simmons, 2018). The size of particles that can be entrained by such “passive” penetrative convection above a lava is limited, however, and generally less than ~1 mm (Figure 11). Widespread seafloor deposits containing grains larger than ~1 mm are unlikely to be dispersed by “passive” penetrative convection above a subaqueous lava.
The difference in dispersal distances from the two modeled entrainment scenarios reflects the estimated driving heat fluxes from cooling of a lava flow vs. from an eruptive jet. Values for Q of between 0.07 x 10⁹ to 6.23 x 10⁹ W m−2 were estimated for the eruptive jet, vs. Q from a submarine rhyolite lava flow surface of ~3 x 10³ W m−2, 6 orders of magnitude lower. The later is comparable to measured rates of heat loss from subaerial lava lakes and Hawaiian lava flows (Hardee, 1979; Harris, 2008). Contact with water produces high quenching rates at a lava flow's surface, but coherent lava's low thermal conductivity means heat flux to the water is limited by surface area. In contrast, in conduit fragmentation generates a large surface area leading to rapid transfer to the ambient seawater. Subaqueous volcaniclastic dispersal can occur from both jet-forming and purely effusive eruptions, but they will produce distinctly different deposits (Figure 12B).
Conclusions
The unprecedented sample set collected following the 2012 Havre eruption allowed individual layers associated with specific eruptive phases to be identified in the seafloor Ash with Lapilli unit. We have identified Lava G as the source of S3 based on thinning and fining trends of the unit along with similarities of ash and lava carapace microtextural and morphological characteristics. Modeling of convective plumes above an ash-venting eruption vs. “passive” convection above a lava flow, demonstrate that a jet-driven plume is required to generate dispersal characteristics of the S3 deposit. Strong microtextural and morphological similarities of S3 pyroclasts with those from hybrid pyroclastic-effusive activity at Cordon Caulle volcano, Chile, suggest S3 is the product of ash venting concurrent with effusion of Lava G.
Our modeling informs our wider understanding of subaqueous pyroclast dispersal during both effusive and pyroclastic submarine eruptions. Only small particles (probably less than <1 mm for either basaltic or rhyolite lavas) can be dispersed by passive convection above effusion lavas. Submarine “ash venting” has a much greater ability to drive convective dispersal of larger particles, over distance exceeding kilometers.
Data Availability Statement
All datasets generated for this study are included in the article/Supplementary Material.
Author Contributions
RC organized and led the 2015 research cruise. AM, JW, RC, and FI were present on the cruise and assisted with sample collection. JW established the scope of the project. Analysis of clastic samples was conducted by AM. Analysis of Lava G samples was conducted by RM and FI. TB had previous wrote the matlab code for analyses of a buoyant turbulent plume, and assisted in analysis of plume calculation results. AM drafted the manuscript and figures. All authors assisted in writing the final manuscript.
Funding
RC was funded by Australian Research Council grants DP110102196 and DE150101190 and a short-term postdoctoral fellowship grant from the Japan Society for the Promotion of Science. Funding was also provided by the U.S. National Science Foundation (grant OCE1357443 to Bruce Houghton, and grant OCE1357216 to Adam Soule) and a New Zealand Marsden grant (U001616 to JW). JW and AM were supported by a research grant, Ph.D. scholarship and postgraduate publishing bursary from the University of Otago, New Zealand.
Conflict of Interest
The authors declare that the research was conducted in the absence of any commercial or financial relationships that could be construed as a potential conflict of interest.
Acknowledgments
Support from the R/V Roger Revelle crew and the ROV and AUV operations teams was invaluable. Thanks to William Chadwick and a reviewer whose comments greatly improved this manuscript.
Supplementary Material
The Supplementary Material for this article can be found online at: https://www.frontiersin.org/articles/10.3389/feart.2020.00237/full#supplementary-material
References
Allen, S. R., Fiske, R. S., and Cashman, K. V. (2008). Quenching of steam-charged pumice: Implications for submarine pyroclastic volcanism. Earth Planet. Sci. Lett. 274, 40–49. doi: 10.1016/j.epsl.2008.06.050
Allen, S. R., Fiske, R. S., and Tamura, Y. (2010). Effects of water depth on pumice formation in submarine domes at sumisu, Izu-Bonin arc, western Pacific. Geology 38, 391–394. doi: 10.1130/G30500.1
Austin-Erickson, A., Büttner, R., Dellino, P., Ort, M. H., and Zimanowski, B. (2008). Phreatomagmatic explosions of rhyolitic magma: experimental and field evidence. J. Geophys. Res. Solid Earth 113, 1–12. doi: 10.1029/2008JB005731
Bagdassarov, N., and Dingwell, D. (1994). Thermal properties of vesicular rhyolite. J. Volcanol. Geotherm. Res. 600, 179–191. doi: 10.1016/0377-0273(94)90067-1
Barreyre, T., Soule, S. A., and Sohn, R. A. (2011). Dispersal of volcaniclasts during deep-sea eruptions: settling velocities and entrainment in buoyant seawater plumes. J. Volcanol. Geotherm. Res. 205, 84–93. doi: 10.1016/j.jvolgeores.2011.05.006
Bernstein, M., Pavez, A., Varley, N. R., Whelley, P., and Calder, E. S. (2013). Rhyolite lava dome growth styles at chaitén volcano, chile (2008-2009): interpretation of thermal imagery. Andean Geol. 40, 295–309. doi: 10.5027/andgeoV40n2-a07
Black, B. A., Manga, M., and Andrews, B. (2016). Ash production and dispersal from sustained low-intensity mono-inyo eruptions. Bull. Volcanol. 78:57. doi: 10.1007/s00445-016-1053-0
Bonadonna, C., and Costa, A. (2015). Tephra Dispersal and Sedimentation, 2 Edn. San Diego: Elsevier Inc. doi: 10.1016/B978-0-12-385938-9.00033-X
Buttsworth, D. R. (1997). A Finite Difference Routine for the Solution of Transient One Dimenasional Heat Conduction Problems With Curvature and Temperature- Dependent Thermal Properties. OUEL Report Number, 2130/97. Technical report.
Calkins, J., Oppenheimer, C., and Kyle, P. R. (2008). Ground-based thermal imaging of lava lakes at Erebus volcano, Antarctica. J. Volcanol. Geotherm. Res. 177, 695–704. doi: 10.1016/j.jvolgeores.2008.02.002
Cann, J. R., and Strens, M. R. (1989). Modeling periodic megaplume emission by black smoker systems. J. Geophys. Res. 94, 12227–12237.
Carey, R., Soule, S. A., Manga, M., White, J., Mcphie, J., Wysoczanski, R., et al. (2018). The largest deep ocean silicic volcanic eruption of the past century. Sci. Adv. 4:e1701121. doi: 10.1126/sciadv.1701121
Carey, R. J., Wysoczanski, R., Wunderman, R., and Jutzeler, M. (2014). Discovery of the largest historic silicic submarine eruption. Eos 95, 157–159. doi: 10.1002/2014EO190001
Cas, R. (1978). Silicic lavas in paleozoic flyschlike deposits in new south Wales, Australia: behavior of deep subaqueous silicic flow. Geol. Soc. Am. Bull. 89, 1708–1714. doi: 10.1130/0016-7606(1978)89<1708:SLIPFD>2.0.CO;2
Cas, R. A. F., and Giordano, G. (2014). Submarine volcanism: a review of the constraints, processes and products, and relevance to the cabo de gata volcanic succession. Ital. J. Geosci. 133, 362–377. doi: 10.3301/IJG.2014.46
Cas, R. A. F., and Simmons, J. M. (2018). Why deep-water eruptions are so different from subaerial eruptions. Front. Earth Sci. 6:198. doi: 10.3389/feart.2018.00198
Castro, J. M., Cordonnier, B., Tuffen, H., Tobin, M. J., Puskar, L., Martin, M. C., et al. (2012). The role of melt-fracture degassing in defusing explosive rhyolite eruptions at volcán Chaitén. earth planet. Sci. Lett. 333–334, 63–69. doi: 10.1016/j.epsl.2012.04.024
Castro, J. M., Schipper, C. I., Mueller, S. P., Militzer, A. S., Amigo, A., Parejas, C. S., et al. (2013). Storage and eruption of near-liquidus rhyolite magma at Cordón Caulle, Chile. Bull. Volcanol. 75, 702–719. doi: 10.1007/s00445-013-0702-9
Clarke, B., Calder, E. S., Dessalegn, F., Fontijn, K., Cortés, J. A., Naylor, M., et al. (2019). Fluidal pyroclasts reveal the intensity of peralkaline rhyolite pumice cone eruptions. Nat. Commun. 10:2010. doi: 10.1038/s41467-019-09947-8
Cole, P. D., Smith, P., Komorowski, J.-C., Alfano, F., Bonadonna, C., Stinton, A. J., et al. (2014). Ash venting occurring both prior to and during lava extrusion at Soufriere Hills Volcano, Montserrat, from 2005 to 2010. Geol. Soc. Lond. Mem. 39, 71–92. doi: 10.1144/M39.4
Cushman-Roisin, B. (ed.). (2019). “Chapter 7. Convection,” in Environmental Fluid Mechanics (New York, NY: John Wiley and Sons, Inc), 121–133.
Deardorff, N. D., Cashman, K. V., and Chadwick, W. W. Jr. (2011). Observations of eruptive plume dynamics and pyroclastic deposits from submarine explosive eruptions at NW Rota-1, Mariana arc. J. Volcanol. Geotherm. Res. 202, 47–59. doi: 10.1016/j.jvolgeores.2011.01.003
Dürig, T., White, J. D. L., Murch, A. P., Zimanowski, B., Büttner, R., and Mele, D. et al. (in press). Deep-sea eruptions boosted by induced fuel-coolant explosions. Nat. Geosci. doi: 10.1038/s41561-020-0603-4.
Estoque, M. A. (1968). Vertical mixing due to penetrative convection. J. Atmos. Sci. 25, 1046–1051. doi: 10.1175/1520-0469(1968)025<1046:VMDTPC>2.0.CO;2
Fauria, K. E., Manga, M., and Wei, Z. (2017). Trapped bubbles keep pumice afloat and gas diffusion makes pumice sink. Earth Planet. Sci. Lett. 460, 50–59. doi: 10.1016/j.epsl.2016.11.055
Ferguson, R. I., and Church, M. (2004). A simple universal equasion for grain settling velosity. J. Sediment. Res. 74, 933–937. doi: 10.1306/051204740933
Fink, J. H. (1983). Structure and emplacement of a rhyolitic obsidian flow: little glass mountain, medicine lake highland, northern California. Geol. Soc. Am. Bull. 94, 362–380. doi: 10.1130/0016-7606(1983)94<362:SAEOAR>2.0.CO;2
Hardee, H. C. (1979). Heat-transfer measurements in the 1977 Kilauea lava flow, Hawaii. J. Geophys. Res. 184, 7485–7493.
Harris, A. J. L. (2008). Modeling lava lake heat loss, rheology, and convection. Geophys. Res. Lett. 35:L07303. doi: 10.1029/2008GL033190
Head, J. W., and Wilson, L. (2003). Deep submarine pyroclastic eruptions: theory and predicted landforms and deposits. J. Volcanol. Geotherm. Res. 121, 155–193. doi: 10.1016/S0377-0273(02)00425-0
Hoskuldsson, A., and Sparks, R. S. J. (1997). Thermodynamics and fluid dynamics of effusive subglacial eruptions. Bull. Volcanol. 59, 219–230. doi: 10.1007/s004450050187
Hunt, G. R., and Van Den Bremer, T. S. (2011). Classical plume theory: 1937-2010 and beyond. IMA J. Appl. Math. 76, 424–448. doi: 10.1093/imamat/hxq056
Ikegami, F., McPhie, J., Carey, R., Mundana, R., Soule, A., and Jutzeler, M. (2018). The eruption of submarine rhyolite lavas and domes in the deep ocean – havre 2012, kermadec arc. Front. Earth Sci. 6:147. doi: 10.3389/feart.2018.00147
Jutzeler, M., Marsh, R., Carey, R. J., White, J. D. L., Talling, P. J., and Karlstrom, L. (2014). On the fate of pumice rafts formed during the 2012 Havre submarine eruption. Nat. Commun. 5:3660. doi: 10.1038/ncomms4660
Kaminski, E., Chenet, A. L., Jaupart, C., and Courtillot, V. (2011). Rise of volcanic plumes to the stratosphere aided by penetrative convection above large lava flows. Earth Planet. Sci. Lett. 301, 171–178. doi: 10.1016/j.epsl.2010.10.037
Kaminski, E., Tait, S., Carazzo, G., Diderot, D., and Jussieu, P. (2005). Turbulent entrainment in jets with arbitrary buoyancy. J. Fluid Mech. 526, 361–376. doi: 10.1017/S0022112004003209
Kendrick, J. E., Lavallée, Y., Varley, N. R., Wadsworth, F. B., Lamb, O. D., and Vasseur, J. (2016). Blowing off steam: tuffisite formation as a regulator for lava dome eruptions. Front. Earth Sci. 4:41. doi: 10.3389/feart.2016.00041
Kokelaar, P. (1986). Magma-water interations in subaqueous and emergent basaltic volcanism. Bull. Volcanol. 48, 275–289. doi: 10.1007/BF01081756
Lesher, C. E., and Spera, F. J. (2015). “Thermodynamic and transport properties of silicate melts and magma,” in Encyclopedia of Volcanoes, eds H. Sigurdsson B. Houghton, S. McNutt, H. Rymer, and J. Stix (San Diego, CA: Academic Press), 113–141. doi: 10.1016/B978-0-12-385938-9.00005-5
Leybourne, M. I., and Van Wagoner, N. A. (1991). Heck and heckle seamounts, northeast Pacific Ocean: high extrusion rates of primitive and highly depleted mid-ocean ridge basalt on off-ridge seamounts. J. Geophys. Res. 96, 16275–16293. doi: 10.1029/91JB00595
Maicher, D., White, J. D. L., and Batiza, R. (2000). Sheet hyaloclastite: density-current deposits of quench and bubble-burst fragments from thin, glassy sheet lava flows, Seamount Six, Eastern Pacific Ocean. Mar. Geol. 171, 75–94. doi: 10.1016/S0025-3227(00)00109-2
Manga, M., Fauria, K. E., Lin, C., Mitchell, S. J., Jones, M., Conway, C. E., et al. (2018a). The pumice raft-forming 2012 havre submarine eruption was effusive. Earth Planet. Sci. Lett. 489, 49–58. doi: 10.1016/j.epsl.2018.02.025
Manga, M., Mitchell, S. J., Degruyter, W., and Carey, R. J. (2018b). Transition of eruptive style: pumice raft to dome-forming eruption at the Havre submarine volcano, southwest Pacific Ocean. Geology 46, 1075–1078. doi: 10.1130/G45436.1
Manley, C. R. (1996). In situ formation of welded tuff-like textures in the carapace of a voluminous silicic lava flow, Owyhee County, SW Idaho. Bull. Volcanol. 57, 672–686. doi: 10.1007/s004450050120
Mittal, T., and Delbridge, B. (2019). Detection of the 2012 havre submarine eruption plume using argo floats and its implications for ocean dynamics. Earth Planet. Sci. Lett. 511, 105–116. doi: 10.1016/j.epsl.2019.01.035
Morton, B. R., Geoffrey Taylor, F. R. S., Turner, J. S., Taylor, G., and Turner, J. S. (1956). Turbulent gravitational convection from maintained and instantaneous sources. Proc. R. Soc. Lond. 234, 1–23. doi: 10.1098/rspa.1956.0011
Murch, A. P., White, J. D. L., and Carey, R. J. (2019a). Characteristics and deposit stratigraphy of submarine-erupted silicic Ash, Havre Volcano, Kermadec Arc, New Zealand. Front. Earth Sci. 7:1. doi: 10.3389/feart.2019.00001
Murch, A. P., White, J. D. L. L., and Carey, R. J. (2019b). Unusual fluidal behavior of a silicic magma during fragmentation in a deep subaqueous eruption, Havre volcano, southwestern Pacific Ocean. Geology 47, 487–490. doi: 10.1130/G45657.1
Palmer, M. R., and Ernst, G. G. J. (1998). Generation of hydrothermal megaplumes by cooling of pillow basalts at mid-ocean ridges. Nature 393, 643–647. doi: 10.1038/31397
Rotella, M. D., Wilson, C. J. N., Barker, S. J., Ian Schipper, C., Wright, I. C., Wysoczanski, R. J., et al. (2015). Dynamics of deep submarine silicic explosive eruptions in the kermadec arc, as reflected in pumice vesicularity textures. J. Volcanol. Geotherm. Res. 301, 314–332. doi: 10.1016/j.jvolgeores.2015.05.021
Saubin, E., Tuffen, H., Gurioli, L., Owen, J., Castro, J. M., Berlo, K., et al. (2016). Conduit dynamics in transitional rhyolitic activity recorded by tuffisite vein textures from the 2008–2009 chaitén eruption. Front. Earth Sci. 4:59. doi: 10.3389/feart.2016.00059
Schiesser, W. (1991). Heat Conduction in Cylindrical and Spherical Coordinates. The Numerical Method of Lines. San Diego: Academic Press, 326.
Schipper, C. I., Castro, J. M., Tuffen, H., James, M. R., and How, P. (2013). Shallow vent architecture during hybrid explosive-effusive activity at Cordón Caulle (Chile, 2011-12): evidence from direct observations and pyroclast textures. J. Volcanol. Geotherm. Res. 262, 25–37. doi: 10.1016/j.jvolgeores.2013.06.005
Sørensen, H., Rosendahl, L., Yin, C., and Mandø, M. (2007). “Settling of a cylindrical particle in a stagnant fluid,” in Proceedings of the 6th International Conference on Multiphase Flow (ICMF) (Leipzig).
Speer, K. G., and Rona, P. A. (1989). A model of an Atlantic and Pacific hydrothermal plume. J. Geophys. Res. 94:6213. doi: 10.1029/JC094iC05p06213
Stull, R. B. (1973). Inversion rise model based on penetrative convection. J. Atmos. Sci. 30, 1092–1099. doi: 10.1175/1520-0469(1973)030<1092:IRMBOP>2.0.CO;2
Sutton, P., Chiswell, S., Gorman, R., Kennan, S., and Rickard, G. (2012). Physical Marine Environment of the Kermadec Islands Region. Wellington: Science for conservation 318; Department of conservation, 1–17.
Thomas, R. M. E., and Sparks, R. S. J. (1992). Cooling of tephra during fallout from eruption columns. Bull. Volcanol. 54, 542–553. doi: 10.1007/BF00569939
van Otterloo, J., Cas, R. A. F., Scutter, C. R. (2015). The fracture behaviour of volcanic glass and relevance to quench fragmentation during formation of hyaloclastite and phreatomagmatism. Earth Sci. Rev. 151, 79–116. doi: 10.1016/j.earscirev.2015.10.003
Walker, G. P. L. (1981). Generation and dispersal of fine ash and dust by volcanic eruptions. J. Volcanol. Geotherm. Res. 11, 81–92. doi: 10.1016/0377-0273(81)90077-9
Walker, S. L., Baker, E. T., Lupton, J. E., Resing, J. A., and Walker, S. L. (2019). Patterns of fine ash dispersal related to volcanic activity at west mata volcano, NE Lau Basin. Front. Mar. Sci. 6:593. doi: 10.3389/fmars.2019.00593
White, J. D. L., Schipper, C. I., and Kano, K. (2015). Submarine Explosive Eruptions, 2nd Edn. San Diego: Elsevier Inc. doi: 10.1016/B978-0-12-385938-9.00031-6
White, J. D. L., Smellie, J. L., and Clague, D. A. (eds.). (2003). “Introduction: A deductive outline and topical overview of subaqueous explosive volcanism,” in Explos. Explosive Subaqueous Volcanism (Washington, DC: American Geophysical Union), 1–20. doi: 10.1029/140GM01
White, J. D. L. L. (2000). Subaqueous eruption-fed density currents and their deposits. Precambrian Res. 101, 87–109. doi: 10.1016/S0301-9268(99)00096-0
Wohletz, K. H. (1983). Mechanisms of hydrovolcanic pyroclast formation: grain-size, scanning electron microscopy, and experimental studies. J. Volcanol. Geotherm. Res. 17, 31–63. doi: 10.1016/0377-0273(83)90061-6
Woods, A. W. (2010). Turbulent plumes in nature. Annu. Rev. Fluid Mech. 42, 391–412. doi: 10.1146/annurev-fluid-121108-145430
Wright, I. C. (2001). In situ modification of modem submarine hyaloclastic/pyroclastic deposits by oceanic currents: an example from the southern Kermadec arc (SW Pacific). Mar. Geol. 172, 287–307. doi: 10.1016/S0025-3227(00)00131-6
Wright, I. C., Worthington, T. J., and Gamble, J. A. (2006). New multibeam mapping and geochemistry of the 30°-35° S sector, and overview, of southern kermadec arc volcanism. J. Volcanol. Geotherm. Res. 149, 263–296. doi: 10.1016/j.jvolgeores.2005.03.021
Xu, G., and Lavelle, J. W. (2017). Circulation, hydrography, and transport over the summit of axial Seamount, a deep volcano in the Northeast Pacific. J. Geophys. Res. Ocean. 122, 5404–5422. doi: 10.1002/2016JC012464
Keywords: Havre volcano, hybrid explosive-effusive activity, subaqueous dispersal, penetrative convection, volcanic plumes
Citation: Murch AP, White JDL, Barreyre T, Carey RJ, Mundana R and Ikegami F (2020) Volcaniclastic Dispersal During Submarine Lava Effusion: The 2012 Eruption of Havre Volcano, Kermadec Arc, New Zealand. Front. Earth Sci. 8:237. doi: 10.3389/feart.2020.00237
Received: 17 February 2020; Accepted: 03 June 2020;
Published: 08 July 2020.
Edited by:
Roberto Sulpizio, University of Bari Aldo Moro, ItalyReviewed by:
William W. Chadwick, Oregon State University, United StatesMarco Pistolesi, University of Pisa, Italy
Copyright © 2020 Murch, White, Barreyre, Carey, Mundana and Ikegami. This is an open-access article distributed under the terms of the Creative Commons Attribution License (CC BY). The use, distribution or reproduction in other forums is permitted, provided the original author(s) and the copyright owner(s) are credited and that the original publication in this journal is cited, in accordance with accepted academic practice. No use, distribution or reproduction is permitted which does not comply with these terms.
*Correspondence: Arran P. Murch, arranmurch@kahaku.go.jp