Interdecadal Change of Drought Characteristics in Mahaweli River Basin of Sri Lanka and the Associated Atmospheric Circulation Difference
 Zhaohui Lin1,2,3*
  Sherly Shelton1,2
- 1International Center for Climate and Environment Sciences, Institute of Atmospheric Physics, Chinese Academy of Sciences, Beijing, China
- 2College of Earth and Planetary Sciences (CEPS), University of Chinese Academy of Sciences (UCAS), Beijing, China
- 3Collaborative Innovation Center on Forecast and Evaluation of Meteorological Disasters, Nanjing University of Information Science and Technology, Nanjing, China
Understanding the spatiotemporal characteristics of drought at the river basin scale is vital for water resources management. In this study, the interdecadal variation of drought characteristics over the Mahaweli River Basin (MRB) in Sri Lanka was investigated for the 1985–2015 period, using the Standardized Precipitation Evapotranspiration Index (SPEI). Remarkable interdecadal change of yearly drought characteristics between 1985–1999 and 2000–2015 periods in the wet region of MRB can be found for medium-term and long-term drought, with indications of that more frequent and severer drought events as well as longer duration of total drought months, occurred during 2000–2015 period. Furthermore, interdecadal enhancement of yearly drought in the wet region can be attributed to changes of seasonal drought in Southwest Monsoon (SWM) season, and this is coherent with the interdecadal shift of the SWM rainfall amount from wet to dry situations since the year 2000. However, no significant interdecadal change of drought was found in the intermediate and dry regions of MRB, as well as the short-term drought in the wet region. The interdecadal difference of atmospheric circulation demonstrates that the South Asian monsoon was weakened after 2000, which is accompanied by the weakening of monsoon trough, reduced cross-equatorial flow from the southern hemisphere from wind circulation at 850 hPa, and positive anomalies of geopotential height at 500 hPa over South Asian region. The weakening of South Asian monsoon leads to lesser moisture transport from the northwest Indian Ocean to Sri Lanka, inducing net moisture divergence anomalies in Sri Lanka, and ultimately results in more drought events during SWM season in the region since the year 2000.
Introduction
In recent years, nearly one-quarter of all damages and losses in the agricultural sector in developing countries are caused by climate-related disasters such as floods and droughts (FAO, 2015). As one of the devastating natural hazards, prolonged drought with higher severity has a substantial impact on food production, which endangers local and global food security (Lesk et al., 2016). In addition, the associated water scarcity (Sheffield et al., 2012), an increase in the risk of wildfires (Littell et al., 2016), intensified land degradation, and desertification are some of the significant issues associated with prolonged drought in a different part of the world. Furthermore, the severe drought can invigorate a significant reduction in water reserves available in the dam and reservoir, which adversely affects hydropower generation. As a result of negative consequences, severe droughts have gained more attention from the scientific community.
Observation studies suggest that more frequent and intensified droughts have occurred in many regions of the world during the last few decades (e.g., Mishra and Singh, 2011; Wang et al., 2014; Mallya et al., 2016; Spinoni et al., 2017). Particularly in the tropics and subtropics, the probabilities of occurrence of persistent droughts increased over extensive areas since the 1970s (IPCC, 2014). However, identification of drought characteristics such as intensity, magnitude, duration, and spatial extent, and quantifying their related mechanisms are challenging tasks among the climate community, because the drought is associated with complex interactions amongst the climate system, including atmospheric processes, land-based processes such as precipitation, evaporation, runoff, and also ocean processes (Dai, 2011; Vicente-Serrano et al., 2016; Spinoni et al., 2017).
Even though quantifying the drought characteristics and the related mechanisms is a challenging task, understanding the spatial and temporal variation of drought characteristics is the crucial component of drought research. For this purpose, different drought indices with different complexities are successively developed, which can be considered as a function of rainfall, and other hydro-meteorological variables such as evapotranspiration, temperature, etc (Morid et al., 2006). Among these indices, the Palmer Drought Severity Index (PDSI) (Palmer, 1965), the Standardized Precipitation Index (SPI) (McKee et al., 1993), the Reconnaissance Drought Index (RDI) (Tsakiris, 2004), and the Standardized Precipitation Evapotranspiration Index (SPEI) (Vicente-Serrano et al., 2010) have been proposed and widely used in drought studies for different application purpose. These drought indices can be calculated in multiple time scales, which is useful to monitor and identify the characteristic of meteorological, agricultural, hydrological, and social drought (Wang et al., 2011; Maskey and Trambauer, 2015).
According to the IPCC fifth assessment report (IPCC, 2014), the South Asian region is vulnerable to drought, food shortages, and heat-related mortality. Aadhar and Mishra (2017) suggest that Sri Lanka and other South Asian countries have experienced a long-lasting drought once every 3 years, which is one of the main reasons for the reduction in agricultural yield in Sri Lanka. In recent decades, Sri Lanka is adversely affected by droughts, due to the decreasing effect of monsoon rainfall. In addition, low water storage capacities and increasing demand of water for economic development further intensify the influence of drought on agriculture production over the country. So drought has been regarded as one of the most significant climate hazards in Sri Lanka, especially in the dry and intermediate climate zones of Sri Lanka (Zubair et al., 2006).
However, there are very few numbers of studies conducted to investigate the variation of drought characteristics and the associated mechanism. Among the previous drought-related studies in Sri Lanka, Gunda et al. (2016) used PDSI and SPI to identify the spatial-temporal distribution of drought over Sri Lanka. Few studies have focused on the impact of drought and possible mitigation strategies. For example, Gunda et al. (2017) evaluated the potential impacts of drought on soil moisture regimes in Sri Lanka. While Lyon et al. (2009) studied the relationship between drought relief payments and meteorological drought in Sri Lanka for the period of 1960–2000, and Burchfield and Gilligan (2016) investigated the farming strategies adopted to under drought and water stress in the dry zone of Sri Lanka. Consequently, drought management over Sri Lanka is largely limited to relief provisions. Robust insight into the variability and the mechanism of drought at basin scale still lacks which is critical for the drought prediction from seasonal to decadal time scales.
Mahaweli River Basin (hereafter “MRB”) is the largest river basin in Sri Lanka, with 15% of the Sri Lankan population (2.8 million people) inhabits in the basin. It accounts for one-sixth of Sri Lanka territory (55% of the dry zone) (Withanachchi et al., 2014) and irrigates 3650 km2 of rice fields in lowlands, with 1493 km2 paddy fields producing 21.3% out of total paddy production in Sri Lanka. In addition to agricultural development, seven major hydropower stations in MRB, with a capacity of 775 MWs (40% of the island-wide hydropower potential), supply around 17% electrical energy to the national grid annually (Hewawasam, 2010). However, less focus has been given by previous researches to identify drought’s characteristics and variation of drought over MRB.
Hence, this study will use station observation data to investigate the drought characteristics in the MRB with a focus on its decadal variability and associated atmospheric circulation changes. This will be of great importance for the prediction of drought variability, and further providing the scientific information for drought management and mitigation in the MRB. The paper is organized as follows, the study site of MRB is described in section “Data and Methodology,” which is followed by the datasets and methodology. In section “Results,” main analysis results are shown. The discussion and conclusion will be presented in Sections “Discussion” and “Conclusions,” respectively.
Data and Methodology
Study Region
Sri Lanka is located in the South Asian monsoon region; its annual rainfall is largely influenced by both the Southwest monsoon (SWM) and Northeast monsoon (NEM) systems. There are three climate regions, namely wet, intermediate, and dry regions in Sri Lanka, based on long-term climatology and geographical distribution of annual rainfall amount. The wet region is mostly located in the southwest part of the country, and the dry region is located in the northeast part of the country, with the intermediate lying between the wet and dry regions (Malmgren et al., 2003; Wickramagamage, 2010; Burt and Weerasinghe, 2014). Mahaweli River Basin, the selected study area, is mainly located in the central part of the country, with its drainage area of 10,448 km2 covering about 16% of the total landmass of the country. The southern and southwestern parts of the MRB are characterized by ridges, peaks, plateaus, basins, valleys, and escarpments, while the northern part of the basin show flat terrain with few isolated hills (Shelton and Lin, 2019). Generally, the MRB receives precipitation of 28 × 109 m3 annually (Zubair et al., 2003), with enhanced rainfall during the SWM season in the western and south-western parts of the basin (Zubair, 2002; Rubasinghe et al., 2015; Shelton and Lin, 2019), and rainy season for the eastern part of the basin is the NEM season. As shown in Figure 1, three climate regions, i.e., wet, intermediate, and dry region, can also be identified in MRB based on the annual rainfall amount received.
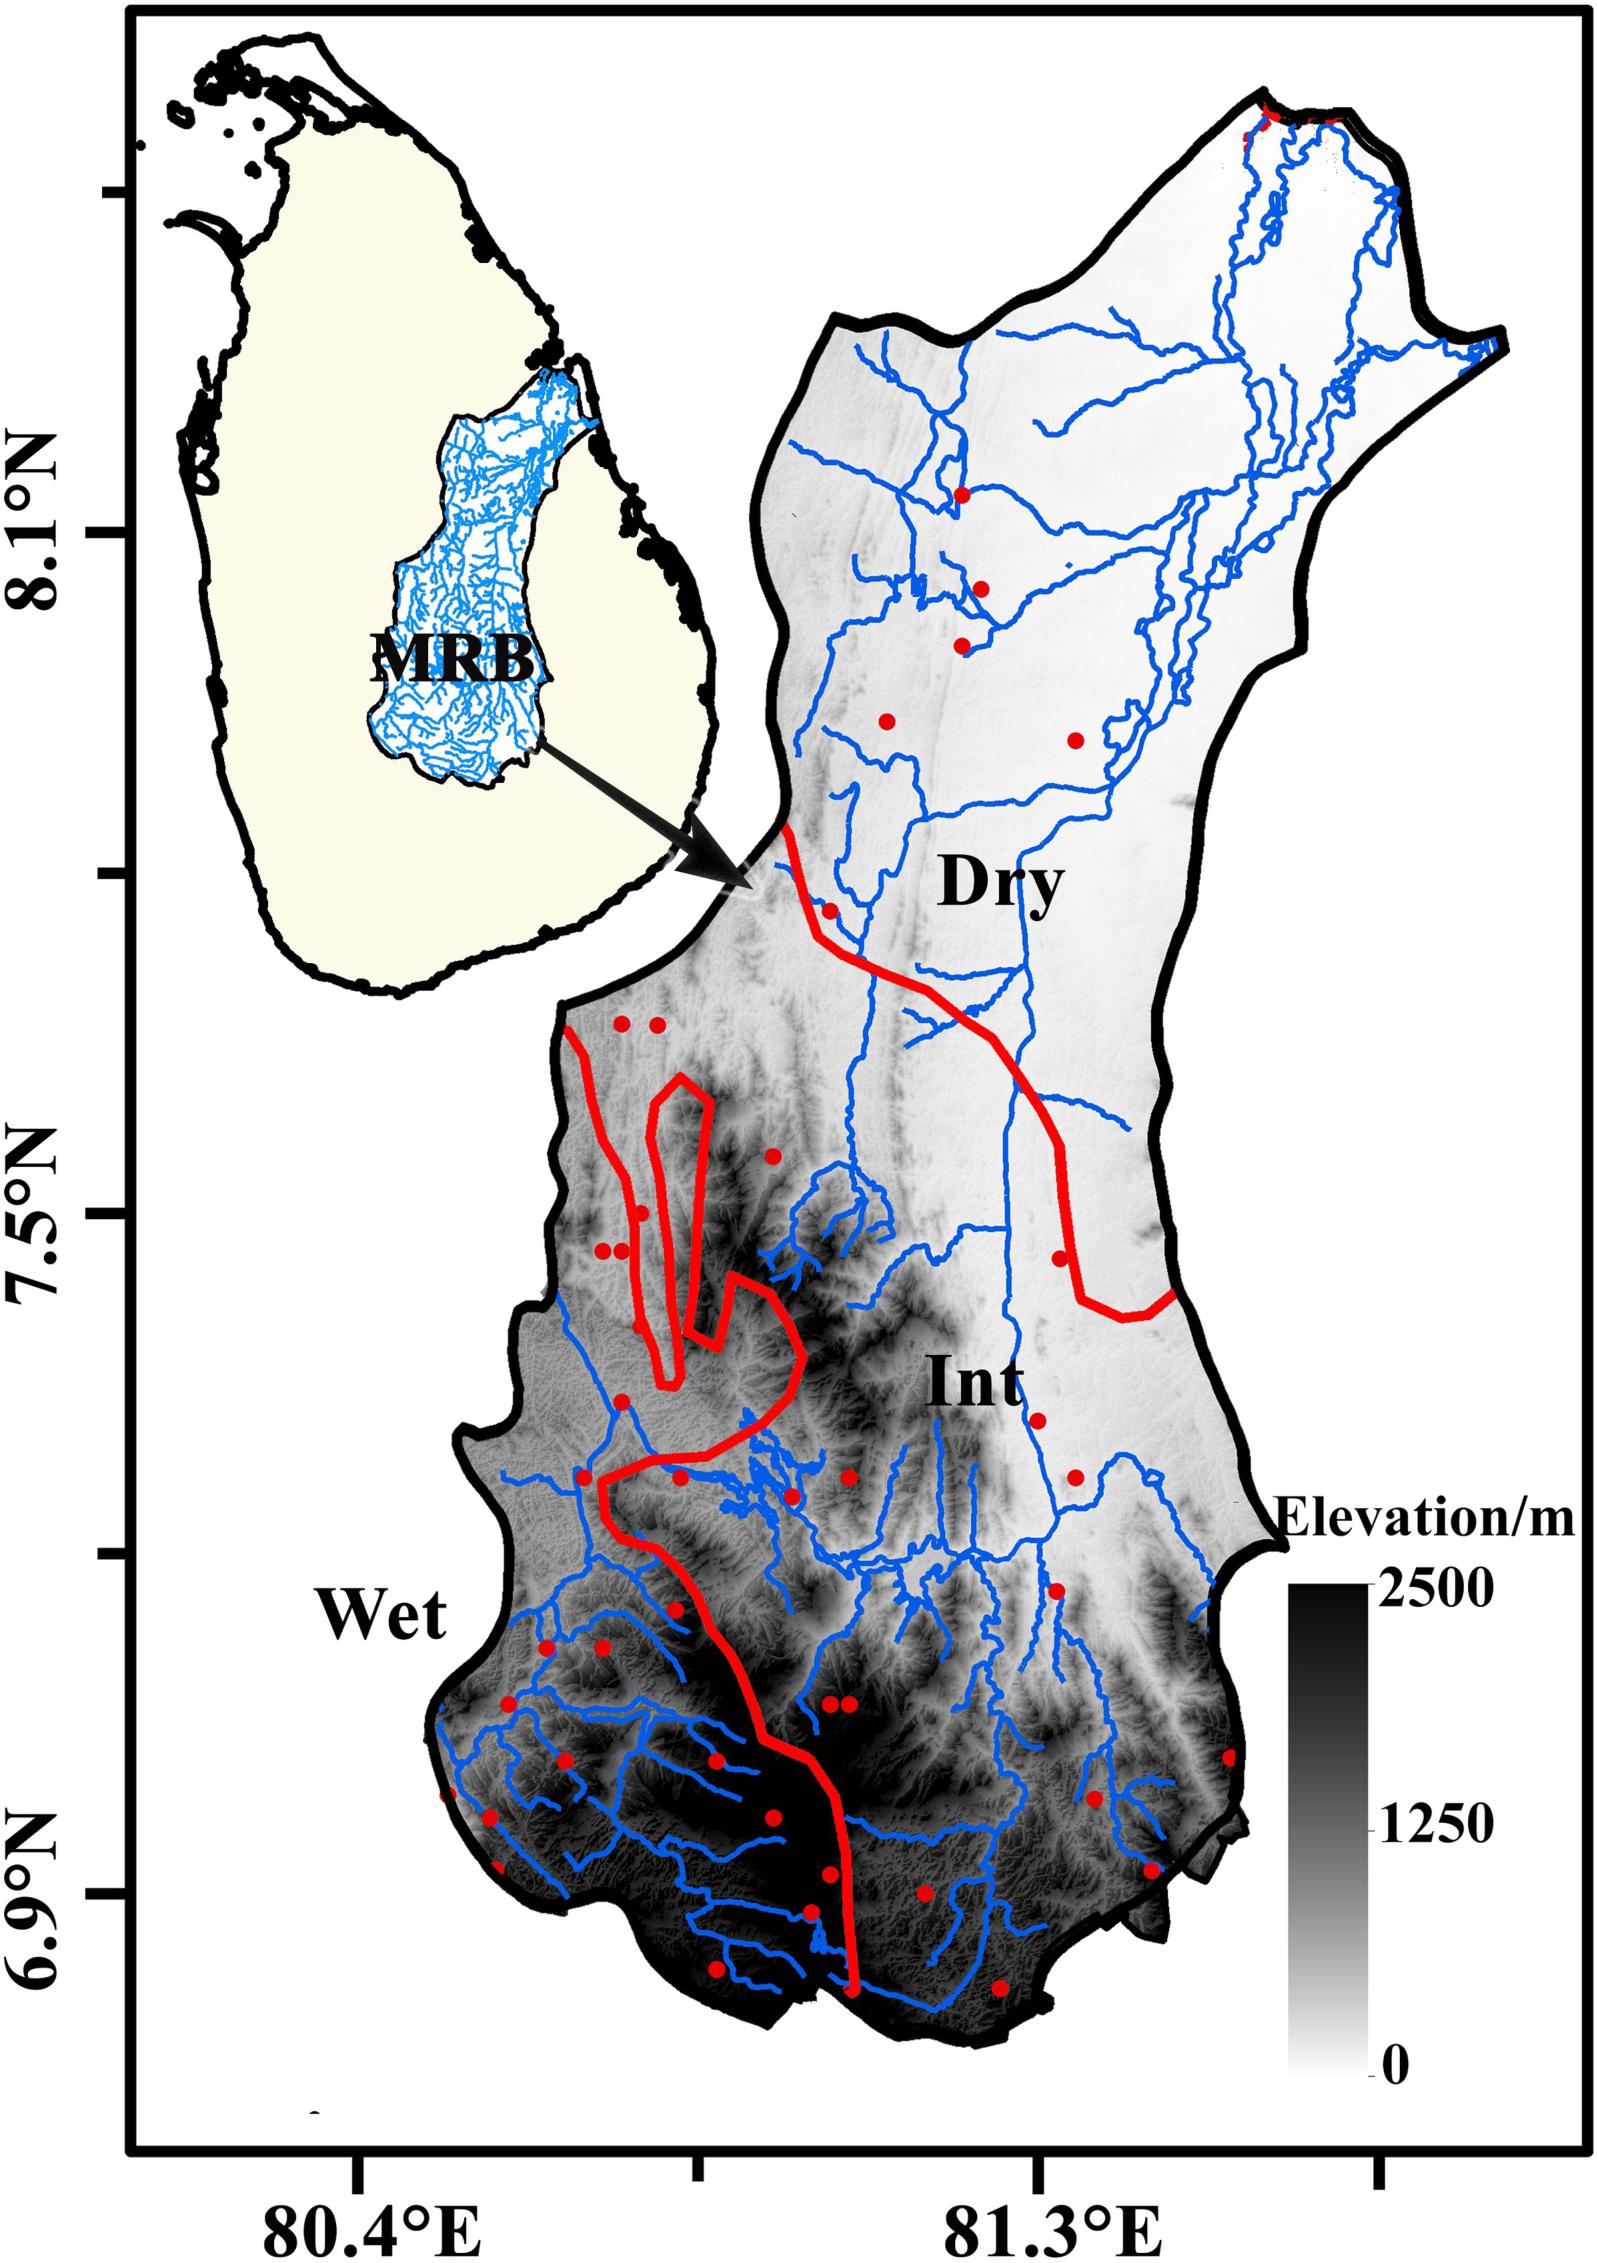
Figure 1. Country location and topographic map of the Mahaweli River Basin (MRB). The spatial distribution of selected rain gauge stations in MRB are shown in red dots. The red lines indicate boundaries for wet, intermediate, and dry sub-regions in the MRB, while the blue line represents the main channel of the Mahaweli River.
Data
Monthly rainfall data from 43 meteorological stations for the period 1985–2015, along with temperature data from 7 meteorological stations, are provided by the Department of Meteorology, Sri Lanka. However, only those stations with less than 3% missing data from 1985 to 2015 are selected for analysis, following the data quality control methodology by Vincent et al. (2011). It turns out that 34 rainfall stations data can be used for this analysis, with 16 rainfall stations in the wet region, 11 stations in the intermediate region, and 7 stations in the dry region. For temperature data, all 7 stations data are used, with 3 stations in the wet region, and 2 stations in both intermediate and dry regions. Figure 1 shows the spatial distributions of the selected meteorological stations.
Combining the Thiessen polygon method with the elevation regression method, the area average rainfall over wet, intermediate, and dry regions of MRB has been obtained, following the methodology by Jacquin and Soto-Sandoval (2013). This method has already been proved to be suitable for calculating the area average rainfall in the mountainous catchment (Limin et al., 2015; Shelton and Lin, 2019). The regional average rainfall and temperature are then used for calculating the SPI and SPEI indices in this study.
In addition to observation data, the monthly mean water vapor flux and divergence, horizontal (u) and meridional (v) wind at 850 hPa and geopotential height (z) at 500 hPa from ERA-Interim data from European Centre for Medium-Range Weather Forecasts (ECMWF), with the spatial resolution of 0.5°× 0.5° (Dee et al., 2011), are used for the analysis of atmospheric circulation anomalies and moist flux anomalies associated with the drought variations.
Furthermore, in this study, we divide the 1985–2015 period into two sub-periods in order for interdecadal analysis. The period after 2000, i.e., from 2000 to 2015, will be referred to as “P2,” and the period of 1985–1999 will be referred to as “P1” for simplicity.
Methodology
Standardized Precipitation Evapotranspiration Index (SPEI)
It is well known that Standardized Precipitation Evapotranspiration Index (SPEI) (Chen and Sun, 2015; Potopová et al., 2015; Yao et al., 2018) and Standardized Precipitation Index (SPI) (Mallya et al., 2016; Spinoni et al., 2017) are two most widely used indices for the monitoring, forecast and early warning of drought or drought impact over the world. When considering the difference between SPI and SPEI, precipitation is the only metrological parameter used to calculate the SPI, which can monitor both wet and dry conditions. However, potential evapotranspiration can also contribute to drought occurrence frequency, intensity, and severity (Sheffield and Wood, 2008b; Dai, 2011; Sheffield et al., 2012), this leads to the proposition of SPEI index, which can incorporate the effect of potential evapotranspiration on drought characteristics (Vicente-Serrano et al., 2010).
In the calculation of the SPEI, Potential evapotranspiration (PET) is a crucial factor (Vicente-Serrano et al., 2010; Yao et al., 2018), and it is suggested the calculated SPEI values are similar when using both simple Thornthwaite (Thornthwaite, 1948) and complex PET calculation methods (Mavromatis, 2007; Abatzoglou et al., 2014). For complex PET calculation, meteorological parameters such as maximum temperature, minimum temperature, surface pressure, wind speed, and relative humidity are needed to derive the PET (Allan et al., 1998). As found by van der Schrier et al. (2011), in the South Asian region, the Palmer drought severity index using PET from Penman-Monteith and Thornthwait methods depicted a robust correlation, which indicates that the calculated PET using both methods is highly close with each other. Meanwhile, as there are also lack of other meteorological variables except for rainfall and temperature in the MRB basin, the Thornthwaite method has been employed to derive PET for the SPEI calculation in this study.
For the Thornthwaite method (Yao et al., 2018), the monthly PET (mm) is dependent on the temperature and Sunshine duration, and is calculated as in Eq (1),
Where T is the monthly mean temperature (°C), N is the maximum number of sun hours, NDM is the number of days in the month, and I is heat index. The heat index is calculated as the sum of 12 monthly index values i: the latter being derived from mean monthly temperature using Eq. (2):
m is a coefficient which depends on I (Eq. 3):
The SPEI is calculated through the following steps: (a) calculating the PET using above-mentioned equations; (b) identifying the deficit or surplus accumulation of a climate-water balance by getting the difference between Precipitation (P) and potential evapotranspiration (PET) at different time scales; and (c) normalizing the water balance into a log-logistic probability distribution to obtain the SPEI series. A detailed description of the calculation of the SPEI can be referred to Vicente-Serrano et al. (2010). In addition, SPI is calculated based on the methodology by McKee et al. (1993).
The SPEI and SPI were calculated for each month of the year, with time scales of 1–12 months selected for analysis. In order to represent short-term, medium-term, and long-term droughts in wet intermediate and dry regions, SPEI at 3-month (SPEI-3), 6-month (SPEI-6), and 12-month (SPEI-12) timescales were selected. The 3, 6, and 12-month timescale is also used to calculate SPI-3, SPI-6, and SPI-12, respectively. As SWM season in South Asian region covers 4 months, i.e., June, July, August, and September, in order to consider the drought over this season, SPEI-4 at September (SPEI-4_Sep) is calculated, so rainfall and potential evapotranspiration from June to September can all be taken into consideration for deriving the SPEI-4_Sep. The NEM season in the South Asian region covers 3 months spanning from December to February in order to represent the drought over this season, SPEI-3 at February (SPEI-3_Feb) was calculated using the rainfall and evapotranspiration for December to February period.
Generally, the threshold value of “–1” for SPEI and SPI is used for drought identification as suggested by previous studies (Wu et al., 2017; Bae et al., 2018; Guo et al., 2018), and short-term drought is defined when SPEI-3 < –1.0, medium-term drought for SPEI-6 < –1.0, and long-term drought for SPEI-12 < –1.0 (e.g., Guo et al., 2018). Furthermore, the drought is classified into extreme, severe, and moderate drought based on the SPEI and SPI values. The drought classification is given in Table 1.
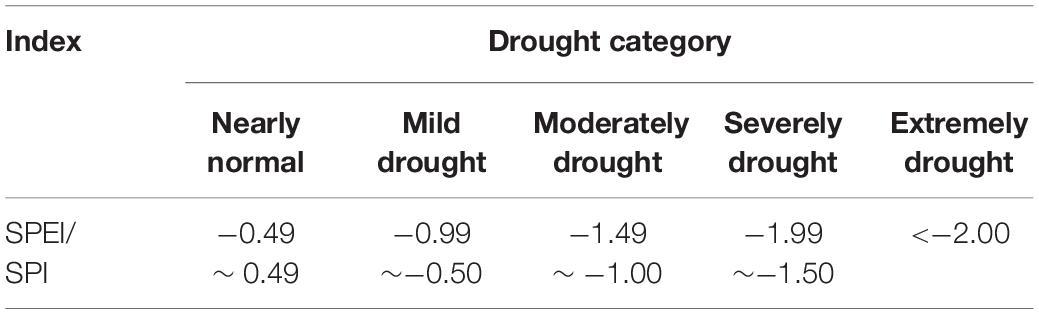
Table 1. Drought categories in terms of Standardized Precipitation Evapotranspiration Index (SPEI) and Standardized Precipitation Index (SPI) values.
Identification of Drought Characteristics Using Run Theory
There are several properties in terms of the drought characteristics, including drought severity, duration and frequency (Wetterhall et al., 2015; Hao et al., 2018), and run theory has been used to calculate the drought characteristics (Wu et al., 2017; Bae et al., 2018; Deng et al., 2018). The definition of a drought event and its characteristics can be schematically illustrated in Figure 2:
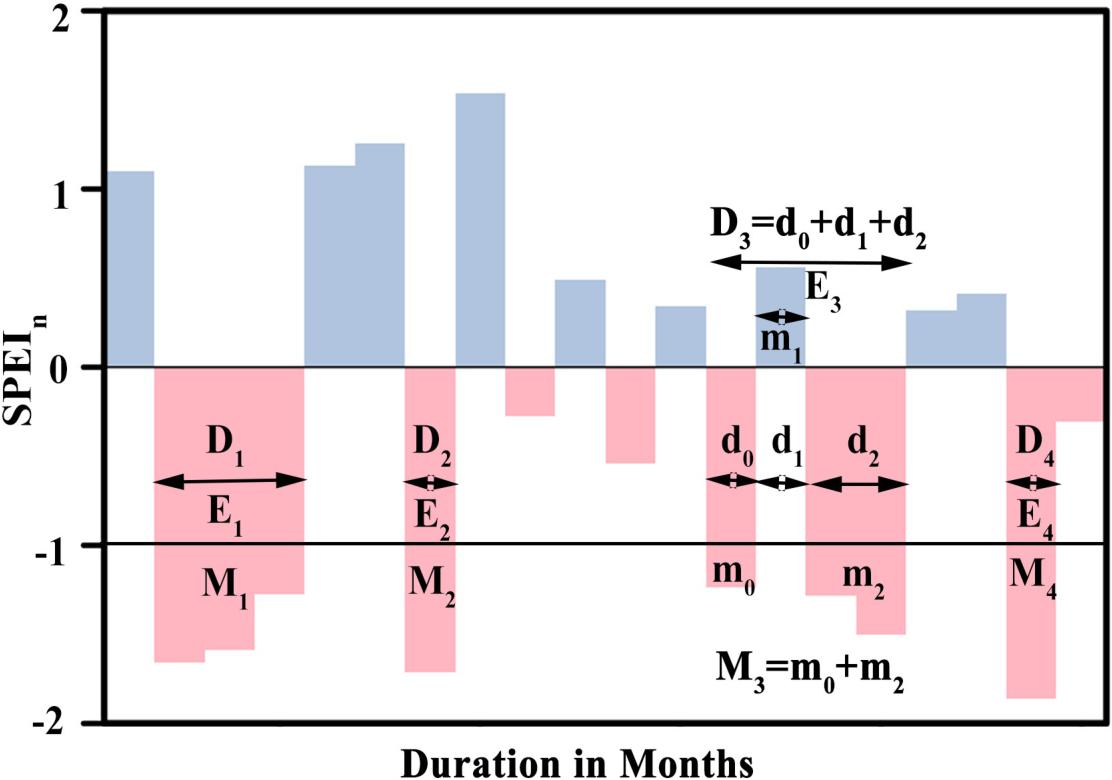
Figure 2. Schematic diagram for drought characteristics based on run theory. For the drought event E1, E2, E3, and E4, the relevant doughty duration (D) and severity (M) are D1, M1; D2, M2; D3, M3; and D4, M4, respectively. The black line represents the threshold limit (–1) for identifying the drought event. For drought event E3 with interruption period (d1) less than or equal to 2 months, the duration (severity) of subdivisions of the E3 is d0, d1, d2 (m0, m1, m2), respectively. Then duration of drought event E3 is obtained as: D3 = d0 + d1 + d2; Severity is obtained as: M3 = m0 + m2. This Figure is redrawn according to the Yevjevich et al. (1967).
(a) If the SPEI values are below –1 for at least 1 month, or more than two consecutive months, they are all considered as a single drought event. For example, E1 is one drought event with SPEI < –1 for several consecutive months; However, E2 and E4 are also one drought, but with SPEI < –1 for 1 month.
(b) If the interruption period (–1 < SPEI < 1) between the two drought events (SPEI < –1) lasts less than or equal to 2 months, these two events are considered as one single drought event. For example, E3 is one drought event with a combination of two drought episodes, but the intermittent period of two drought episodes is only 1 month.
Drought duration (D, unit: month) is defined as the period for one specific drought event when SPEI is continuously below –1 threshold level. The duration for drought event E1, E2, and E4 are D1, D2, and D4, respectively, as shown in Figure 2. If one drought event (E3 in Figure 2) consists of two drought episodes (d0 and d2) and one interruption period (d1), but with d1 less then or equal to 2 months, then the duration of drought event E3 is regarded as the summation of these periods, i.e., D3 = d0 + d1 + d2.
As shown in Eq. (4), drought severity (Me) is defined as the accumulation of SPEI value for a given drought event (SPEI < –1).
Where e is a drought event; j is month index; D and Me, are the duration and severity, respectively. For drought event with an intermittent period, for example, drought event E3, the severity (M3) is obtained as the summation of severity for two drought episodes d0 and d2, so M3 = m0 + m2.
Results
Comparison of Drought Characteristics Over MRB With SPEI and SPI Indies
In order to investigate the year to year variation of drought characteristics over the basin, the time evolutions of the drought index, i.e., SPEI or SPI, are presented for analysis and comparison. Taking medium-term drought as an example, the time series of SPEI-6 and SPI-6 with a time scale of 6-months, over three different regions in MRB during 1985–2015, are shown in Figure 3. Strong interannual variations of drought activities can be seen, both from SPI and SPEI time series. Generally, the time evolutions of SPEI are highly correlated with those of SPI in different regions; the correlation coefficient is about 0.98 between SPEI-6 and SPI-6 in the wet region, 0.96 for the dry region and 0.98 in the intermediate region. Most drought events in whole MRB, as reported by the Central Bank of Sri Lanka (Central Bank, 2015), are all well reproduced by both SPI-6 and SPEI-6 drought indices, such as drought events with a longer period, as it occurred during 1987, 1998, 2004, and 2012. For those drought events with the shorter periods, such as drought events that occurred at the beginning of 1992, 1996, and 2014, or the end of 1999, 2001, and 2003, they are also well reproduced in Figure 3. In some years, droughts are only witnessed in one to two regions of the MRB, for instance, droughts in 2008 only occurred in the wet region (Figure 3A), and drought episodes in 1991, 1993–1995, and 2009 occurred in only dry and intermediate regions (see Figures 3B,C). The spatial distribution of droughts events within the MRB can be ascribed to the fact that rainfall in sub-regions of MRB is influenced by different monsoon systems in different seasons of the year, with wet region influenced by southwest monsoon system and dry region mostly affected by the northeast monsoon system. Another feature we can find from Figure 3 is the decadal changes in drought activities, particularly in the wet region of MRB, where there are more severe drought events (SPEI < –1.0) after 2000.
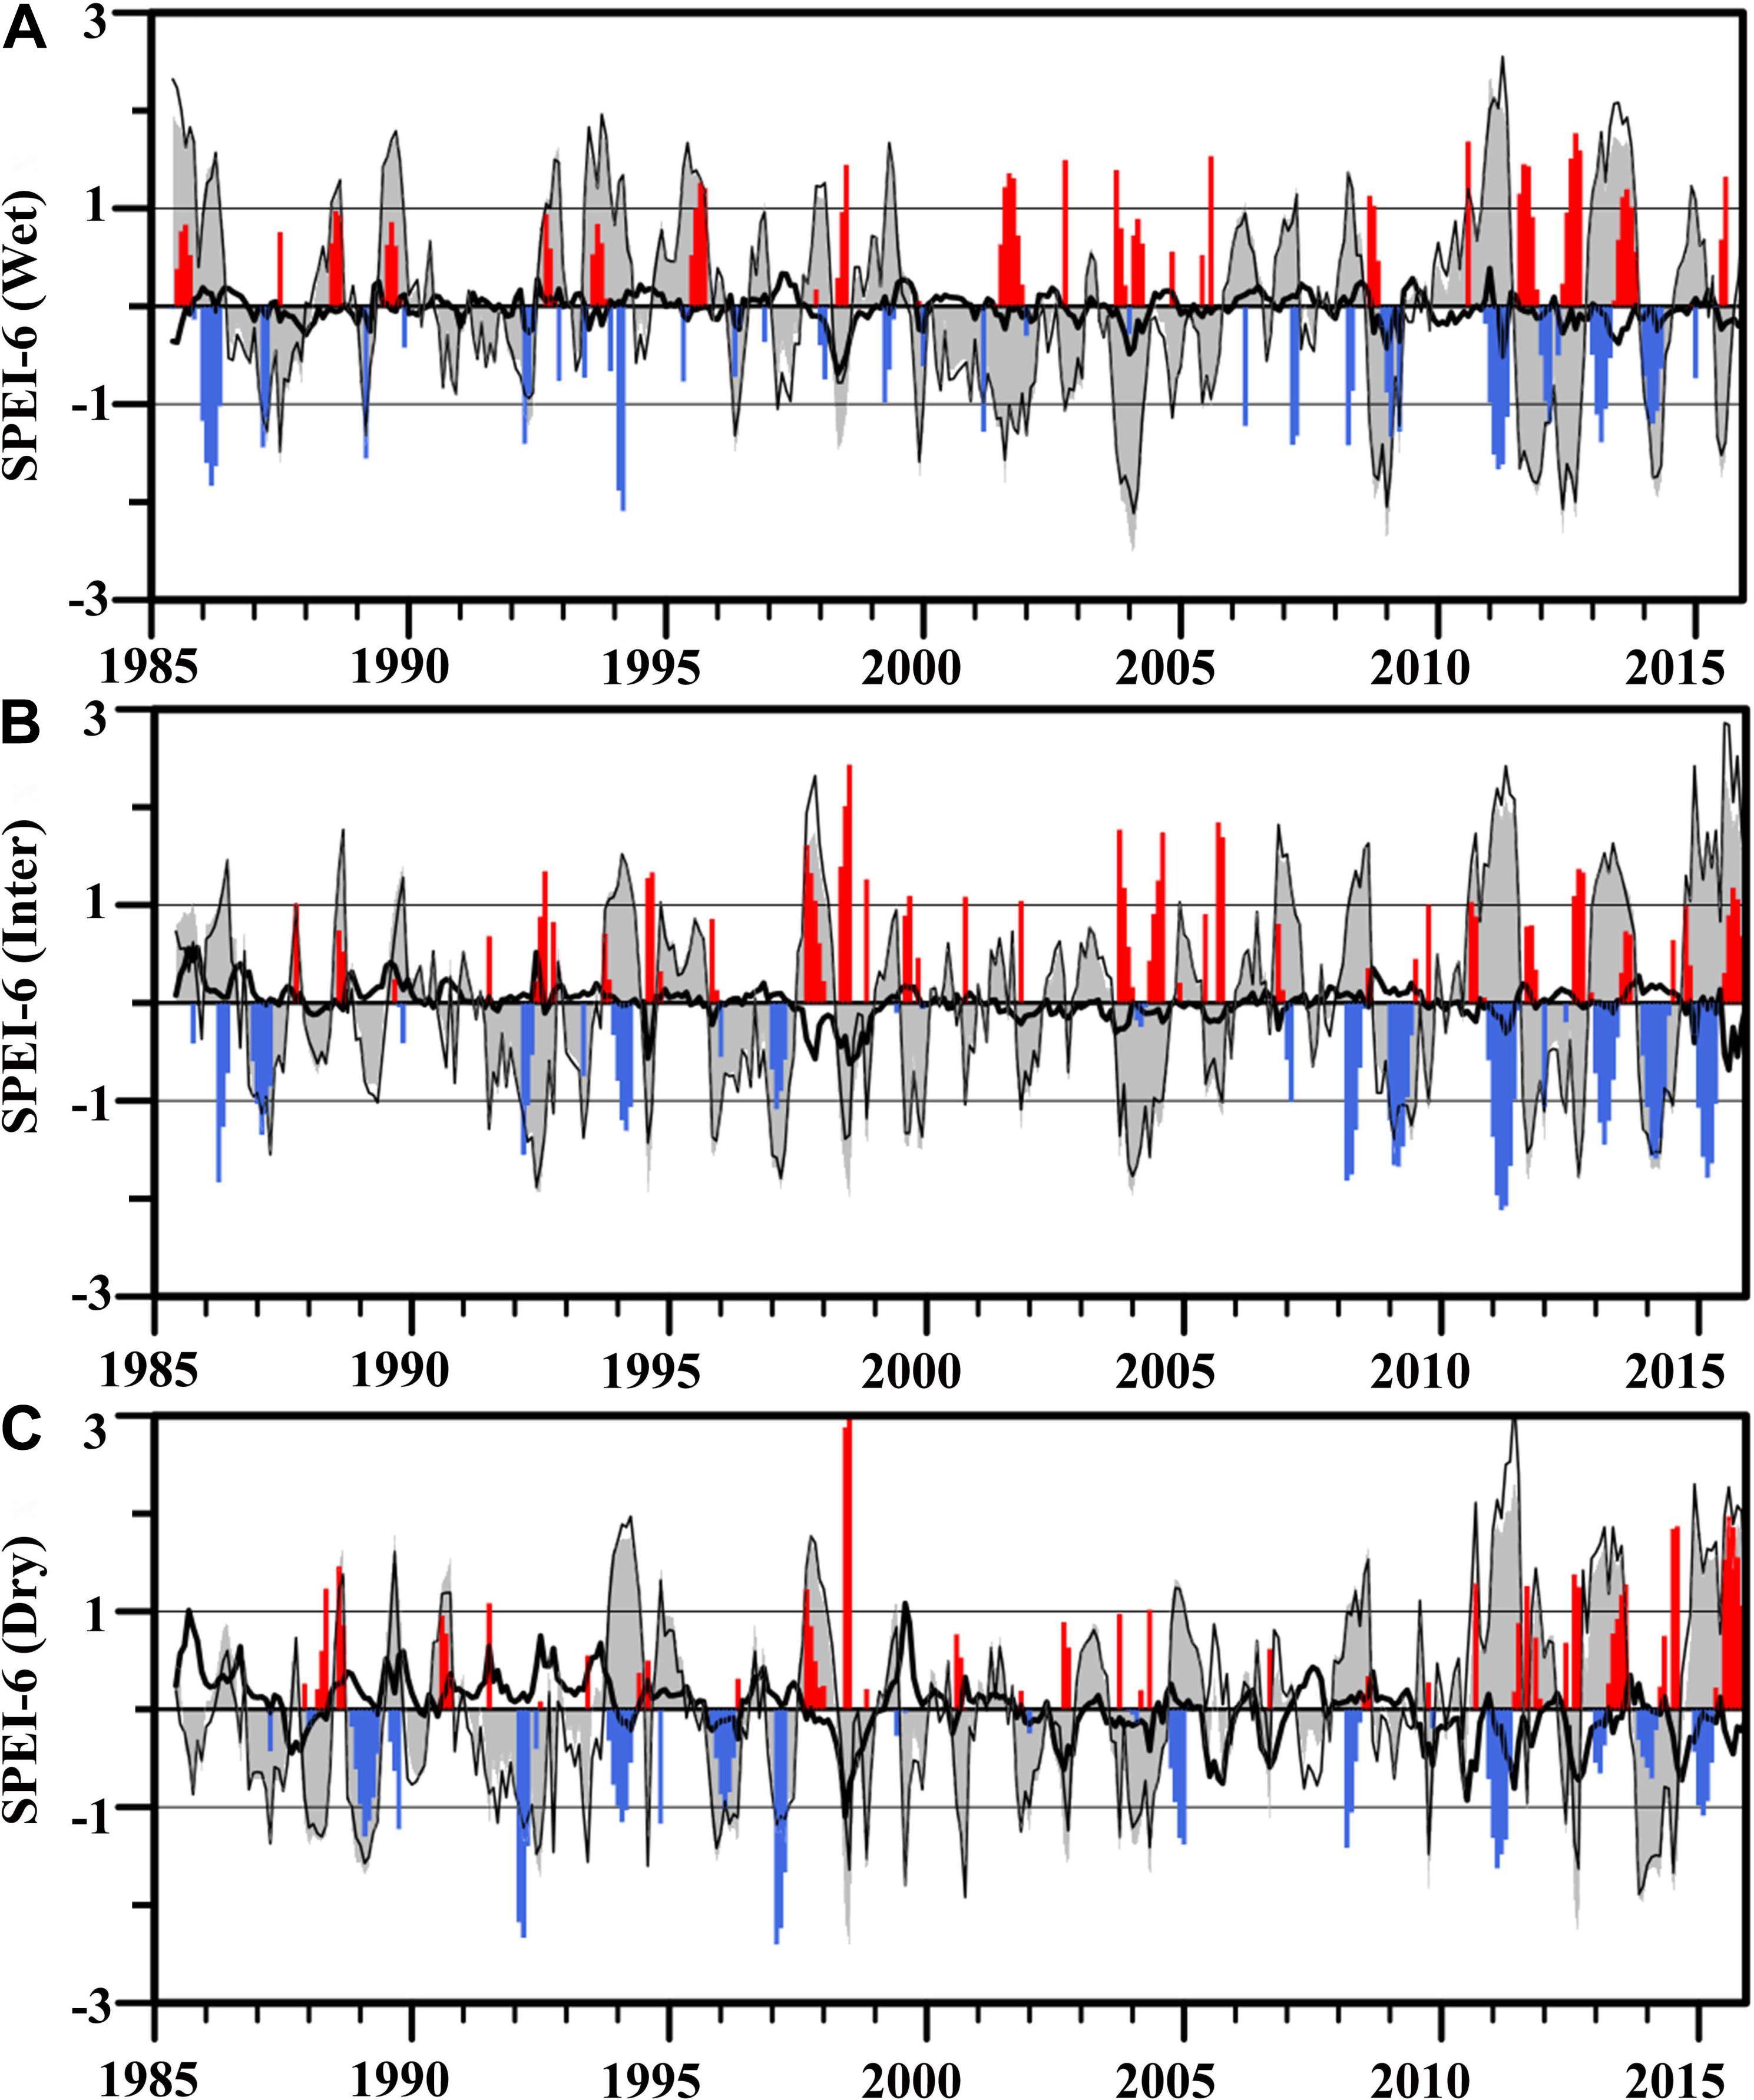
Figure 3. Time series of SPEI-6 (shaded) and SPI-6 (thin black line) for (A) wet, (B) intermediate, and (C) dry regions in Mahaweli river basin (MRB) from 1985 to 2015. The difference between the two indices (SPEI-6 minus SPI-6) is depicted by the thick black line. The drought event is defined when SPEI-6 or SPI-6 value is smaller than –1, and the wet event is defined when SPEI-6 or SPI-6 value is larger than 1. The positive and negative anomalies of cumulative 6-months temperature are displayed by red and blue bars, respectively. The letter Wet, Int, and Dry represent wet, intermediate, and dry regions in MRB, respectively.
The differences of drought characteristics using SPEI-6 and SPI-6 are also shown in Figure 3, we can find that the difference between SPEI and SPI is relatively small over intermediate and wet regions, but it is larger in the dry region. The difference between SPEI-6 and SPI-6 is between –0.7 and 0.4 in the wet region (Figure 3A), and the largest negative difference (–0.7) is observed in 1998, with SPEI-6 value for 1998 as –1.46 and –0.76 for SPI-6. As the most severe drought year in the wet region, the SPEI-6 for 2004 is –2.6, while it is –2.1 for SPI-6, the difference between SPEI and SPI is –0.5. The negative differences between SPEI and SPI suggest the drought intensity be underestimated by the SPI index as compared with the SPEI index. These underestimated differences by SPI index can be ascribed to the impact of evapotranspiration, as SPI index is only dependent on precipitation anomalies without consideration of evapotranspiration. Relatively larger positive temperature anomalies can be found in Figure 3 during this said period could be one of the reasons for this drought index underestimation, as the higher temperature is favorable for strong evapotranspiration.
In the intermediate region (Figure 3B), the difference between SPEI-6 and SPI-6 is found between –0.7 and 0.6, with the largest negative difference (–0.7) observed in 1998 when the severe drought occurred in the intermediate region, SPEI-6 for 1998 is –1.99, but the SPI-6 value is –1.3. In the dry zone, the difference between SPEI-6 and SPI-6 is comparatively larger. The largest negative difference can be found in the year 1998, with the magnitude of –0.9 between SPEI-6 (–2.16) and SPI-6 (–1.07). The observed large negative difference could be explained by large evapotranspiration due to the positive temperature anomaly (2.87°C) in 1998 (Figure 3C).
As shown in Figure 3, we can also find that there are more years with the negative difference between SPEI and SPI after 2000 for wet and dry regions; this could be explained by the increasing temperature trend over the regions, as the higher temperatures can enhance the potential evaporation significantly. This result is consistent with that over other parts of the world (e.g., Potop et al., 2012; Vicente-Serrano et al., 2014).
Similar to the temporal correlation between SPEI-6 and SPI-6, a strong correlation between SPEI-3 and SPI-3 (i.e., short-term drought) for all three regions in MRB are observed, the correlation coefficient for the wet, intermediate, and dry regions is 0.99, 0.98, and 0.95, respectively. The same is true for long-term droughts in terms of SPEI-12 and SPI-12.
For both SPEI-3 and SPI-3, it’s found that the short-term droughts occurred more frequently in the dry and intermediate region than in the wet region during the 1985–2015 period, and droughts (SPEI-3 < –1) in the wet region occurred with a large magnitude and a long duration since 2000. In contrast, dry region experiences short-term drought with a large magnitude for the 1985–2000 period. Furthermore, the difference between SPEI-3 and SPI-3 over the dry region depicts large differences compared to the other two regions. The same is true for the difference between SPEI-12 and SPI-12. For instance, the largest difference (–0.99) is observed in 2014, with SPEI-3 value for 2014 is –1.23 and –0.24 for SPI-3.
Decadal Variation of Frequency and Number of Drought Events in MRB
As SPEI index can take into account the evapotranspiration effect, it is adopted for the analysis of drought characteristics in this study. Figure 4 shows the temporal variation of SPEI in MRB at all months (January–December) during 1985–2015, with a timescale from 1 to 12 months. The number of short-term (SPEI-3 < –1), medium-term (SPEI-6 < –1.0), and long-term (SPEI-12 < –1.0) drought events are also shown in Table 2. From Figure 4, we can find that variations of drought occurrence frequencies differ significantly with time scales (from short-term to long-term drought), regions (from wet to dry region of MRB), and the different periods during 1985–2015. For example, the period of 2000–2005 is the dry period for all regions in MRB, and the period of 2010–2015 is characterized by the strong interannual variability of drought/flood events with intensifying amplitudes.
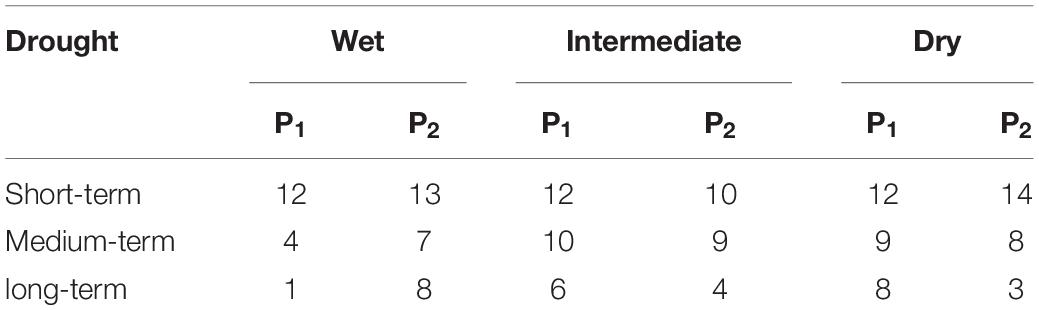
Table 2. The number of the short-term (SPEI-3 < –1), medium-term (SPEI-6 < –1), and long-term (SPEI-12 < –1) droughts event over the wet, intermediate, and dry region of MRB for early period (P1;1985–1999) and late period (P2; 2000–2015).
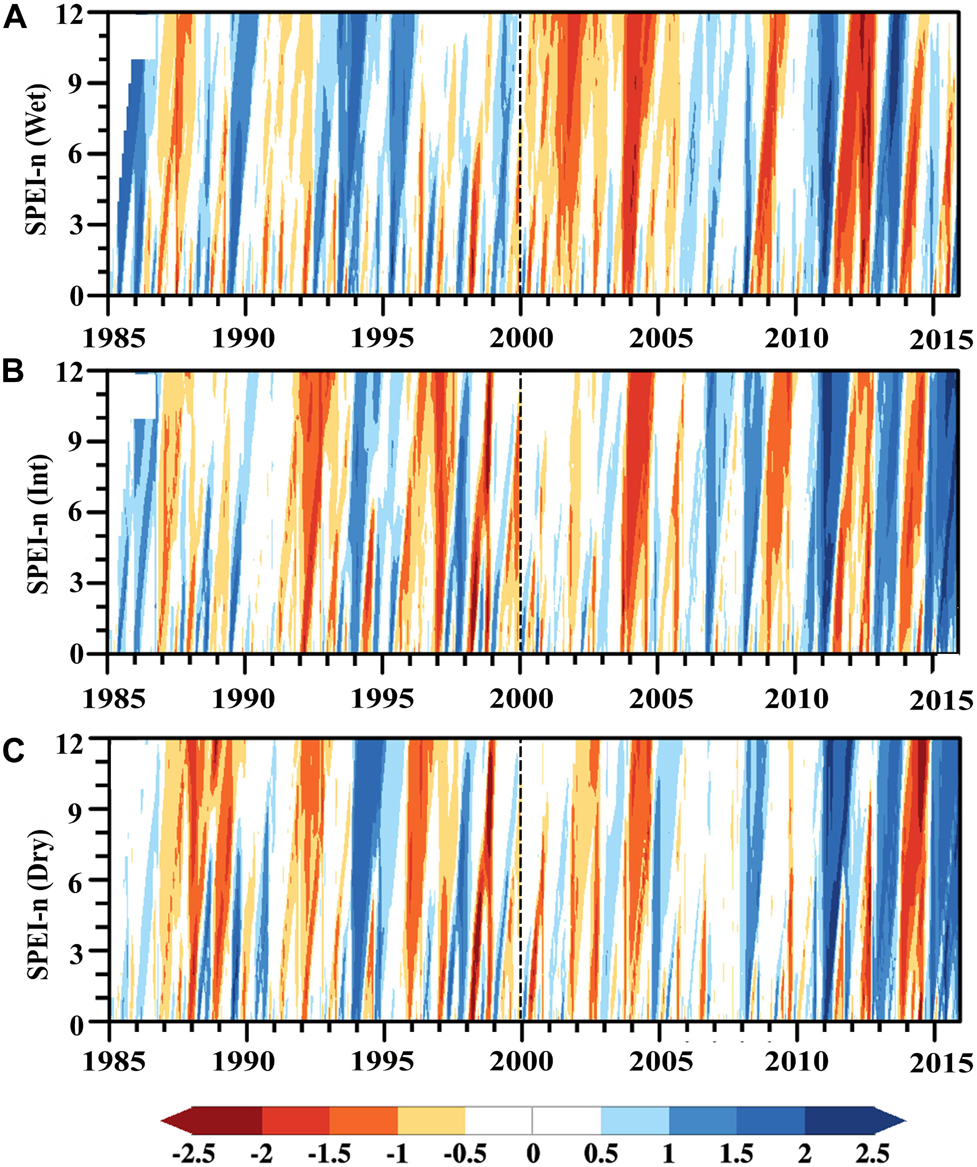
Figure 4. Hovmoller-type diagram for the temporal variation of the SPEI at different timescales (from 1 to 12 months) for (A) wet (B) intermediate, and (C) dry regions in Mahaweli river basin (MRB) from 1985 to 2015. The black dash line separates early (P1;1985–1999) and late (P2;2000–2015) periods. The letter Wet, Int, and Dry represent wet, intermediate, and dry regions in MRB, respectively.
For the wet region (Figure 4A), we can find that more prolonged droughts occur after 2000, as recorded in 2001, 2004–2005, 2009, 2012, and 2014, but before 2000, prolonged drought was only found in 1987. The total number of long-term drought events is 8 during 2000–2015 (Period P2), but only one event during 1985–1999 (Period P1). For medium-term drought events, the frequency is also higher between 2000 and 2015 compared with that during 1985–1999, with the total number of 7 medium-term drought events during 2000–2015, but only 4 during 1985–1999. However, for droughts with a shorter time scale, in terms of SPEI-3, no remarkable difference can be found before and after 2000 (Table 2). Meanwhile, there are more extended wet events before 2000 in the wet region, but the number of wet events decreases after 2000, with only two extreme wet events found in 2011 and 2013 with strengthened amplitude.
As shown in Figure 4B, the intermediate region records more drought conditions during 1990–2005 except for 1994 and 1997, with prolonged droughts found in 1993, 1996, 1998, and 2004. The period of 2000–2005 is characterized by more dry episodes, and wet events are dominant after 2005. Meanwhile, significant year-to-year variation between drought and wet episodes can be found after 2010, which can also be observed for wet and dry regions. For the comparison of the number of drought events between P1 and P2, it is found that there is no significant decadal difference, although drought event numbers in P1 are a little more than that in P2 for all time scales.
In the dry region of MRB, the interannual variation is the dominant feature for short-term and medium-term drought events. Eight medium-term drought events can be found in the P2 period, and the number is 9 for the P1 period. As for short-term drought, the number of drought events is 14 in the P2 period and 12 in the P1 period. These suggest that there is no significant decadal change of the occurrence frequency of short and medium-term drought during 1985–2015. However, in terms of long-term drought events, it occurs more frequently during 1985–1999, compared with that in 2000–2015, as shown in Figure 4C, with long-term drought events number of 8 in the P1 period, but only 3 drought events in P2 period.
To further investigate the decadal changes of drought occurrence for different time scales, we calculate the accumulative probability distributions of SPEI-3, SPEI-6, and SPEI-12 for all three sub-regions of MRB, as shown in Figure 5. SPEI value of –1 is selected as the threshold level for identifying drought events. The remarkable difference of accumulative drought frequency (Hereafter “ADF”) for P1 (1985–1999) and P2 (2000–2015) period can be found for the wet region, with a larger difference for longer time scale drought. For long-term drought (SPEI-12 < –1.0), the ADF is 27.8% during the P2 period, but it is only 4.4% for the P1 period, with more than a 6-fold increase from P1 to P2 period. For medium-term drought (SPEI-6 < –1.0), the ADF increases from 5.6% in the P1 period to 26.7% in the P2 period, with an about 5-fold increase in the later period. However, for short-term drought (SPEI-3 < –1.0), it only increases from 13.9% in P1 to 22.8% in P2 period, the magnitude of the increase is much smaller than that for medium and long-term drought (Figures 5A,D,G).
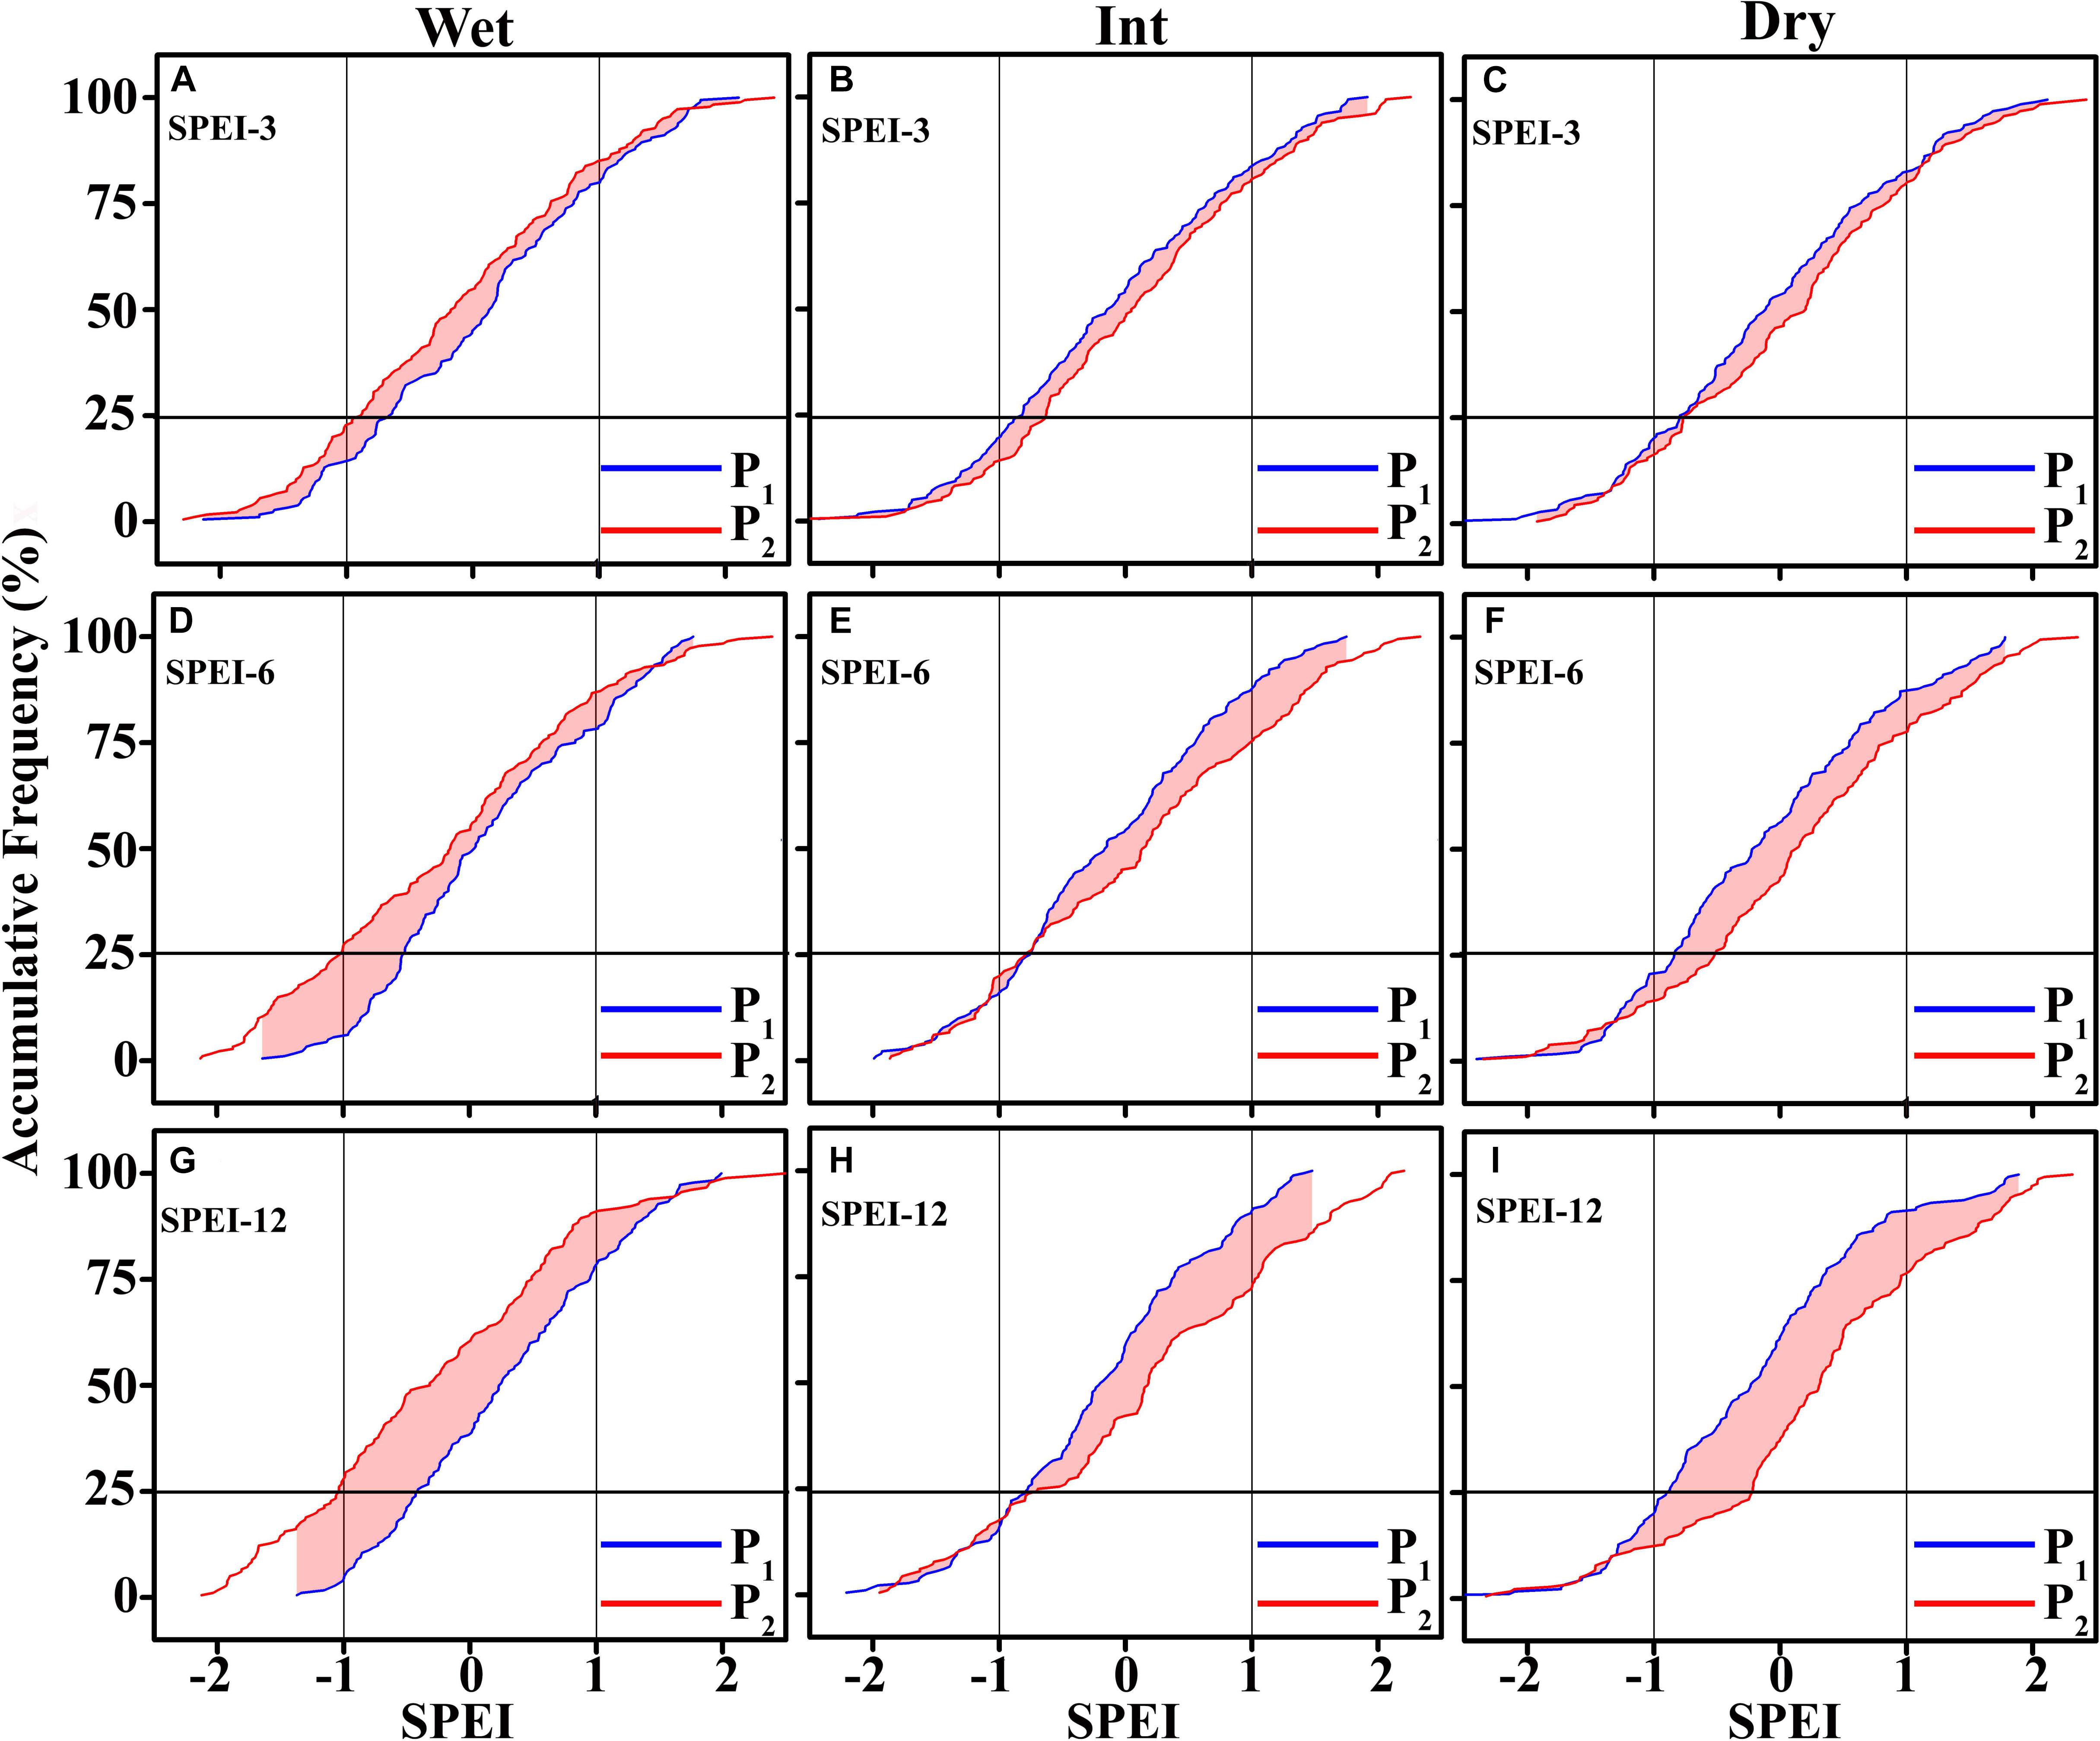
Figure 5. Accumulative frequency distributions of short-term drought (SPEI-3 < –1) for (A) wet, (B) intermediate, and (C) dry regions in Mahaweli river basin (MRB) during early (P1;1985–1999; Blue line) and late (P2; 2000–2015; Red line). The middle (D–F) and lower (G–I) panels are the same as top panels but for the medium-term (SPEI-6 < –1), and long-term (SPEI-12 < –1) droughts, respectively. The value below –1 (above + 1) is selected as the threshold level for the drought (wet) event.
For the intermediate region, the ADF is unchanged for medium and long-term drought between P1 and P2 period, and only a slight decrease of short-term drought (SPEI-3 < –1.0) frequency is found with ADF of 19% in period P1, and 14% in P2 period (Figures 5B,E,H). For the dry region, the ADF for short-term drought is very close between P1 and P2 periods, but we can see the slight decrease of long-term drought ADF from 20% in the P1 period to 12% in P2 period (Figures 5C,F,I).
Based on the accumulative probability distribution of wet events, which is defined when SPEI value is larger than 1.0, we can find that there is a remarkable decrease of occurrence frequency of wet episodes (SPEI > 1.0) from 21.7% in P1 to 8.9% in P2 in terms of SPEI-12 in the wet region of MRB, a decrease of frequency for SPEI-6 and SPEI-3 can also be found, but with much smaller magnitude. However, a large increase in the occurrence frequency of long-term wet-episode can be witnessed for intermediate and dry regions, with the probability of SPEI > 1.0 increased from 8.9% (8%) to 27.8% (23.3%) in the intermediate (dry) region. In general, the wet region experiences more drought events in the late period (2000–2015) compare to the early period (1985–1999), but on the contrary, dry, and intermediate regions witness more wet events in the later period.
Variations of Drought Duration and Severity in MRB
Besides the drought number events and occurrence frequency, drought duration (D), and severity (M) are another two important indices for understanding drought characteristics. The total drought durations for different time scales are shown in Figure 6 for P1 and P2 periods, and Table 3 also gives the duration and severity of short-term, medium-term, and long-term droughts events over MRB for P1, P2 period, and the entire study period, respectively.
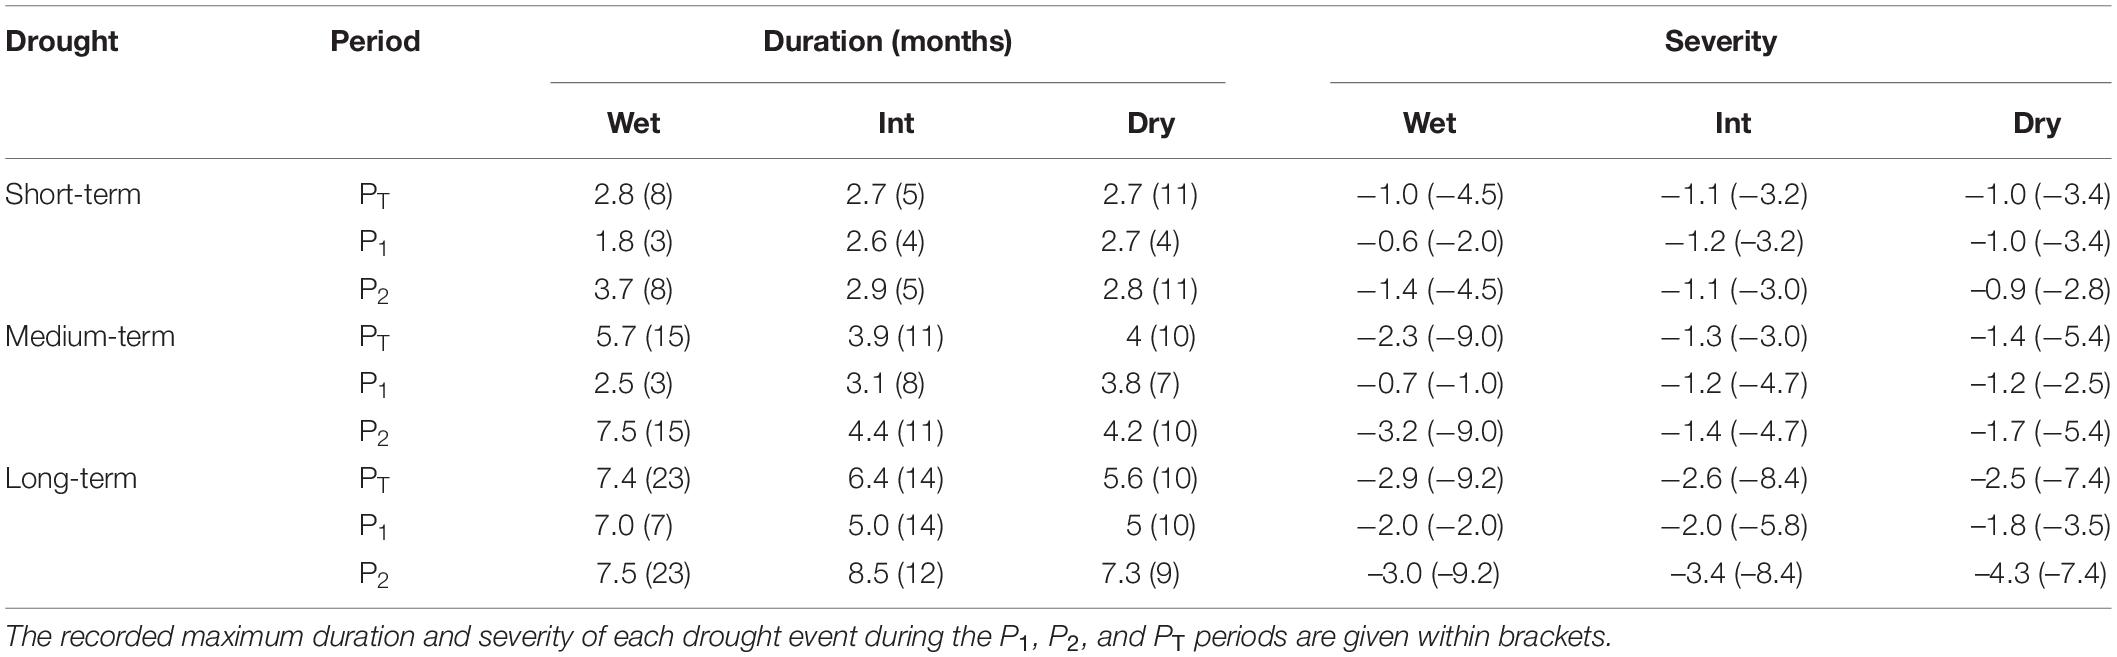
Table 3. The average drought duration (months) and severity of short-term (SPEI-3 < −1), medium-term (SPEI-6 < −1), and long-term (SPEI-12 < −1) droughts events over the wet, intermediate, and dry region in MRB for the early (P1; 1985–1999), late (P2; 2000–2015), and whole study (PT; 1985–2015) periods.
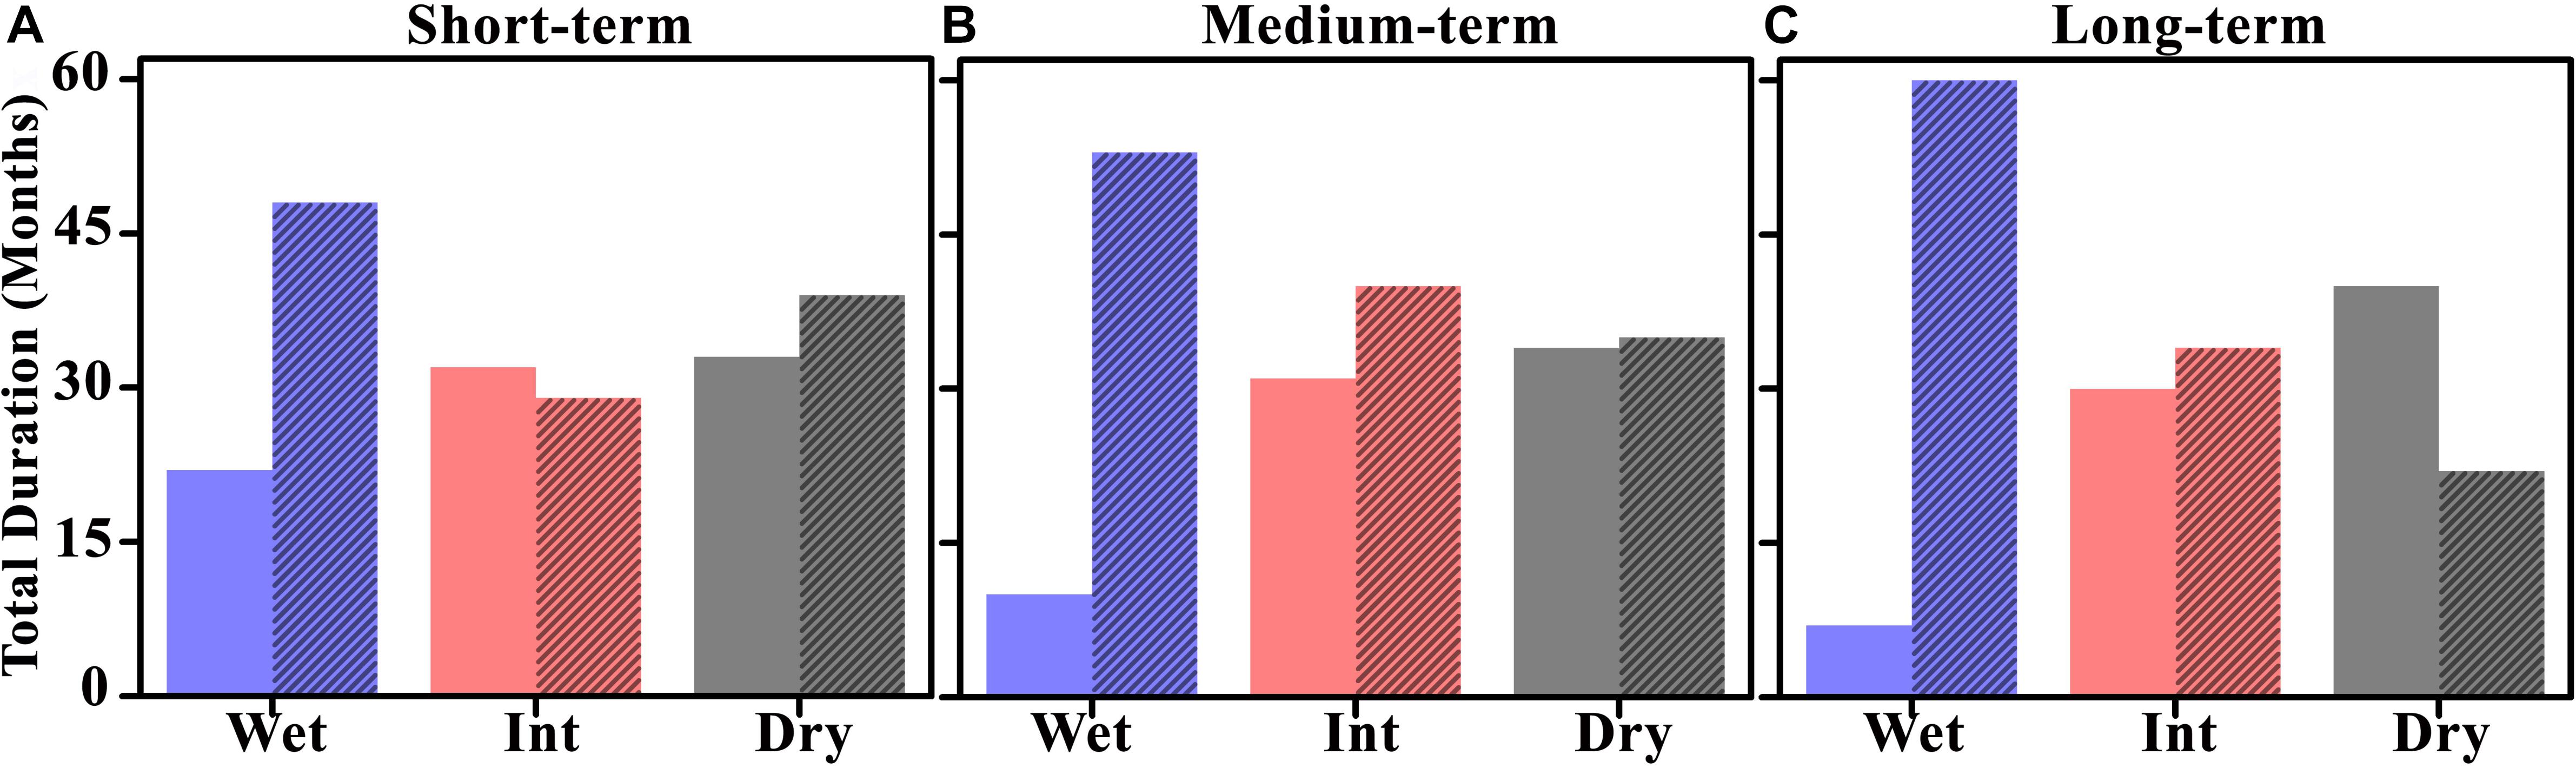
Figure 6. Total duration (Unit: Months) of (A) short-term (SPEI-3 < –1), (B) medium-term (SPEI-6 < –1), and (C) long-term (SPEI-12 < –1) droughts events over the wet, intermediate and dry region in Mahaweli river basin (MRB) for early (P1; 1985–1999) and late (P2; 2000–2015) periods. The normal bars represent the early period, while black hatched bars for the late period. The letter Wet, Int, and Dry represent wet, intermediate, and dry regions in MRB, respectively.
In the wet region, the difference of total drought duration between P1 and P2 periods is very large for each drought category (Figure 6A). For long-term drought, the number of months of SPEI-12 < –1.0 is only 7 months during the 1985–1999 period but increases to 60 months during 2000–2015, which is 8-folds longer than that in P1. The much longer duration of long-term drought can be largely explained by the increased number of drought events in the P2, as the average duration in the P2 period is about 7.5 months, and only half months longer than that in P1 period (Table 3). However, the maximum duration of each event can reach 23 months in the P2 period; this is much longer than 7 months in the P1 period. For the maximum severity of each drought event, it can reach –9.2 in the P2 period, but the maximum value is –2.0 for the P1 period.
For medium-term drought, the duration is 53 months in the P2 period, but only 10 months in the P1 period. The longer total duration in the P2 period could be mainly attributed to the increase of averaged drought duration from 2.5 months in P1 to 7.5 months in P2, as the drought event number in P2 is only 1.75 times than that in P1. Meanwhile, drought severity is significantly enhanced in the P2 period compared with the P1 period, with the average severity increased from –0.7 to –3.2, and maximum severity increased from –1.0 to –9.0. All 4 medium-term droughts are ranked moderate (–1.5 < SPEI-6 < –1.0) in P1, but there are 5 severe droughts (–2 < SPEI-6 < –1.5) out of the 7 drought events in P2 period.
For short-term drought, the total duration in P2 is about twice as that in the P1 period, with 48 months during 2000–2015 and 22 months during 1985–1999. From Table 3, we can find that the average duration of short-term drought is 3.7 months in P2, and 1.8 months in P1 period, so the decadal difference in total duration is mainly because of the increased average duration, as the number of drought events is almost the same in P1 and P2 period. The longer averaged duration also leads to the enhanced average severity, which increases from –0.6 in P1 to –1.4 in the P2 period. The intensified maximum severity can also be observed from –2.0 in P1 to –4.5 in P2. Generally, the long-term and medium-term drought are all getting more frequent, long-standing, and severer in the wet region during 2000–2015, compared with that in 1985–1999, but the short-term drought is only getting longer and severer, which invigorates longer total drought duration during 2000–2015.
For the intermediate region, the total duration of all drought categories is quite close between P1 and P2 periods, with a difference of less than 30% (Figure 6B). Even the numbers of medium and long-term drought events are more in P1 than that in P2; the total duration of medium and long-term droughts are relatively less in P1 than in P2. This is because of the longer average duration of medium and long-term droughts in the P2 period. For example, the average duration of long-term drought is 8.5 months in P2, but it is only 5 months in the P1 period, as can be found in Table 3. The average and maximum accumulative severity are also relatively higher in the P2 period, with average accumulative severity of –3.4 in P2, but –2.0 in the P1 period.
In the dry region, the large difference of total drought duration can be found for long-term drought, with a total duration of 40 months during 1985–1999 and 22 months during the 2000–2015 period, as shown in Figure 6C. This can be explained by the decrease of long-term drought event numbers from 8 during 1985–1999 to only 3 during 2000–2015. As for short and medium-term drought, there is no significant difference in total drought duration between the P1 and P2 periods. However, for the drought severity, we can find that the averaged and maximum severity is all higher in P2 than P1 for both medium and long-term droughts, but they are quite close for short-term drought.
Decadal Variation of Drought in SWM and NEM Season
In general, the drought/flood variation in MRB is mainly moderated by SWM and NEM which are important components of the South Asian monsoon system, with rainfall anomalies in the wet region of MRB mainly influenced by the SWM, and dry region affected by NEM (e.g., Shelton and Lin, 2019). To understand whether decadal change signals in SWM and NEM seasons are associated with the decadal change of drought in wet and dry regions of the MRB, the temporal variations of drought characteristics in SWM and NEM seasons are here investigated.
Figure 7 shows the evolution of SPEI in SWM and NEM season, in terms of SPEI-4 in September (hereafter SPEI-4SWM) and SPEI-3 in February (hereafter SPEI-3NEM), in wet and dry regions during 1985–2015 period. We can find that, in the wet region of MRB, there are 10 out of 15 years with positive SPEI-4SWM value during 1985–1999, and negative SPEI-4SWM are found only in 1987, 1990, and 1999 respectively, this suggested that wet events dominate during southwest monsoon season in P1 period. From 2000 to 2015, we can find there are more dry years, with 11 out of 17 years showing negative SPEI-4SWM. A significant decadal shift from wet to dry situation in the wet region of MRB during the SWM season can be observed from the 9-year running mean of SPEI-4 value, as shown in Figure 7A. However, for the SPEI-3 during the NEM season (Figure 7C), the dominant feature of SPEI variation is interannual variation, no decadal change signal can be observed. This suggested that the observed decadal changes of drought characteristics in the wet region, as depicted in the first two result sections, could be largely explained by its decadal shift in the SWM season.
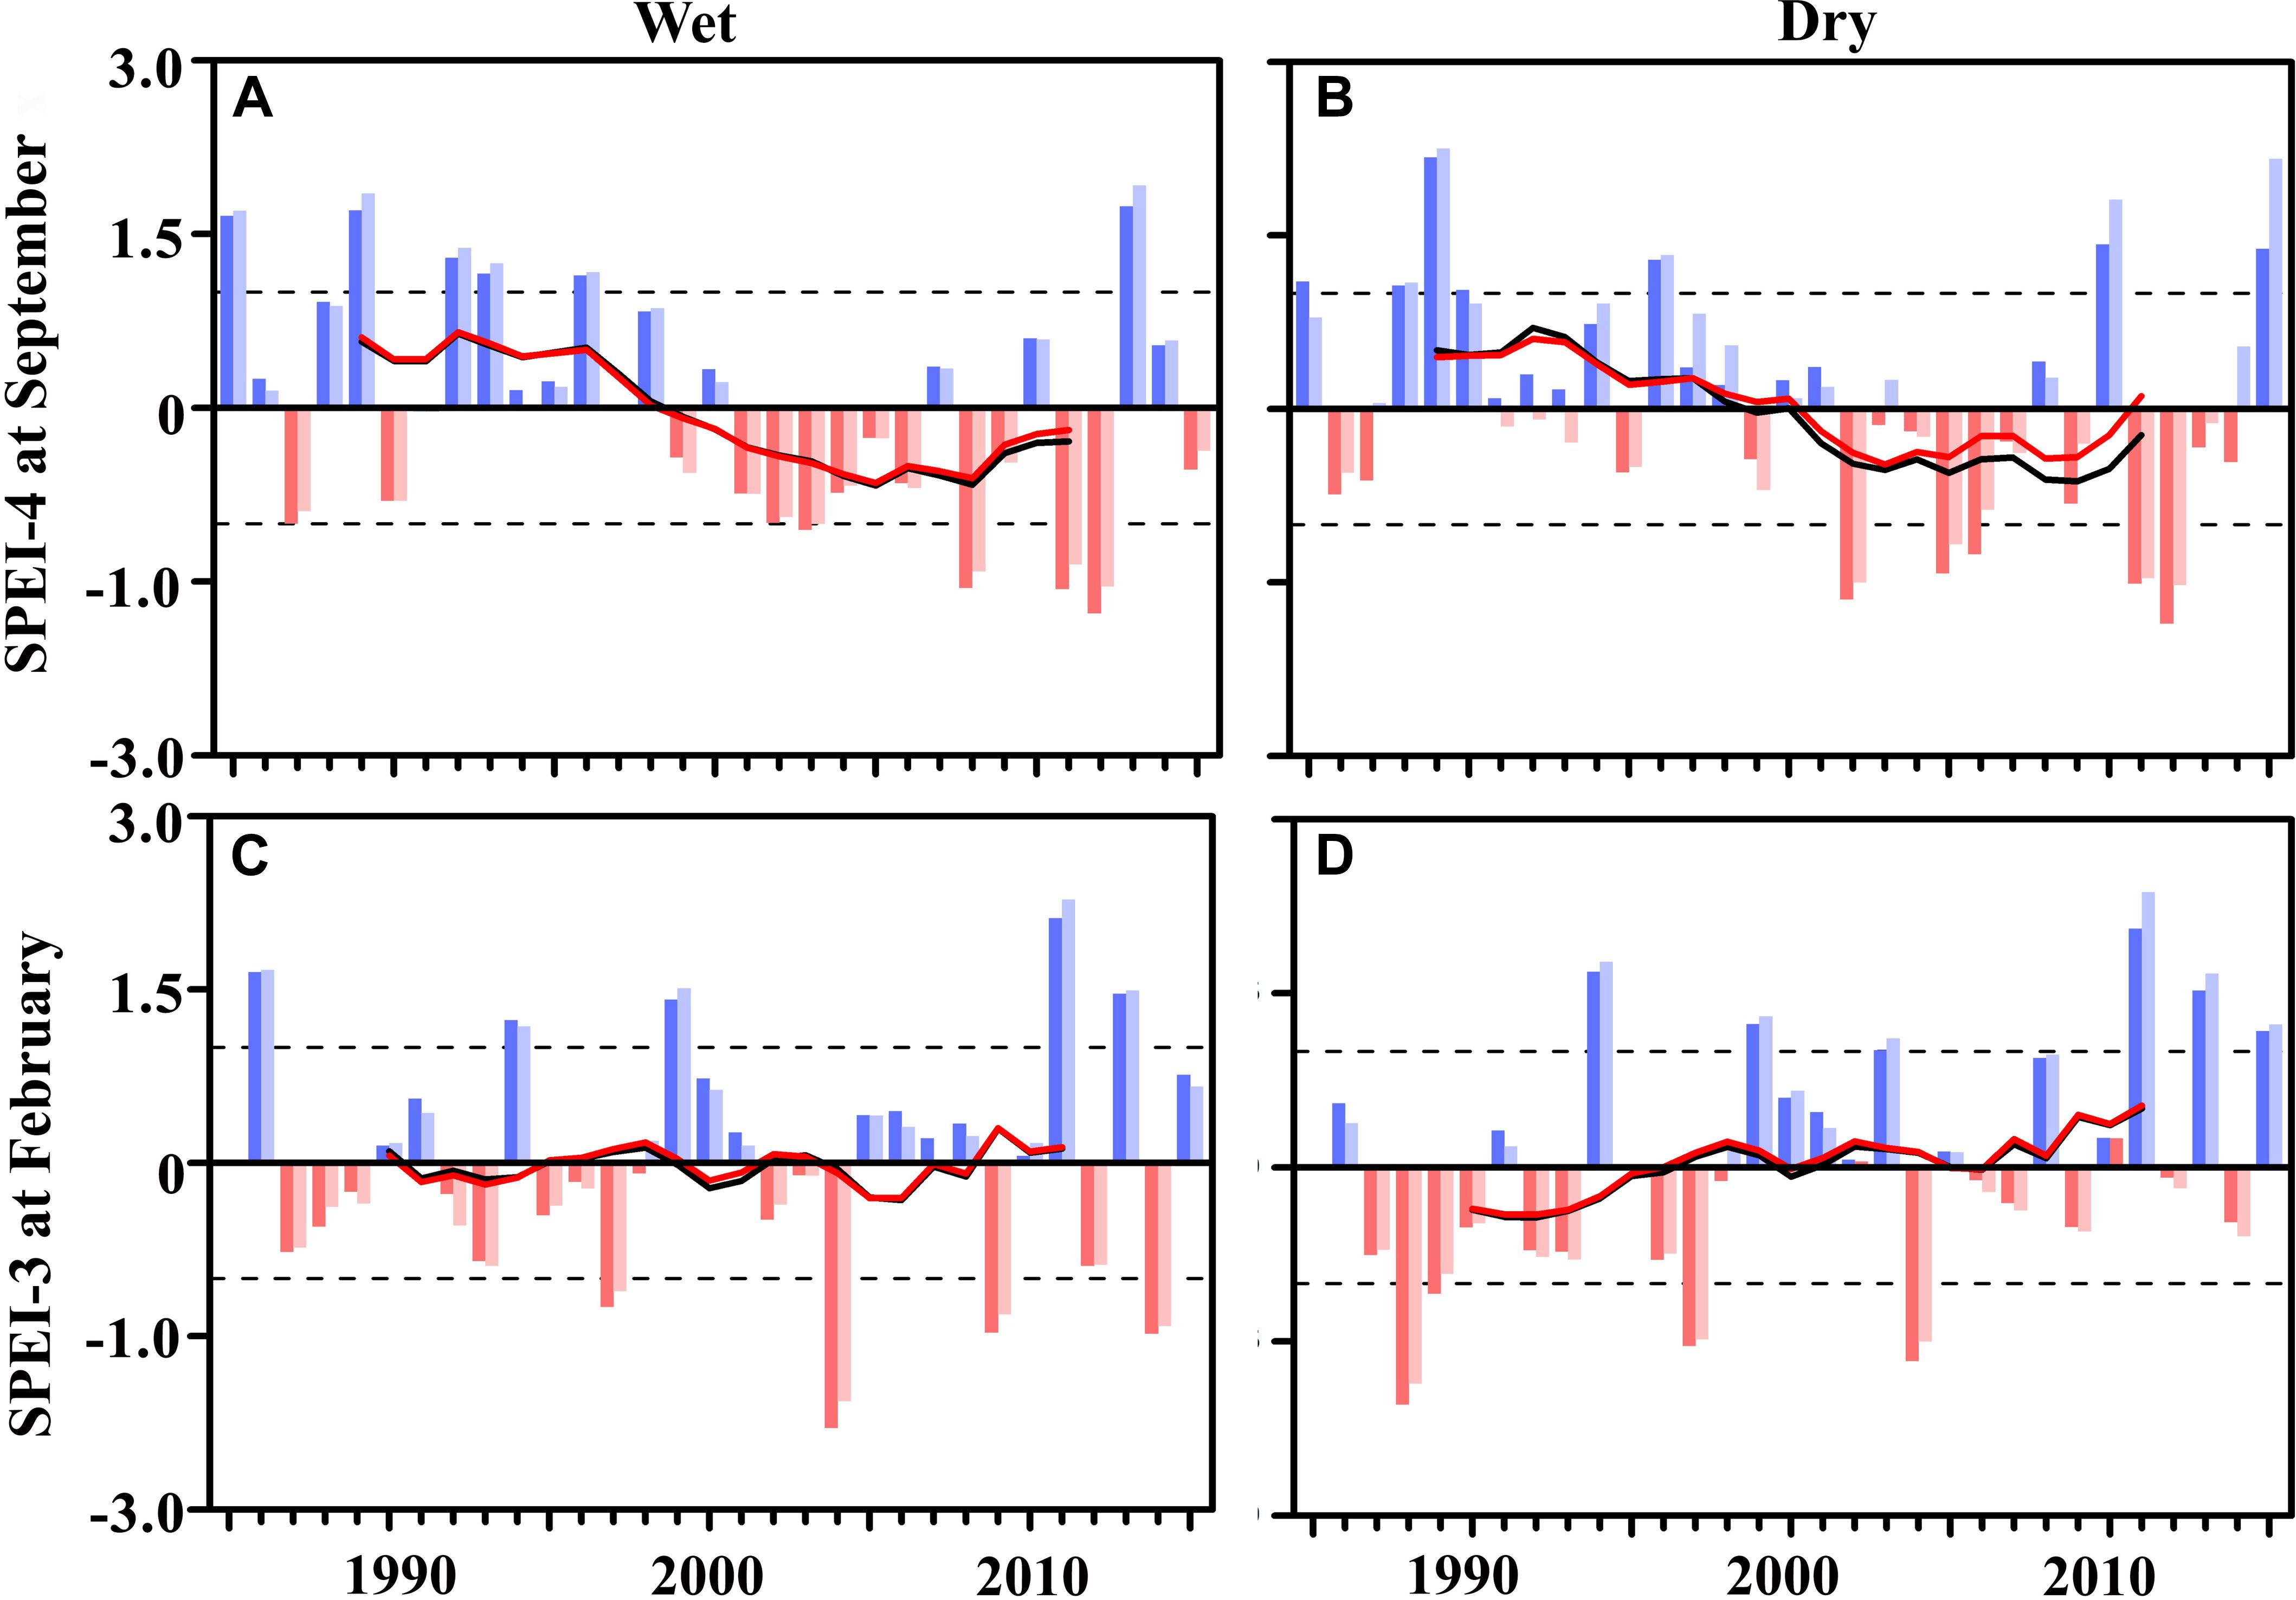
Figure 7. Time series of SPEI and SPI during the southwest monsoon season (SPEI-4/SPI-4 at September) for (A) the wet and (B) dry regions in Mahaweli river basin (MRB) from 1985 to 2015. The lower panels (C,D) are the same as top panels, but for the northeast monsoon season (SPEI-3/SPI-3 at February). The positive and negative SPEI (SPI) values are shown by blue (light blue) and pink (light pink) colored bars, respectively. The red (black) line indicates a 9-year running mean of the seasonal SPEI (SPI) time series.
For the dry region in MRB, the interdecadal change of SPEI-4SWM is similar to that in the wet region (Figure 7B), suggesting that it also turns to the dry situation during the SWM season in the later period of 1985–2015. As indicated in Shelton and Lin (2019), rainfall in the dry region is largely influenced by the northeast monsoon system, and the NEM season is the rainy season for the dry region of MRB. Figure 7D shows the variation of SPEI-3 in the NEM season, a weak interdecadal change of SPEI-3NEM from the dry situation in P1 to wet situation in P2 periods can be found. Based on the analysis results in first two result sections, it is noted that there is a weak increased occurrence frequency of long-term wet-episodes and decreased probability and duration of drought events after 2000, and this might suggest that SPEI variations in the NEM season, instead of the SWM season, dominate the interdecadal change of drought characteristics in the dry region after 2000.
For comparison, the rainfall based SPI drought index for the same season and regions is presented in Figure 7. In wet region of MRB, the 9-year running mean for SPEI and SPI time series match very well with each other for SWM season (SPEI-4_Sep) (Figure 7A) and NEM season (SPEI-3_Feb) (Figure 7C) during 1985–2015, both in phase of variation and magnitude of the index. For the year to year variation of SPEI and SPI, we can also find that SPEI and SPI are in the same sign for all study years. This suggests that drought in wet region of MRB can be totally explained by the rainfall deficit.
For the dry region of MRB, we can find in NEM season (Figure 7D), the 9-year running mean for SPEI and SPI time series match very well with each other, and SPEI and SPI are in the same sign for all study years. This suggests that the NEM season drought in the dry region of MRB can also be totally explained by the rainfall deficit. However, for the SWM season (Figure 7B), the difference between SPEI-4_Sep and SPI-4_Sep can be found, with SPEI and SPI value in the reverse sign for 5 years. However, for all SPEI drought years (SPEI < -1), the SPI values are all negative, suggesting that deficit of rainfall is still the controlling factor for SPEI-based drought.
Influence of Rainfall and Temperature Change on Interdecadal Difference of Droughts
It is well known that drought is mostly initiated by rainfall deficit or extreme low precipitation (e.g., Mo and Lettenmaier, 2016; Schubert et al., 2016). Therefore, in each drought year, the contribution of rainfall anomalies in different seasons may differ significantly. For example, Thomas and Prasannakumar (2016) observed that the decreasing rainfall during SWM in Kerala India contributes to short-term meteorological droughts, however, the increase of NEM rainfall aids the reduction of drought severity in the region. Meanwhile, in specific years, drought severity can also be affected by the anomaly of temperature or evapotranspiration (e.g., Livneh and Hoerling, 2016; Luo et al., 2017; Amrit et al., 2018).
To understand the possible reason why SPEI-3NEM exceeds SPEI-4SWM in its contribution to the interdecadal variation of drought characteristics in the dry region, while in the wet region SPEI-4SWM dominates the interdecadal variation, we present the temporal variation of total rainfall anomalies for SWM and NEM seasons in the wet and dry regions (Figures 8A–D). The relevant temperature anomalies during the two monsoon season for 1985–2015 periods are also shown in Figures 8E,F.
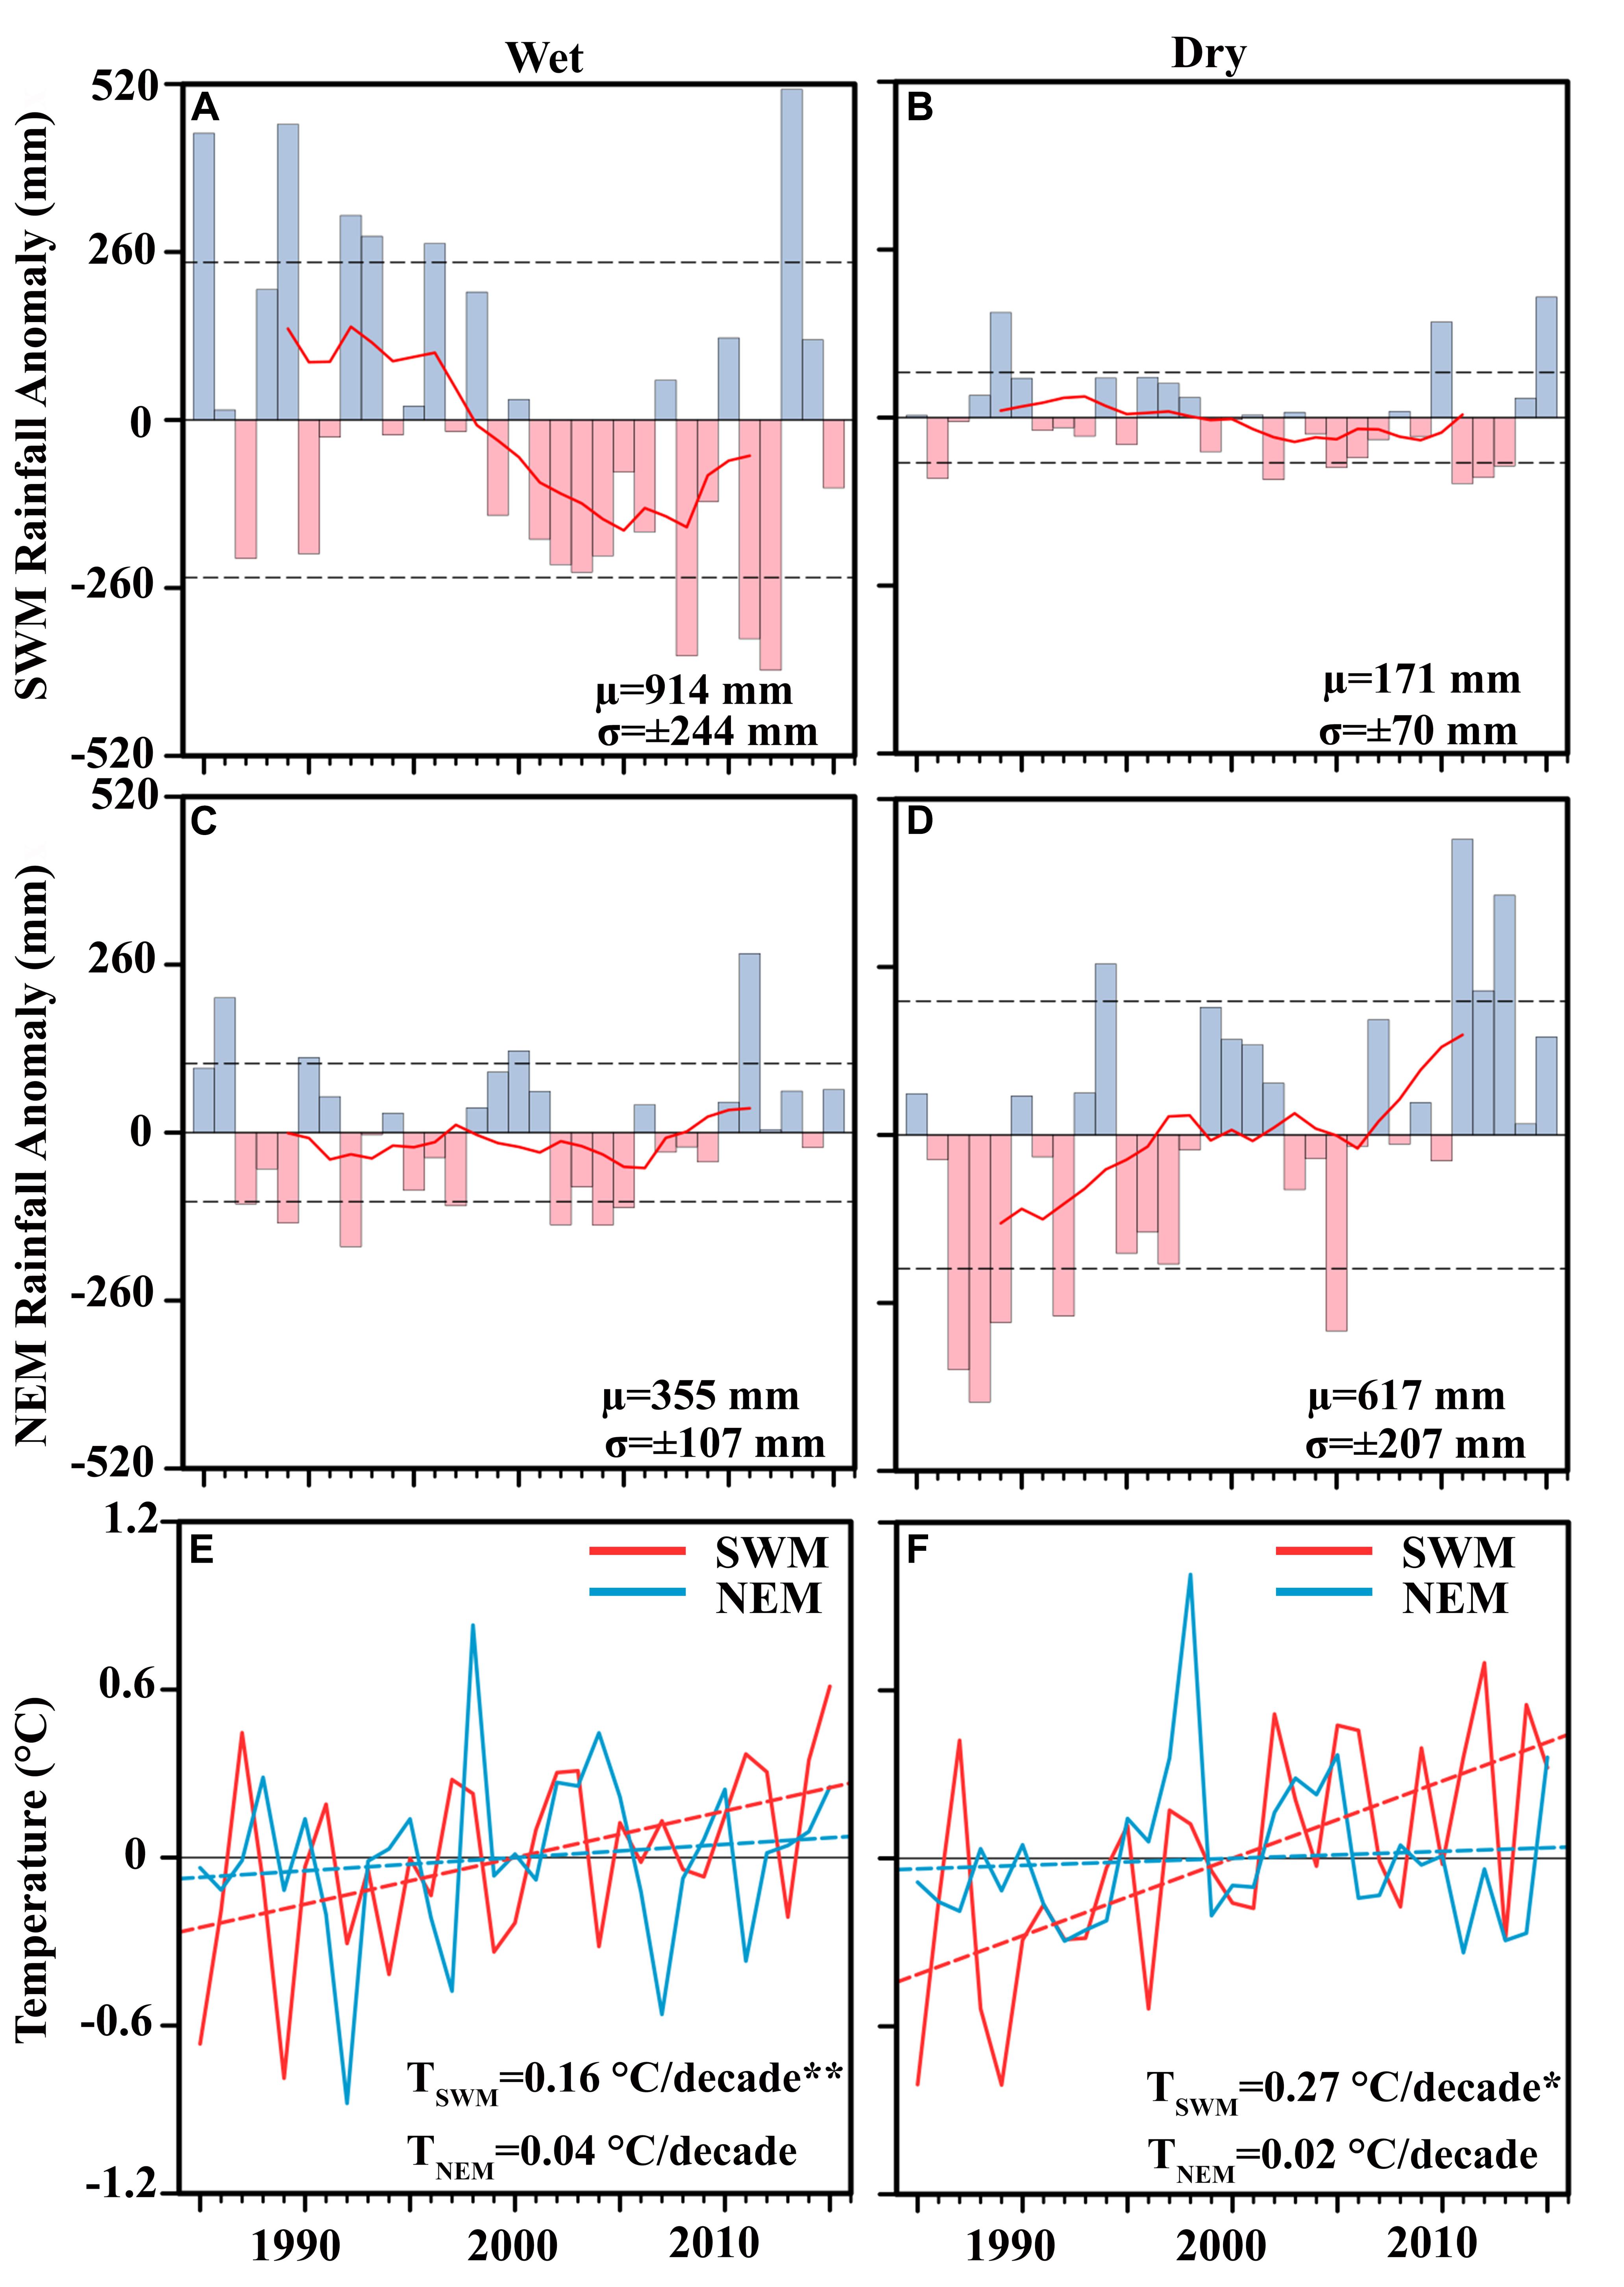
Figure 8. Temporal evolution of total rainfall anomalies (Unit: mm) during the southwest monsoon (SWM) season for (A) wet, and (B) dry regions in Mahaweli River Basin from the 1985 to 2015 period, the middle panel is same as a top panel but for the northeast monsoon (NEM) season for (C) wet, and (D) dry regions, and the red line indicates a 9-year running mean. The temperature anomaly in SWM and NEM seasons in the wet and dry region and their trends (TSWM, TNEM) are depicted in (E,F), respectively. **and *marks represent the statistically significant trend at 95 and 99% confidence level. The μ and σ represent the long-term mean and standard deviation of rainfall and temperature.
In Figure 8, we can find that the averaged seasonal total of rainfall amount in the wet region of MRB is 914 mm in the SWM season and 355 mm in the NEM season. Besides the much larger total rainfall amount in the SWM season, the rainfall variability is also stronger in the SWM season for the wet region, with a standard deviation of total rainfall being 244 mm as compared with 107 mm in NEM season. The remarkable interdecadal change of SWM rainfall is elucidated in Figure 8A, with more positive (negative) rainfall anomalies occurring before (after) 2000, this is consistent with previous findings of decadal weakening of South Asian monsoon and the resultant weakening of rainfall in SWM season (e.g., Guhathakurta et al., 2015). However, there is no interdecadal change signal can be found for the rainfall amount during the NEM season (Figure 8C). So the interdecadal change from wet to the drought situation in the wet region can be attributed to the phase change of SWM rainfall anomalies.
In contrast with the wet region, the main rainy season in the dry region is the NEM season, with the averaged seasonal rainfall total of 617 mm in this season, but it is only 171 mm during SWM season (Figure 8B). The rainfall variability is also much stronger in NEM when compared with that of the SWM season, with a standard deviation of total rainfall amount being 207 mm in NEM and 70 mm in the SWM season. So the seasonal rainfall variability in NEM is much stronger in the dry region than other seasons of the year, this is also true for the interdecadal changes of drought characteristics in the dry region. As shown in Figure 8D, negative (positive) NEM rainfall anomalies occurred in most years in the dry region before (after) 2000, this interdecadal shift from less rainfall in P1 to more rainfall in P2 is consistent with the observed interdecadal change of yearly drought features. Conversely, the interdecadal shift of rainfall anomalies is opposite during the SWM season, with negative (positive) rainfall anomalies occurred in most years after (before) 2000.
Nonetheless, an increase in temperatures can intensify evaporation, thereby increasing overall drought severity and its impact, especially in the agricultural sectors (Dai, 2012). Therefore, to understand whether the regional temperature change contributed to the above-mentioned decadal difference of drought characteristics, we illustrate in Figures 8E,F the temporal evolution of temperature anomalies during SWM and NEM seasons for the 1985–2015 period. The long-term temperature trend and its statistical significance have also been shown using Sen’s slope estimator and Non-parametric Mann-Kendall test (Sen, 1968).
Notably, Figures 8E,F show strong interannual variability of seasonal mean temperature, and there are no interdecadal changes that can be found. Meanwhile, a significant increasing trend of temperature can only be found in the SWM season, with 0.16°C/decade in the wet region, and 0.27°C/decade in the dry region, but the temperature trend during NEM season is almost negligible.
Considering the mechanism of temperature impact on drought development and evolution, the foregoing suggests that temperature variation in the NEM season does not significantly contribute to the interdecadal change of drought characteristics in both wet and dry regions of MRB. However, the increased temperature trend in SWM tends to enhance the drought characteristics after 2000, with a large contribution in the dry region than in the wet region. This can also partly explain why an interdecadal change of drought characteristics in the wet region is much more significant, compared with that in the dry region. In the wet region, both rainfall and temperature changes are consistently favorable for drier conditions after 2000. However, in a dry region, the contribution of decadal enhancement of rainfall amount in NEM season to the decadal increase of SPEI characteristics is opposite to that from increasing temperature trend and decadal weakening of rainfall amount in SWM season, so the interdecadal weakening of drought characteristics is relatively weak in the dry region.
Atmospheric Water Vapour Transport and Associated Circulation Difference
As pointed out by previous studies, there is a notable interdecadal change of South Asian monsoon around 2000, which is linked to the decadal oscillation of sea surface temperature (SST) in different ocean basins (e.g., Krishnamurthy and Goswami, 2000; Ma et al., 2019). Mahaweli river basin of Sri Lanka is located in the South Asian monsoon region, with its south western part, i.e., wet region, strongly affected by the South Asian summer monsoon, so the interdecadal decrease of rainfall amount in the wet region of MRB during SWM could probably be ascribed to the interdecadal weakening of South Asian monsoon system. Here we investigate the interdecadal difference of atmospheric circulations to further explain the changes in rainfall and drought characteristics.
It’s well known that large scale atmospheric water vapor transport is the moisture source for monsoon rainfall, and changes in water vapor transport have a direct influence on the variability of rainfall at different time scales (e.g., Wei et al., 2005; Li et al., 2009; Pathak et al., 2014). For example, Pathak et al. (2014) pointed out that the summer monsoon rainfall is modulated by the strength of moisture transport from the ocean; consequently, the total amount of monsoon rainfall on subcontinental lands is depended on the strength of moisture transport.
Figure 9 shows the mean water vapor transport and convergence over Sri Lanka and surrounding regions, along with their anomalies for the P2/P1 periods. It can be seen that the vertically integrated moisture flux divergence (VIMD) is negative in western and south western parts of Sri Lanka, suggesting there is net water vapor convergence during the South Asian summer monsoon season, with an amplitude of about 20 × 10–6 kg m–2 s–1 over large areas. In the eastern part of Sri Lanka, there is net water vapor divergence during the SWM season, with a similar amplitude as in the western and Southwestern part of Sri Lanka. The eastward moisture transportation from the northwest Indian Ocean to Sri Lanka is dominant in the SWM season, while the moisture transportation from the south Indian ocean to Sri Lanka is relatively weak (see Figure 9A).
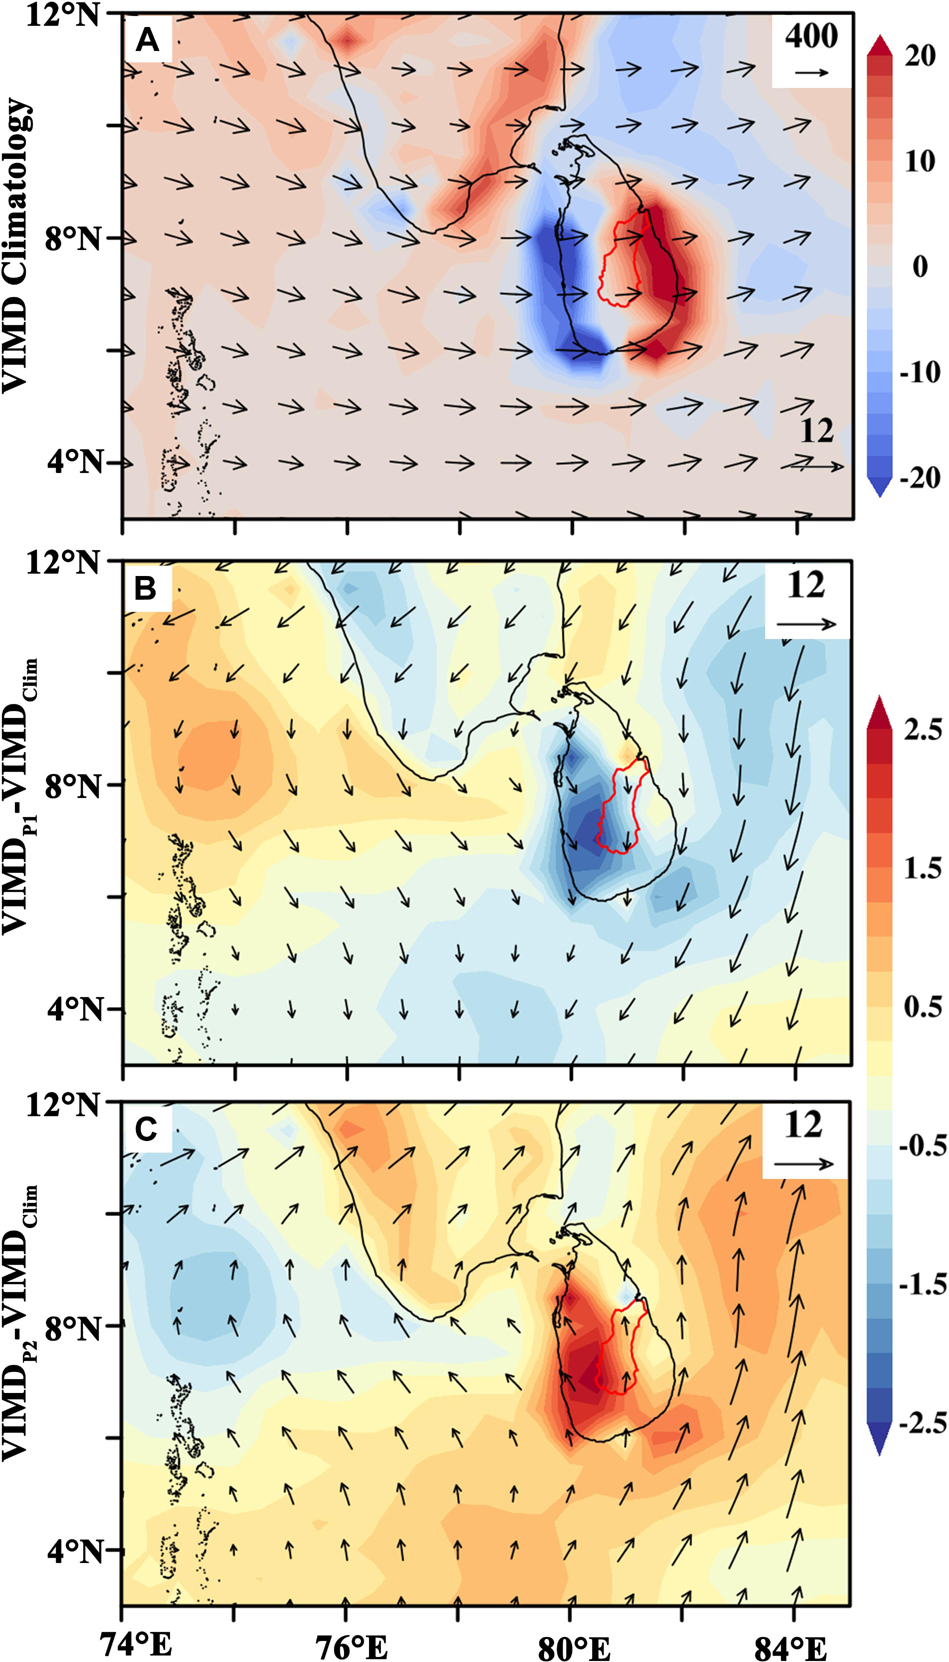
Figure 9. Vertically integrated moisture flux divergence (VIMD, shaded, Unit: 10– 6 kg m– 2 s– 1), superimposed with vertically integrated moisture transportation vector (Arrows, Unit: kg m– 1s– 1) during southwest monsoon season (A) Climatology averaged over 1985–2015; (B) Anomalies for P1 period (1985–1999) and (C) Anomalies for P2 period (2000–2015) from the climatology. The reference arrow for moisture transport vector is 400 kg m– 1s– 1 for the climatology and 12 kg m– 1s– 1 for anomalies.
The interdecadal difference of VIMD and moisture flux between P1 and P2 period can be seen by comparing the anomalous VIMD and moisture transportation. During 1985–1999, there are negative anomalies for VIMD over most parts of Sri Lanka, with the maximum center located in the western part of Sri Lanka, which includes the wet region of MRB; this suggests that there is more water vapor convergence in the region in P1 period as shown in Figure 9B. It is also clear that there are northwesterly moisture transport anomalies in the Arabian Sea to the west of Sri Lanka. Meanwhile, northerly and northeasterly moisture transport anomalies can be found to the east of Sri Lanka, all these indicate that the water vapor transported into Sri Lanka from the northwest Indian Ocean is enhanced, and moisture that comes out of eastern part of Sri Lanka is weakened. Both effects of water vapor transportation in the west and east boundaries of Sri Lanka are favorable for the enhanced water vapor convergence in Sri Lanka during the P1 period. To the south of Sri Lanka, the northeasterly anomalies can be found, which is unfavorable for the moisture transportation from the ocean to the south boundary of the country. However, the moisture transportation from the Indian ocean to the south of Sri Lanka is quite small, as shown in Figure 9B; as such, the anomalous moisture transport in the south boundary will not make a significant contribution to the total moisture budget in Sri Lanka during SWM season.
Between 2000 and 2015, the patterns of the anomalies are opposite to the features in the P1 period. The weakened moisture transport from the Arabian Sea to the west of Sri Lanka can be found, along with the enhanced moisture transported out of the eastern boundary of Sri Lanka. The net water vapor divergence anomalies in Sri Lanka, including the wet region of MRB, is shown in Figure 9C, which is illustrated by the positive VIMD anomalies. In general, the interdecadal difference of atmospheric moisture transport can be seen and subsequently applied to explain the interdecadal weakening of the SWM rainfall amount, hence the enhanced drought over the wet region of MRB, which is strongly influenced by the South Asian monsoon system. Similar to these findings, Li et al. (2009) identify the close relationship between the decadal changes of water vapor transport and observed decadal changes of precipitation over South China.
In order to understand the large scale atmospheric circulation patterns responsible for this decadal difference, the climatology of low-level wind circulation at 850 hPa during 1985–2015 and the anomalies for the early (P1; 1985–1999) and late period (P2; 2000–2015) are illustrated in Figure 10. It shows that the monsoon trough is located to the east of the South Asian subcontinent at around 85°E, with westerly and northwesterly dominant in the South Asian region and northwest Indian ocean during SWM season. The wind circulation can bring moisture from the Arabian Sea direction toward Sri Lanka and the South Asian continent. Meanwhile, as an important component of the South Asian monsoon system, the cross-equatorial flow from the Southern Hemisphere is also favorable for the transportation of water vapor to Sri Lanka and the South Asian region (Figure 10A). During the P1 period, the South Asian monsoon circulation is relatively stronger with monsoon trough intensified, the westerly anomalies of monsoon flow in the northwest Indian Ocean and the Arabian Sea can also be identified, along with the strengthened cross-equatorial flow (Figure 10B).
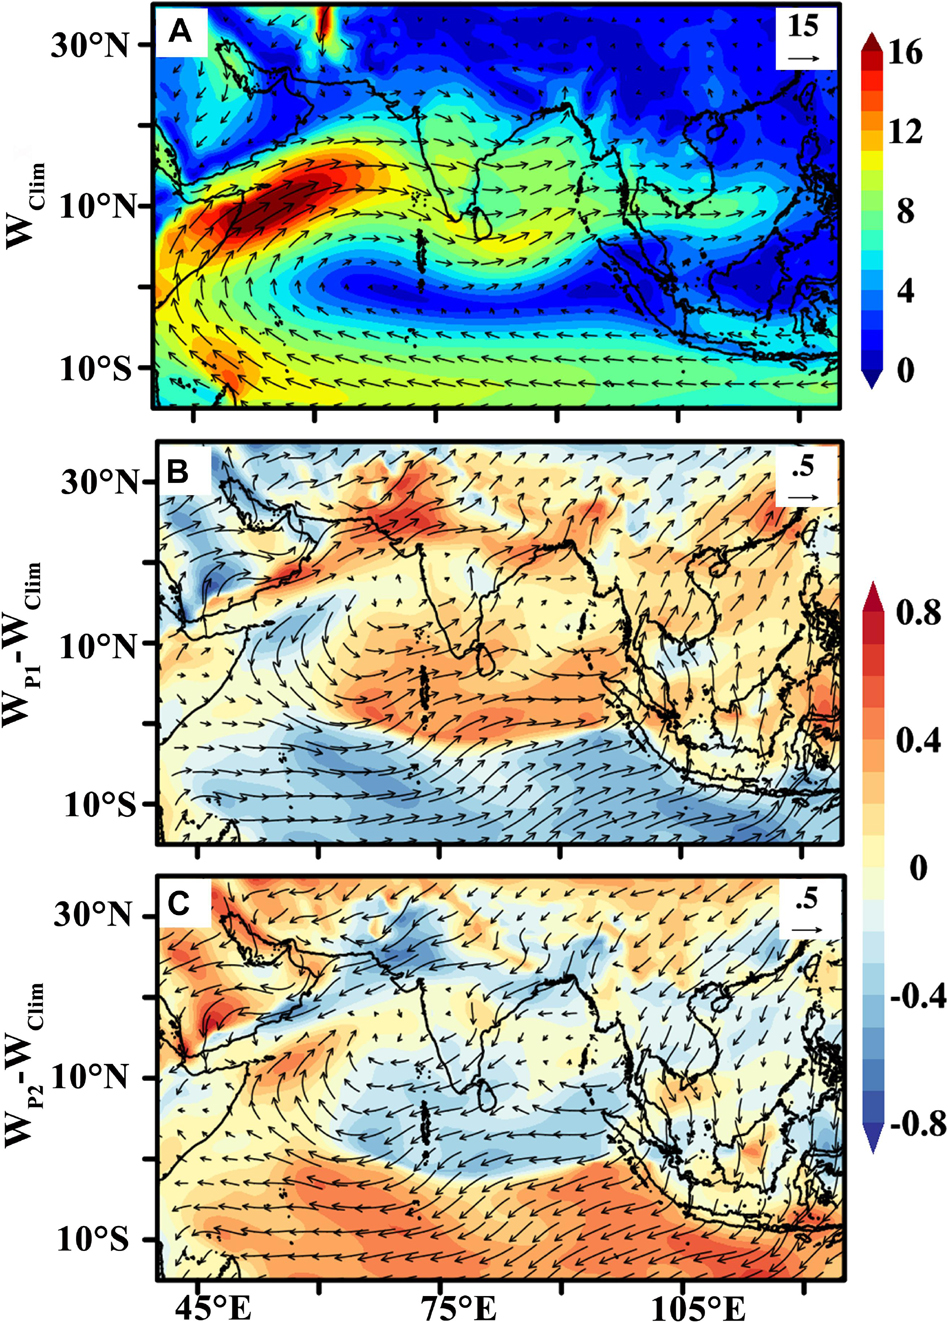
Figure 10. The wind climatology and anomalies at 850 hPa (colored shading; Unit: ms– 1) superimposed with wind vector (Unit: ms– 1) during southwest monsoon season (A) Climatology averaged over 1985–2015; (B) Anomalies for P1 period (1985–1999) and (C) Anomalies for P2 period (2000–2015) from the climatology.
However, the low-level monsoon circulation is generally weaker in the P2 period especially during 2010–2015, with easterly anomalies found over Sri Lanka and South Asian subcontinent, the cross-equatorial circulation is also weakened in P2 period (Figure 10C). The interdecadal change of low-level monsoon circulation from the stronger phase in P1 period to weaker phase in P2 period will cause less water vapor transportation from Southern Hemisphere and the northwest Indian ocean to Sri Lanka, and hence induce less rainfall during SWM season and enhance frequent and intensified drought characteristics during 2000–2015. This is consistent with the findings by Roxy et al. (2015), which revealed that weakened mean south-westerly winds could reduce Indian summer monsoon rainfall over the Indian subcontinent.
Furthermore, the anomalous 500 hPa geopotential height (Hereafter “H500”) in southwest monsoon season for P1 and P2 period during 1985–2015 are shown in Figure 11. For P1 period, the negative H500 anomalies can be found in most parts of the South Asian region, with large anomalies centered over Sri Lanka and surrounding areas and positive H500 anomalies can be found from the northern Arabian Sea to Central Asia between 45 and 75°E (Figure 11A). The spatial pattern of H500 anomalies is favorable for the deepening of South Asian monsoon trough, as can be seen in low-level circulation, and hence leads to stronger South Asian monsoon and consequently more rainfall in the wet region of MRB during 1985–1999.
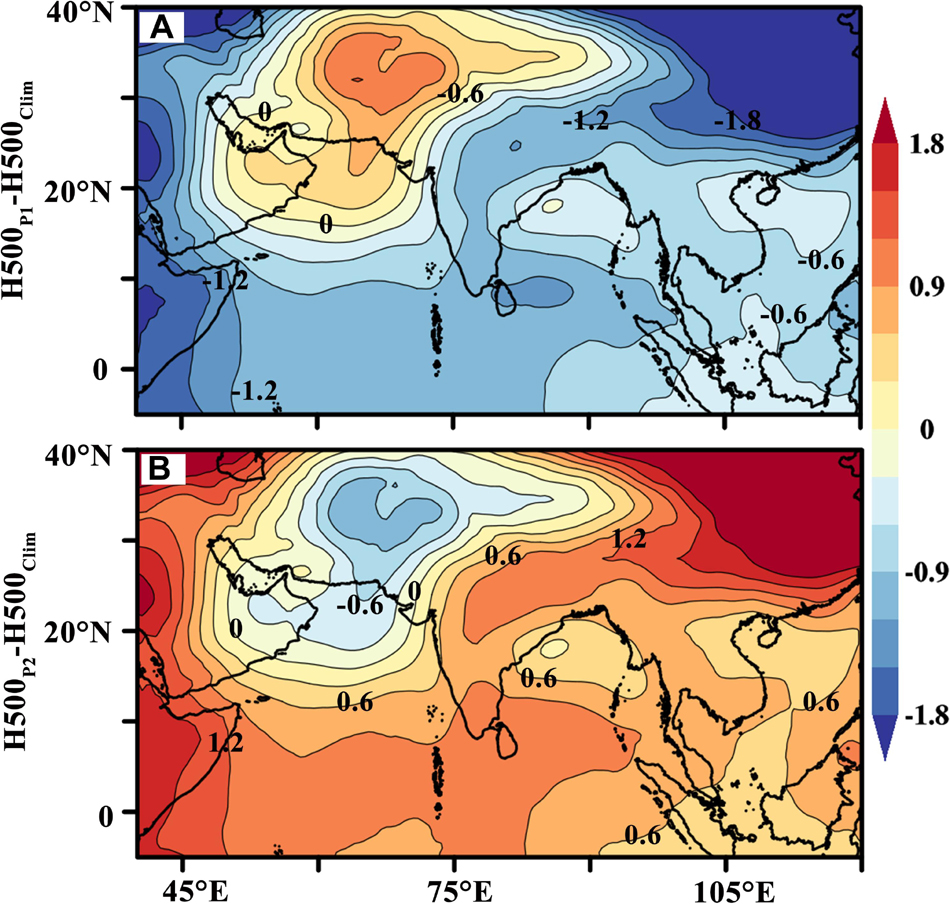
Figure 11. The anomalous geopotential height at 500 hPa (Unit:gpm) in southwest monsoon season for the (A) P1 (1985–1999) and (B) P2 (2000–2015) periods from the climatology. The climatology of geopotential height at 500 hPa (H500Clim) is calculated for the 1985–2015 period.
The geopotential height anomalies at 500 hPa in the P2 period are opposite to that in the P1 period, which is corresponding to the weakening of the South Asian monsoon system during 2000–2015. The positive H500 anomalies centered over Sri Lanka and surrounding areas can induce anomalous downward motion, which is favorable for deficient rainfall conditions (Figure 11B). In general, the interdecadal difference of geopotential height anomalies is also consistent with the decadal change of rainfall anomalies during the southwest monsoon season in Sri Lankan, where there are more frequent and severe drought events occurred during the period from 2000 to 2015.
Discussion
In this paper, we mainly focus on the understanding of the spatial-temporal variation of drought characteristics in the MRB river basin on interdecadal time scale and the associated circulation changes during the southwest monsoon season. The reason why we concentrate on SWM season, it’s because the wet region of MRB experiences much more remarkable interdecadal enhancement of droughts in SWM, compared with other seasons and other sub-regions of MRB. The results show that the wet region of MRB experiences more frequent, prolonged and intensified droughts during 2000–2015, compared with that in 1985–1999. On the contrary, the interdecadal weakening of drought activities from 1985–1999 to 2010–2015 can be found for the dry region of MRB. As for the intermediate region of MRB, there is no remarkable interdecadal change of drought characteristics that can be found. As suggested by previous studies, drought is one of the important climate hazards in the dry and intermediate zones of Sri Lanka (e.g., Zubair et al., 2006). Taking into consideration of interdecadal shift of drought characteristics in the wet region of MRB as found in this study, it was suggested that drought situations in Sri Lanka, MRB in particular, would extend to large areas of the country, including the wet region which is influenced by southwest monsoon system. This is consistent with the decadal changes of drought activities found in other parts of the South Asian region, as described by Mallya et al. (2016). They reported the increased frequency of South Asian summer monsoon droughts with increasing drought duration and intensity over the Indo-Gangetic Plain during recent decades.
However, it is found that the weakening of South Asian monsoon did not affect the intermediate and dry regions, as there is no interdecadal increasinge of drought conditions in these two regions. This could be explained by the topography effects in the study region. During the SWM season, water vapor is transported from the Indian Ocean to the South and Southwestern part of Sri Lanka and then penetrates further to the north and northeast parts of the country. However, due to the blocking effect of central mountains which is situated in the central of the country and Mahaweli River Basin (As shown in Figure 1), the moisture couldn’t transport easily to the intermediate and dry regions, so the rainfall and drought situation in the intermediate and dry regions is not significantly influenced by the SWM and associated moisture transport.
It is well understood that rainfall over the South Asian region is mostly affected by the South Asian monsoon system, which consists of the southwest monsoon subsystem from June to September and northeast monsoon subsystem from December to February (Shelton and Lin, 2019). In the SWM season, drought characteristics experience a remarkable interdecadal shift from wet to dry situation over the wet region of MRB, whereas no interdecadal change of drought can be found in NEM season. This is consistent with the interdecadal decrease of total precipitation during the SWM season in wet region during 2000–2015. For the dry region, the interdecadal increase of wet episodes is found during the NEM season, whereas the interdecadal enhancement of drought can be found during the SWM season; these are consistent with the decadal changes of rainfall amount in SWM and NEM season respectively. The compensation effects from the two opposite interdecadal change signals lead to the interdecadal weakening of the yearly drought situations during the period of 2000–2015, but with relatively weak amplitude. Mallya et al. (2016) ever points out there exists decadal variation of droughts over the Indian monsoon region, and Ma et al. (2019) finds that significant interdecadal change of South Asian summer monsoon rainfall occurred in around the year 2000. Based on the observation data in MRB of Sri Lanka, our findings are also consistent with their results.
The importance of atmospheric moist transport for the rainfall variation and drought evolution has already been demonstrated by many previous studies. For instance, Li et al. (2009) reveals that the decadal changes of water vapor transport are closely associated with observed changes of precipitation over South China and Herrera-Estrada et al. (2019) suggests that the reduced moisture transport can amplify the agricultural droughts in North America. By analysing the moisture transport and monsoon circulation during the SWM season, it’s suggested that the decadal weakening of southwest monsoon is the key reason for the enhancement of drought in the wet region of MRB. Furthermore, we found that the weakened South Asian monsoon trough, reduced cross-equatorial flow from the southern hemisphere, and positive anomalies of geopotential height at 500 hPa over Sri Lanka and South Asian region contribute to the weakened moisture transport from the northwest Indian Ocean to Sri Lanka. As a result, net moisture divergence anomalies in Sri Lanka are prominent in the 2000–2015 period, which promotes the frequent occurrence of drought events during the SWM season since 2000.
It is well known that El Niño-Southern Oscillation (ENSO) is a major driver for climate variability over the Indo-Northwest Pacific through atmospheric teleconnections (Xie et al., 2015) and closely associated with the interannual basin−wide warming/cooling in the tropical Indian Ocean (TIO) (Xie et al., 2015). Many previous studies have demonstrated that sea surface temperature anomalies (SSTA) would play a crucial role in the observed interannual and interdecadal variability of Asian monsoon circulation and the associated rainfall and drought situations (e.g., Zubair, 2003; Niranjan Kumar et al., 2013; Xie et al., 2015; Shelton and Lin, 2019; Sun et al., 2019). However, the impact of SSTA on drought variation in MRB has not yet been investigated. In order to figure out the dominant SSTA signals on interdecadal change of drought characteristics in the Mahaweli river basin, further statistical analysis and numerical simulations with a climate system model will be needed. These precursory oceanic signals will be very important for the skillful seasonal and decadal drought prediction in the basin, in order for better and more efficient drought management and preparedness, as prolonged and severe drought can exert an adverse impact on the crop yield and water resource-related issues (Sheffield and Wood, 2008a; Potop et al., 2012; Niranjan Kumar et al., 2013; Wu et al., 2017; Kuwayama et al., 2018).
It is noted that the potential evapotranspiration (PET) is important for the drought development and evolution, which is not only affected by temperature, but also by other factors, like wind speed, humidity, and sunshine duration or solar radiation, etc. In this study, the Thornthwait method is adopted for PET calculation due to the lack of observed station data, as previous studies suggested that different PET calculation methods will not change the observed variation of drought characteristics in the South Asian region. However, it is still suggested that the more complicated PET calculation method, like FAO-56 Penman-Monteith (Valiantzas, 2013) can be applied, especially for the further projections of drought changes in the region. Meanwhile, as revealed by many previous studies, increasing temperature trend can amplify the drought severity in different regions (e.g., Amrit et al., 2018). In this study, we found that temperature increased significantly in SWM season and suggested the increasing trend of temperature might also contribute to the decadal enhancement of drought characteristics in the wet region of MRB. However, the quantitative contribution of temperature trend has not yet been identified, although the contribution could be relatively small. It’s suggested that the contribution from temperature trend could be distinguished by recalculating the SPEI time series with temperature trend removed, and then comparing with the SPEI time series used in this study. Moreover, the contribution of wind velocity, humidity and solar radiation to the variation and future changes of drought characteristics can also been quantified with more complicated PET calculation method.
Conclusion
Using the station observation data and reanalysis data, the interdecadal variation of drought characteristics in the Mahaweli river basin of Sri Lanka was investigated, and the associated monsoon circulation and atmospheric moisture transport were further demonstrated. It’s found that there exists remarkable interdecadal strengthening of droughts from short to long time scales in the wet region of MRB during 2000–2015, compared with that in 1985–1999. The interdecadal enhancement of drought characteristics is more prominent for long and medium-term drought than that for short-term drought. The accumulative probability of long-term drought increases from 4.4% during 1985–1999 to 27.8% during 2000–2015, the increase of frequency for medium-term drought is from 5.6 to 26.7%. The total drought duration of long-term drought events is 7 months from 1985 to 1999, but it increases to 60 months during 2000–2015, and the total duration for medium-term drought increases from 10 months in the early period to 53 months in the later period. Meanwhile, the stronger severity of drought events can be found, with averaged severity of –2.0 for long-term drought in the P1 period, but –3.0 in the P2 period. The averaged severity of the medium-term drought is also enhanced from –0.7 in the P1 period to –3.2 in the P2 period. For short-term drought, the drought frequency increases from 13.9% in P1 to 22.8% in P2, the total drought duration increases from 22 months to 48 months, and averaged drought severity increases from –0.6 to –1.4. This suggested that the interdecadal enhancement of drought characteristics in the wet region varies with the drought time scales, with a longer-term drought, a stronger interdecadal difference of drought frequency, duration, and severity.
Compared to the wet region, there is no interdecadal change of drought characteristics over the intermediate region of MRB. For the dry region of MRB, the interdecadal weakening of drought characteristics can be found after 2000, with the accumulative probability of long-term drought decreases from 20% in the P1 period to 12% in the P2 period, along with the decrease of the total duration of long-term drought from 40 months to 22 months. However, the averaged severity of long-term drought during 2010–2015 was still much stronger than that during 1985–1999, with –4.3 for the P2 period and –1.8 for the P1 period. The interdecadal weakening of drought characteristics is accompanied by the corresponding enhancement of wet events, the occurrence frequency of long-term wet-episode can be found to increase from 8% in P1 period to 23.3% in P2 period for dry regions of MRB.
It’s found that the observed interdecadal enhancement of drought characteristics in wet region of MRB is coherent with the interdecadal decrease of total precipitation during the SWM season in the region during 2000–2015, and the interdecadal change of yearly drought in the wet region of MRB is largely attributed to the drought variations in SWM season. Meanwhile, the interdecadal difference of atmospheric circulation demonstrates that the South Asian monsoon was weakened after 2000, which is accompanied by the weakening of monsoon trough, reduced cross-equatorial flow from the southern hemisphere from wind circulation at 850 hPa, and positive anomalies of geopotential height at 500 hPa over South Asian region. The weakening of South Asian monsoon leads to lesser moisture transport from the northwest Indian Ocean to Sri Lanka, inducing net moisture divergence anomalies in Sri Lanka, and ultimately results in more drought events during SWM season in the wet region of MRB since the year 2000.
Data Availability Statement
The datasets analyzed in this study are only available upon request directed to the Department of Meteorology, Sri Lanka; info@meteo.gov.lk.
Author Contributions
LZ and SS: research conceptualization, methodology, formal analysis, data curation, writing original draft preparation, writing – review, and editing. LZ: supervision. All authors equally collaborated in the research presented in this publication by making the following contributions.
Funding
This study was jointly supported by the CAS Strategic Priority Research Program (Grant No. XDA20060501), National Natural Science Foundation of China (41661144032), CAS The Belt and Road Initiative Program (134111KYSB20160010), and China–Sri Lanka joint Center for Education and Research (CSL-CER).
Conflict of Interest
The authors declare that the research was conducted in the absence of any commercial or financial relationships that could be construed as a potential conflict of interest.
Acknowledgments
We are thankful to the Meteorological Department, Sri Lanka, for providing weather data. SS acknowledged the CAS–TWAS President’s Fellowship Program for International Ph.D. student and Industrial Technology Institute–Sri Lanka for their support.
References
Aadhar, S., and Mishra, V. (2017). High-resolution near real-time drought monitoring in South Asia. Sci. Data 4:170145. doi: 10.1038/sdata.2017.145
Abatzoglou, J. T., Barbero, R., Wolf, J. W., and Holden, Z. A. (2014). Tracking interannual streamflow variability with drought indices in the U.S. Pacific Northwest. J. Hydrometeorol. 15, 1900–1912. doi: 10.1175/jhm-d-13-0167.1
Allan, R., Pereira, L., Raes, D., and Smith, M. (1998). Crop Evapotranspiration-Guidelines for Computing Crop Water Requirements-FAO Irrigation and Drainage Paper 56. Rome: FAO.
Amrit, K., Pandey, R. P., Mishra, S. K., and Daradur, M. (2018). Relationship of drought frequency and severity with range of annual temperature variation. Nat. Hazards 92, 1199–1210. doi: 10.1007/s11069-018-3247-6
Bae, S., Lee, S.-H., Yoo, S.-H., and Kim, T. (2018). Analysis of drought intensity and trends using the modified SPEI in South Korea from 1981 to 2010. Water 10:327. doi: 10.3390/w10030327
Burchfield, E. K., and Gilligan, J. (2016). Agricultural adaptation to drought in the Sri Lankan dry zone. Appl. Geogr. 77, 92–100. doi: 10.1016/j.apgeog.2016.10.003
Burt, T. P., and Weerasinghe, K. D. N. (2014). Rainfall distributions in sri lanka in time and space: an analysis based on daily rainfall data. Climate 2, 242–263. doi: 10.3390/cli2040242
Chen, H., and Sun, J. (2015). Changes in climate extreme events in China associated with warming. Int. J. Climatol. 35, 2735–2751. doi: 10.1002/joc.4168
Dai, A. (2011). Drought under global warming: a review. Wiley Interdiscip. Rev. Clim. Change 2, 45–65. doi: 10.1002/wcc.81
Dai, A. (2012). Increasing drought under global warming in observations and models. Nat. Clim. Change 3, 52–58. doi: 10.1038/nclimate1633
Dee, D. P., Uppala, S. M., Simmons, A. J., Berrisford, P., Poli, P., Kobayashi, S., et al. (2011). The ERA-interim reanalysis: configuration and performance of the data assimilation system. Q.m J. R. Meteorol. Soc. 137, 553–597. doi: 10.1002/qj.828
Deng, S., Chen, T., Yang, N., Qu, L., Li, M., and Chen, D. (2018). Spatial and temporal distribution of rainfall and drought characteristics across the Pearl River basin. Sci. Total Environ. 61, 28–41. doi: 10.1016/j.scitotenv.2017.10.339
FAO (2015). The Impact of Natural Hazards and Disasters on Agriculture and Food and Nutrition Security. Rome: Food and Agriculture Organization of the United Nations.
Guhathakurta, P., Rajeevan, M., Sikka, D. R., and Tyagi, A. (2015). Observed changes in southwest monsoon rainfall over India during 1901–2011. Int. J. Climatol. 35, 1881–1898. doi: 10.1002/joc.4095
Gunda, T., Hornberger, G. M., and Gilligan, J. M. (2016). Spatiotemporal patterns of agricultural drought in Sri Lanka: 1881–2010. Int. J. Climatol. 36, 563–575. doi: 10.1002/joc.4365
Gunda, T., Nawagamuwa, U. P., and Hornberger, G. M. (2017). Combined impact of local climate and soil properties on soil moisture patterns. Hydrol. Earth Syst. Sci. Discuss 2017, 1–22. doi: 10.5194/hess-2017-357
Guo, H., Bao, A., Liu, T., Jiapaer, G., Ndayisaba, F., Jiang, L., et al. (2018). Spatial and temporal characteristics of droughts in Central Asia during 1966–2015. Sci. Total Environ. 624, 1523–1538. doi: 10.1016/j.scitotenv.2017.12.120
Hao, Z., Singh, V. P., and Xia, Y. (2018). Seasonal drought prediction: advances, challenges, and future prospects. Rev. Geophys. 56, 108–141. doi: 10.1002/2016RG000549
Herrera-Estrada, J. E., Martinez, J. A., Dominguez, F., Findell, K. L., Wood, E. F., and Sheffield, J. (2019). Reduced moisture transport linked to drought propagation across North America. Geophys. Res. Lett. 46, 5243–5253. doi: 10.1029/2019gl082475
Hewawasam, T. (2010). Effect of land use in the upper Mahaweli catchment area on erosion, landslides and siltation in hydropower reservoirs of Sri Lanka. J. Natn. Sci. Foundation Sri Lanka 38, 3–14. doi: 10.4038/jnsfsr.v38i1.1721
IPCC (2014). “Summary for policymakers. In: climate Change 2014: impacts, adaptation, and vulnerability. part a: global and sectoral aspects,” in Contribution of Working Group II to the Fifth Assessment Report of the Intergovernmental Panel on Climate Change, (Geneva: IPCC).
Jacquin, A., and Soto-Sandoval, J. (2013). Interpolation of monthly precipitation amounts in mountainous catchments with sparse precipitation networks. Chilean J. Agric. Res. 73, 406–413. doi: 10.4067/S0718-58392013000400012
Krishnamurthy, V., and Goswami, B. N. (2000). Indian Monsoon–ENSO relationship on interdecadal timescale. J. Clim. 13, 579–595. doi: 10.1175/1520-04422000013<0579:imeroi<2.0.co;2
Kuwayama, Y., Thompson, A., Bernknopf, R., Zaitchik, B., and Vail, P. (2018). Estimating the impact of drought on agriculture Using the U.S. Drought Monitor. Am. J. Agric. Econ. 101, 193–210. doi: 10.1093/ajae/aay037
Lesk, C., Rowhani, P., and Ramankutty, N. (2016). Influence of extreme weather disasters on global crop production. Nature 529, 84–87. doi: 10.1038/nature16467
Li, H., Lin, Z., and Hong, C. (2009). Interdecadal variability of spring precipitation over south china and its associated atmospheric water vapor transport. Atmos. Oceanic Sci. Lett. 2, 113–118. doi: 10.1080/16742834.2009.11446783
Limin, S., Oue, H., and Takase, K. (2015). Estimation of areal average rainfall in the mountainous kamo river Watershed, Japan. J. Agric. Meteorol. 71, 90–97. doi: 10.2480/agrmet.D-14-00055
Littell, J., Peterson, D. L., Riley, K. L., Yongquiang, L., and Luce, C. H. (2016). A review of the relationships between drought and forest fire in the United States. Global Change Biol. 22, 2353–2369. doi: 10.1111/gcb.13275
Livneh, B., and Hoerling, M. (2016). The physics of drought in the U.S. central great plains. J. Clim. 29, 6783–6804. doi: 10.1175/JCLI-D-15-0697.1
Luo, L., Apps, D., Arcand, S., Xu, H., Pan, M., and Hoerling, M. (2017). Contribution of temperature and precipitation anomalies to the california drought during 2012-2015: contribution of T and P to CA drought. Geophys. Res. Lett. 44, 3184–3192. doi: 10.1002/2016gl072027
Lyon, B., Zubair, L., Ralapanawe, V., and Yahiya, Z. (2009). Finescale evaluation of drought in a tropical setting: case study in Sri Lanka. J. Appl. Meteor. Climatol. 48, 77–88. doi: 10.1175/2008jamc1767.1
Ma, H., Zhu, Y., and Hua, W. (2019). Interdecadal change in the South Asian summer monsoon rainfall in 2000 and contributions from regional tropical SST. Atmos. Oceanic Sci. Lett. 12, 399–408. doi: 10.1080/16742834.2019.1648168
Mallya, G., Mishra, V., Niyogi, D., Tripathi, S., and Govindaraju, R. S. (2016). Trends and variability of droughts over the Indian monsoon region. Weather Clim. Extr. 12, 43–68. doi: 10.1016/j.wace.2016.01.002
Malmgren, B. A., Hulugalla, R., Hayashi, Y., and Mikami, T. (2003). Precipitation trends in Sri Lanka since the 1870s and relationships to El Niño–southern oscillation. Inte. J. Climatol. 23, 1235–1252. doi: 10.1002/joc.921
Maskey, S., and Trambauer, P. (2015). “Chapter 10 - hydrological modeling for drought assessment,” in Hydro-Meteorological Hazards, Risks and Disasters, eds J. F. Shroder, P. Paron, and G. D. Baldassarre (Boston: Elsevier), 263–282. doi: 10.1016/b978-0-12-394846-5.00010-2
Mavromatis, T. (2007). Drought index evaluation for assessing future wheat production in Greece. Int. J. Climatol. 27, 911–924. doi: 10.1002/joc.1444
McKee, T. B., Doesken, N. J., and Kleist, J. (1993). “The relationship of drought frequency and duration to time scale,” in Proceedings of the Eighth Conference on Applied Climatology, Anaheim, CA.
Mishra, A. K., and Singh, V. P. (2011). Drought modeling – A review. J. Hydrol. 403, 157–175. doi: 10.1016/j.jhydrol.2011.03.049
Mo, K. C., and Lettenmaier, D. P. (2016). Precipitation deficit flash droughts over the United States. J. Hydrometeorol. 17, 1169–1184. doi: 10.1175/jhm-d-15-0158.1
Morid, S., Smakhtin, V., and Moghaddasi, M. (2006). Comparison of seven meteorological indices for drought monitoring in Iran. Int. J. Climatol. 26, 971–985. doi: 10.1002/joc.1264
Niranjan Kumar, K., Rajeevan, M., Pai, D. S., Srivastava, A. K., and Preethi, B. (2013). On the observed variability of monsoon droughts over India. Weather Clim. Extremes 1, 42–50. doi: 10.1016/j.wace.2013.07.006
Pathak, A., Ghosh, S., and Kumar, P. (2014). Precipitation recycling in the indian subcontinent during summer monsoon. J. Hydrometeorol. 15, 2050–2066. doi: 10.1175/jhm-d-13-0172.1
Potop, V., Možnı, M., and Soukup, J. (2012). Drought evolution at various time scales in the lowland regions and their impact on vegetable crops in the Czech Republic. Agric. For. Meteorol. 156, 121–133. doi: 10.1016/j.agrformet.2012.01.002
Potopová, V., Štìpánek, P., Možnı, M., Türkott, L., and Soukup, J. (2015). Performance of the standardised precipitation evapotranspiration index at various lags for agricultural drought risk assessment in the Czech Republic. Agric. For. Meteorol. 202, 26–38. doi: 10.1016/j.agrformet.2014.11.022
Roxy, M. K., Ritika, K., Terray, P., Murtugudde, R., Ashok, K., and Goswami, B. N. (2015). Drying of Indian subcontinent by rapid Indian Ocean warming and a weakening land-sea thermal gradient. Nat. Commun. 6:7423. doi: 10.1038/ncomms8423
Rubasinghe, R., Gunatilake, S. K., and Chandrajith, R. (2015). Geochemical characteristics of groundwater in different climatic zones of Sri Lanka. Environ. Earth Sci. 74, 3067–3076. doi: 10.1007/s12665-015-4339-4331
Schubert, S. D., Stewart, R. E., Wang, H., Barlow, M., Berbery, E. H., Cai, W., et al. (2016). Global meteorological drought: a synthesis of current understanding with a focus on SST drivers of precipitation deficits. J. Clim. 29, 3989–4019. doi: 10.1175/jcli-d-15-0452.1
Sen, P. K. (1968). Estimates of the regression coefficient based on Kendall’s Tau. J. Am. Stat. Assoc. 63, 1379–1389. doi: 10.1080/01621459.1968.10480934
Sheffield, J., and Wood, E. (2008a). Global trends and variability in soil moisture and drought characteristics, 1950 2000, from observation-driven simulations of the terrestrial hydrologic cycle. J. Clim. 21, 432–458. doi: 10.1175/2007jcli1822.1
Sheffield, J., and Wood, E. F. (2008b). Projected changes in drought occurrence under future global warming from multi-model, multi-scenario. IPCC AR4 simulations. Clim. Dyn. 31, 79–105. doi: 10.1007/s00382-007-0340-z
Sheffield, J., Wood, E. F., and Roderick, M. L. (2012). Little change in global drought over the past 60 years. Nature 491, 435–438. doi: 10.1038/nature11575
Shelton, S., and Lin, Z. (2019). Streamflow variability over the period of 1990–2014 in mahaweli river basin, sri lanka and its possible mechanisms. Water 11:2485. doi: 10.3390/w11122485
Spinoni, J., Naumann, G., and Vogt, J. V. (2017). Pan-European seasonal trends and recent changes of drought frequency and severity. Global Planet. Change 148, 113–130. doi: 10.1016/j.gloplacha.2016.11.013
Sun, B., Li, H., and Zhou, B. (2019). Interdecadal variation of Indian Ocean basin mode and the impact on Asian summer climate. Geophys. Rese. Lett. 46, 12388–12397. doi: 10.1029/2019GL085019
Thomas, J., and Prasannakumar, V. (2016). Temporal analysis of rainfall (1871–2012) and drought characteristics over a tropical monsoon-dominated State (Kerala) of India. J. Hydrol. 534, 266–280. doi: 10.1016/j.jhydrol.2016.01.013
Thornthwaite, C. W. (1948). An approach toward a rational classification of climate. Geogr. Rev. 38, 55–94.
Tsakiris, G. (2004). “meteorological drought assessment,” in Proceedings of the European Research Program MEDROPLAN (Mediterranean Drought Preparedness andMitigation Planning), Zaragoza.
Valiantzas, J. D. (2013). Simplified forms for the standardized FAO-56 Penman–Monteith reference evapotranspiration using limited weather data. J. Hydrol. 505, 13–23. doi: 10.1016/j.jhydrol.2013.09.005
van der Schrier, G., Jones, P. D., and Briffa, K. R. (2011). The sensitivity of the PDSI to the Thornthwaite and Penman-Monteith parameterizations for potential evapotranspiration. J. Geophys. Res. Atmos. 116. doi: 10.1029/2010jd015001
Vicente-Serrano, S. M., Beguería, S., and López-Moreno, J. I. (2010). A multiscalar drought index sensitive to global warming: the standardized precipitation evapotranspiration index. J. Clim. 23, 1696–1718. doi: 10.1175/2009jcli2909.1
Vicente-Serrano, S. M., Camarero, J. J., Olano, J. M., Martín-Hernández, N., Peña-Gallardo, M., Tomás-Burguera, M., et al. (2016). Diverse relationships between forest growth and the normalized difference vegetation index at a global scale. Remote Sens. Environ. 187, 14–29. doi: 10.1016/j.rse.2016.10.001
Vicente-Serrano, S. M., Lopez-Moreno, J.-I., Beguería, S., Lorenzo-Lacruz, J., Sanchez-Lorenzo, A., García-Ruiz, J. M., et al. (2014). Evidence of increasing drought severity caused by temperature rise in southern Europe. Environ. Res. Lett. 9:044001. doi: 10.1088/1748-9326/9/4/044001
Vincent, L. A., Aguilar, E., Saindou, M., Hassane, A. F., Jumaux, G., Roy, D., et al. (2011). Observed trends in indices of daily and extreme temperature and precipitation for the countries of the western Indian Ocean, 1961–2008. J. Geophys. Res. Atmos. 116:D10108. doi: 10.1029/2010JD015303
Wang, D., Hejazi, M., Cai, X., and Valocchi, A. J. (2011). Climate change impact on meteorological, agricultural, and hydrological drought in central Illinois. Water Resour. Res. 47:W09527. doi: 10.1029/2010wr009845
Wang, Q., Wu, J., Lei, T., He, B., Wu, Z., Liu, M., et al. (2014). Temporal-spatial characteristics of severe drought events and their impact on agriculture on a global scale. Q. Int. 349, 10–21. doi: 10.1016/j.quaint.2014.06.021
Wei, J., Lin, Z., Xia, J., and Tao, S. Y. (2005). Interannual and interdecadal variability of atmospheric water vapor transport in the Haihe River Basin. Pedosphere 15, 585–594.
Wetterhall, F., Winsemius, H. C., Dutra, E., Werner, M., and Pappenberger, E. (2015). Seasonal predictions of agro-meteorological drought indicators for the Limpopo basin. Hydrol. Earth Syst. Sci. 19, 2577–2586. doi: 10.5194/hess-19-2577-2015
Wickramagamage, P. (2010). Seasonality and spatial pattern of rainfall of Sri Lanka: exploratory factor analysis. Int. J. Climatol. 30, 1235–1245. doi: 10.1002/joc.1977
Withanachchi, S. S., Köpke, S., Withanachchi, C. R., Pathiranage, R., and Ploeger, A. (2014). Water resource management in dry zonal paddy cultivation in mahaweli river basin, sri lanka: an analysis of spatial and temporal climate change impacts and traditional knowledge. Climate 2:329. doi: 10.3390/cli2040329
Wu, J., Chen, X., Yao, H., Gao, L., Chen, Y., and Liu, M. (2017). Non-linear relationship of hydrological drought responding to meteorological drought and impact of a large reservoir. J. Hydrol. 551, 495–507. doi: 10.1016/j.jhydrol.2017.06.029
Xie, S.-P., Kosaka, Y., Du, Y., Hu, K., Chowdary, J., and Huang, G. (2015). Indo-western Pacific ocean capacitor and coherent climate anomalies in post-ENSO summer. Adv. Atmos. Sci. 33, 411–432. doi: 10.1007/s00376-015-5192-5196
Yao, J., Zhao, Y., Chen, Y., Yu, X., and Zhang, R. (2018). Multi-scale assessments of droughts: a case study in Xinjiang, China. Sci. Total Environ. 630, 444–452. doi: 10.1016/j.scitotenv.2018.02.200
Yevjevich, V. M., Colorado State University., Hydrology, and Water Resources Program (1967). An Objective Approach to Definitions and Investigations of Continental Hydrologic Droughts. Fort Collins, CO: Colorado State University.
Zubair, L. (2002). Diurnal and seasonal variation in surface wind at Sita Eliya, Sri Lanka. Theor. Appl. Climatol. 71, 119–127. doi: 10.1007/s704-002-8212-8212
Zubair, L. (2003). El Niño–southern oscillation influences on the Mahaweli streamflow in Sri Lanka. Int. J. Climatol. 23, 91–102. doi: 10.1002/joc.865
Zubair, L., Ralapanawe, V., Tennakone, U., Yahiya, Z., and Perera, R. (2006). “Natural disaster risks in Sri Lanka: mapping hazards and risk hotspots,” in Natural Disaster Hotspots Case Studies, World Bank Disaster Risk Management Series No. 6, eds M. Arnold, R. Chen, U. Deichmann, M. Dilley, A. Lerner-Lam, R. Pullen, et al. (Washington, DC: The World Bank Hazard Management Unit), 109–136.
Keywords: drought characteristics, interdecadal change, SPEI, South Asian monsoon, Mahaweli River Basin
Citation: Lin Z and Shelton S (2020) Interdecadal Change of Drought Characteristics in Mahaweli River Basin of Sri Lanka and the Associated Atmospheric Circulation Difference. Front. Earth Sci. 8:306. doi: 10.3389/feart.2020.00306
Received: 06 April 2020; Accepted: 29 June 2020;
Published: 11 August 2020.
Edited by:
Zhiwei Zhu, Nanjing University of Information Science and Technology, ChinaReviewed by:
Bo Sun, Nanjing University of Information Science and Technology, ChinaShanlei Sun, Nanjing University of Information Science and Technology, China
Qiuhong Tang, Chinese Academy of Sciences, China
Copyright © 2020 Lin and Shelton. This is an open-access article distributed under the terms of the Creative Commons Attribution License (CC BY). The use, distribution or reproduction in other forums is permitted, provided the original author(s) and the copyright owner(s) are credited and that the original publication in this journal is cited, in accordance with accepted academic practice. No use, distribution or reproduction is permitted which does not comply with these terms.
*Correspondence: Zhaohui Lin, lzh@mail.iap.ac.cn