Rapid Fluvio-Thermal Erosion of a Yedoma Permafrost Cliff in the Lena River Delta
 Matthias Fuchs1*
  Ingmar Nitze1
  Jens Strauss1
  Frank Günther2,3
  Sebastian Wetterich1
  Alexander Kizyakov4
  Michael Fritz1
  Thomas Opel1
  Mikhail N. Grigoriev5 Georgii T. Maksimov5
  Guido Grosse1,2
- 1Alfred Wegener Institute Helmholtz Centre for Polar and Marine Research, Potsdam, Germany
- 2Institute of Geosciences, University of Potsdam, Potsdam, Germany
- 3Laboratory Geoecology of the North, Faculty of Geography, Lomonosov Moscow State University, Moscow, Russia
- 4Department of Cryolithology and Glaciology, Faculty of Geography, Lomonosov Moscow State University, Moscow, Russia
- 5Laboratory of General Geocryology, Melnikov Permafrost Institute, Siberian Branch of the Russian Academy of Sciences, Yakutsk, Russia
The degradation of ice-rich permafrost deposits has the potential to release large amounts of previously freeze-locked carbon (C) and nitrogen (N) with local implications, such as affecting riverine and near-shore ecosystems, but also global impacts such as the release of greenhouse gases into the atmosphere. Here, we study the rapid erosion of the up to 27.7 m high and 1,660 m long Sobo-Sise yedoma cliff in the Lena River Delta using a remote sensing-based time-series analysis covering 53 years and calculate the mean annual sediment as well as C and N release into the Lena River. We find that the Sobo-Sise yedoma cliff, which exposes ice-rich late Pleistocene to Holocene deposits, had a mean long-term (1965–2018) erosion rate of 9.1 m yr–1 with locally and temporally varying rates of up to 22.3 m yr–1. These rates are among the highest measured erosion rates for permafrost coastal and river shoreline stretches. The fluvio-thermal erosion led to the release of substantial amounts of C (soil organic carbon and dissolved organic carbon) and N to the river system. On average, currently at least 5.2 × 10⁶ kg organic C and 0.4 × 10⁶ kg N were eroded annually (2015–2018) into the Lena River. The observed sediment and organic matter erosion was persistent over the observation period also due to the specific configuration of river flow direction and cliff shore orientation. Our observations highlight the importance to further study rapid fluvio-thermal erosion processes in the permafrost region, also because our study shows increasing erosion rates at Sobo-Sise Cliff in the most recent investigated time periods. The organic C and N transport from land to river and eventually to the Arctic Ocean from this and similar settings may have severe implications on the biogeochemistry and ecology of the near-shore zone of the Laptev Sea as well as for turnover and rapid release of old C and N to the atmosphere.
Introduction
Permafrost landscapes are sensitive to global temperature rise and may be affected by widespread degradation (Grosse et al., 2016; Biskaborn et al., 2019). Very ice-rich permafrost deposits such as the yedoma Ice Complex (Schirrmeister et al., 2013; Strauss et al., 2013, 2017) are particularly at risk to rapid, strong thaw processes and erosion. The thaw of ice-rich deposits leads to strong ground subsidence (Strozzi et al., 2018) and landscape reorganization (Morgenstern et al., 2011). Coasts and river banks in the Arctic are particularly fast changing permafrost features, which are characterized by high ground ice contents (e.g., Walker et al., 1987; Lantuit et al., 2011; Kanevskiy et al., 2016; Jones et al., 2018). These shores are affected by thermo-erosion processes induced by sea or river water combining mechanical erosion from waves, currents, and moving ice with thermal impacts of the water that is warmer than the permafrost (Are, 1983; Günther et al., 2013). The strong erosion of river banks and coastal segments leads to large sediment and organic matter inputs into Arctic river systems and the Arctic Ocean, respectively (e.g., Rachold et al., 2000; Couture et al., 2018; Rowland et al., 2018) with regional to global implications affecting the aquatic ecosystem and global C cycle (Gustafsson et al., 2011; Vonk and Gustafsson, 2013; Mann et al., 2015; Semiletov et al., 2016; Fritz et al., 2017). The C release upon permafrost thaw has been shown to have the potential to further increase atmospheric C resulting in a positive permafrost C climate feedback (Schuur et al., 2009). The deep mobilization of permafrost C caused by thermo-erosional processes along shores might add C to the atmosphere, which is not yet taken into account in current Earth System Models that include only top-down thaw (Turetsky et al., 2020). However, how much of the C released through shore erosion is re-buried on the Arctic shelf or in the deep Arctic Ocean versus is being mineralized and released into the atmosphere is still a matter of discussion (Vonk et al., 2012; Bröder et al., 2019; Grotheer et al., 2020).
Often, rapid erosion of ice-rich permafrost landscapes such as retrogressive thaw slumping (Lantz and Kokelj, 2008; Balser et al., 2014) and river bank erosion (Walker et al., 1987; Kanevskiy et al., 2016) occurs on local spatial scales and is therefore challenging to include in permafrost C feedback models (Turetsky et al., 2020). Nevertheless, observations of increasing air and river water temperatures (van Vliet et al., 2013), decreasing sea ice cover (Stroeve and Notz, 2018), extended thaw season length (Serreze et al., 2000; Barichivich et al., 2012), and an increase in Arctic river discharge (Holmes et al., 2015; Box et al., 2019) and therefore a higher sediment transport capacity all point at a high probability for accelerated erosion rates along permafrost coasts and river shorelines in the Arctic. Several studies already indicate that acceleration of erosion is taking place over the recent decades in different regions (e.g., Günther et al., 2015; Irrgang et al., 2018; Jones et al., 2018) in response to large scale drivers such as changing sea-ice cover (Nielsen et al., 2020). It is therefore important to understand and quantify the dynamics and C mobilization of permafrost shore erosion across a range of environmental and geographical settings.
Several segments of the Arctic coast (e.g., Jorgenson and Brown, 2005; Jones et al., 2008, 2009; Lantuit et al., 2011; Ping et al., 2011; Günther et al., 2013; Obu et al., 2017; Couture et al., 2018; Irrgang et al., 2018; Jones et al., 2018) and some individual permafrost shore sites (e.g., Walker et al., 1987; Costard et al., 2003; Günther et al., 2015; Kanevskiy et al., 2016; Stettner et al., 2018) affected by thermo-denudation and thermo-erosion have been previously studied in terms of erosion rates and organic matter flux. Here we study the fluvio-thermal erosion dynamics of a carbon-rich and fast-eroding river bank in the eastern Lena Delta, Siberia, using remote sensing image analysis and geochemical field data from sediment samples. The Sobo-Sise Cliff in the eastern Lena Delta is composed of ice-rich yedoma permafrost and strongly eroded by a main branch of the Lena River. With our study, we aim (1) to assess the cliff erosion rates of this yedoma Ice Complex exposure and (2) to quantify the sediment, C and N loss from yedoma deposits due to river bank erosion. Our study highlights the potential for continued and very rapid erosion in permafrost regions under certain environmental and geological conditions by Arctic rivers and the related environmental impacts of such a high organic matter export.
Study Site
Sobo-Sise Island is located in the eastern part of the Lena River Delta at the Sardakhskaya Lena river channel (Figure 1), which is one of the main Lena Delta river channels with a width of around 2 km and a water discharge of ∼8000 m3 s–1 during the summer low-water period (Fedorova et al., 2015). The Lena River is ice-covered for about 8 months (October–May) during wintertime where presumably very little or no erosion happens on the subaerial frozen deposits along the river. However, ice thickness on the Lena River is up to 2 m while the water depth at the onset of the Sardakhskaya channel can reach 22 m (Fedorova et al., 2015) and around 11 m in front of Sobo-Sise Cliff (see Supplementary Figure S1) allowing constant water flow underneath also in winter. The delta island Sobo-Sise is characterized by late Pleistocene, ice-rich yedoma Ice Complex deposits with Holocene cover deposits. The yedoma deposits at Sobo-Sise are affected by rapid thaw processes such as thermokarst lake dynamics and thermo-erosional valley formation (Morgenstern et al., 2011; Nitze and Grosse, 2016) as well as thaw subsidence (Chen et al., 2018). Only 19% of the area of Sobo-Sise Island consist of largely un-affected yedoma uplands, whereas the remaining area of the island consists of degraded thermokarst basins (alases) and fluvial deposits (Fuchs et al., 2018). Most of the year, snow and ice cover the landscape and water bodies, respectively. With a mean annual air temperature of −11.7°C (1998–2017) and a mean summer rainfall of 145 mm (weather station on Samoylov Island 63 km to the southwest, Boike et al., 2019), Sobo-Sise is dominated by a polar tundra climate (Peel et al., 2007).
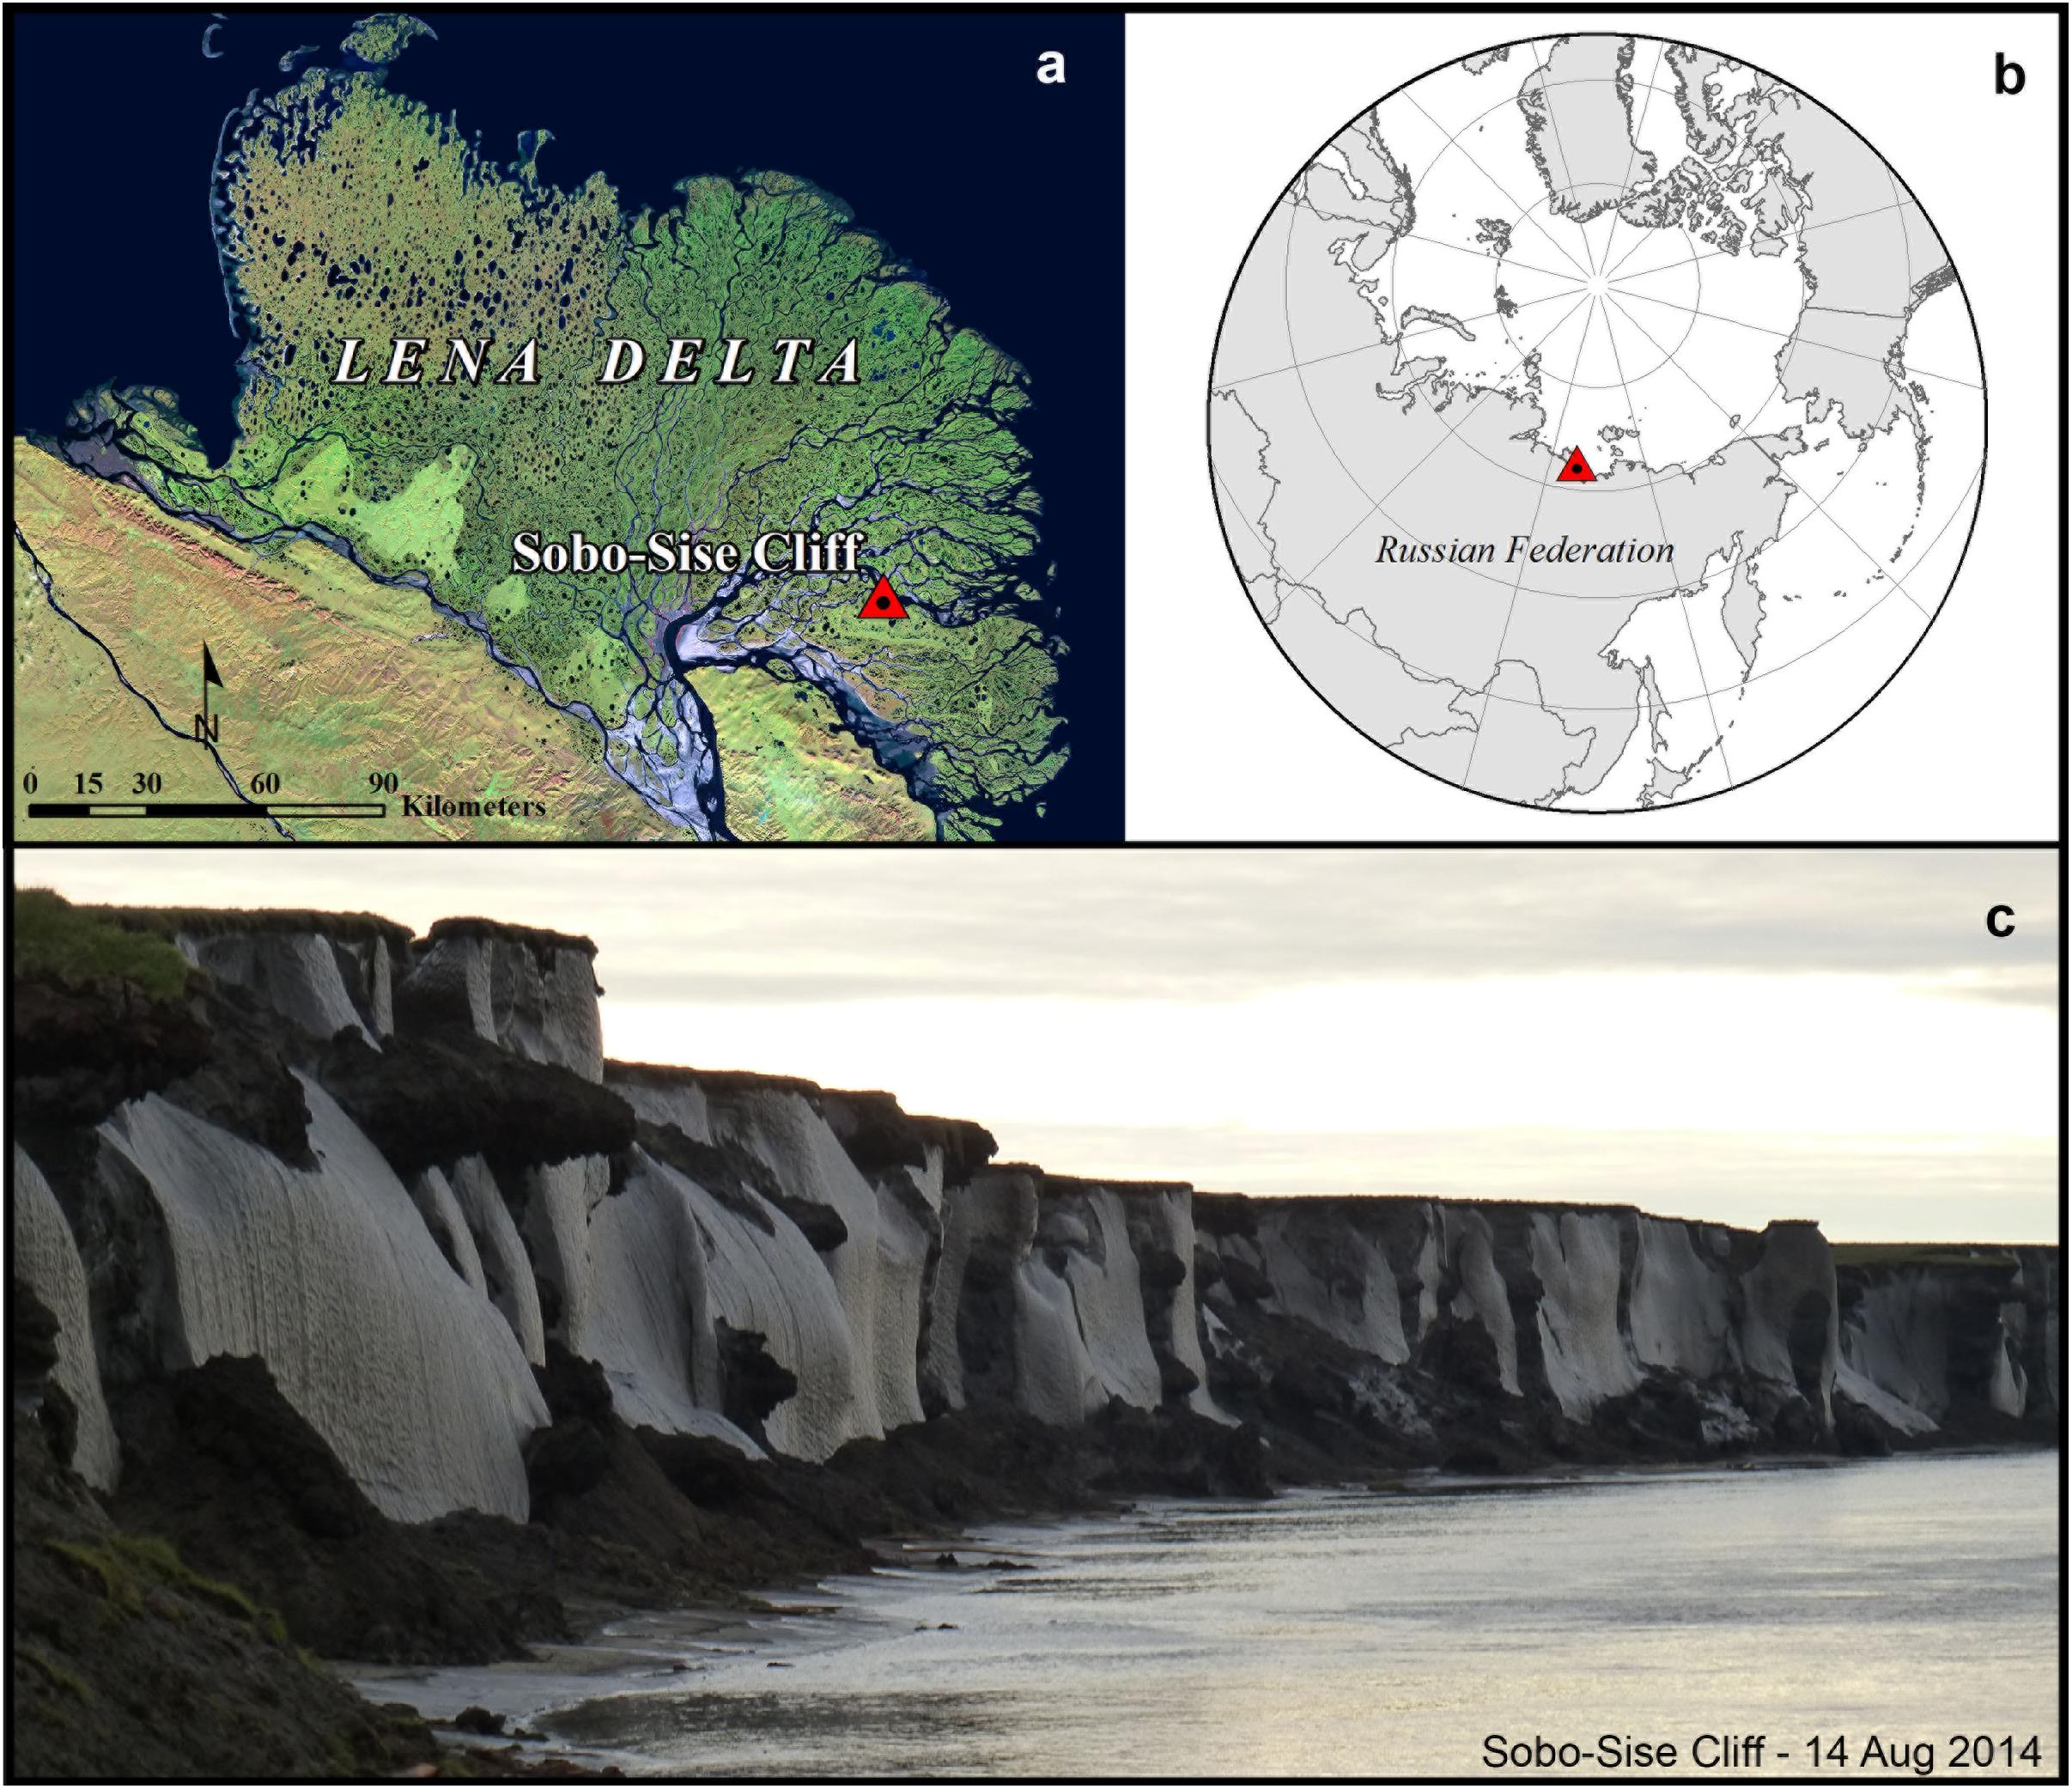
Figure 1. Overview of the study site. The red triangle shows the location of Sobo-Sise Cliff in the eastern Lena River Delta (a) in the north of East Siberia, Russia (b). [Lena Delta map is a mosaic compiled of six Landsat 5 scenes (bands 6-5-4) from 2009 to 2010.] Panel (c) shows the very ice-rich and up to 27.7 m high Sobo-Sise Cliff in August 2014 (photo: I. Nitze).
The Sobo-Sise Cliff (72°32 N, 128°17 E) is a 1,660 m long riverbank stretch in the central North of Sobo-Sise Island, with a northeast exposition. The vertical cliff erodes into yedoma uplands with heights up to 27.7 m above mean river water level, exposing yedoma Ice Complex and overlying Holocene deposits, which can reach a thickness of up to two meters (Fuchs et al., 2018). Pavlova and Dorozhkina (2000) report that yedoma in the eastern part of the Lena Delta reaches to 8 to 10 m below sea level, resulting in ice-rich permafrost being exposed directly to above and underwater thermal erosion dynamics. Large syngenetic ice wedges, which dissect the entire height of the exposure, dominate the cross section exposed by erosion. The Sobo-Sise Cliff is directly exposed to the river flow of the Sardakhskaya channel, which hits the cliff at an angle of ∼30°. The position of the thick ice-rich deposits at this bend of the channel causes favorable conditions for erosion, removal of large sediment masses, and the formation of a steep cliff.
Materials and Methods
Calculation of Total and Annual Erosion Rates
For the detection and analysis of recent and historic cliff retreat rates, we used remote sensing imagery from a variety of high to medium resolution optical sensors with different spatial resolution.
Image Data Sets
For historical long-term analysis, we used Corona and Hexagon satellite images from 1965 and 1975 (Table 1). For the following time steps, we used Landsat data (L5, L7, L8) for the years 2000, 2005, 2010, and 2015. Unfortunately, Landsat data from before 1999 is only sparsely available over large parts of NE Siberia due to the lacking on-board memory on the platform and the region being outside of footprints of high latitude satellite receiving stations (Goward et al., 2006). Spatially very high-resolution imagery from the DigitalGlobe constellation was available for 2014 (GeoEye). Additionally, we used Planet cube-sat imagery (Planet Team, 2017) from September 2018 to finalize the long-term erosion analysis.
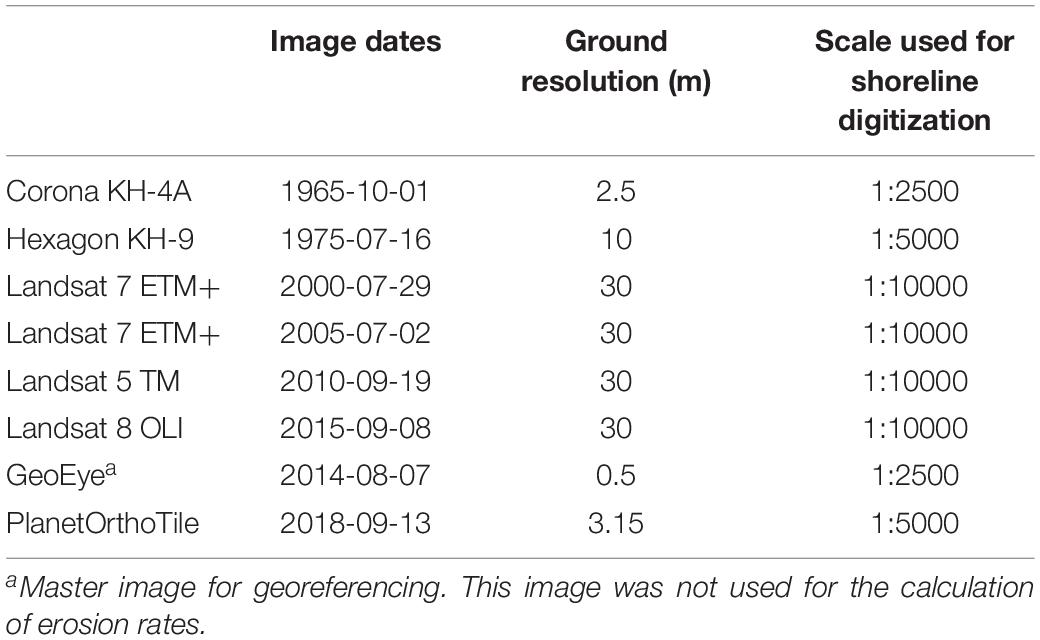
Table 1. Images used for calculation of erosion rates.
While Landsat data is already delivered as geometrically and radiometrically corrected data, the Corona, Hexagon and high-resolution images were orthorectified and georeferenced using the GeoEye image from 2014 as a base image (see Table 1) and projected to WGS84 UTM 52N. The matching between images for the georeferencing was done by selecting features that we considered most stable in a landscape that is affected by change and does not contain artificial human-made structures. Such features included the centers of small circular thaw ponds that largely expand radially or polygonal ponds and ice wedge junctions that are rather stable over the decadal time scales analyzed with this imagery.
Calculation of Erosion Rates
Since the Sobo-Sise Cliff is a nearly vertical cliff with up to 27.7 m height, it was sufficient to manually digitize the upper cliff line on the selected imagery at an appropriate image scale (see Table 1) to quantify the cliff retreat rates between several points in time. Using the oldest image in the time-series, we also digitized the boundaries between yedoma uplands and thermokarst basin based on the Corona image to determine the volume of yedoma deposits, which was eroded since 1965 and to separate it from non-yedoma deposits.
For calculating erosion rates, we used the Digital Shoreline Analysis System 5.0 (DSAS; Himmelstoss et al., 2018) in ArcGIS 10.5. DSAS calculates erosion rates between given shorelines along defined transects perpendicular to a defined baseline. In DSAS the “baseline” was defined as the straight middle line between the 1965 and 2000 cliff lines. We then cast transects at an interval of 50 m for the entire 1,660 m coastal section (resulting in 32 transects) to calculate erosion rates for individual cliff segments. We calculated erosion rates for the entire period between 1965 and 2018, as well as several sub-periods, including 1965–1975, 1975–2000, 2000–2005, 2005–2010, 2010–2015, and 2015–2018. Erosion rates are given as end point rates (EPR) of DSAS. The digitized cliff fronts for each time step as well as the erosion rates for each of the 32 segments are available on the PANGAEA data set repository (Nitze et al., 2020).
For volumetric erosion estimates, we extracted 10 m ARCTIC DEM elevation data (Mosaic v3.0 10m: tile 59_43) (Porter et al., 2018), based on representative sample areas in proximity to the cliff line for yedoma areas and the eastern and western alases as well as the river water level. We extracted elevation statistics for these training areas (see Supplementary Figure S3) and transformed absolute elevation to relative elevation above the mean water level. However, as we do not have any height information for the older time steps (prior to 2000) and assume, based on topographic maps and the Corona scene, that there existed a down-slope toward the Sardakhskaya channel sometime prior to 2000, we do not calculate volumetric, C and N erosion rates prior to 2000.
Calculation of Total and Annual C and N Loss
Elemental Composition and Stock Calculations
Frozen sediment samples were taken by rope climbing across the entire vertically exposed yedoma sequence at 0.5 m intervals at three locations in close proximity and overlapping vertical profiles during an expedition to Sobo-Sise in July 2018 (Wetterich et al., 2019, 2020). In total, 60 permafrost samples were used for analyses of organic matter properties. The gravimetric segregated and pore ice content was measured in the field as difference between wet and dry weights after careful drying on a wood oven. The ice content is expressed as weight percentage (wt%, van Everdingen, 2005).
Gravimetric ice content for the samples was then converted into volumetric ice content by assuming ice saturation if the ice content is >20% (following Strauss et al., 2012) and an ice density of 0.917 g cm–3. For estimating the segregated and pore ice volume in %, we assumed a 3-component model of the cliff consisting of ice, a mineral component of the sediment and organic matter, and assuming component densities of 2.65 g cm–3 (Lide et al., 2008) and 0.25 g cm–3 (Adams, 1973) for the latter two components, respectively. We used this for estimating the total volume of ice and organic matter at the Sobo-Sise Cliff.
The total C and total N content of the sediment samples were measured with a Vario EL III and total organic C with a Vario Max C elemental analyzer (Elementar Analysesysteme, 2007, 2011). Results are expressed as weight percentage (wt%) of the dry sediment samples. The soil organic carbon (SOC) density, which is organic C content per soil volume unit (kg C m–3), was quantified following Strauss et al. (2012). Prior to conversion of the measured weight-based total organic C values to the volume-based SOC, the bulk density was estimated according to Strauss et al. (2012). More details on the bulk density calculation are presented in the Supplementary Material (section 2).
In addition, dissolved organic carbon (DOC) concentrations (mg L–1) of segregated and pore ice were measured in 29 samples from throughout the cliff. Therefor meltwater was filtered in the field with gum-free syringes equipped with glass fiber filters (Whatman GF/F; pore size: 0.7 μm), which were rinsed with ≥20 ml of sample, and acidified with 20 μL HCl suprapur (30%) to pH < 2 in order to prevent microbial conversion. In the laboratory, samples were analyzed with a high-temperature (680°C) combustion total organic C analyzer (Shimadzu TOC-VCPH). This allows us to make a complete estimation of C loss through erosion of Sobo-Sise Cliff. For N we refer to the N loss, without differentiation between particulate and dissolved N or the form of N (e.g., organic or inorganic).
Ice Wedge Content Estimation
For the estimation of ice wedge content (IWC) we used photographs with frontal views of the Sobo-Sise Cliff taken during field visits in summer 2014, 2015, and 2019. All analyzed photographs and front cliff sections are provided in the Supplementary Figure S4. In these photographs, we identified vertically continuous sediment sections and ice wedges to quantify volumetric ratios between sediment and ice wedge. We correlated the width of ice wedge sections with the width of the adjacent sediment section assuming that ice and sediment segments dissecting the entire cliff were eroded perpendicular to the polygon structure (Figure 2). This ice wedge to sediment column width ratio (I:Swidth) was calculated according to Eq. (1).
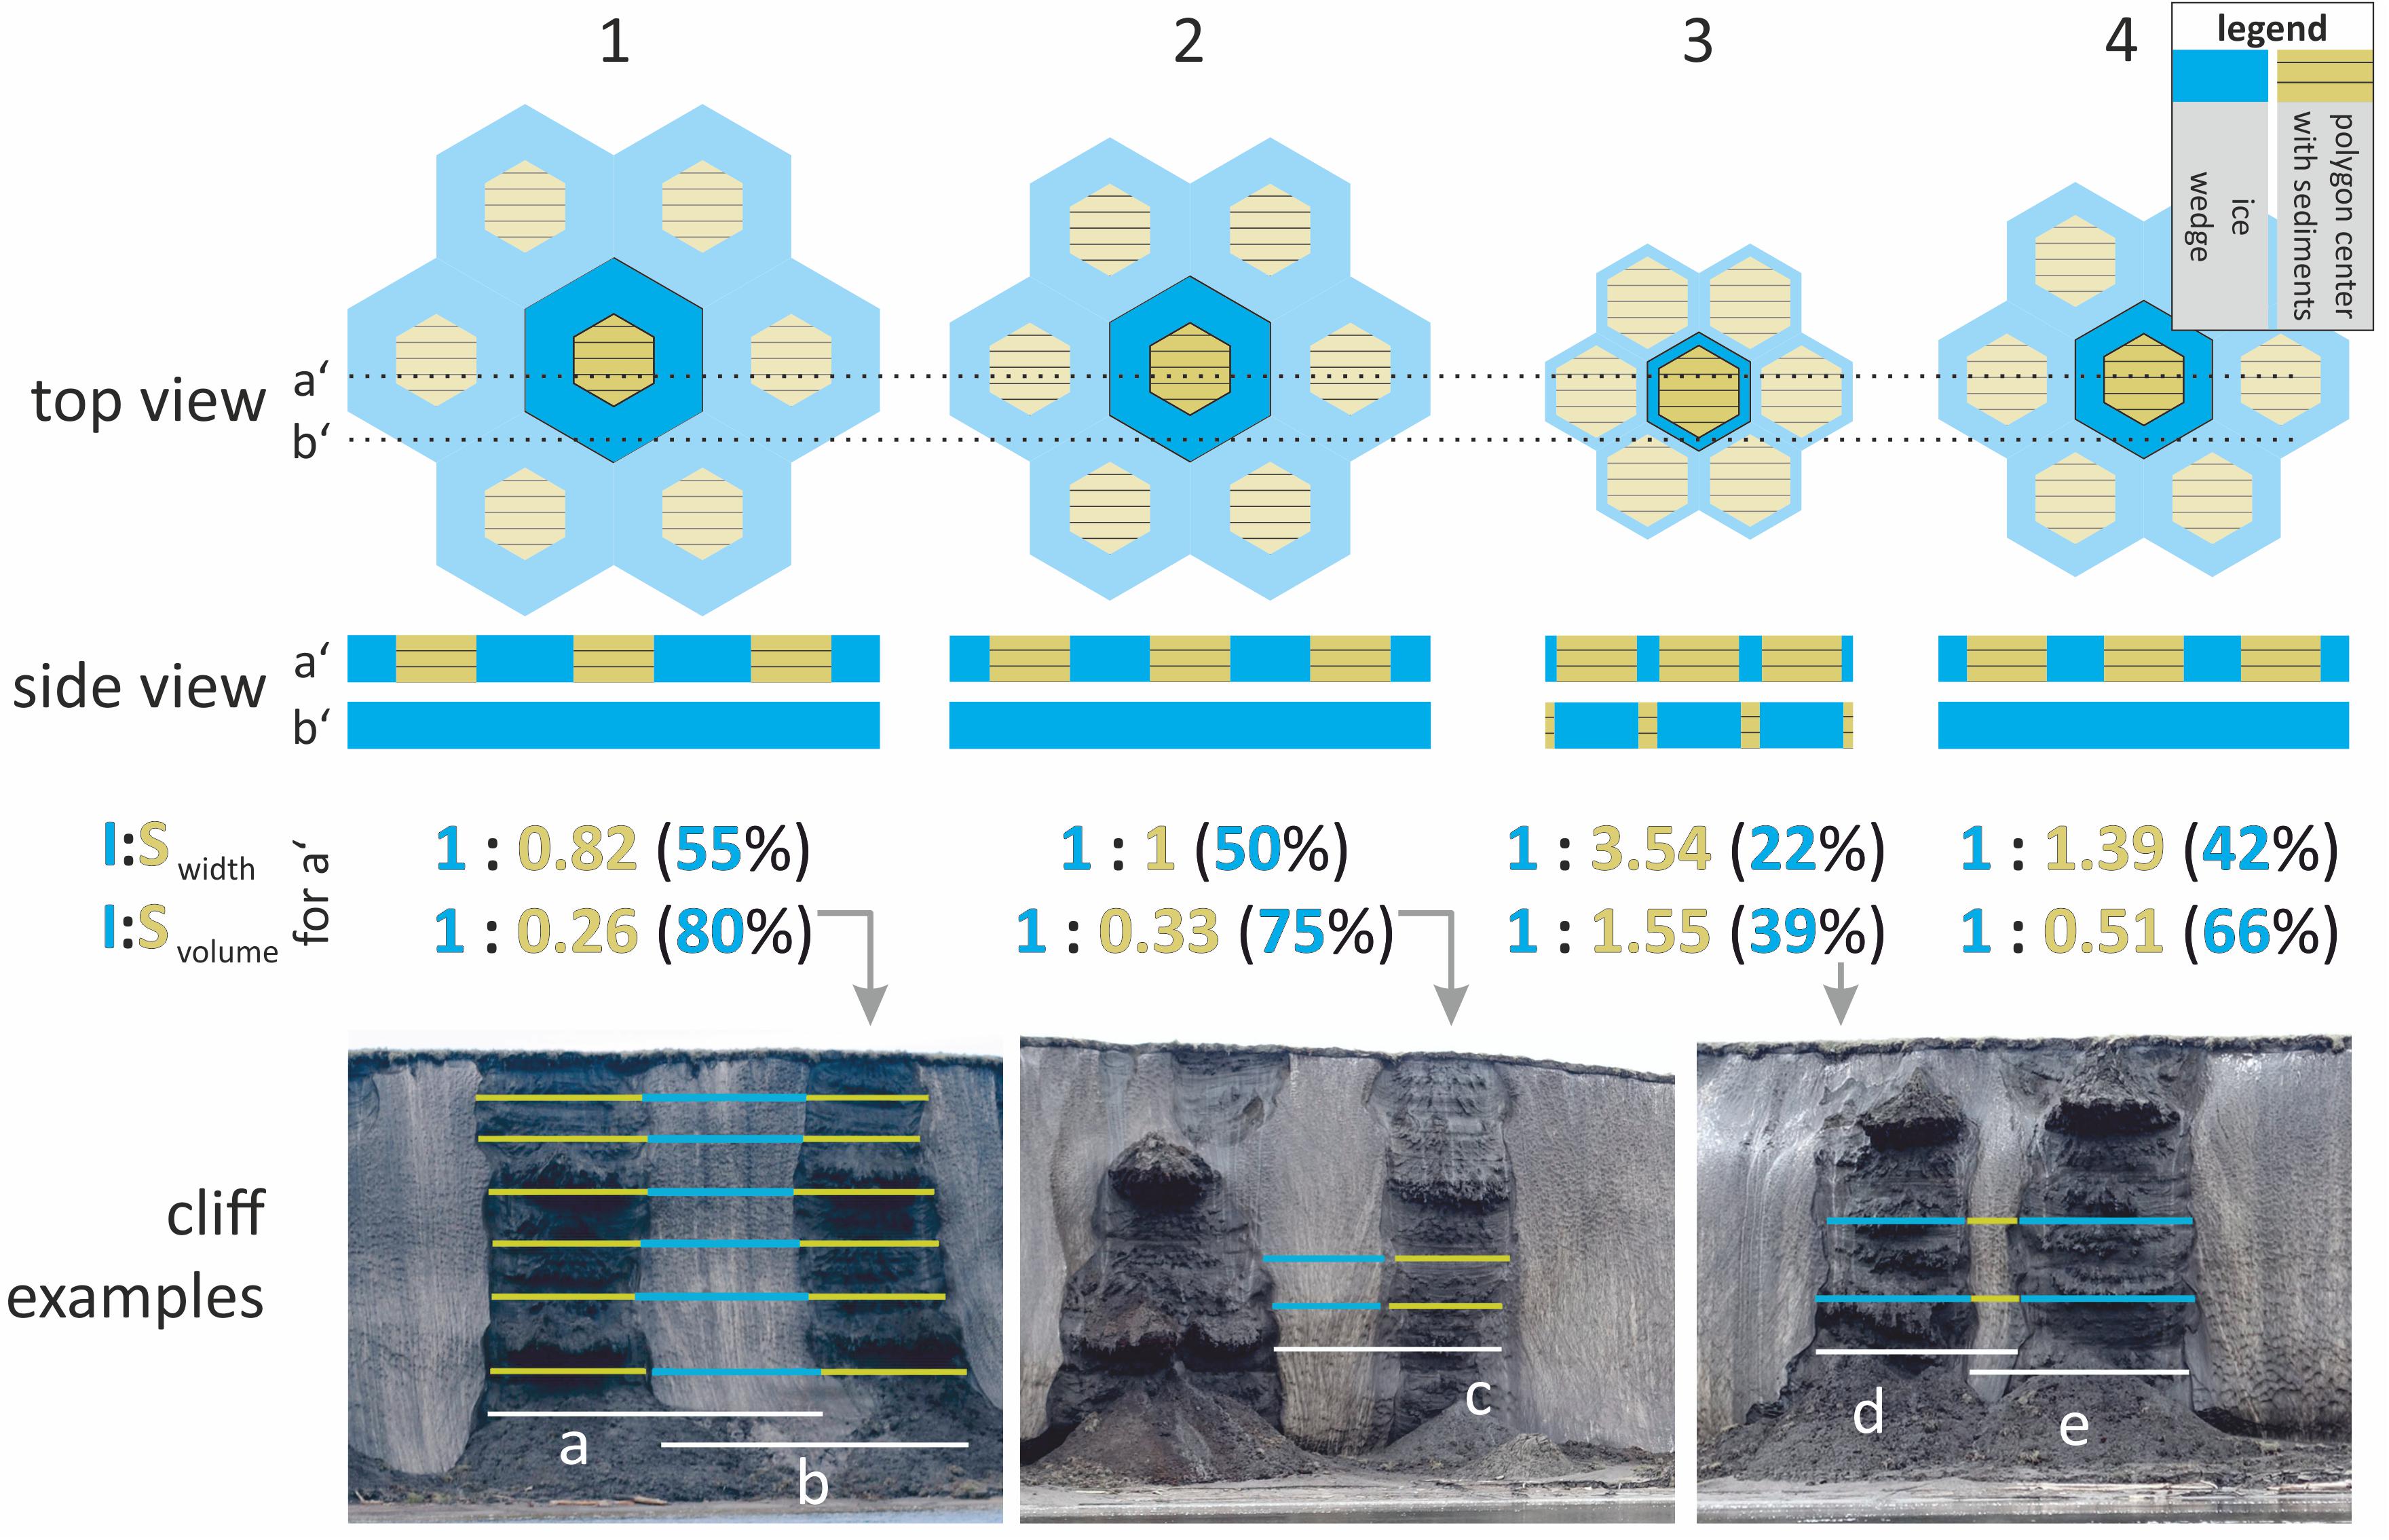
Figure 2. Quantification of ice wedge to sediment ratio for the yedoma exposed at Sobo-Sise Cliff. Top view shows an ideal distribution of polygons in the landscape, where inner polygons (sediment, yellow) are surrounded by ice wedge containing outer polygons (blue). In the panels 1–3, the size of ice wedges is declining from left (1) to right (3), whereas column 1 shows the maximum width of ice wedges at Sobo-Sise Cliff; column 2 shows an equal ice to sediment ratio (1:1) and column 3 shows the minimum ice wedge width at Sobo-Sise Cliff. Column 4 shows the calculated average ice wedge content at Sobo-Sise Cliff (no cliff example photograph). The side view (or cliff view) shows a cross section of the polygons where profile a′ indicates an ideal cross section cutting the polygon centers at true width (leading to sediment sections which dissect the entire Sobo-Sise Cliff from top to bottom), whereas b′ shows a cross section with masked polygon centers leading to an ice-dominated cliff wall. The I:Swidth (width ice: width sediment) was determined based on photographs from the cliff front visible in the lowermost cliff example panels according to the sections a–e. The percentage in brackets indicates the relation between the width of the ice wedge in relation to the width of the sediment section. This allowed calculating the I:Svolume (volume outer polygon: volume inner polygon) at the Sobo-Sise Cliff according to Eqs 1–3 and in a final step the ice wedge content (blue numbers in percentage). The cliff examples show three photographs with typical side views of the Sobo-Sise Cliff which match the top and side view of columns 1, 2, and 3 (photographs by T. Opel (left) and A. Fricke (middle and right). The lower case letters a–e indicate the analyzed I:Swidth across difference depths of the Sobo-Sise Cliff. More details on the analyzed sections are given in the Supplementary Table S1 and Supplementary Figure S4. The average ice wedge content at Sobo-Sise Cliff is 66 vol% with an I:Swidth of 1:1.39 (or 0.72). This case is shown in column no. 4.
Further, assuming an ideal polygonal distribution in the landscape prior to erosion, the size of sediment columns (inner polygon) was related to adjacent ice wedges (outer polygon) (Figure 2). The I:Swidth was then used to calculate the volume of both inner (VIP; Eq. 2) and outer polygon (VOP; Eq. 3) and in a final step to calculate the amount of ice wedge content (IWC; Eq. 4) within the landscape.
For the diameter of the inner polygon (a) and the vertical height (h) of a polygon any reasonable realistic number for known polygon diameters and vertical heights can be chosen, since we calculate with a ratio, this does not change the final result of ice wedge content. I:Swidth for the 10 analyzed sections varied from 0.28 to 1.21 (see Supplementary Table S1). For each section, we calculated the ice wedge content and then calculated the average ice content over all our ten measured sections. In addition, to get an estimate for the total landscape ice volume we used Eq. (5):
Calculation of Annual C and N Loss
The data on ice volume and the mass of the mineral and organic components of the yedoma as well as the data on the retreat rates of the Sobo-Sise Cliff were used to estimate the amount of eroded sediments, SOC, DOC and N. According to Kanevskiy et al. (2016) we estimated the total volume (V) of frozen deposits (sediment and ice) transported annually to the river from the retreating bank using Eq. (6).
L is the length of the cliff [m], H is the average height of the cliff [m above mean river water level], and R is the average retreat rate [m yr–1] for the cliff during the period of observation. We then calculate the flux of the dry weight of sediments (Sedflux), the flux of dry weight of soil organic carbon (SOCflux) and the flux of dissolved organic carbon (DOCflux) lost by erosion and transported to the river (Eqs 7–9):
The flux of the dry weight of nitrogen (Nflux) was calculated like SOCflux following Eq. (8) by replacing organic matter density by the N density. For DOCflux (Eq. 9) the segregated and pore ice volume (ice content) was considered. In addition, the volume of ice was converted in volume of water with the density difference between ice and water of 0.917. In order to get the complete DOC loss from Sobo-Sise Cliff, ice wedge DOC flux was calculated including the mean DOC concentration of 11.1 mg L–1 for yedoma ice wedges based on Fritz et al. (2015), since we do not have own DOC concentrations from ice wedges at Sobo-Sise Cliff. This was combined with the total volume of ice wedges at Sobo-Sise Cliff derived from the ice wedge content estimation (see section “Ice Wedge Content Estimation”). As a result, the DOCflux of Sobo-Sise Cliff is the sum of the DOCflux from segregated and pore ice and the DOCflux from eroded ice wedges for each investigated time period. In consequence, the total C flux from the yedoma Sobo-Sise Cliff includes the SOC, DOC from segregated and pore ice, and DOC from ice wedges. For this study, we only focus on C and N loss for the yedoma cliff. The two alas basins in the east and west of Sobo-Sise Cliff are eroding as well but were not considered here.
Bathymetric Survey Along the Sobo-Sise Cliff
In order to better understand how the fluvial erosion processes contribute or drive the cliff retreat a bathymetric survey was done in August 2016 during calm weather and at low speed (<4 km h–1) with a Humminbird 899cxi HD SI COMBO to detect the water depth in front of Sobo-Sise Cliff. Along four parallel and one zigzag profile lines, about 9200 depth measurements were collected. The surveyed area in the Sardakhskaya channel captured the entire cliff length and included parts of the adjacent alas basins. Bathymetric profiles covered a zone of typically 50 m width off the lower cliff base. Average water depth was 7.2 ± 4.9 m.
Results
Sobo-Sise Cliff Characteristics
According to the Arctic DEM, the Sobo-Sise Cliff (Figure 3a) has an average height of 22.3 m above mean river water level (maximum height: 27.7 m) extending for 1,660 m from 72°32′34 N/128°15′59 E to 72°32′06 N/128°18′21 E in a concave shape along the Sardakhskaya channel in the Eastern Lena River Delta. The cliff emerged and has developed its shape from a formerly undisturbed yedoma upland gently down-sloping to the Sardakhskaya Lena River channel. Interpreting topographic maps that are based on aerial surveys from the early 1950s, the riverbank next to the yedoma hill was lower than 10 m and likely consisted of alas deposits. Over time riverbank erosion reached the yedoma upland triggering the formation of the cliff likely during the early 1970s. The cliff front is dominated by late Pleistocene ice wedges stretching the entire height of the cliff. Our ice wedge volume estimation resulted in an average of 66 vol% of wedge ice at Sobo-Sise Cliff and 34 vol% of sediments (Figure 2) with high segregated and pore ice contents. The base of the cliff is often not visible due to sediment debris falling from the cliff onto the beach, forming piles that are rapidly removed by the river.
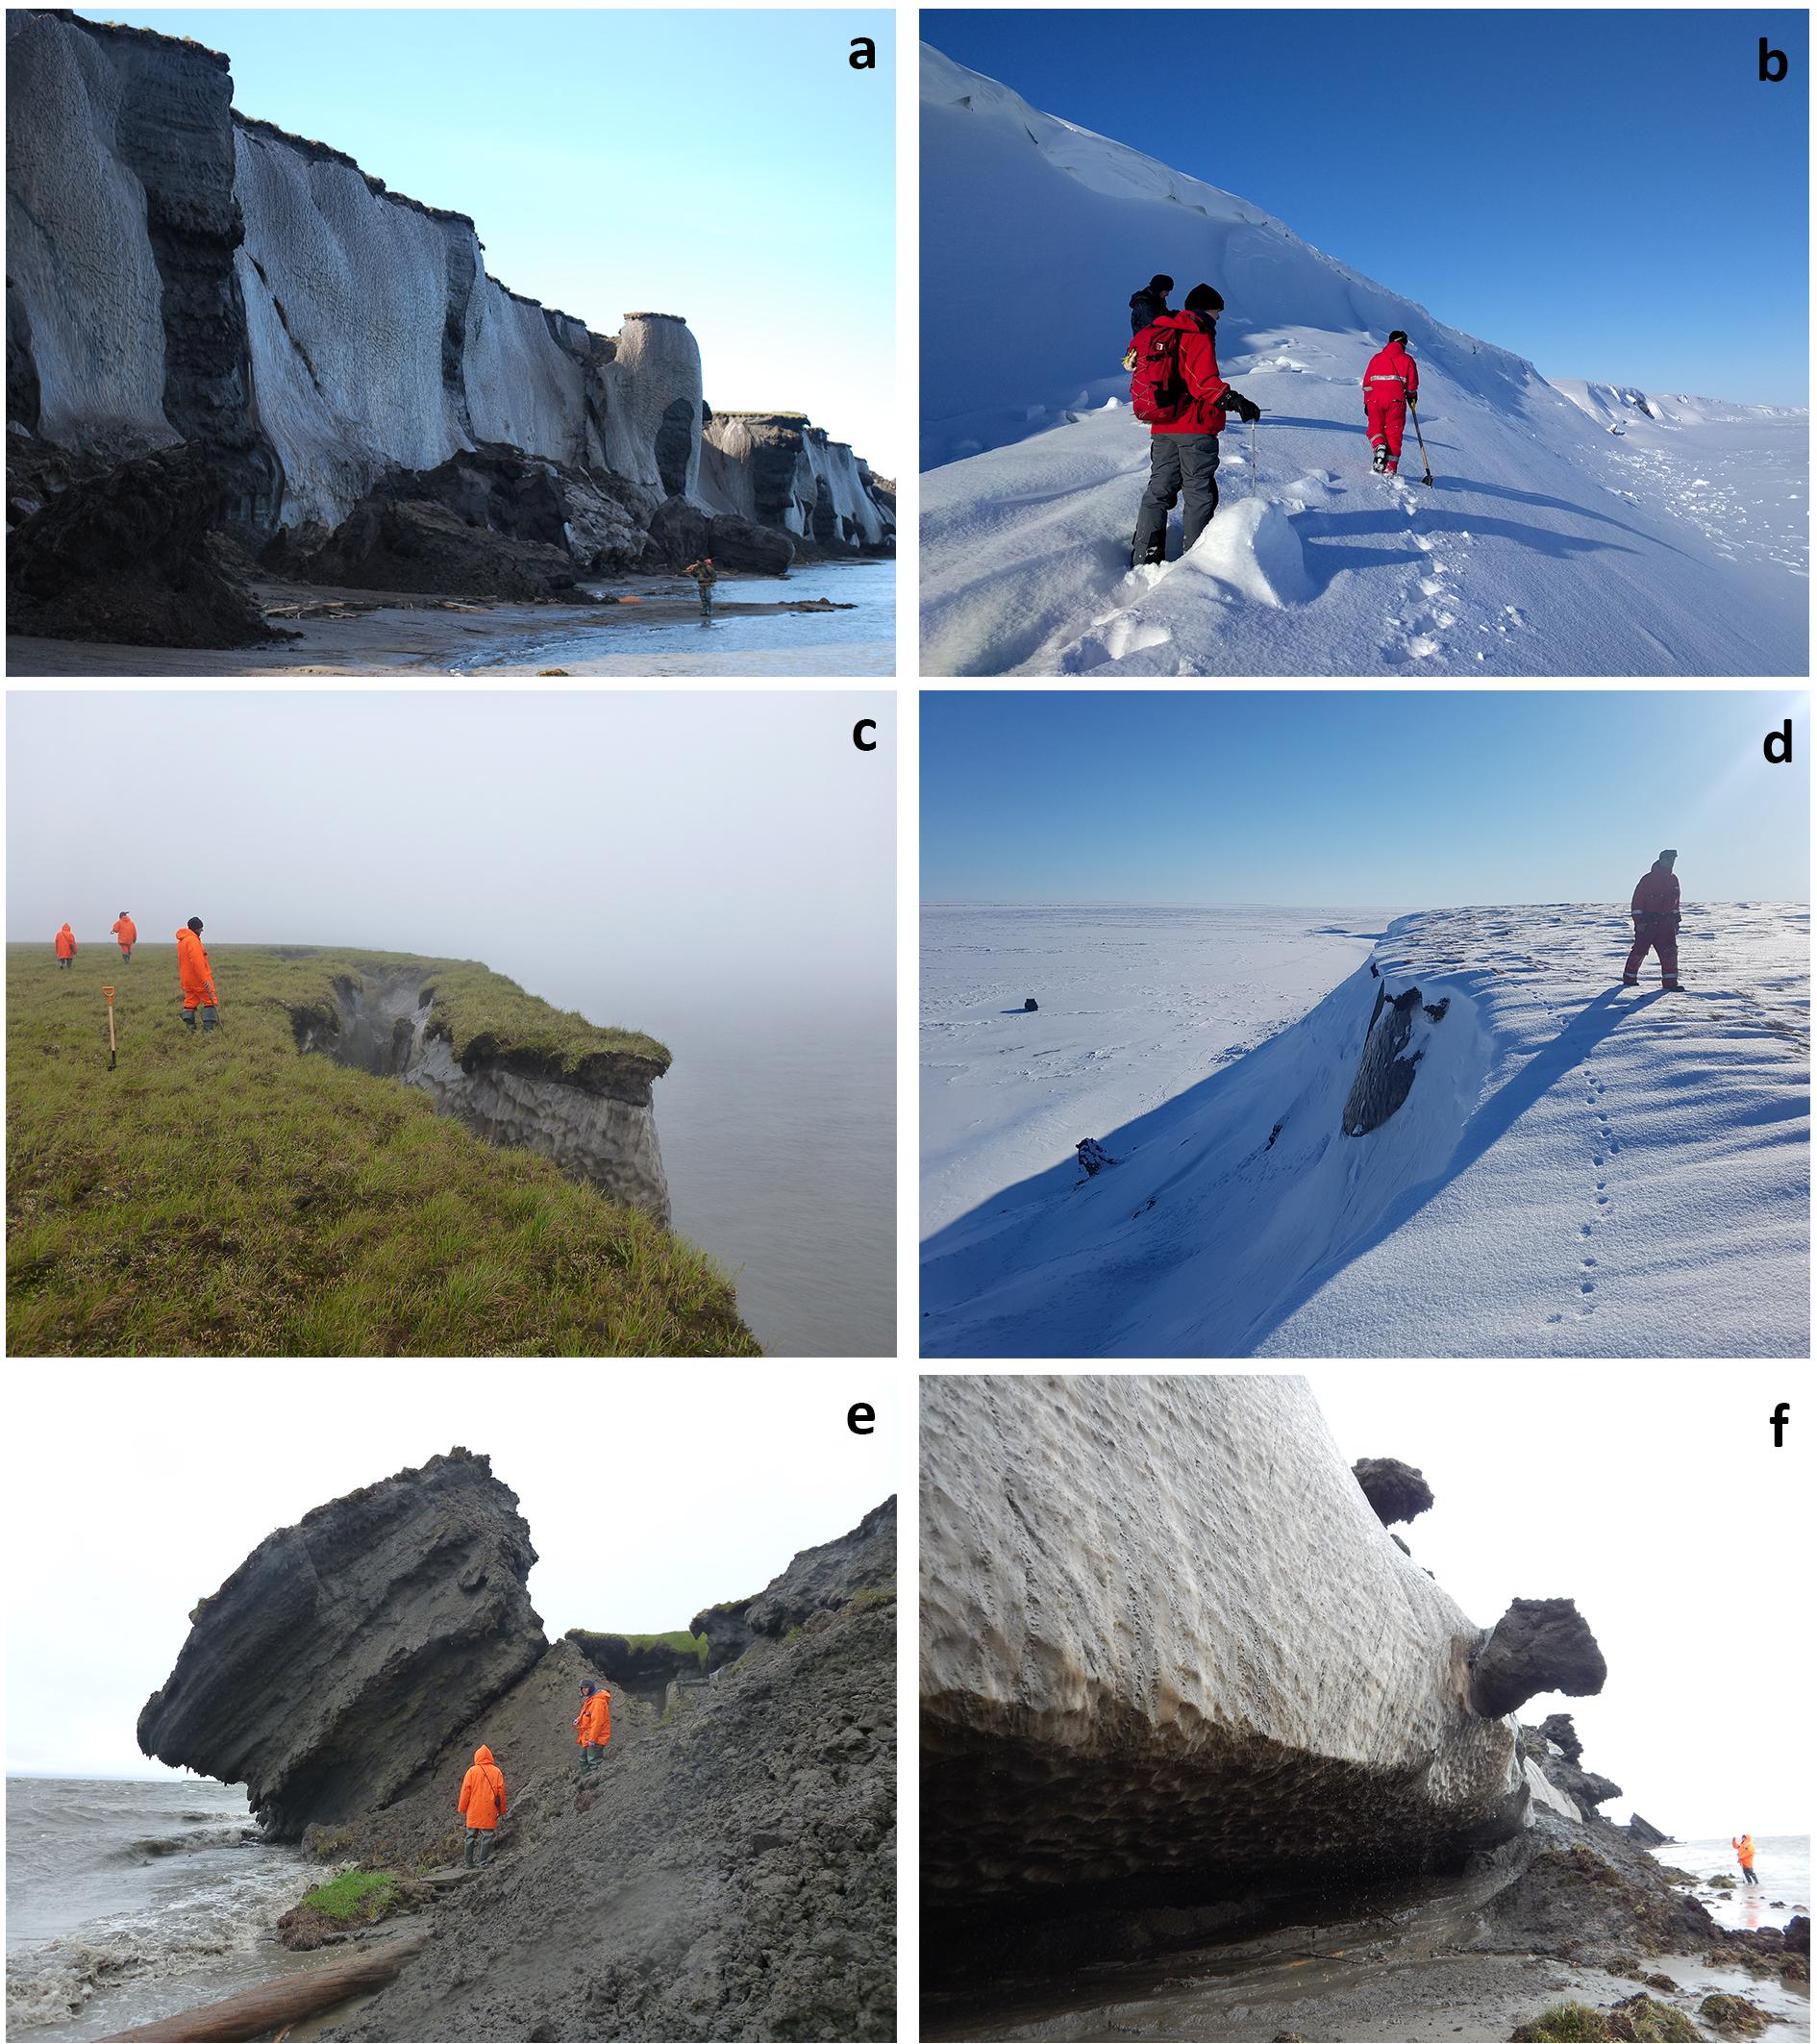
Figure 3. (a) Sobo-Sise Cliff in August 2014 with person for scale (photo: T. Opel, 11 August 2014), (b) Sobo-Sise Cliff in April 2019 with snow drifts (photo: J. Strauss, 5 April 2019), (c) cliff-top with a large crack (photo: G. Grosse, 12 August 2014), (d) cliff-top with thin snow cover (photo: J. Palmtag, 5 April 2019), (e) collapsing sediment block at the Sobo-Sise Cliff (photo: G. Grosse, 12 August 2014), (f) thermo-erosional niche and peat blocks at the base of the cliff (photo: M. Fuchs, 12 August 2014).
The sediment columns have an average segregated and pore ice content of 65.7 ± 9.0 vol%. This results in a total ice volume of 88.4 vol%. The segregated and pore ice content is included in the dry bulk density of the sediment and is therefore integrated in the calculation for mean SOC and N contents. Average dry bulk density of the Sobo-Sise Cliff sediments is 0.7 ± 0.2 g cm–3 resulting in average SOC and N contents of 26.2 ± 16.8 kg C m–3 and 2.1 ± 1.1 kg N m–3, respectively. If accounted for ice wedge volume (66 vol%) on Sobo-Sise Cliff, average SOC and N contents are 8.9 ± 5.7 kg C m–3 and 0.7 ± 0.4 kg N m–3. Beside SOC, DOC was analyzed from segregated and pore ice within the sediment column. Mean DOC content for Sobo-Sise Cliff is 315.5 ± 188.0 mg L–1 or 0.316 kg m–3. For comparison, the average DOC content for yedoma ice wedges from Fritz et al. (2015) is 11.1 mg L–1 or 0.011 kg m–3.
During the ice-free months (June–September), the cliff is prone to erosion mainly by flowing river water and air temperatures above freezing. Thermo-erosional niches (Figure 3f) form at the base of the cliff leading to collapse and failure of large ice and sediment blocks (Figures 3c,e). In winter (October–May), low negative air temperatures and presence of a stable ice cover on the river prevent ground ice melt and permafrost thaw on the subaerial part of cliff, while below river ice permafrost thaw continues undercutting the cliff during the winter providing favorable conditions for block collapse in the following summer. The wind exposed cliff top is covered by a thin snow cover (<20 cm; April 2019), whereas large snow packs accumulate in windblown drifts at the cliff base (Figures 3b,d).
Dense bathymetric surveys in front of Sobo-Sise Cliff were combined with synchronous topographic survey data. The interpolated surface shows an almost immediate downward extension of the steep Sobo-Sise Cliff slope below river level (Figure 4). Within a 20 m wide shoreface zone water depths were 2.2 ± 1.2 m, while the adjacent 50 m of the cliff had mean depths of 10.3 ± 3.7 m, while maximum depths were recorded down to 19.1 m. These data suggest a narrow zone next to the cliff base, where river ice may freeze down to the bottom. Because the bathymetric survey was conducted in August several months after river ice breakup, the shoreface configuration might have changed considerably, potentially allowing for configurations during winter with a negligible bottom fast ice formation that enables direct contact of the river water flow with the cliff base and permafrost thaw throughout the winter.
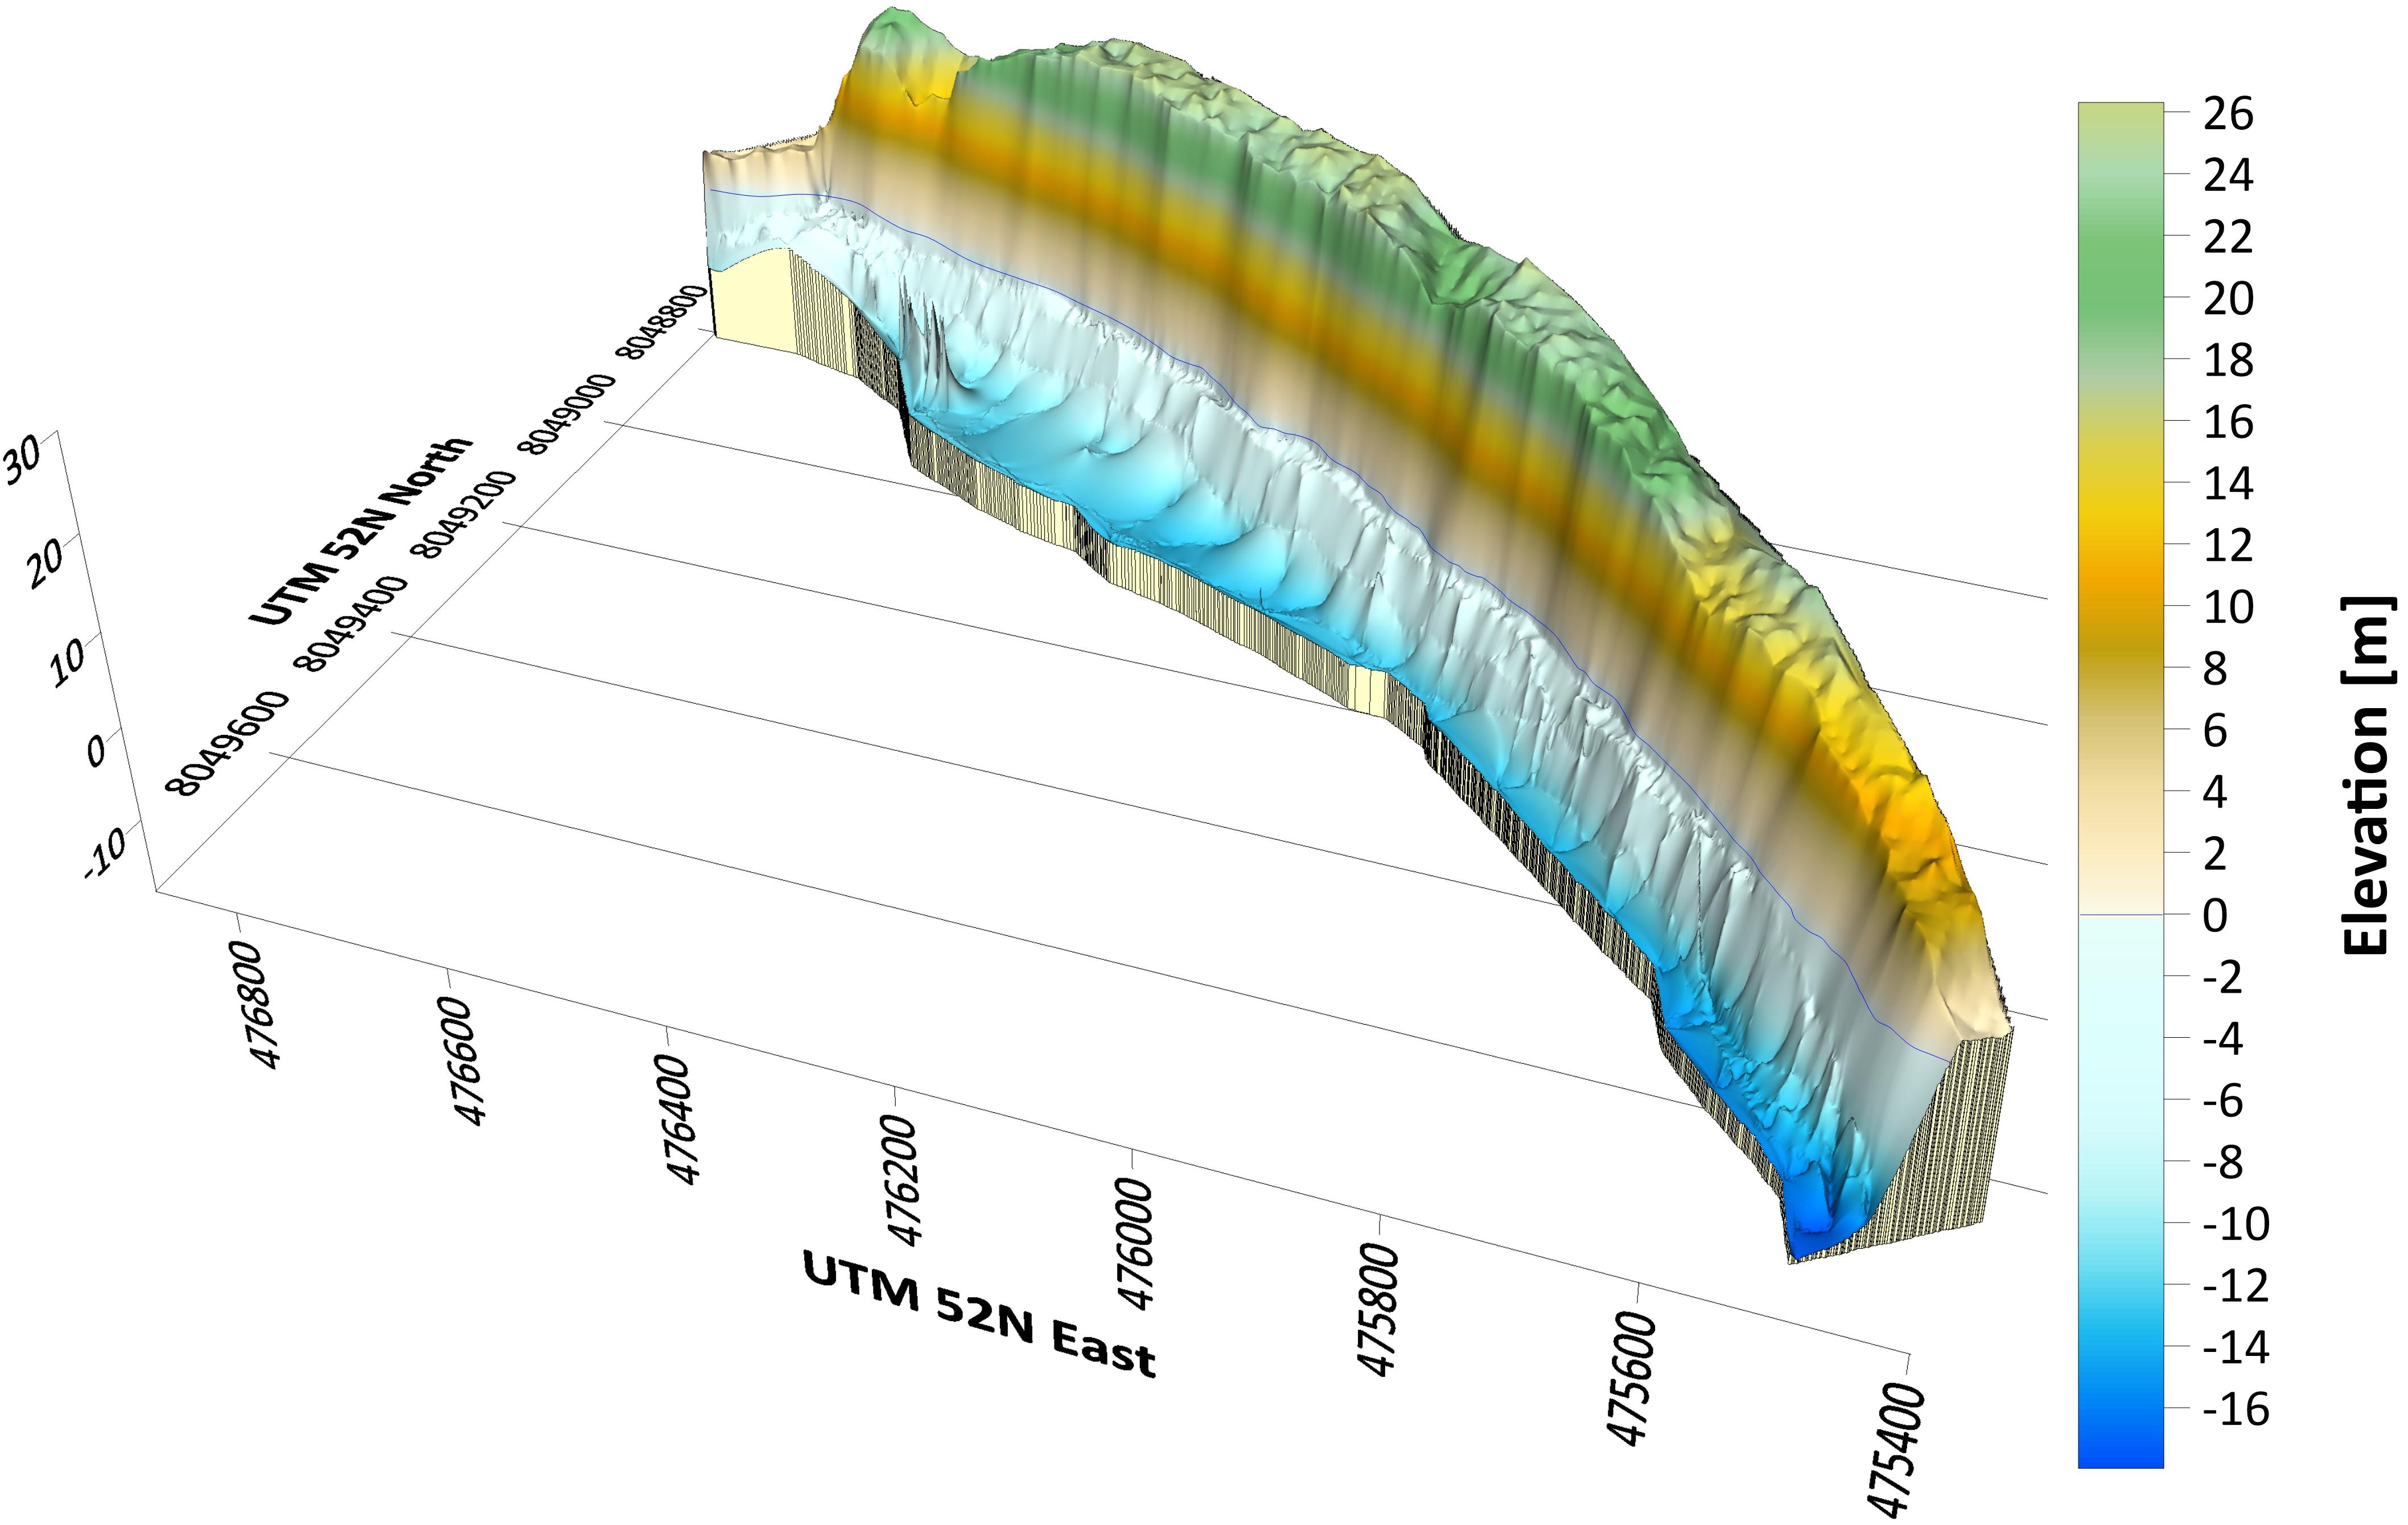
Figure 4. 3D-view of combined topographic and bathymetric surveys at Sobo-Sise Cliff in August 2016 showing cliff height configuration and steep bathymetric gradients directly off the riverbank.
Total and Annual Erosion Rates
The total erosion of the Sobo-Sise Cliff from 1965 to 2018 ranged from 322 to 679 m (Figure 5). The highest mean annual erosion rates (ERmax) occurred in the downstream section of the cliff with a rate of 12.8 m yr–1 whereas the upstream edge has a mean annual erosion rate of 6.1 m yr–1. This results in an overall mean annual erosion rate (ERmean) for the entire Sobo-Sise Cliff of 9.1 m yr–1 ranging from 4.8 to 15.7 m yr–1 for the mean values of the different periods. The cliff’s planimetric shape changed from convex in 1965 to its present concave shape and the length of the cliff with exposed yedoma is ∼610 m longer in 2018 than in 1965. The point of maximum erosion gradually moved upstream over time. However, ERmean since 2005 are more uniform along the Sobo-Sise Cliff compared to the period before 2000.
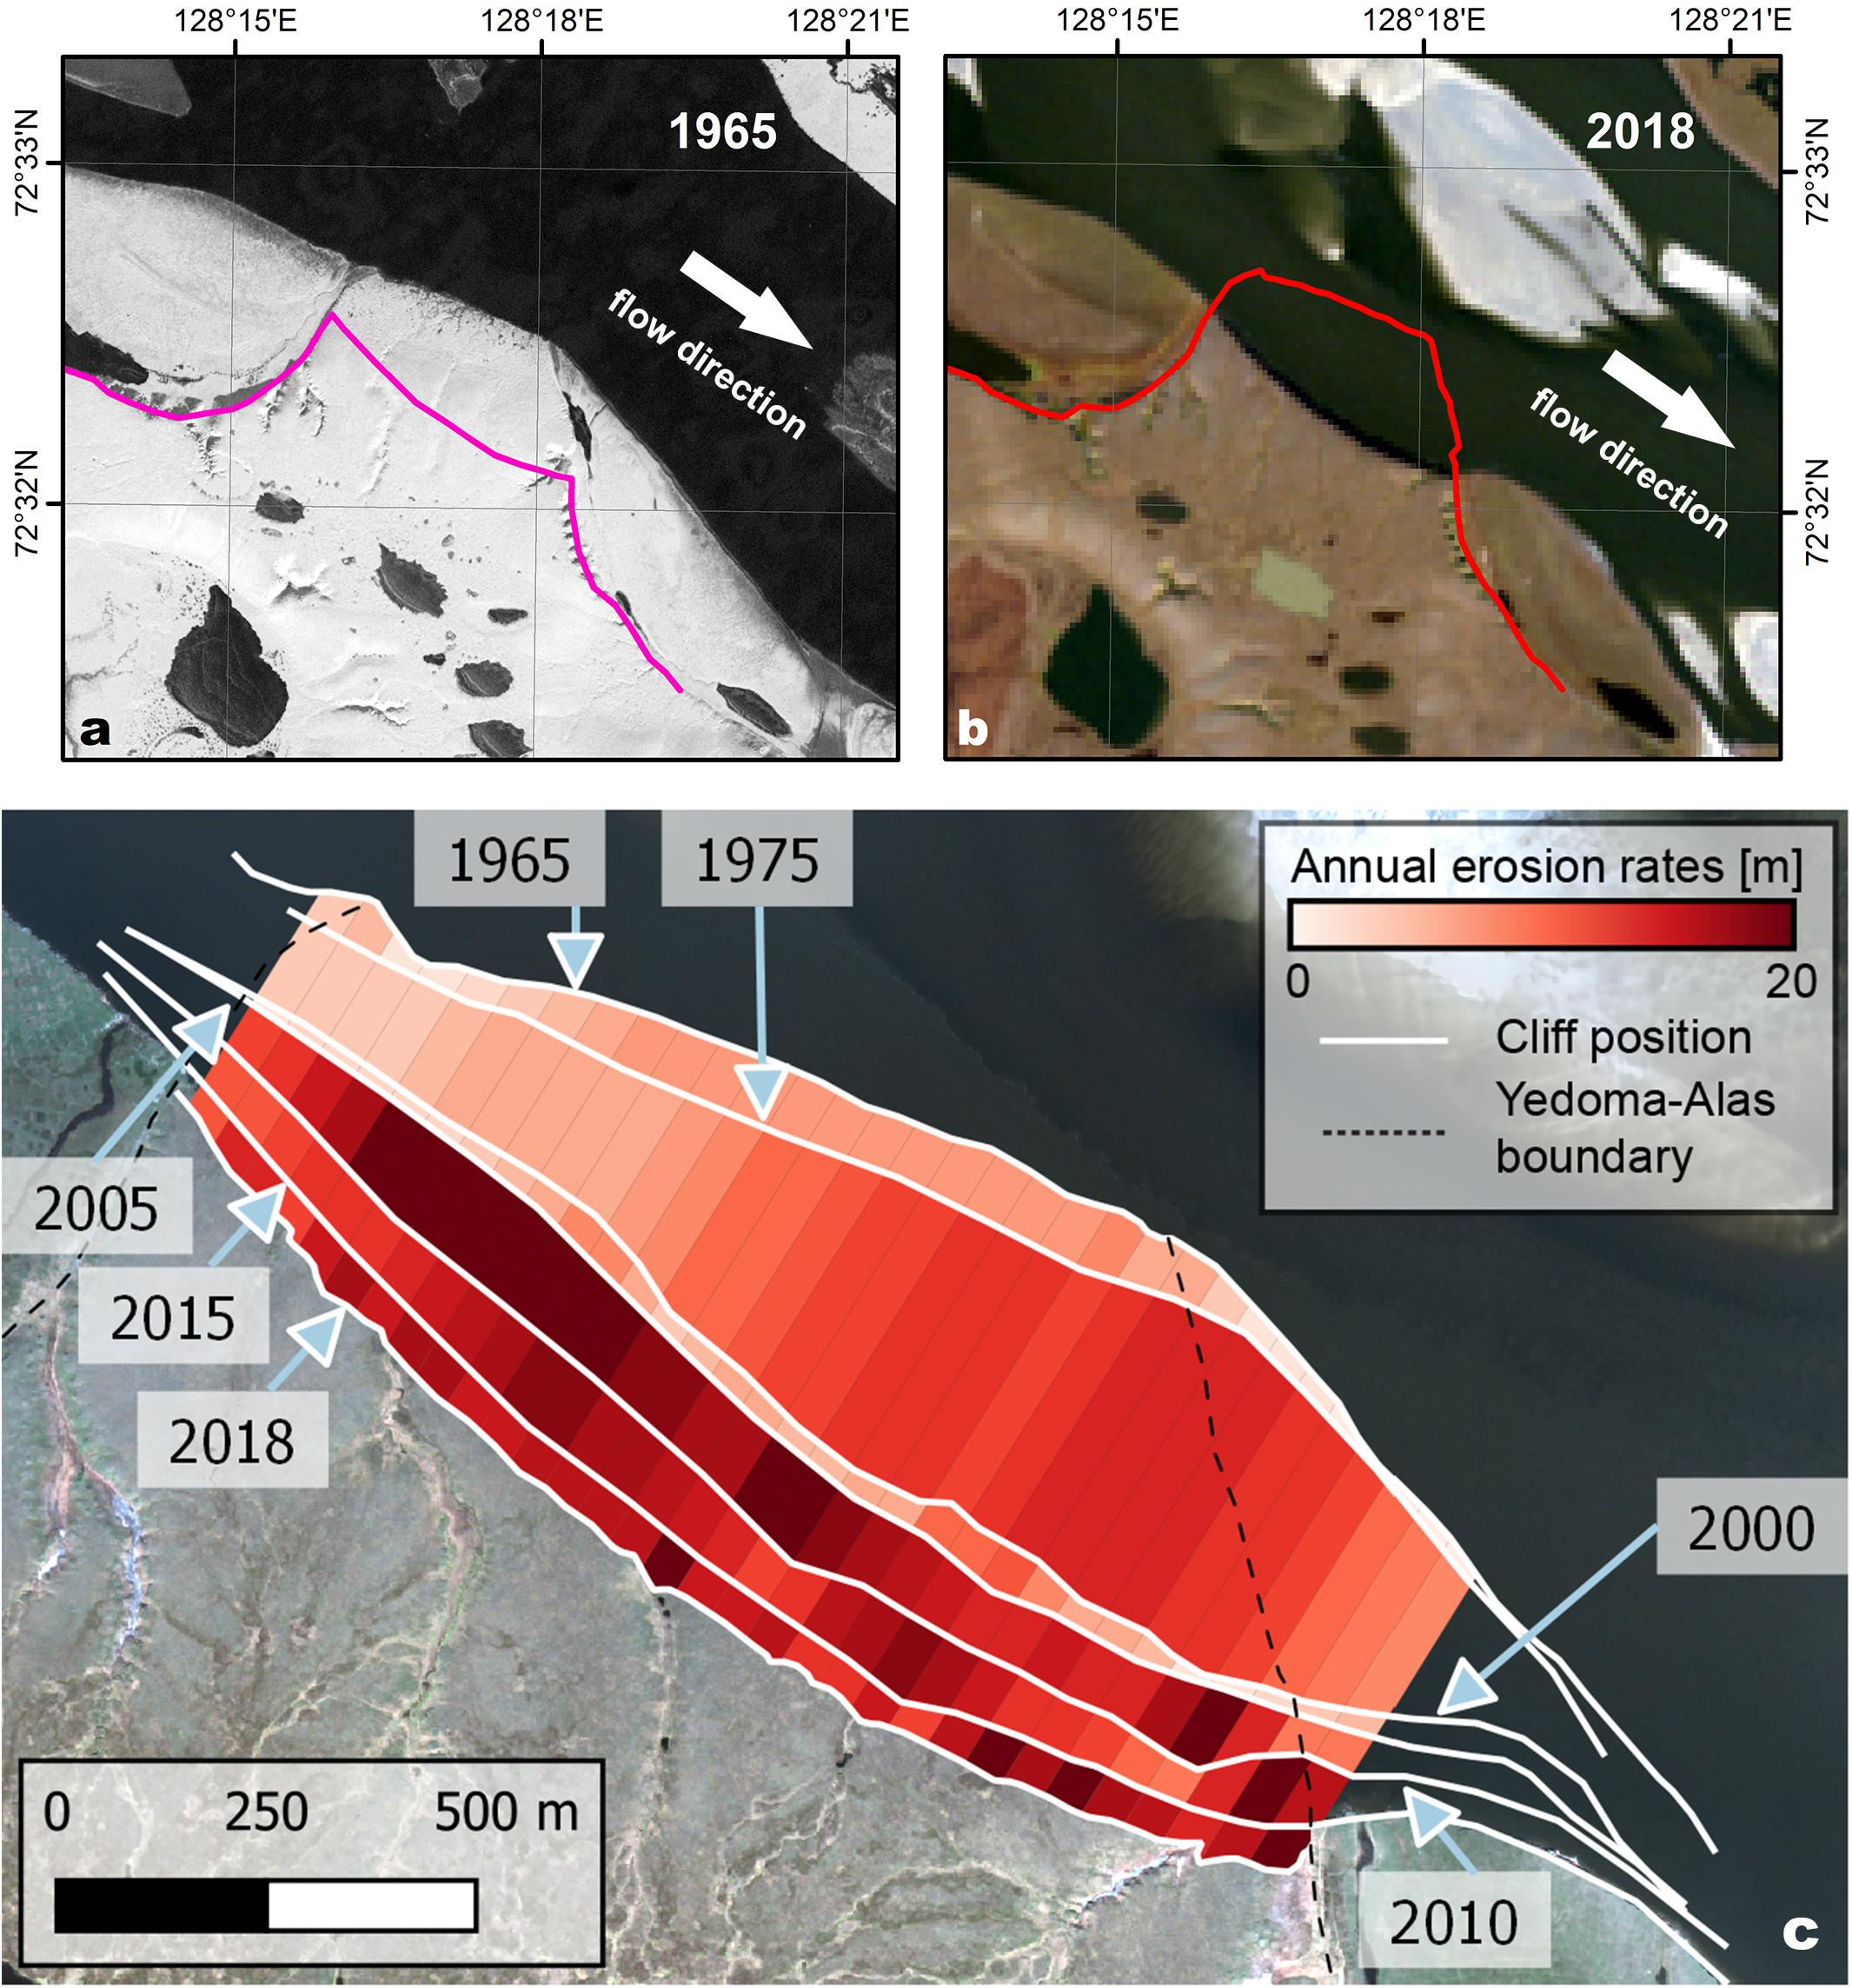
Figure 5. Erosion rates at Sobo-Sise Cliff. (a) Corona image from 1965 showing the Sobo-Sise Cliff. Line in purple shows the cliff front in 2018. (b) Landsat 8 image from 2018 showing the Sobo-Sise Cliff. Line in red shows the cliff front in 1965. (c) Average annual erosion rates per segment and cliff lines for periods 1965–1975, 1975–2000, 2000–2005, 2005–2010, 2010–2015, and 2015–2018. Background image: GeoEye from 2014-08-07. Cliff lines were digitized on Corona (1965), Hexagon (1975), Landsat (2000, 2005, 2010, 2015), and Planet imagery (2018).
Over the entire period from 1965 to 2018 a total area of 0.88 km2 was eroded, of which 0.77 km2 (87.9%) were yedoma and 0.11 km2 (12.1%) drained lake basin. In general, erosion rates increased over time but also show short term variation (Table 2). The ERmean increased considerably from 4.8 m yr–1 in 1965–1975 to 15.7 m yr–1 in 2015–2018, while the ERmax increased from 8.2 to 21.1 m yr–1.
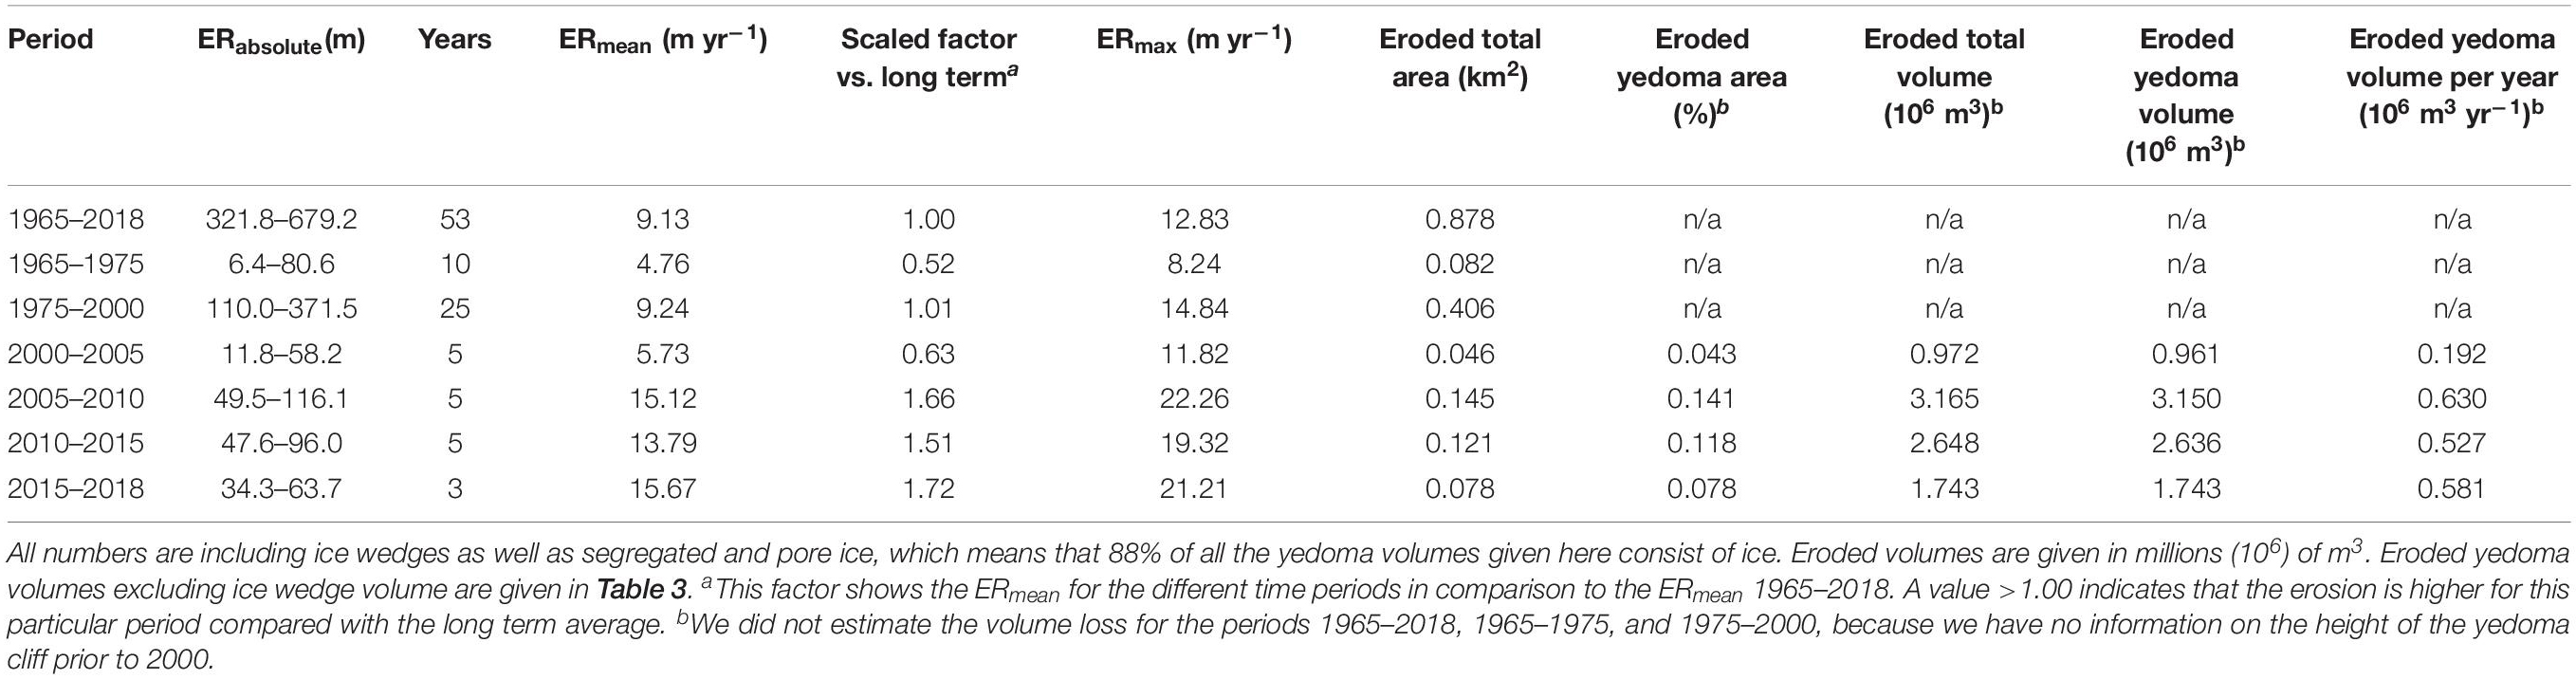
Table 2. Erosion rates of Sobo-Sise Cliff from 1965 to 2018.
The recent multi-year periods 2000–2005, 2005–2010, 2010–2015, and 2015–2018 exhibited a strong variation of erosion rates. The early period from 2000 to 2005 was characterized by less erosion with ERmean of 5.7 m yr–1 and ERmax of 11.8 m yr–1. During 2005–2010 erosion rates accelerated to ERmean of 15.1 m yr–1 and ERmax of 22.3 m yr–1, the highest measured erosion rate. From 2010 to 2015 erosion rates slightly receded to ERmean of 13.8 m yr–1and ERmax of 19.3 m yr–1, which still exceeded long-term mean erosion rates (1965–2018) by 51%. For the most recent period (2015–2018) ERmean increased again to 15.7 m yr–1.
Total and Annual Sediment, C and N Loss
Even though the total volume of ice is 88 vol% at the Sobo-Sise Cliff, large amounts of yedoma sediments have been eroded since 2000 (Table 3). The average eroded sediment flux range from 47.1–154.4 × 10⁶ kg yr–1 leading to a loss of 1.7–5.6 × 10⁶ kg SOC yr–1 and 0.1–0.4 kg N yr–1 for the different time periods between 2000 and 2018. When splitting into different time periods, the highest SOCflux and Nflux occurred between 2005 and 2010 with 5.6 × 10⁶ kg SOC yr–1 and 0.4 × 10⁶ kg N yr–1. However, even after 2010 the erosion rates remained on a very high level with annual erosion rates of ∼5 × 10⁶ kg SOC yr–1 (Table 3). For the time period 2015–2018 in total 0.59 × 10⁶ m3 of yedoma sediments (including segregated and pore ice but not including the adjacent shores along drained lake basins and the deposits below water level) were eroded into the Sardakhskaya channel, which led to a loss of 15.4 ± 9.9 × 10⁶ kg SOC.
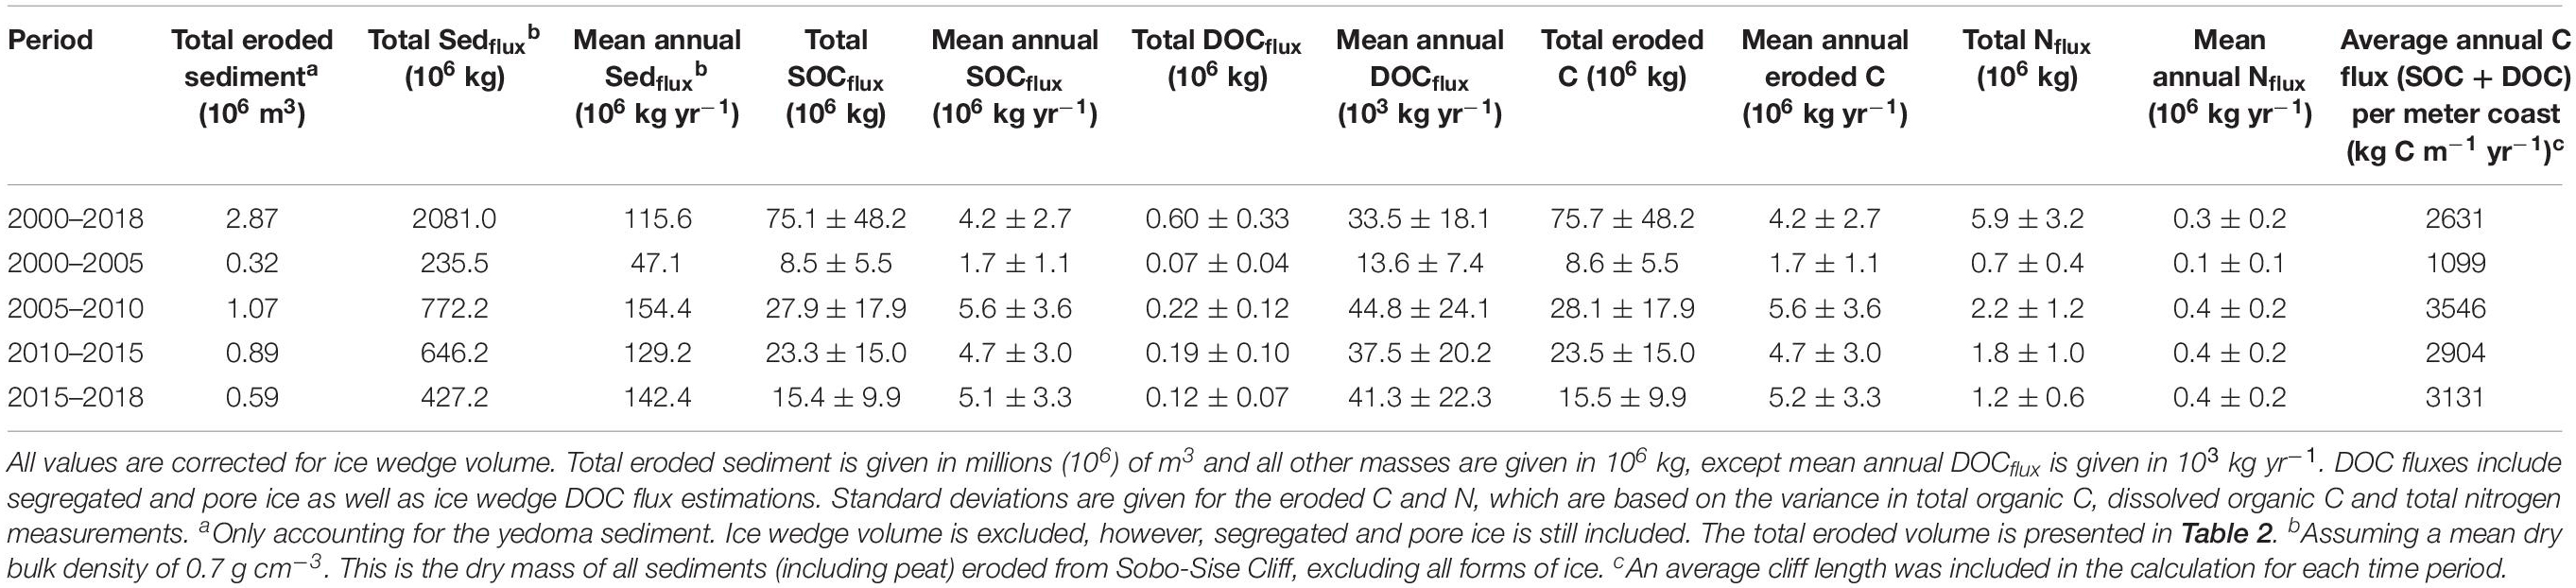
Table 3. Sediment (Sedflux), soil organic carbon (SOCflux), dissolved organic carbon (DOCflux) and nitrogen (Nflux) erosion rates.
In addition to SOC and N, DOC is released from Sobo-Sise Cliff. Average DOC fluxes (including ice wedge as well as segregated and pore ice DOC) range from 13.6 to 44.8 × 10³ kg DOC yr–1 for the different time periods between 2000 and 2018 (Table 3). Like sediment, SOC and N fluxes, highest DOC fluxes were estimated for the time period 2005–2010. However, compared to the SOC flux, DOC only contributes a minor amount of the total C flux of Sobo-Sise Cliff. For the four investigated time periods, DOC accounts for 0.8% of the total C lost through erosion. Nevertheless, this still accounts for a loss of 41,265 kg DOC yr–1 in the most recent investigated time period (2015–2018). As a result, the flux ratio of DOC vs. SOC is 1:125. In total, SOC and DOC combined, 15.5 ± 9.9 × 10⁶ kg C were eroded during 2015–2018. This leads to an average C flux of 5.2 ± 3.3 × 10⁶ kg C yr–1 or divided by meter coastline to an average of 3,131 kg C m–1 yr–1 along Sobo-Sise Cliff. However, the overall contribution of yedoma ice wedge DOC is relatively small. For the time period 2015–2018, 11.74 × 10³ kg DOC from ice wedges were eroded, which accounts for 9.5% of the total DOC flux and 0.08% of the total C flux from Sobo-Sise Cliff. Ice wedge DOC fluxes for the different time periods are presented in the Supplementary Table S2.
Discussion
Comparison to Other Key Sites
The presence of a very ice-rich yedoma upland at a location where a major channel of the Lena Delta develops a large bend is certainly a key factor for the exceptional high erosion rates of the Sobo-Sise Cliff. These site characteristics favor high erosion rates and the local dynamics suggest that a wide range of permafrost shore erosion rates, including very high maximum rates may develop not only along wave-dominated sea coasts, but also along rivers. Maximum annual shore erosion rates of 22 m yr–1 on this Lena river bank exceeds all previously observed rates for Arctic rivers. Erosion dynamics along the cliff rival some of the most rapid permafrost coastal erosion rates in the Arctic and as it is the case for some sections at sea coasts (e.g., Günther et al., 2013; Irrgang et al., 2018; Jones et al., 2018), erosion of the Sobo-Sise Cliff is accelerating in the last decades.
The warm water transported by the large Lena River from further south can be considered as a contributing factor for the erosion. Water temperatures up to 15°C were measured in August 2019 (see Supplementary Figure S1). The warm and rapidly flowing water in front of the Sobo-Sise Cliff triggers the formation of thermo-erosional niches at the base of the ice-rich cliff and continuously removes eroded debris from the base during summertime. The lack of a beach and a water depth of ∼10 m directly in front of the cliff indicate that sediment entering the river is rapidly eroded also at depth and not accumulating. All this leads to formation of a nearly perfectly vertical cliff front where hardly any thaw slump-like features are developing at the cliff top due to the very rapid thermo-erosion of the cliff base.
For comparison, another yedoma cliff on Kurungnakh Island in the central Lena Delta has much smaller erosion rates with 4.1 to 6.9 m yr–1 (Stettner et al., 2018). On Kurungnakh Island, the yedoma is located on top of ice-poor fluvial sand layers (Wetterich et al., 2008), which limits erosion rates at the cliff base. Most of the erosion here currently takes place by thermo-denudation, i.e., the retreat of the bluff top by thaw slumping and forming slump floors at the stratigraphic boundary between yedoma and underlying sands roughly at 17 m above river level. The Olenekskaya channel that flows around Kurungnakh Island has a low runoff rate and therefore weaker river currents compared to the Sardakhskaya channel (Fedorova et al., 2015). For comparison, in the Olenekskaya channel in the Lena Delta, Are (1983) also reported smaller erosion rates of 1.7–6 m per year in up to 9 m thick deposits dissected by wedge ice.
Another key site studied for riverine yedoma cliff erosion is the Itkillik exposure on the North Slope of Alaska (Kanevskiy et al., 2016). With up to 35 m height above river water level, this 680 m long cliff retreats by 11 m yr–1 and erodes 70 × 106 kg yr–1 of sediments and 880,000 kg C yr–1. Similar to the Sobo-Sise Cliff, the Itkillik cliff is very ice-rich (total ice content of 86 vol%) and lies on a river bend (Kanevskiy et al., 2016). However, the Sobo-Sise Cliff is more than twice the length resulting in an even higher sediment input into the river compared to the Itkillik exposure. A similar ice-rich permafrost cliff was studied by Shur et al. (2002) on the Yana River close to the village Kazachye. This 15 m high cliff had erosion rates of 6.5 m yr–1 from 1975 to 1990.
However, not only yedoma dominated cliff retreat leads to high erosion of sediment and C. Along the Colville River and in the Colville Delta, erosion rates of up to 3.5 m yr–1 (Walker et al., 1987; Payne et al., 2018) lead to a continuous transport of organic matter into delta and near-shore zones of the Colville River. Likewise, the Lena River is also eroding permafrost along its course and mobilizing sediments and organic matter. Average bank erosion on a 300 km stretch of the Lena River close to Yakutsk is 2 m yr–1 for the period 1967–2002 (Costard et al., 2007). At the Indigirka and Yana rivers, strong erosion of permafrost shores averages 6.5 m yr–1 and 2 m yr–1, respectively (Shur et al., 2002). All these observations highlight the importance of major Arctic rivers for the mobilization and redistribution of formerly frozen sediments and organic matter into the fluvial and further downstream environments such as deltas and Arctic shelves (e.g., Wild et al., 2019).
Similar to the Sobo-Sise Cliff with a yedoma Ice Complex base of at least 10 m below river level, these strongly erosion-susceptible yedoma deposits extend down to 10 m below sea level on Muostakh Island (Overduin et al., 2016) and 3 m on Cape Mamontov Klyk (Schirrmeister et al., 2008). Both coastlines feature above-average erosion rates that locally may reach 39.4 and 21 m yr–1 during exceptional years on Muostakh Island and Cape Mamontov Klyk, respectively (Günther et al., 2013, 2015). On the Laptev Sea coast, Günther et al. (2013) studied three ice-rich coastal zones (Oyogos Yar, Buor Khaya, Mamontov Klyk) dominated by yedoma and alas deposits and found mean erosion rates of 0.9–2.9 m yr–1 for the yedoma dominated areas (Figure 6). Another example is the very ice-rich Alaskan Beaufort Sea coast between Drew Point and Cape Halkett with a mean erosion rate of 13.6 m yr–1 for the 2002–2007 period (Jones et al., 2009). Looking at a 9 km coastal segment at Drew Point only, average rates for the period 2007–2016 were even higher with 17.2 m yr–1 (Jones et al., 2018). Lower rates were reported from the Yukon coast with mean erosion rates of 1.3 m yr–1 (Irrgang et al., 2018), Herschel Island with 0.7 m yr–1 (Obu et al., 2016), the Chukchi Sea coast on the northern Seward Peninsula of Alaska with 1.3 m yr–1 (Farquharson et al., 2018), or Barter Island (Alaskan Beaufort Sea) with 1.3 m yr–1 (Gibbs et al., 2019), keeping in mind that these values are long term averages of areas, where local and temporal maxima can be substantial higher (e.g., 8.1 m yr–1 for central parts of a bluff on Barter Island (Gibbs et al., 2019), or 22 m yr–1 for active slumps from 2012 to 2013 on Herschel Island (Obu et al., 2017).
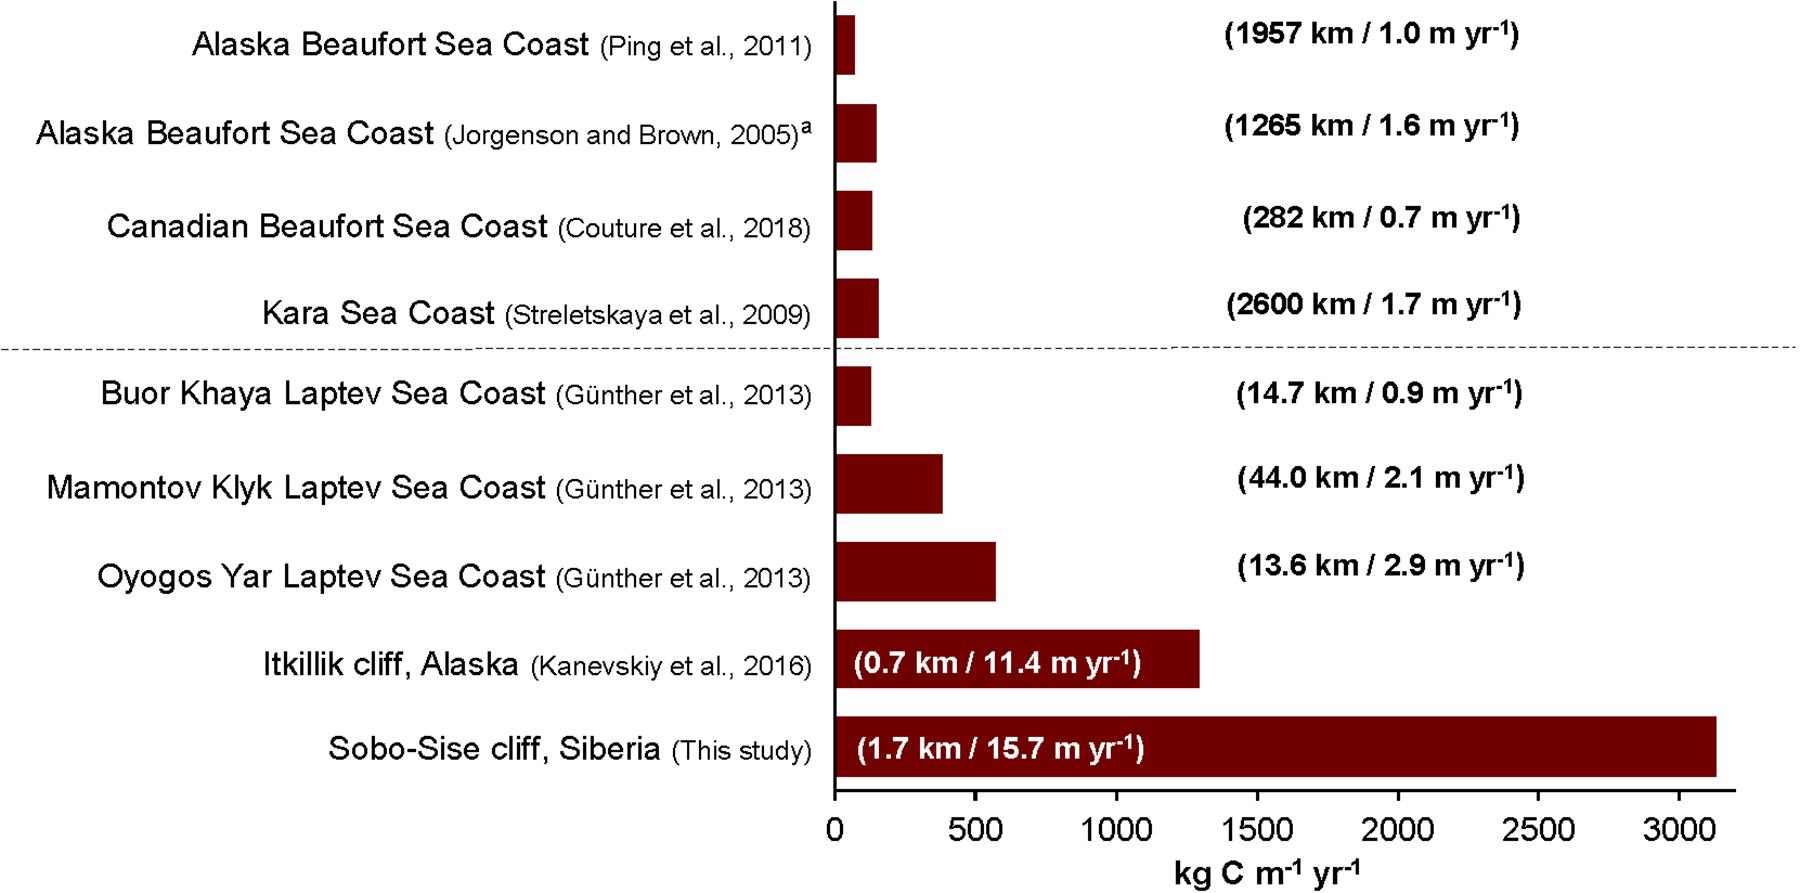
Figure 6. Comparison of C fluxes in kg C m– 1 yr– 1 from studied coastal erosion sites. Numbers in brackets show the length of studied coast and the mean annual erosion for the studied coast. Studies below the dashed line focus on yedoma deposits. Only the two last studies investigate fluvial thermo-erosion, while all the other studies investigate coastal erosion processes. aIn comparison to Ping et al. (2011); Jorgenson and Brown (2005) do not include delta areas along the Alaska Beaufort Sea Coast.
However, when comparing Sobo-Sise Cliff to other locations at the coast, it is important to point out that different factors affect fluvial thermo-erosion compared to coastal erosion. The moving river water, the annual ice breakup, the spring flood and the transport of warm river water from further south certainly favor erosion of cliffs along Arctic rivers. These factors lead to a different erosion setting when compared to coastal stretches, which are affected by thermo-denudation and thermo-abrasion (e.g., Are, 1983; Overduin et al., 2014; Günther et al., 2015). In particular, the moving river water of the Sardakhskaya channel leads to fast removal of eroded debris at the cliff base, allowing continuous erosion at the base by the warm river water in summer. This prevents the flattening of the Sobo-Sise Cliff front and is likely an important factor for the continuous high erosion rates.
Annual total C fluxes from rivers into the Laptev Sea have been estimated to 6,800 × 106 kg C yr–1 (Rachold et al., 2004). Despite its distinct height, very high ground ice content, and its fast fluvial erosion, by its local nature the Sobo-Sise Cliff contributes only a small portion (5.2 × 10⁶ kg C yr–1, 2015–2018) of this flux. Given the 1,660 m long river shore segment studied, a shoreline-length normalized C flux yields an average of 3,131 kg C m–1 yr–1 (2015–2018), which is significantly higher than C fluxes observed in other studies (Figure 6). Compared to the yedoma coasts studied by Günther et al. (2013), Sobo-Sise Cliff is distinct by its high annual erosion rate, which leads to an overall high sediment and C loss. However, the common practice of aggregating local observations over larger coastal stretches dilutes the substantial contribution of erosional hot spots such as the Sobo-Sise Cliff to overall C fluxes. Because comparable high erosion rates sustained over several decades as we report for the Sobo-Sise Cliff are not known from other locations, our study therefore contributes to a better picture of the upper end in organic matter flux total variability when compared with the mean values summarized in Figure 6.
Sobo-Sise Cliff Will Remain a Strong Source for Mobilized C and N
Future Sobo-Sise Cliff erosion rates are difficult to predict because they depend on dynamic factors such as ice cover thickness, timing of river-ice breakup, river discharge, air and water temperatures (Walker et al., 1987). Particularly the course of the main river bed of the Sardakhskaya channel is an important factor. In case the main channel might shift slightly or a sand bank forms in front of the Sobo-Sise Cliff, riverbank erosion would suddenly decrease due to accumulation of sediment load and eroded debris, reducing niche formation and subsequent erosion at the cliff base (Grigoriev, 2007). Although a major sudden shift of the Sardakhskaya channel in near future seems unlikely, the Sobo-Sise Cliff will not form an infinite bulge on the outer side of a river bend and only retreat at the pace of the neighboring river shoreline.
In our remote sensing time series for 1965–2018 we see an increase erosion rates at the Sobo-Sise Cliff (Table 2). Besides the increase in erosion rate, the length of the cliff itself increased by 58% from an initial length of 1,050 m in 1965 to a length of 1,660 m in 2018. The increase in length is due to continuous erosion from the initial convex shape to the concave shape of the Sobo-Sise Cliff and the progressing erosion into the crescent forms of eroded alases. With progressing erosion, the Sobo-Sise Cliff will likely further increase in length (Figure 5) and therefore would contribute an accordingly higher amount of sediment and organic C flux into the Lena River.
Our results show some variation in erosion rates of different time periods. Whereas the time period 2005–2010 is characterized by high mean erosion rates of 15.1 m yr–1, the precedent period (2000–2005) showed almost three times smaller mean erosion rates of 5.7 m yr–1. The reasons for this inconsistency in erosion rates are difficult to determine but likely are related to variable environmental conditions. Air temperature data (NOAA, Menne et al., 2012) from Tiksi show that from the late 1990s to the early 2000s mean monthly air temperatures were mostly below average and since then no extensive period with below-average mean monthly temperatures occurred anymore (see Supplementary Figure S5). However, air temperature is most likely not the only factor affecting Sobo-Sise Cliff erosion. Data on the Lena water level, the river discharge in the Sardakhskaya channel, duration and thickness of Lena River ice cover, or precipitation would be beneficial in determining the environmental conditions affecting Sobo-Sise Cliff erosion. Equally important, if not the major factor favoring high erosion rates, not only at the Sobo-Sise Cliff but also on outer coastal locations, is the position of the lower yedoma Ice Complex base that may have substantial variation in space due to an uneven paleo-relief prior to yedoma deposition.
We did not include erosion rates and volumes below the water surface, which makes our estimates of sediment, C, and N fluxes from the Sobo-Sise Cliff conservative. The ice-rich yedoma deposits in the eastern part of the Lena Delta are known to extend below the water surface (Pavlova and Dorozhkina, 2000) similar to the yedoma on nearby Bykovsky Peninsula (e.g., Schirrmeister et al., 2002). According to the bathymetrical survey in front of Sobo-Sise Cliff (Figure 4) mean water depth is 10.3 m. Assuming the below water deposits have a similar composition like the above-water deposits, the total volume as well as the C and N loss would increase by 46% compared to our estimates (2015–2018). However, we do not have sufficient data to characterize the deposits below the water surface nor the hydrological and erosional dynamics in the channel that would also include winter river flow, therefore this estimate remains highly speculative.
Exceptional DOC Fluxes From Ice-Rich Sobo-Sise Cliff
Up to 41.3 × 10³ kg DOC is eroded annually (2015–2018) into the Sardakhskaya channel. Considering the length of Sobo-Sise Cliff of only 1,660 m this is a substantial amount of potentially bioavailable C, which is released into the riverine ecosystem. For comparison, Tanski et al. (2016) estimated an annual flux of 54.9 × 10³ kg yr–1 from the 306 km long Yukon coast. The reasons for the very high DOC flux at Sobo-Sise Cliff are the high segregated and pore ice volume (65.7%), the dimensions of the cliff (up to 27.7 m high) and the high erosion rates. Nevertheless, the main factor is the high DOC concentration within the segregated and pore ice. Maximum DOC concentrations up to 786 mg L–1 and a DOC to SOC ratio of 1:125 are among the highest observed in the Arctic. Mann et al. (2015) and Vonk et al. (2013a) reported values of 131 mg L–1 and 196 mg L–1 for yedoma thaw streams, respectively. Schirrmeister et al. (2017) found similar high DOC concentrations in yedoma Ice Complex outcrops and drill cores of the Buor Khaya Peninsula in the east of the Lena Delta.
Although the DOC fluxes might still be small compared to the SOC fluxes from OC-rich sediments, DOC from permafrost is chemically labile (Dou et al., 2008; Vonk et al., 2013a, b) and may directly enter local food webs (bioavailability). This means that DOC can become quickly mineralized by microbial communities and photochemical reactions (Battin et al., 2008; Vonk et al., 2013a, b; Cory et al., 2014) and returned to the atmosphere when released due to permafrost degradation (Schuur et al., 2009, 2011; Tanski et al., 2019).
Fate of Eroded Organic Matter and Implications for the Ecosystem
The high amount of organic matter eroded from the Sobo-Sise Cliff enters the Lena River and is transported downstream to the outer parts of the delta or likely to the near-shore zone of the Laptev Sea that is only about 40 km to the east. Previous studies indicated that the Lena River has an organic C flux of 0.9 Tg C yr–1 coming from permafrost and peat deposits (Wild et al., 2019). However, Wild et al. (2019) measured C concentration approximately 800 km upstream from Sobo-Sise Cliff. Therefore, it is difficult to infer on the C concentration and export at Sobo-Sise Cliff from these values. Nevertheless, this indicates that high amounts of permafrost C are transported toward the Laptev Sea.
The consequences of permafrost erosion and the subsequent organic matter input from the Lena River catchment into the Laptev Sea are not fully understood yet. Increased terrestrial C fluxes to the Arctic Ocean might affect food webs in the near-shore zone (e.g., Dunton et al., 2006, 2012; Casper et al., 2015) or lead to an increased acidification (Semiletov et al., 2016). The latter is seen in waters of the East Siberian Arctic Shelf that become more acidic due to the high CO2 concentrations in river water input, which is affected by degradation of terrestrial organic matter. In fact, the study by Semiletov et al. (2016) stated that 57% of the terrestrial organic C in the East Siberian Shelf originates from old Pleistocene age permafrost C like the deposits from the Sobo-Sise Cliff.
However, Bröder et al. (2019) reported on slow C degradation rates of terrestrial C in the top layer of seafloor sediments, of which a majority was considered even resistant to degradation. In addition, a large amount of the permafrost C might become re-buried in marine sediments of the Laptev and East Siberian Sea shelf (Vonk et al., 2012; Vonk and Gustafsson, 2013; Bröder et al., 2019). Nevertheless, terrestrial organic C on the Laptev Sea shelf is exposed for degradation for millennia so that these areas might become a C source for ocean acidification and atmospheric export on long timescales (Bröder et al., 2018).
Also, Tanski et al. (2019) showed in an incubation study that high amounts of CO2 are produced from thawing permafrost C in seawater, potentially leading to high CO2 production along permafrost coasts and near-shore zones. Another aspect raised by Sánchez-García et al. (2014) is the potential correlation of decay intensity of the organic matter in relation to active erosion of yedoma deposits, where fast erosion rates and high moisture content during summer thaw seem to favor microbial activity. In another study, Winterfeld et al. (2018) suggest that fluvial export of old (Pleistocene) C from degrading permafrost was potentially an important process for high C mobilization at the Pleistocene-Holocene transition around 11.5 kyrs BP, leading to changes in atmospheric CO2, and indicating the significance of eroding yedoma in the Arctic. Similar findings are provided by Tesi et al. (2016) and Martens et al. (2019), who report a much higher permafrost C transport to the Laptev and Chukchi Sea at the end of the last deglaciation, indicating high permafrost C mobilization during times of rapid climate warming.
DOC from late Pleistocene permafrost as an especially bioavailable form of C due to its fraction size and molecular composition could play a crucial role for microbial use and general food web impacts. For example, Vonk et al. (2013b) showed that yedoma ice wedge meltwater can increase the degradation of organic matter due to co-metabolizing effects. At the Duvanny Yar yedoma exposure on the Kolyma river, Vonk et al. (2013a) and Mann et al. (2014) found that DOC originating from ancient yedoma deposits is highly bioavailable and therefore important to consider in a potential permafrost C feedback. The origin of organic matter and the sequestration process into ground ice plays an important role in the concentration and bioavailability of DOC (Fritz et al., 2015). Sequestration of DOC into ground ice is a complex process that is dependent on water source, freezing process, organic matter quality and even the inorganic geochemical composition of the ambient water to form ground ice. Tundra-steppe vegetation, reduced organic matter degradation rates and syngenetic permafrost aggradation were characteristic for the cold stages of the last ice age. Late Pleistocene yedoma deposits and associated ground ice are therefore the ideal reservoir for the fresh and most bioavailable DOC components, where the chemical character is preserved because of rapid incorporation into permafrost.
In summary, while we quantified the amount to C and N mobilized from the Sobo-Sise Cliff the actual fate of the eroded terrestrial material is not yet clear and further studies are needed to investigate the state (dissolved, particulate) and the lability of the C and N released from Sobo-Sise Cliff and similar shores in the Lena River and Delta. The Sobo-Sise Cliff (this study) and other permafrost-shores characterized by rapid erosion in the Lena River (Costard et al., 2003, 2007; Dupeyrat et al., 2018; Stettner et al., 2018) contribute to an enhanced fluvial transport of terrestrial organic matter and nitrogen to the Arctic Ocean. McClelland et al. (2016) estimated that the Lena River exports 0.8 Tg particulate organic C and 0.1 Tg particulate N per year into the Arctic Ocean. In addition, Holmes et al. (2012) reported of an annual DOC and total dissolved N export of 5.7 Tg and 0.2 Tg, respectively. Combining particulate and dissolved organic C fluxes results in a total export of 6.5 Tg C yr–1 and 0.3 Tg N yr–1 by the Lena River. Understanding the sources of this flux and the processes behind its mobilization from permafrost is key to estimate current and project future impacts of changing river runoff regimes on biogeochemical cycling processes in permafrost rivers and the Arctic Ocean.
Conclusion
The 1,660 m long and 27.7 m high Sobo-Sise Cliff is one of the fastest eroding permafrost features in the Arctic, releasing a significant amount of C and N on a local scale. Erosion rates of up to 22 m per year and an average loss of 5.2 × 10⁶ kg C (SOC and DOC) and 0.4 × 10⁶ kg N per year (2015–2018) highlight the magnitude of biogeochemical fluxes from this individual erosional feature in the Lena River Delta. To study rapid permafrost shore erosion processes and resulting sediment fluxes at an extraordinary location such as the Sobo-Sise Cliff is extremely helpful to gain a better understanding of current and future impacts of permafrost thaw, interdependencies of permafrost erosion with runoff changes, and fluvial and marine biogeochemistry. In particular regarding the latter, our observations of current erosion dynamics at the Sobo-Sise Cliff provide an outlook of C and N fluxes from permafrost for the anticipated future accelerated coastal erosion in the course of global sea level rise, when it reaches the lower base of Ice Complex deposits in the yedoma upland along the northeast Siberian coastline.
Data Availability Statement
The data for this study has been archived on the PANGAEA (www.pangaea.de) data set repository. Erosion rates and digitized cliff fronts are available on doi: 10.1594/PANGAEA.918507 (Nitze et al., 2020), and the geochemical results from Sobo-Sise Cliff samples are available on doi: 10.1594/PANGAEA.919470 (Wetterich et al., 2020).
Author Contributions
MFu and IN contributed equally to this study. MFu, IN, JS, FG, and GG designed the study. GG, JS, and SW acquired funding. AK, SW, and MFr collected and analyzed sediment data. MFr collected and analyzed the samples for DOC. GM and SW made the bathymetric survey. IN, FG, and GG processed the remote sensing imagery. IN calculated erosion rates and cliff heights. MFu and JS calculated C and N stocks. All authors participated in field investigations. MFu wrote the original draft of the manuscript. All authors contributed in writing, reviewing, and editing the manuscript.
Funding
This work was supported by NERC-BMBF project CACOON [#03F0806A, Changing Arctic Ocean (CAO) program], the ERC starting grant PETA-CARB (#338335), the HGF impulse and network fund (ERC_0013), the BMBF project KoPf (#3F0764B), the ESA GlobPermafrost project, RFBR grant (#18-05-60221), DAAD and EU Marie Curie Actions under REA grant agreement #605728 (PRIME), the EU Horizon 2020 project Nunataryuk (#773421), and MSU (#AAAA-A16-116032810095-6). Further support was provided by the Deutsche Forschungsgemeinschaft (Grant No. WE4390/7-1 to SW). MG and GM were supported by grants from the Russian Foundation for Basic Research (Grant Nos. RFBR 18-05-70091 and RFBR 18-45-140057).
Conflict of Interest
The authors declare that the research was conducted in the absence of any commercial or financial relationships that could be construed as a potential conflict of interest.
Acknowledgments
We thank Aleksey Aksenov, Lutz Schirrmeister, and the great support by the Hydrobaza Tiksi for help with field work in 2018 and 2019, Dyke Scheidemann for support with sample analysis in the AWI laboratories, Andreas Fricke and Juri Palmtag for providing photographs, and Sebastian Laboor for the support in preparing the data set publication. Fieldwork on Sobo-Sise Island was conducted in the framework of the joint Russian-German expeditions Lena 2014, 2015, 2016, 2018, and 2019 supported by the Samoylov Research Station. Planet data were provided freely through Planet’s Education and Research program. The Arctic DEM is provided by the Polar Geospatial Center under NSF-OPP awards 1043681, 1559691, and 1542736.
Supplementary Material
The Supplementary Material for this article can be found online at: https://www.frontiersin.org/articles/10.3389/feart.2020.00336/full#supplementary-material
References
Adams, W. A. (1973). The effect of organic matter on the bulk and true densities of some uncultivated podzolic soils. J. Soil Sci. 24, 10–17. doi: 10.1111/j.1365-2389.1973.tb00737.x
Are, F. E. (1983). “Thermal abrasion of coasts,” in Proceedings of the 4th International Conference on Permafrost (Washington D.C: National Academy Press), 24–28.
Balser, A. W., Jones, J. B., and Gens, R. (2014). Timing of retrogressive thaw slump initiation in the Noatak Basin, northwest Alaska, USA. J. Geophys. Res. Earth Surf. 119, 1106–1120. doi: 10.1002/2013JF002889
Barichivich, J., Briffa, K. R., Osborn, T. J., Melvin, T. M., and Caesar, J. (2012). Thermal growing season and timing of bisopheric carbon uptake across the Northern Hemisphere. Global Biogeochem. Cycles 26:GB4015. doi: 10.1029/2012GB004312
Battin, T. J., Kaplan, L. A., Findlay, S., Hopkinson, C. S., Marti, E., Packman, A. I., et al. (2008). Biophysical controls on organic carbon fluxes in fluvial networks. Nat. Geosci. 1, 95–100. doi: 10.1038/ngeo101
Biskaborn, B. K., Smith, S. L., Noetzli, J., Matthes, H., Vieira, G., Streletskiy, D. A., et al. (2019). Permafrost is warming at a global scale. Nat. Commun. 10:264. doi: 10.1038/s41467-018-08240-4
Boike, J., Nitzbon, J., Anders, K., Grigoriev, M., Bolshiyanov, D., Langer, M., et al. (2019). A 16-year record (2002–2017) of permafrost, active-layer, and meteorological conditions at the Samoylov Island Arctic permafrost research site, Lena River delta, northern Siberia: an opportunity to validate remote-sensing data and land surface, snow, and permafrost models. Earth Syst. Sci. Data 11, 261–299. doi: 10.5194/essd-11-261-2019
Box, J. E., Colgan, W. T., Christensen, T. R., Schmidt, N. M., Lund, M., Parmentier, F.-J., et al. (2019). Key indicators of arctic climate change: 1971-2017. Environ. Res. Lett. 14:045010. doi: 10.1088/1748-9326/aafc1b
Bröder, L., Andersson, A., Tesi, T., Semiletov, I., and Gustafsson, Ö. (2019). Quantifying degradative loss of terrigenous organic carbon in surface sediments across the Laptev and East Siberian Sea. Global Biogeochem. Cycles 33, 85–99. doi: 10.1029/2018GB005967
Bröder, L., Tesi, T., Andersson, A., Semiletov, I., and Gustafsson, Ö. (2018). Bounding cross-shelf transport time and degradation in Siberian-Arctic land-ocean carbon transfer. Nat. Commun. 9:806. doi: 10.1038/s41467-018-03192-1
Casper, A. F., Rautio, M., Martineau, C., and Vincent, W. F. (2015). Variation and assimilation of Arctic riverine sestonin the pelagic food web of the Mackenzie River Delta and Beaufort Sea transition zone. Estuaries Coast 38, 1656–1663. doi: 10.1007/s12237-014-9917-z
Chen, J., Günther, F., Grosse, G., Liu, L., and Lin, H. (2018). Sentinel-1 InSAR measurements of elevation changes over Yedoma Uplands on Sobo-Sise Island, Lena Delta. Remote Sens. 10:1152. doi: 10.3390/rs10071152
Cory, R. M., Ward, C. P., Crump, B. C., and Kling, G. W. (2014). Sunlight controls water column processing of carbon in arctic fresh waters. Science 345, 925–928. doi: 10.1126/science.1253119
Costard, F., Dupeyrat, L., Gautier, E., and Carey-Gailhardis, E. (2003). Fluvial thermal erosion investigations along a rapidly eroding river bank: application to the Lena River (central Siberia). Earth Surf. Process. Landf. 28, 1349–1359. doi: 10.1002/esp.592
Costard, F., Gautier, E., Brunstein, D., Hammadi, J., Fedorov, A., Yang, D., et al. (2007). Impact of the global warming on the fluvial thermal erosion over the Lena River in Central Siberia. Geophys. Res. Lett. 34:L14501. doi: 10.1029/2007gl030212
Couture, N. J., Irrgang, A., Pollard, W., Lantuit, H., and Fritz, M. (2018). Coastal erosion of permafrost soils along the Yukon Coastal Plain and fluxes of organic carbon to the Canadian Beaufort Sea. J. Geophys. Res. Biogeosci. 123, 406–422. doi: 10.1002/2017JG004166
Dou, F., Ping, C.-L., Guo, L., and Jorgenson, T. (2008). Estimating the impact of seawater on the production of soil water-extractable organic carbon during coastal erosion. J. Environ. Qual. 37, 2368–2374. doi: 10.2134/jeq2007.0403
Dunton, K. H., Schonberg, S. V., and Cooper, L. W. (2012). Food web structure of the Alaskan nearshore shelf and estuarine lagoons of the Beaufort Sea. Estuaries Coast 35, 416–435. doi: 10.1007/s12237-012-9475-1
Dunton, K. H., Weingartner, T., and Carmack, E. C. (2006). The nearshore western Beaufort Sea ecosystem: circulation and importance of terrestrial carbon in arctic coastal food webs. Prog. Oceanogr. 71, 362–378. doi: 10.1016/j.pocean.2006.09.011
Dupeyrat, L., Hurault, B., Costard, F., Marmo, C., and Gautier, E. (2018). Satellite image analysis and frozen cylinder experiments on thermal erosion of periglacial fluvial islands. Permafr. Periglac. Process. 29, 100–111. doi: 10.1002/ppp.1973
Elementar Analysesysteme (2007). Vario Max C, Makro-Elementaranalysator, Bedienungsanleitung. Hanau: Elementar Analysesysteme.
Elementar Analysesysteme (2011). Vario EL III, CHNOS Elementaranalysator, Bedienungsanleitung. Hanau: Elementar Analysesysteme.
Farquharson, L. M., Mann, D. H., Swanson, D. K., Jones, B. M., Buzard, R. M., and Jordan, J. W. (2018). Temporal and spatial variability in coastline response to declining sea-ice in northwest Alaska. Mar. Geol. 404, 71–83. doi: 10.1016/j.margeo.2018.07.007
Fedorova, I., Chetverova, A., Bolshiyanov, D., Makarov, A., Boike, J., Heim, B., et al. (2015). Lena Delta hydrology and geochemistry: long-term hydrological data and recent field observations. Biogeosciences 12, 345–363. doi: 10.5194/bg-12-345-2015
Fritz, M., Opel, T., Tanski, G., Herzschuh, U., Meyer, H., Eulenburg, A., et al. (2015). Dissolved organic carbon (DOC) in Arctic ground ice. Cryosphere 9, 737–752. doi: 10.5194/tc-9-737-2015
Fritz, M., Vonk, J. E., and Lantuit, H. (2017). Collapsing Arctic coastlines. Nat. Clim. Change 7, 6–7. doi: 10.1038/nclimate3188
Fuchs, M., Grosse, G., Strauss, J., Günther, F., Grigoriev, M., Maximov, G. M., et al. (2018). Carbon and nitrogen pools in thermokarst-affected permafrost landscapes in Arctic Siberia. Biogeosciences 15, 953–971. doi: 10.5194/bg-15-953-2018
Gibbs, A. E., Nolan, M., Richmond, B. M., Snyder, A. G., and Erikson, L. H. (2019). Assessing patterns of annual change to permafrost bluffs along the North Slope coast of Alaska using high-resolution imagery and elevation models. Geomorphology 336, 152–164. doi: 10.1016/j.geomorph.2019.03.029
Goward, S., Arvidson, T., Williams, D., Faundeen, J., Irons, J., and Franks, S. (2006). Historical record of Landsat global coverage. Photogramm. Eng. Remote Sens. 72, 1155–1169. doi: 10.14358/PERS.72.10.1155
Grigoriev, M. N. (2007). “Shore erosion studies on the Ice Complex Islands in the South-East Lena Delta,” in Russian-German Cooperation System Laptev Sea: The expedition LENA 2006, Vol. 566, eds J. Boike, D. Y. Bolshiyanov, and M. N. Grigoriev (Bremerhaven: Alfred Wegener Institute for Polar and Marine Research), 31.
Grosse, G., Goetz, S., McGuire, A. D., Romanovsky, V. E., and Schuur, E. A. G. (2016). Review and synthesis: changing permafrost in a warming world and feedbacks to the Earth System. Environ. Res. Lett. 11:040201. doi: 10.1088/1748-9326/11/4/040201
Grotheer, H., Meyer, V., Riedel, T., Pfalz, G., Mathieu, L., Hefter, J., et al. (2020). Burial and origin of permafrost-derived carbon in the nearshore zone of the Southern Canadian Beaufort Sea. Geophys. Res. Lett. 47:e2019GL085897. doi: 10.1029/2019GL085897
Günther, F., Overduin, P. P., Sandakov, A. V., Grosse, G., and Grigoriev, M. N. (2013). Short- and long-term thermo-erosion of ice-rich permafrost coasts in the Laptev Sea region. Biogeosciences 10, 4297–4318. doi: 10.5194/bg-10-4297-2013
Günther, F., Overduin, P. P., Yakshina, I. A., Opel, T., Baranskaya, A. V., and Grigoriev, M. N. (2015). Observing Muostakh disappear: permafrost thaw subsidence and erosion of a ground-ice-rich island in response to arctic summer warming and sea ice reduction. Cryosphere 9, 151–178. doi: 10.5194/tc-9-151-2015
Gustafsson, Ö., van Dongen, B. E., Vonk, J. E., Dudarev, O. V., and Semiletov, I. P. (2011). Widespread release of olc carbon across the Siberian Arctic echoed by its large rivers. Biogeosciences 8, 1737–1743. doi: 10.5194/bg-8-1737-2011
Himmelstoss, E. A., Henderson, R. E., Kratzmann, M. G., and Farris, A. S. (2018). Digital Shoreline Analysis System (DSAS) Version 5.0 User Guide. US Geological Survey Open-File Report No. 2018-1179. Reston, VA: US Geological Survey. doi: 10.3133/ofr20181179
Holmes, R. M., McClelland, J. W., Peterson, B. J., Tank, S. E., Bulygina, E., Eglinton, I., et al. (2012). Seasonal and annual fluxes of nutrients and organic matter from large rivers to the Arctic Ocean and surrounding seas. Estuaries Coast 35, 369–382. doi: 10.1007/s12237-011-9386-6
Holmes, R. M., Shiklomanov, A. I., Tank, S. E., McClelland, J. W., and Tretiakov, M. (2015). River Discharge. Available online at: https://Arctic.noaa.gov/Report-Card/Report-Card-2015/ArtMID/5037/ArticleID/227/River-Discharge (accessed July 27, 2020).
Irrgang, A. M., Lantuit, H., Manson, G. K., Günther, F., Grosse, G., and Overduin, P. P. (2018). Variability in rates of coastal change along the Yukon Coast, 1951 to 2015. J. Geophys. Res. Earth Surf. 123, 779–800. doi: 10.1002/2017JF004326
Jones, B. M., Arp, C. D., Jorgenson, M. T., Hinkel, K. M., Schmutz, J. A., and Flint, P. L. (2009). Increase in the rate and uniformity of coastline erosion in Arctic Alaska. Geophys. Res. Lett. 36:L03503. doi: 10.1029/2008gl036205
Jones, B. M., Farquharson, L. M., Baughman, C. A., Buzard, R. M., Arp, C. D., Grosse, G., et al. (2018). A decade of remotely sensed observations highlight complex processes linked to coastal permafrost bluff erosion in the Arctic. Environ. Res. Lett. 13:115001. doi: 10.1088/1748-9326/aae471
Jones, B. M., Hinkel, K. M., Arp, C. D., and Eisner, W. R. (2008). Modern erosion rates and loss of coastal features and sites, Beaufort Sea coastline, Alaska. Arctic 61, 361–372.
Jorgenson, M. T., and Brown, J. (2005). Classification of the Alaskan Beaufort Sea Coast and estimation of carbon and sediment inputs from coastal erosion. Geo Mar. Lett. 25, 69–80. doi: 10.1007/s00367-004-0188-8
Kanevskiy, M., Shur, Y., Strauss, J., Jorgenson, T., Fortier, D., Stephani, E., et al. (2016). Patterns and rates of riverbank erosion involving ice-rich permafrost (yedoma) in northern Alaska. Geomorphology 253, 370–384. doi: 10.1016/j.geomorph.2015.10.023
Lantuit, H., Atkinson, D., Overduin, P. P., Grigoriev, M., Rachold, V., Grosse, G., et al. (2011). Coastal erosion dynamics on the permafrost-dominated Bykovsky Peninsula, north Siberia, 1951–2006. Polar Res. 30:7341. doi: 10.3402/polar.v30i0.7341
Lantz, T. C., and Kokelj, S. V. (2008). Increasing rates of retrogressive thaw slump activity in the Mackenzie Delta region, N.W.T., Canada. Geophys. Res. Lett. 35:L06502. doi: 10.1029/2007gl032433
Lide, D. R., Baysinger, G., Kehiaian, H. V., Berger, L. I., Kuchitsu, K., Goldberg, R. N., et al. (eds) (2008). “Properties of ice and supercooled water,” in CRC Handbook of Chemistry and Physics (Boca Raton, FL: CRC Press), 1101.
Mann, P. J., Eglington, T. I., McIntyre, C. P., Zimov, N., Davydova, A., Vonk, J. E., et al. (2015). Utilization of ancient permafrost carbon in headwaters of Arctic fluvial networks. Nat. Commun. 6:7856. doi: 10.1038/ncomms8856
Mann, P. J., Sobczak, W. V., LaRue, M. M., Bulygina, E., Davydova, A., Vonk, J. E., et al. (2014). Evidence for key enzymatic controls on metabolism of Arctic river organic matter. Global Change Biol. 20, 1089–1100. doi: 10.1111/gcb.12416
Martens, J., Wild, B., Pearce, C., Tesi, T., Andersson, A., Bröder, L., et al. (2019). Remobilization of old permafrost carbon to Chukchi Sea sediments during the end of the last deglaciation. Global Biogeochem. Cycles 33, 2–14. doi: 10.1029/2018GB005969
McClelland, J. W., Holmes, R. M., Peterson, B. J., Raymond, P. A., Striegl, R. G., Zhulidov, A. V., et al. (2016). Particulate organic carbon and nitrogen export from major Arctic rivers. Global Biogeochem. Cycles 30, 629–643. doi: 10.1002/2015GB005351
Menne, M. J., Durre, I., Korzeniewski, B., McNeal, S., Thomas, K., Yin, X., et al. (2012). Global Historical Climatology Network - Daily (GHCN-Daily), Version 3. Asheville, NC: NOAA National Climatic Data Center.
Morgenstern, A., Grosse, G., Günther, F., Fedorova, I., and Schirrmeister, L. (2011). Spatial analyses of thermokarst lakes and basins in Yedoma landscapes of the Lena Delta. Cryosphere 5, 849–867. doi: 10.5194/tc-5-849-2011
Nielsen, D. M., Dobrynin, M., Baehr, J., Razumov, S., and Grigoriev, M. (2020). Coastal erosion variability at the southern Laptev Sea linked to winter sea ice and the Arctic Oscillation. Geophys. Res. Lett. 47:e2019GL086876. doi: 10.1029/2019GL086876
Nitze, I., Fuchs, M., Strauss, J., Günther, G., Wetterich, S., Kizyakov, A., et al. (2020). Erosion rates of the Sobo-Sise yedoma permafrost cliff in the Lena River Delta derived from remote sensing imagery. PANGAEA. doi: 10.1594/PANGAEA.918507
Nitze, I., and Grosse, G. (2016). Detection of landscape dynamics in the Arctic Lena Delta with temporally dense Landsat time-series stacks. Remote Sens. Environ. 181, 27–41. doi: 10.1016/j.rse.2016.03.038
Obu, J., Lantuit, H., Fritz, M., Pollard, W. H., Sachs, T., and Günther, F. (2016). Relation between planimetric and volumetric measurements of permafrost coast erosion: a case study from Herschel Island, western Canadian Arctic. Polar Res. 35:30313. doi: 10.3402/polar.v35.30313
Obu, J., Lantuit, H., Grosse, G., Günther, F., Sachs, T., Helm, V., et al. (2017). Coastal erosion and mass wasting along the Canadian Beaufort Sea based on annual airborne LiDAR elevation data. Geomorphology 293, 331–346. doi: 10.1016/j.geomorph.2016.02.014
Overduin, P. P., Strzelecki, M. C., Grigoriev, M. N., Couture, N., Lantuit, H., St-Hilaire-Gravel, D., et al. (2014). Coastal changes in the Arctic. Geol. Soc. Lond. Spec. Publ. 388:103. doi: 10.1144/SP388.13
Overduin, P. P., Wetterich, S., Günther, F., Grigoriev, M. N., Grosse, G., Schirrmeister, L., et al. (2016). Coastal dynamics and submarine permafrost in shallow water of the central Laptev Sea, East Siberia. Cryosphere 10, 1449–1462. doi: 10.5194/tc-10-1449-2016
Pavlova, E. Y., and Dorozhkina, M. (2000). “Geological-Geomorphological studies in the western and central sectors of the Lena Delta,” in Russian-German Cooperation SYSTEM LAPTEV SEA 2000: The Expedition LENA 1999, eds V. Rachold and M. N. Grigoriev (Bremerhaven: Alfred Wegener Institute for Polar and Marine Research), 354.
Payne, C., Panda, S., and Prakash, A. (2018). Remote sensing of river erosion on the Colville River, North Slope Alaska. Remote Sens. 10:397. doi: 10.3390/rs10030397
Peel, M. C., Finlayson, B. L., and McMahon, T. A. (2007). Updated world map of the Köppen-Geiger climate classification. Hydrol. Earth Syst. Sci. 11, 1633–1644. doi: 10.5194/hess-11-1633-2007
Ping, C. L., Michaelson, G. J., Guo, L., Jorgenson, M. T., Kanevskiy, M., Shur, Y., et al. (2011). Soil carbon and material fluxes across the eroding Alaska Beaufort Sea coastline. J. Geophys. Res. Biogeosci. 116:G02004. doi: 10.1029/2010JG001588
Planet Team (2017). Planet Application Program Interface: In Space for Life on Earth. San Francisco, CA: Planet Team.
Porter, C., Morin, P., Howat, I., Noh, M.-J., Bates, B., Peterman, K., et al. (2018). ArcticDEM. Available online at: https://doi.org/10.7910/DVN/OHHUKH (accessed October 21, 2019).
Rachold, V., Eicken, H., Gordeev, V. V., Grigoriev, M. N., Hubberten, H. W., Lisitzin, A. P., et al. (2004). “Modern terrigenous organic carbon input to the Arctic Ocean,” in The Organic Carbon Cycle in the Arctic Ocean, eds R. Stein and R. W. MacDonald (Berlin: Springer), 33–55. doi: 10.1007/978-3-642-18912-8_2
Rachold, V., Grigoriev, M. N., Are, F. E., Solomon, S., Reimnitz, E., Kassens, H., et al. (2000). Coastal erosion vs riverine sediment discharge in the Arctic Shelf seas. Int. J. Earth Sci. 89, 450–460. doi: 10.1007/s005310000113
Rowland, J. C., Schwenk, J., Shelef, E., Mishra, U., Muss, J., and Stauffer, S. (2018). “Pan-arctic flux of soil organic carbon to rivers by river bank erosion,” in Proceedings of the AGU Fall Meeting Abstracts, Washington, DC.
Sánchez-García, L., Vonk, J. E., Charkin, A. N., Kosmach, D., Dudarev, O. V., Semiletov, I. P., et al. (2014). Characterisation of three regimes of collapsing Arctic ice complex deposits on the SE Laptev Sea Coast using biomarkers and dual carbon isotopes. Permafr. Periglac. Process. 25, 172–183. doi: 10.1002/ppp.1815
Schirrmeister, L., Froese, D., Tumskoy, V., Grosse, G., and Wetterich, S. (2013). “Yedoma: late Pleistocene ice-rich syngenetic permafrost of Beringia,” in The Encyclopedia of Quaternary Science, ed. S. A. Elias (Amsterdam: Elsevier), 542–552. doi: 10.1016/b978-0-444-53643-3.00106-0
Schirrmeister, L., Grosse, G., Kunitsky, V., Magens, D., Meyer, H., Dereviagin, A., et al. (2008). Periglacial landscape evolution and environmental changes of Arctic lowland areas for the last 60 000 years (western LaptevSea coast, Cape Mamontov Klyk). Polar Res. 27, 249–272. doi: 10.1111/j.1751-8369.2008.00067.x
Schirrmeister, L., Schwamborn, G., Overduin, P. P., Strauss, J., Fuchs, M. C., Grigoriev, M., et al. (2017). Yedoma Ice Complex of the Buor Khaya Peninsula. Biogeosciences 14, 1261–1283. doi: 10.5194/bg-14-1261-2017
Schirrmeister, L., Siegert, C., Kuznetsova, T., Kuzmina, S., Andreev, A. A., Kienast, F., et al. (2002). Paleoenvironmental and paleoclimatic records from permafrost deposits in the Arctic region of Northern Siberia. Quat. Int. 89, 97–118. doi: 10.1016/s1040-6182(01)00083-0
Schuur, E. A. G., Abbott, B. W., Bowden, W. B., Brovkin, V., Camill, P., Canadell, J. P., et al. (2011). High risk of permafrost thaw. Nature 480, 32–33. doi: 10.1038/480032a
Schuur, E. A. G., Vogel, J. G., Crummer, K. G., Lee, H., Sickman, J. O., and Osterkamp, T. E. (2009). The effect of permafrost thaw on old carbon release and net carbon exchange from tundra. Nature 459, 556–559. doi: 10.1038/nature08031
Semiletov, I., Pipko, I., Gustafsson, Ö., Anderson, L. G., Sergienko, V., Pugach, S., et al. (2016). Acidification of East Siberian Arctic Shelf waters through addition of freshwater and terrestrial carbon. Nat. Geosci. 9, 361–365. doi: 10.1038/ngeo2695
Serreze, M. C., Walsh, J. E., Chapin, F. S. I. I. I., Osterkamp, T., Dyurgerov, M., Romanovsky, V., et al. (2000). Observational evidence of recent change in the Northern High-Latitude environment. Clim. Change 46, 159–207. doi: 10.1023/a:1005504031923
Shur, Y., Vasiliev, A., Kanevsky, M., Maximov, V., Pokrovsky, S., and Zaikanov, V. (2002). “Shore Erosion in Russian Arctic,” in Cold Regions Engineering – Cold Regions Impacts on Transportation and Infrastructure, ed. K. Merrill (Reston, VA: American Society of Civil Engineers), 736–747.
Stettner, S., Beamish, L. A., Bartsch, A., Heim, B., Grosse, G., Roth, A., et al. (2018). Monitoring Inter- and intra-seasonal dynamics of rapidly degrading ice-rich permafrost riverbanks in the lena delta with TerraSAR-X time series. Remote Sens. 10:51. doi: 10.3390/rs10010051
Strauss, J., Schirrmeister, L., Grosse, G., Fortier, D., Hugelius, G., Knoblauch, C., et al. (2017). Deep yedoma permafrost: a synthesis of depositional characteristics and carbon vulnerability. Earth Sci. Rev. 172, 75–86. doi: 10.1016/j.earscirev.2017.07.007
Strauss, J., Schirrmeister, L., Grosse, G., Wetterich, S., Ulrich, M., Herzschuh, U., et al. (2013). The deep permafrost carbon pool of the Yedoma region in Siberia and Alaska. Geophys. Res. Lett. 40, 6165–6170. doi: 10.1002/2013GL058088
Strauss, J., Schirrmeister, L., Wetterich, S., Borchers, A., and Davydov, S. P. (2012). Grain-size properties and organic-carbon stock of Yedoma Ice Complex permafrost from the Kolyma lowland, northeastern Siberia. Global Biogeochem. Cycles 26:GB3003. doi: 10.1029/2011GB004104
Streletskaya, I. D., Vasiliev, A. A., and Vanstein, B. G. (2009). Erosion of sediment and organic carbon from the Kara Sea coast. Arct. Antarct. Alp. Res. 41, 79–87. doi: 10.1657/1523-0430-41.1.79
Stroeve, J., and Notz, D. (2018). Changing state of Arctic sea ice across all seasons. Environ. Res. Lett. 13:103001. doi: 10.1088/1748-9326/aade56
Strozzi, T., Antonova, S., Günther, F., Mätzler, E., Vieira, G., Wegmüller, U., et al. (2018). Sentinel-1 SAR interferometry for surface deformation monitoring in low-land Permafrost Areas. Remote Sens. 10:1360. doi: 10.3390/rs10091360
Tanski, G., Couture, N., Lantuit, H., Eulenburg, A., and Fritz, M. (2016). Eroding permafrost coasts release low amounts of dissolved organic carbon (DOC) from ground ice into the nearshore zone of the Arctic Ocean. Global Biogeochem. Cycles 30, 1054–1068. doi: 10.1002/2015GB005337
Tanski, G., Wagner, D., Knoblauch, C., Fritz, M., Sachs, T., and Lantuit, H. (2019). Rapid CO2 release from eroding permafrost in seawater. Geophys. Res. Lett. 46, 11244–11252. doi: 10.1029/2019GL084303
Tesi, T., Muschitiello, F., Smittenberg, R. H., Jakobsson, M., Vonk, J. E., Hill, P., et al. (2016). Massive remobilization of permafrost carbon during post-glacial warming. Nat. Commun. 7:13653. doi: 10.1038/ncomms13653
Turetsky, M. R., Abbott, B. W., Jones, M. C., Anthony, K. W., Olefeldt, D., Schuur, E. A. G., et al. (2020). Carbon release through abrupt permafrost thaw. Nat. Geosci. 13, 138–143. doi: 10.1038/s41561-019-0526-0
van Everdingen, R. (2005). Multi-Language Glossary of Permafrost and Related Ground-Ice Terms. (Boulder, CO: National Snow and Ice Data Center), 159.
van Vliet, M. T. H., Franssen, W. H. P., Yearsley, J. R., Ludwig, F., Haddeland, I., Lettenmaier, D. P., et al. (2013). Global river discharge and water temperature under climate change. Global Environ. Change 23, 450–464. doi: 10.1016/j.gloenvcha.2012.11.002
Vonk, J., Sánchez-García, L., van Dongen, B. E., Alling, V., Kosmach, D., Charkin, A., et al. (2012). Activation of old carbon by erosion of coastal and subsea permafrost in Arctic Siberia. Nature 489, 137–140. doi: 10.1038/nature11392
Vonk, J. E., and Gustafsson, Ö. (2013). Permafrost-carbon complexities. Nat. Geosci. 6, 675–676. doi: 10.1038/ngeo1937
Vonk, J. E., Mann, P. J., Davydov, S., Davydova, A., Spencer, R. G. M., Schade, J., et al. (2013a). High biolability of ancient permafrost carbon upon thaw. Geophys. Res. Lett. 40, 2689–2693. doi: 10.1002/grl.50348
Vonk, J. E., Mann, P. J., Dowdy, K. L., Davydova, A., Davydov, S. P., Zimov, N., et al. (2013b). Dissolved organic carbon loss from Yedoma permafrost amplified by ice wedge thaw. Environ. Res. Lett. 8:035023. doi: 10.1088/1748-9326/8/3/035023
Walker, J., Arnborg, L., and Peippo, J. (1987). Riverbank Erosion in the Colville Delta, Alaska. Geogr. Ann. Ser. A Phys. Geogr. 69, 61–70. doi: 10.1080/04353676.1987.11880197
Wetterich, S., Kizyakov, A., Fritz, M., Aksenov, A., Schirrmeister, L., and Opel, T. (2019). “Permafrost research on Sobo-Sise Island (Lena Delta),” in Russian-German Cooperation: Expeditions to Siberia in 2018, Vol. 734, eds S. Kruse, D. Bolshiyanov, M. Grigoriev, A. Morgenstern, L. Pestryakova, L. Tsibizov, et al. (Bremerhaven: Alfred Wegener Institute for Polar and Marine Research), 102–113. doi: 10.2312/BzPM_0734_2019
Wetterich, S., Kizyakov, A., Fritz, M., Wolter, J., Mollenhauer, G., Meyer, H., et al. (2020). The cryostratigraphy of the Yedoma cliff of Sobo-Sise Island (Lena Delta) reveals permafrost dynamics in the Central Laptev Sea coastal region during the last about 52 ka. Cryosphere Discuss. doi: 10.5194/tc-2020-179
Wetterich, S., Kuzmina, S., Andreev, A. A., Kienast, F., Meyer, H., Schirrmeister, L., et al. (2008). Palaeoenvironmental dynamics inferred from late Quaternary permafrost deposits on Kurungnakh Island, Lena Delta, Northeast Siberia, Russia. Quat. Sci. Rev. 27, 1523–1540. doi: 10.1016/j.quascirev.2008.04.007
Wetterich, S., Meyer, H., Fritz, M., Opel, T., and Schirrmeister, L. (2020). Cryolithology of the Sobo-Sise Yedoma cliff (eastern Lena Delta). PANGAEA. doi: 10.1594/PANGAEA.919470
Wild, B., Andersson, A., Bröder, L., Vonk, J., Hugelius, G., McClelland, J. W., et al. (2019). Rivers across the Siberian Arctic unearth the patterns of carbon release from thawing permafrost. Proc. Natl. Acad. Sci. U.S.A. 116, 10280–10285. doi: 10.1073/pnas.1811797116
Keywords: permafrost, river delta, ice-rich, carbon, nitrogen, time series, Landsat
Citation: Fuchs M, Nitze I, Strauss J, Günther F, Wetterich S, Kizyakov A, Fritz M, Opel T, Grigoriev MN, Maksimov GT and Grosse G (2020) Rapid Fluvio-Thermal Erosion of a Yedoma Permafrost Cliff in the Lena River Delta. Front. Earth Sci. 8:336. doi: 10.3389/feart.2020.00336
Received: 21 March 2020; Accepted: 20 July 2020;
Published: 21 August 2020.
Edited by:
Scott Raymond Dallimore, Geological Survey of Canada, CanadaReviewed by:
Jannik Martens, Stockholm University, SwedenScott Zolkos, University of Alberta, Canada
Copyright © 2020 Fuchs, Nitze, Strauss, Günther, Wetterich, Kizyakov, Fritz, Opel, Grigoriev, Maksimov and Grosse. This is an open-access article distributed under the terms of the Creative Commons Attribution License (CC BY). The use, distribution or reproduction in other forums is permitted, provided the original author(s) and the copyright owner(s) are credited and that the original publication in this journal is cited, in accordance with accepted academic practice. No use, distribution or reproduction is permitted which does not comply with these terms.
*Correspondence: Matthias Fuchs, matthias.fuchs@awi.de