Geological Carbon Sequestration by Reactive Infiltration Instability
 Yizhuo Sun
 Ryan L. Payton
 Saswata Hier-Majumder
 Andrew Kingdon
- 1Department of Earth Sciences, Royal Holloway, University of London, Egham, United Kingdom
- 2State Key Laboratory of Isotope Geochemistry, Guangzhou Institute of Geochemistry, Chinese Academy of Sciences, Guangzhou, China
- 3AAAS Science and Technology Policy Fellow, Advanced Scientific Computing and Research, US Department of Energy, Germantown, MD, United States
- 4British Geological Survey, Keyworth, United Kingdom
We study carbon capture and sequestration (CCS) over time scales of 2000 years by implementing a numerical model of reactive infiltration instability caused by reactive porous flow. Our model focuses on the mineralization of CO2 dissolved in the pore water—the geological carbon sequestration phase of a CCS operation—starting 10–100 years after the injection of CO2 in the subsurface. We test the influence of three parameters: porosity, mass fraction of the Ca-rich feldspar mineral anorthite in the solid, and the chemical reaction rate, on the mode of fluid flow and efficiency of CaCO3 precipitation during geological carbon sequestration. We demonstrate that the mode of porous flow switches from propagation of a planar front at low porosities to propagation of channels at porosities exceeding 10%. The channels develop earlier for more porous aquifers. Both high anorthite mass fraction in the solid phase and high reaction rates aid greater amounts of carbonate precipitation, with the reaction rate exerting the stronger influence of the two. Our calculations indicate that an aquifer with dimensions 500 m
1. Introduction
Carbon capture and permanent sequestration in the subsurface is becoming an important mechanism in carbon neutralization (Hosa et al., 2011; Odenberger et al., 2013; Celia, 2017). Current anthropogenic CO2 emissions (42 Gt/yr, Le Quéré et al., 2018; Friedlingstein et al., 2019) are three orders of magnitude higher than the current combined global CCS injection rate (35–40 Mt/yr, Celia, 2017). Recognizing the importance of CCS in mitigating global carbon emissions, a number of different incentives are offered. For example, the 2018 US Bipartisan Budget Act (26 U.S.C. § 45Q) provided a tax credit of $20 per ton of CO2 sequestered permanently. To encourage CCS using existing infrastructure, a number of locations—Sleipner site in the Norwegian North Sea (1 Mt/yr, Hosa et al., 2011), Kimberlina site in the western US (0.25 Mt over 4 years, Doughty, 2010), and Goldeneye reservoir in the North Sea (10 Mt CO2 over 10 years, Spence et al., 2014)—are either targeted for future operations or are being used as permanent CO2 storage sites. Hosa et al. (2011) provided an overview of the storage capacity, reservoir characteristics, and injection rates of 20 active CCS sites over the world. This article identifies a number of controls on the efficiency of CCS in potential future sites and testing facilities. Kingdon et al. (2019) provided details of such planned experimental facilities at the United Kingdom Geoenergy Observatory Cheshire Energy Research Facility Site, which will be used for in-situ testing of these controls.
Carbon capture and storage can broadly be envisioned as a two-step process (Bachu, 2000; Friedmann, 2007; Jiang, 2011; Aminu et al., 2017). During the early phase, supercritical CO2 is injected into the subsurface (Doughty, 2010; Bacci et al., 2011; Emami-Meybodi et al., 2015). Following subsurface injection, the supercritical CO2 remains a separate, migrating phase before slowly reacting with the connate water in the saline aquifer. This slow phase of reaction with saline groundwater leads to the formation of carbonic acid by the reaction.
We assume that the target aquifer has minimal buffering capacity, which leads to lower pH values. Therefore, given the time frame of the model used in this paper, H2CO3 will be dominant over bicarbonate species. Once the solution of CO2 is completed, the process of geological carbon sequestration (GCS), or mineralization of carbon, ensues. During this phase, dense, carbonic acid-rich groundwater descends into the porous host formation, reacting with the aluminosilicate and silicate minerals to form solid carbon deposits in the form of carbonate minerals, which takes place over time scales of 1,000 years. In this article, we focus on the mechanisms involved in this stage.
The process of carbonate mineralization by assimilation of dissolved H2CO3 takes place through a combination of density-driven porous flow, chemical reaction, and diffusion. The combination of these processes leads to a mechanism known as the reactive infiltration instability (RII) (Chadam et al., 1986), which has been associated with subsurface cavern or “wormhole” formation (Hinch and Bhatt, 1990; Szymczak and Ladd, 2013; Szymczak and Ladd, 2011) and chemical reaction between magmatic melts and mantle rocks (Aharonov et al., 1995; Spiegelman et al., 2001; Takei and Hier-Majumder, 2009; Sun et al., 2020a). An important manifestation of RII is the propagation of the reactive fluids into the aquifer through transient “channels” or “fingers”, which merge and interact with each other during the penetration of the reactive fluid into the saline aquifer (Riaz et al., 2006; Soltanian et al., 2016). Laboratory experiments on reactive porous flow of basaltic melt into olivine (Pec et al., 2015) and dense brine injection into a porous medium also support this observation (Kneafsey and Pruess, 2010; Vosper et al., 2014).
In addition to the flow regime, the physical and chemical characteristics of the saline aquifer or subsurface reservoir also exert an influence on the efficiency of GCS. Previous models of porous flow and laboratory experiments studied the efficiency of mass transfer as a function of two important dimensionless numbers: the Damköhler number (
In this work, we bridge this gap by studying the influence of formation porosity and the mineral composition on the efficiency of GCS in a porous saline aquifer. Our model begins after the supercritical CO2 has been injected into the aquifer and has reacted with the brine in the pore space to create a dense, H2CO3 rich pore fluid. In our numerical simulations, this dense pore fluid sinks into the unaffected formation by reactive porous flow. To model the deposition of solid carbonate resulting from the reaction between the H2CO3 rich fluid and the solid matrix, we carry out a series of 2D finite element simulations using a massively parallel open source software MuPoPP 1.2 (Hier-Majumder, 2020) running on the Oracle cloud computing platform. In these simulations, we vary the dimensionless Damköhler (
2. Model
2.1. Governing Equations and Boundary Conditions
We model the porous flow of a reactive, H2CO3 rich fluid as a reactive infiltration instability problem. As discussed above, this model focuses on the long term GCS process and begins after the supercritical CO2 has been pumped into the subsurface and equilibrated with the groundwater to create a dense, H2CO3 rich pore fluid. The density of the pore fluid, ρ, depends on the concentration of the dissolved H2CO3 in the pore water,
While a number of chemical reactions can take place between H2CO3 and subsurface minerals, the most common set of reactions involves aluminosilicates in the rock (Ghesmat et al., 2011; Zhang and Song, 2014). In this article, we focus on the influence on GCS driven by this chemical reaction between the solid and the pore fluid. We discuss the assumptions made in our model in detail in Section 2.2.
We provide the full set of dimensional equations, nondimensionalization schemes, and details of the numerical methods in the Supplementary Material. For brevity, here we present the final, dimensionless equations. In this set‐up, the velocity,
where ϕ is the constant porosity of the rock,
The rate of transport of dissolved H2CO3 in the pore fluid is controlled by advection via porous flow, chemical diffusion, and chemical reaction,
where
Finally, the rate of consumption of anorthite in the rock and the rate of production of CaCO3 are given by the two equations
where
The dimensionless quantities are defined by the relations
where
We solved the five governing Eq. 3–7 for the five unknowns—
In addition, we impose the initial conditions,
where [An] is a constant value of initial anorthite mass fraction in the aquifer. In order to explore the influence of aquifer composition on the efficiency of the GCS, we carried out a number of simulations with different values of [An].
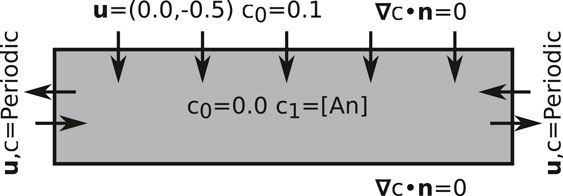
FIGURE 1. A schematic diagram outlining the domain of the numerical model with the boundary conditions.
The unknown
where
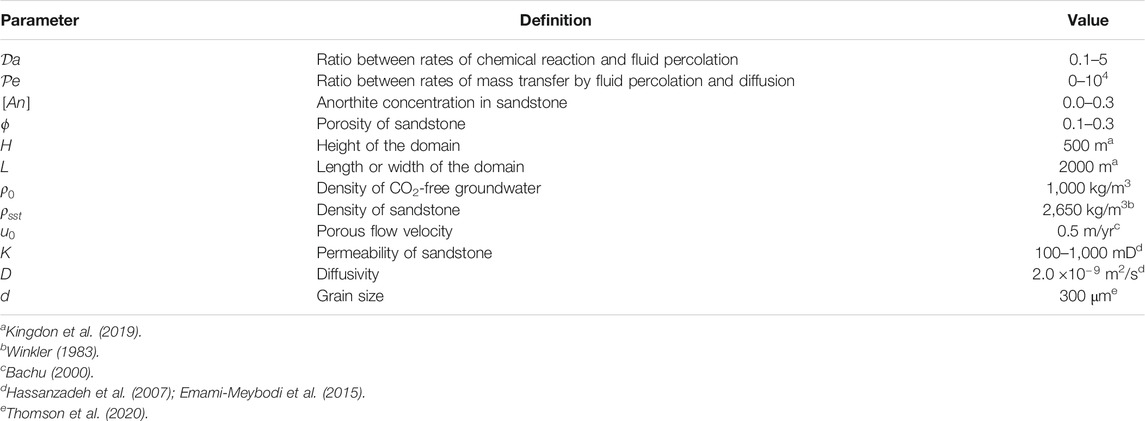
TABLE 1. Nondimensional numbers and dimensional constants used in this article. See Section 2.3 for more detailed description.
2.2. Model Assumptions
In this model, we focus on the influence of three parameters: aquifer porosity, initial abundance of Anorthite in the aquifer, and the chemical reaction rate on the structure of the fluid percolation and the amount of solid carbonate precipitation. To address the complex, nonlinear interplay among these factors, we made a few assumptions in our model.
First, we only consider the chemical reaction given in Eq. 2 and test the outputs of our models over a range of
Second, we ignore the influence of calcite precipitates on reducing the porosity and permeability of the aquifer. Within the timescale of our simulations, this effect is likely to play an insignificant role. As we show in Figure 6, the highest concentration of precipitated CaCO3 in our simulations is less than 0.5%. Recent microtomographic studies on permeability reduction by cementation show that porosity and permeability reduction by precipitates is negligible for cement volume fractions less than 3–5% (Thomson et al., 2019; Thomson et al., 2020). The assumption of constant porosity, therefore, is reasonable for the range of time considered in these simulations. With these caveats, we next discuss the range of parameters explored in this work.
2.3. Parameter Ranges
In this study, we focus on the influence of a number of factors on the modes and efficiency of GCS by reactive infiltration instability. These parameters are highlighted on Table 1. As discussed below, it is often difficult to assign a particular value of a characteristic dimensionless number such as
Despite a number of reports on the second order reaction rate for dissolution of silicate and aluminosilicate minerals (Oelkers and Schott, 1995; Palandri and Kharaka, 2004; Espinoza et al., 2011), direct estimates of
where
For the range of
3. Result
Our simulations identify the modes of penetration of dense H2CO3 rich fluid into the porous aquifer as a function of various parameters controlling the process. Some of these factors, such as porosity and aquifer composition, are potentially critical in GCS site selection. In Figures 2–4 we show sets of three snapshots of the concentration map of H2CO3 dissolved in the pore water
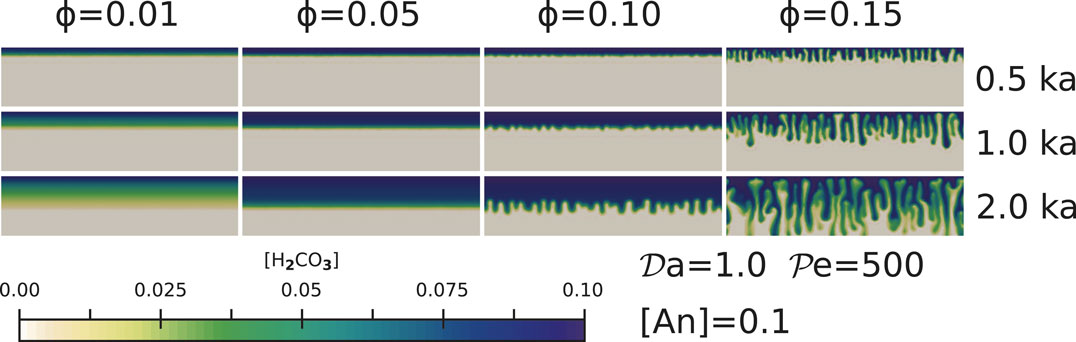
FIGURE 2. The effect of porosity on pore fluid percolation for simulations with
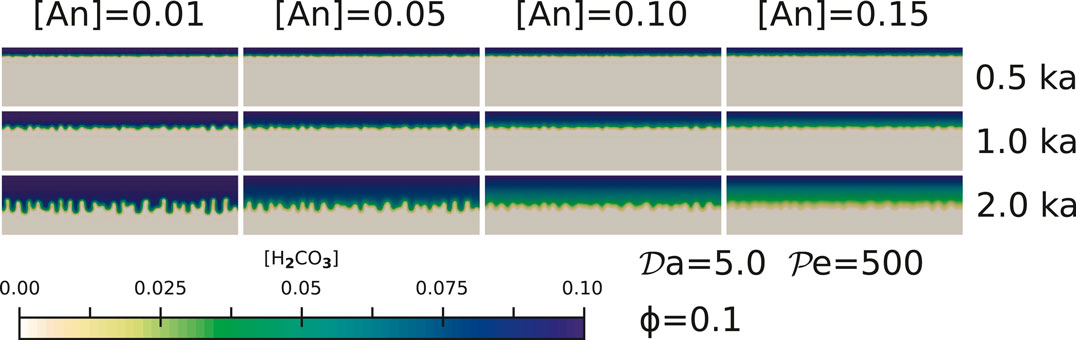
FIGURE 3. The effect of Anorthite concentrations for simulations with
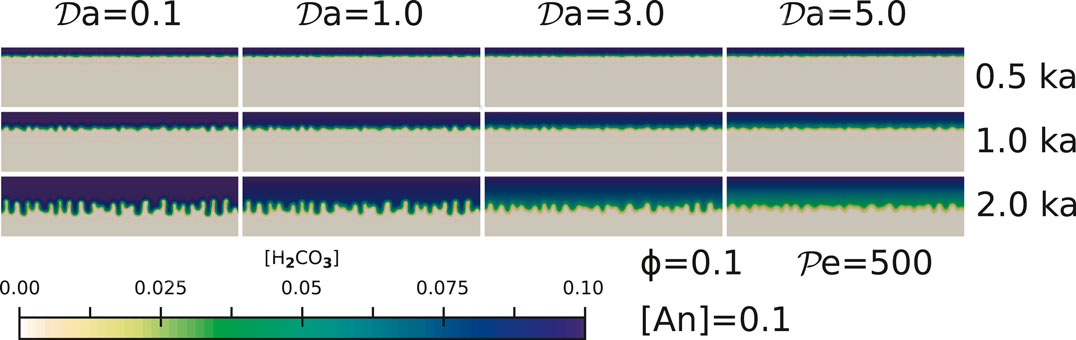
FIGURE 4. The effect of reaction rates for simulations with
3.1. The Effect of Porosity
Rock porosity exerts a strong influence on the mode of invasion of H2CO3 rich pore fluid into the aquifer, by controlling the shape of the reaction front. As outlined in Figure 2, for small values of porosity
While previous studies of reaction infiltration instability noticed the formation of channels (Hinch and Bhatt, 1990; Aharonov et al., 1995; Ghesmat et al., 2011; Sun et al., 2020a) and evolution of the channels (Riaz et al., 2006; Soltanian et al., 2016), none of these studies reported the transition of the flow from a slow planar front to a highly nonliner channeling instability with an increase in the porosity of the aquifer. The transition of the flow model from a planar front to channels indicates that GCS models need to incorporate the nonlinear effects arising from reactive infiltration instability. The spatial distribution of fluid flow rate is apparently heterogeneous, especially with the formation of channels. Therefore, if we use a parameterized, one-dimensional fluid flow rate when calculating CaCO3 precipitation, the efficiency of the GCS can be significantly under or over estimated.
3.2. The Effect of Anorthite Concentration and Reaction Rate
The extent of reaction between H2CO3 rich pore fluid and the aquifer matrix depends on both the availability of reactants (in this case, An) and the rate of chemical reactions. These two factors, while controlled by two different parameters, have a similar effect on the channel propagation.
A higher anorthite concentration [An] in the solid leads to more rapid consumption of the dissolved H2CO3 in the pore fluid, as observed in the series of simulations with increasing anorthite content in Figure 3. With an increasing consumption of the H2CO3 in the pore fluid, formation of the channeling instabilities at the reaction front are more subdued, as evidenced during each time step of the comparative snapshots. We observe the strongest channel formation after 2 ka in the simulations with [An] = 0.01. In contrast, the simulations with [An] = 0.15 (15 wt% anorthite in the initial solid composition) display weak channels containing lower concentrations of the dissolved H2CO3 as evidenced by the colormap. While these channels penetrate into the aquifer, the dissolved H2CO3 in the channels are quickly consumed by the high concentration of anorthite in the surrounding, unreacted rock. As a result, the amount of CaCO3 precipitation is much higher in these cases, an issue we discuss in Section 4.1.
High reaction rates, represented by high values of
4. Discussion
The results presented in Section 3 demonstrate the influence of the control parameters on the structure of the RII. In this section, we summarize the influence of porosity, initial abundance of anorthite, and the rate of reaction on the mass of
4.1. Capacity of Deep Saline Aquifers as GCS Sites
An important outcome of numerical modeling of GCS is an estimate for the amount of carbon permanently sequestered in solid mineral phases. The formulation in Eq. 13 provides the dimensional form of this time-dependent mass. As discussed earlier, we integrate the CaCO3 deposition rate over a volume of 500 m thick and 2 km wide aquifer over 2000 years. The resultant values of permanently sequestered CaCO3 mass are strongly dependent on the parameters studied in this work, as illustrated by the plots in Figures 5A,B.
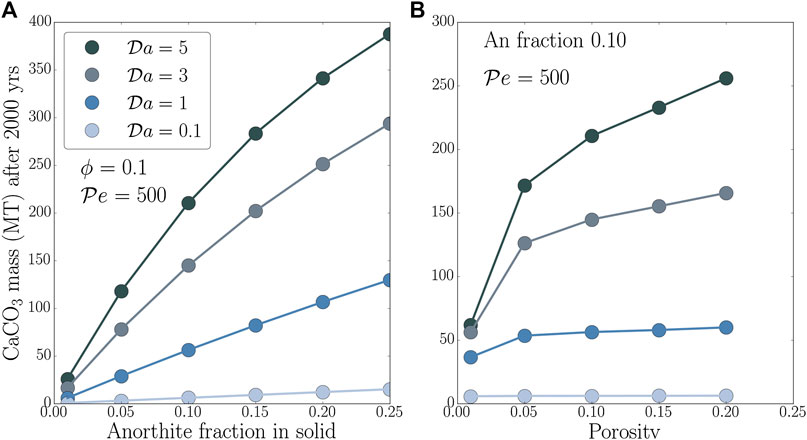
FIGURE 5. Mass of precipitated CaCO3 after 2000 years as a function of (A) anorthite mass fraction in sandstone
Aquifer properties characterized by initial anorthite mass fraction and porosity strongly influence the sequestered CaCO3 mass. The plot in Figure 5A shows that this mass increases with the initial mass fraction of anorthite in the solid. Moreover, the trend of the growth is greatly modulated by the value of the
Porosity of the aquifer exerts a similar, but slightly more moderate influence on the mass of precipitated CaCO3. The plot in Figure 5B demonstrates this influence for values of
The cumulative mass fraction of CaCO3 sequestered by GCS varies with time. The plot in Figure 6 shows the evolution of the volume-averaged CaCO3 mass fraction with time for four different aquifers. The top curves, shaded in gray, correspond to an aquifer containing 20% anorthite in the bulk, and the upper and lower limits are fixed by porosity values of 15 and 5% respectively. The bottom set of curves correspond to an aquifer containing 10% anorthite in the bulk. While following the conclusions drawn from the previous results, this plot also outlines that the process of GCS starts to produce appreciable CaCO3 deposition at least after 500 years, but gains pace with time. This increase in rate is related to the penetration of the channels to the bottom of the aquifer and reacting with a larger amount of unreacted anorthite.
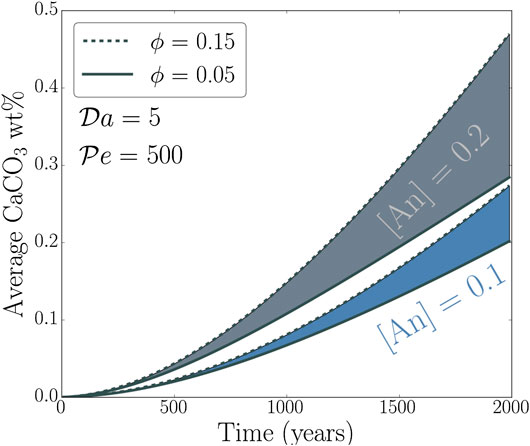
FIGURE 6. Volume averaged concentration of precipitated CaCO3 in the aquifer as a function of time with different anorthite fractions and porosities.
4.2. Geological Criteria for Future CCS Site Selection
As discussed by Hosa et al. (2011) and Celia (2017), current CCS sites contain rocks with a wide range of porosity values. To meet the challenge of carbon neutralization, and increase the current global injection rate of
The amount of immobilized CO2, namely precipitated CaCO3, is influenced by initial anorthite amount and the reaction rate, as shown in Figure 5A. For a moderate reaction rate (
We observe that in deep saline aquifers containing
5. Conclusion
Our simulations demonstrate the presence of two distinct regimes of porous flow: planar front propagation at porosities less than 10% and channel formation at higher porosities. When comparing percolation rates into the aquifer, H2CO3 rich pore fluids percolate faster along channels than planar reaction fronts. The amount of CaCO3 precipitation by GCS increases with both an increase in the
Data Availability Statement
The datasets generated for this study are available on request to the corresponding author. The source code for the simulation, MuPoPP1.2.0 (Multiphase Porous flow and Physical Properties) is publicly available (Hier‐Majumder et al., 2020). Simulation data is also available for download through the Royal Holloway Figshare repository (Sun et al., 2020b).
Author Contributions
YS, RP, and SH-M developed the source code. YS carried out the simulations. AK provided information about the parameters around the planned UKGEOS observatory. All authors contributed toward writing the manuscript.
Funding
The computational resources for this work was provided by a computational grant from Oracle Research. RP was funded by the NERC London Doctoral Training Partnership, grant number NE/L002485/1 and matching case funding grant from the BGS.
Conflict of Interest
The authors declare that the research was conducted in the absence of any commercial or financial relationships that could be construed as a potential conflict of interest.
Acknowledgments
The authors wish to thank Frank Lehane (RHUL) for his support. Anirban Basu (RHUL) and Andy Kilpatrick (BGS) provided insightful suggestions on the manuscript. This manuscript was published with the permission of the Executive Director of the British Geological Survey (UKRI).
Supplementary Material
The Supplementary Material for this article can be found online at: https://www.frontiersin.org/articles/10.3389/feart.2020.533588/full#supplementary-material
References
Aharonov, E., Whitehead, J. P., Kelemen, P. B., and Spiegelman, M. (1995). Chanelling instability of upwelling melt in the mantle. J. Geophys. Res. Solid Earth 100, 20433–20450. 10.1029/95JB01307
Aminu, M. D., Nabavi, S. A., Rochelle, C. A., and Manovic, V. (2017). A review of developments in carbon dioxide storage. Appl. Energy 208, 1389–1419. doi:10.1016/j.apenergy.2017.09.015
Bacci, G., Korre, A., and Durucan, S. (2011). An experimental and numerical investigation into the impact of dissolution/precipitation mechanisms on CO2 injectivity in the wellbore and far field regions. Int. J. Greenh. Gas Control 5, 579–588. doi:10.1016/j.ijggc.2010.05.007
Bachu, S. (2000). Sequestration of CO2 in geological media: criteria and approach for site selection in response to climate change. Energy Convers. Manag. 41, 953–970. doi:10.1016/s0196-8904(99)00149-1
Celia, M. A. (2017). Geological storage of captured carbon dioxide as a large-scale carbon mitigation option. Water Resour. Res. 53, 3527–3533. doi:10.1002/2017WR020841
Chadam, J., Hoff, D., Merino, E., Ortoleva, P., and Sen, A. (1986). Reactive infiltration instabilities. IMA J. Appl. Math. 36, 207–221. doi:10.1093/imamat/36.3.207
Class, H., Ebigbo, A., Helmig, R., Dahle, H. K., Nordbotten, J. M., Celia, M. A., et al. (2009). A benchmark study on problems related to CO2 storage in geologic formations. Comput. Geosci. 13, 409. doi:10.1007/s10596-009-9146-x
Doughty, C., (2010). Investigation of CO2 plume behavior for a large-scale pilot test of geologic carbon storage in a saline formation. Transp. Porous Media 82, 49–76. doi:10.1007/s11242-009-9396-z
Emami-Meybodi, H., Hassanzadeh, H., and Ennis-King, J. (2015). CO2 dissolution in the presence of background flow of deep saline aquifers. Water Resour. Res. 51, 2595–2615. 10.1002/2014WR016659
Espinoza, D. N., Kim, S. H., and Santamarina, J. C. (2011). CO2 geological storage—geotechnical implications. KSCE J. Civ. Eng. 15, 707–719. doi:10.1007/s12205-011-0011-9
Friedlingstein, P., Jones, M. W., O’Sullivan, M., Andrew, R. M., Hauck, J., Peters, G. P., et al. (2019). Global carbon budget 2019. Earth Syst. Sci. Data 11, 1783–1838. doi:10.5194/essd-11-1783-2019
Friedmann, S. J. (2007). Geological carbon dioxide sequestration. Elements 3, 179–184. doi:10.2113/gselements.3.3.179
Ghesmat, K., Hassanzadeh, H., and Abedi, J. (2011). The impact of geochemistry on convective mixing in a gravitationally unstable diffusive boundary layer in porous media: CO2 storage in saline aquifers. J. Fluid Mech. 673, 480–512. doi:10.1017/s0022112010006282
Hassanzadeh, H., Pooladi-Darvish, M., and Keith, D. W. (2007). Scaling behavior of convective mixing, with application to geological storage of CO2. AIChE J. 53, 1121–1131. doi:10.1002/aic.11157
Hier-Majumder, S.,, and Abbott, M. E. (2010). Influence of dihedral angle on the seismic velocities in partially molten rocks. Earth Planet Sci. Lett. 299, 23–32. doi:10.1016/j.epsl.2010.08.007
Hier-Majumder, S. [Dataset] (2020). MuPoPP 1.2.0: a finite elements solver for multiphase flow problems. Available at: https://github.com/sashgeophysics/MuPoPP/tree/v1.2.0 (Accessed January 30, 2020).
Hinch, E. J.,, and Bhatt, B. S. (1990). Stability of an acid front moving through porous rock. J. Fluid Mech. 212, 279–288. doi:10.1017/S0022112090001963
Hosa, A., Esentia, M., Stewart, J., and Haszeldine, S. (2011). Injection of CO2 into saline formations: benchmarking worldwide projects. Chem. Eng. Res. Des. 89, 1855–1864. doi:10.1016/j.cherd.2011.04.003
Jiang, X. (2011). A review of physical modelling and numerical simulation of long-term geological storage of CO2. Appl. Energy 88, 3557–3566. doi:10.1016/j.apenergy.2011.05.004
Kingdon, A., Fellgett, M., and Spence, M. (2019). Open Report OR/18/055. UKGEOS Cheshire energy research field site: science infrastructure: version 2. British Geological Survey Available at: http://nora.nerc.ac.uk/id/eprint/525100 (Accessed September 13, 2019).
Kneafsey, T. J.,, and Pruess, K. (2010). Laboratory flow experiments for visualizing carbon dioxide-induced, density-driven brine convection. Transp. Porous Media 82, 123–139. doi:10.1007/s11242-009-9482-2
Le Quéré, C., Andrew, R. M., Friedlingstein, P., Sitch, S., Pongratz, J., Manning, A. C., et al. (2018). Global carbon budget 2018. Earth Syst. Sci. Data 10, 2141–2194. doi:10.5194/essd-2017-123
Odenberger, M., Kjärstad, J., and Johnsson, F. (2013). Prospects for CCS in the EU energy roadmap to 2050. Energy Procedia 37, 7573–7581. doi:10.1016/j.egypro.2013.06.701
Oelkers, E. H.,, and Schott, J. (1995). Experimental study of anorthite dissolution and the relative mechanism of feldspar hydrolysis. Geochem. Cosmochim. Acta 59, 5039–5053. doi:10.1016/0016-7037(95)00326-6
Palandri, J. L.,, and Kharaka, Y. F. (2004). Open File Report.: 2004-1068. A compilation of rate parameters of water-mineral interaction kinetics for application to geochemical modeling. Available at: https://pubs.usgs.gov/of/2004/1068/ (Accessed March 2004).
Pec, M., Holtzman, B. K., Zimmerman, M., and Kohlstedt, D. L. (2015). Reaction infiltration instabilities in experiments on partially molten mantle rocks. Geology 43, 575–578. doi:10.1130/G36611.1
Riaz, A., Hesse, M., Tchelepi, H. A., and Orr, F. M. (2006). Onset of convection in a gravitationally unstable diffusive boundary layer in porous media. J. Fluid Mech. 548, 87–111. doi:10.1017/S0022112005007494
Snæbjörnsdóttir, S., Oelkers, E. H., Mesfin, K., Aradóttir, E. S., Dideriksen, K., Gunnarsson, I., et al. (2017). The chemistry and saturation states of subsurface fluids during the in situ mineralisation of CO2 and H2S at the CarbFix site in SW-Iceland. Int. J. Greenh. Gas Control 58, 87–102. doi:10.1016/j.ijggc.2017.01.007
Soltanian, M. R., Amooie, M. A., Dai, Z., Cole, D., and Moortgat, J. (2016). Critical dynamics of gravito-convective mixing in geological carbon sequestration. Sci. Rep. 6, 35921. doi:10.1038/srep35921
Spence, B., Horan, D., and Tucker, O. (2014). The peterhead-goldeneye gas post-combustion CCS project. Energy Procedia 63, 6258–6266. doi:10.1016/j.egypro.2014.11.657
Spiegelman, M., Kelemen, P. B., and Aharonov, E. (2001). Causes and consequences of flow organization during melt transport: the reaction infiltration instability in compactible media. J. Geophys. Res. 106, 2061–2077. doi:10.1029/2000jb900240
Steefel, C. I.,, and Lasaga, A. C. (1994). A coupled model for transport of multiple chemical species and kinetic precipitation/dissolution reactions with application to reactive flow in single phase hydrothermal systems. Am. J. Sci. 294, 529–592. doi:10.2475/ajs.294.5.529
Sun, Y., Hier-Majumder, S., Xu, Y., and Walter, M. (2020a). Stability and migration of slab-derived carbonate-rich melts above the transition zone. Earth Planet Sci. Lett. 531, 116000. doi:10.1016/j.epsl.2019.116000
Sun, Y., Payton, R., Hier-Majumder, S., and Kingdon, A. (2020b). CCS_2D_CSV.tar.gz. doi:10.17637/rh.11770269.v1
Szymczak, P.,, and Ladd, A. J. C. (2011). Instabilities in the dissolution of a porous matrix. Geophys. Res. Lett. 38, L07403. doi:10.1029/2011GL046720
Szymczak, P.,, and Ladd, A. J. C. (2013). Interacting length scales in the reactive-infiltration instability. Geophys. Res. Lett. 40, 3036–3041. doi:10.1002/grl.50564
Takei, Y., and Hier-Majumder, S. (2009). A generalized formulation of interfacial tension driven fluid migration with dissolution/precipitation. Earth Planet Sci. Lett. 288, 138–148. doi:10.1016/j.epsl.2009.09.016
Thomson, P.-R., Ellis, R., Chiarella, D., and Hier-Majumder, S. (2020). Microstructural analysis from x-ray ct images of the brae formation sandstone, north sea. Front. Earth Sci. 8, 246. 10.3389/feart.2020.00246
Thomson, P.-R., Hazel, A., and Hier-Majumder, S. (2019). The influence of microporous cements on the pore network geometry of natural sedimentary rocks. Front. Earth Sci. 7, 48. doi:10.3389/feart.2019.00048
Vosper, H., Kirk, K., Rochelle, C., Noy, D., and Chadwick, A. (2014). Does numerical modelling of the onset of dissolution-convection reliably reproduce this key stabilization process in CO2 Storage? Energy Procedia 63, 5341–5348. doi:10.1016/j.egypro.2014.11.566
Wimert, J.,, and Hier-Majumder, S. (2012). A three-dimensional microgeodynamic model of melt geometry in the Earth’s deep interior. J. Geophys. Res. 117, B04203. doi:10.1029/2011JB009012
Winkler, K. W. (1983). Frequency dependent ultrasonic properties of high-porosity sandstones. J. Geophys. Res. Solid Earth 88, 9493–9499. doi:10.1029/jb088ib11p09493
Keywords: geological carbon sequestration, carbon capture and sequestration, reactive infiltration instability, carbonate precipitation, porous flow
Citation: Sun Y, Payton RL, Hier-Majumder S and Kingdon A (2020) Geological Carbon Sequestration by Reactive Infiltration Instability. Front. Earth Sci. 8:533588. doi: 10.3389/feart.2020.533588
Received: 10 February 2020; Accepted: 29 September 2020;
Published: 17 December 2020.
Edited by:
Paul Frederick Dennis, University of East Anglia, United KingdomReviewed by:
Brian A. Haley, Oregon State University, United StatesJames Gardiner, Battelle, United States
Copyright © 2020 Sun, Payton, Hier-Majumder and Kingdon. This is an open-access article distributed under the terms of the Creative Commons Attribution License (CC BY). The use, distribution or reproduction in other forums is permitted, provided the original author(s) and the copyright owner(s) are credited and that the original publication in this journal is cited, in accordance with accepted academic practice. No use, distribution or reproduction is permitted which does not comply with these terms.
*Correspondence: Yizhuo Sun, yizhuo.sun.2017@live.rhul.ac.uk