Does Heterogeneous Strain Act as a Control on Seismic Anisotropy in Earth’s Lower Mantle?
 Samantha Couper
 Sergio Speziale
 Hauke Marquardt3
 - 1Department of Geology and Geophysics, University of Utah, Salt Lake City, UT, United States
- 2Chemistry and Physics of Earth Materials, Deutsches GeoForschungsZentrum GFZ, Potsdam, Germany
- 3Department of Earth Sciences, University of Oxford, Oxford, United Kingdom
- 4Photon Sciences Deutsches Elektronen Synchrotron, DESY, Hamburg, Germany
Plastic deformation and texture development in minerals of the lower mantle can result in seismic anisotropy, and studying deformation of lower mantle materials is therefore important for interpreting lower mantle flow. Most previous deformation experiments documenting texture development at lower mantle pressures have been conducted on single-phase samples and/or at room temperature. However, real rocks deform at high temperature and are poly-phase and deformation is therefore likely different from that of a single phase. Here we report on high temperature diamond anvil cell deformation experiments on a multiphase assemblage of bridgmanite, ferropericlase, and ringwoodite compressed from ∼28 to ∼39 GPa and resistively heated at a constant temperature of 1,000 K. We employ the elasto-viscoplastic self-consistent method to model both texture and lattice strain of bridgmanite as a function of deformation mechanisms. Simulations indicate deformation of bridgmanite is accommodated by about half of slip activity on (100)[010] with the remainder split between (100)[001] and/or (100)〈011〉. Texture in bridgmanite is consistent with most seismic observations in the lowermost mantle. Although there is texture development in both bridgmanite and ringwoodite, ferropericlase does not develop coherent texture throughout the course of the experiment. Analysis of lattice strains suggests that the lack of coherent texture development in ferropericlase is due to heterogeneous plastic deformation resulting from microstructural interactions imposed by other phases. Variations in texturing of bridgmanite and ferropericlase could therefore cause laterally varying, complex anisotropy. Our models for binary mantle-like mixtures of bridgmanite and ferropericlase show that changes in strain and texture partitioning can explain the range of observed lower mantle anisotropies.
Introduction
Seismic anisotropy has been linked to geodynamic processes such as flow in the upper mantle (Ribe, 1989; Dawson and Wenk, 2000). Lower mantle dynamics are less well constrained and studying lower mantle rheology may shed light on large-scale mantle convection and the fate of subducted slabs at the core-mantle boundary (CMB). The bulk of the lower mantle is seismically isotropic and it has been suggested that diffusion creep, which may not produce seismic anisotropy, dominates in most of the lower mantle (Karato and Li, 1992). Seismic anisotropy is observed at several locations in the shallow lower mantle, in the vicinity of subducted lithospheric slabs, and in the lowermost mantle just above the CMB (see Romanowicz and Wenk, 2017 for a review). Deformation in these regions is proposed to be accommodated by dislocation creep, leading to texture (crystallographic preferred orientation) of lower mantle minerals which can result in seismic anisotropy (McNamara et al., 2002). The lower mantle is widely believed to be dominated by bridgmanite and ferropericlase (Wang et al., 2015; Kurnosov et al., 2017). Both phases have been proposed as a dominant contributor to shear wave splitting in the top part of the lower mantle (Karki et al., 1999; Wenk et al., 2006a; Long and Silver, 2009; Marquardt et al., 2009; Lynner and Long, 2015; Tsujino et al., 2016; Immoor et al., 2018; Ferreira et al., 2019). However, previous inferences were predominantly based on texture measurements performed on mono-mineralic samples.
In the D” region, which lies just above the CMB, seismic anisotropy is often attributed to preferred alignment of magnesium silicate post-perovskite (pPv; e.g., Miyagi et al., 2010; Wu et al., 2017). The single crystal elastic shear anisotropy of pPv is significantly greater than bridgmanite (Wentzcovitch et al., 2006), and thus pPv has the potential to produce larger bulk anisotropy. Indeed, calculations of texturing and bulk anisotropy for pPv are broadly consistent with seismic observations in the D” (Creasy et al., 2020; Miyagi et al., 2010; Wu et al., 2017; see also Romanowicz and Wenk 2017 for a review) and this further supports its presence in the D” and its importance to lowermost mantle anisotropy. However, variations in the estimations of both core temperatures and the bridgmanite-to-pPv Clapeyron slope will change the depth of the stability field of pPv (Spera et al., 2006; Hernlund and Labrosse, 2007). Additionally, the substitution of Fe and Al into the perovskite structure complicates the transition between bridgmanite and pPv, and bridgmanite is likely to be stable in a large number of regions above the core mantle boundary (Akber-Knutson et al., 2005; Hernlund et al., 2005; Spera et al., 2006; Tateno et al., 2007; Catalli et al., 2009; Andrault et al., 2010; Grocholski et al., 2012; see also Hirose et al., 2017 for a review). Therefore, end-member contributions to seismic anisotropy from bridgmanite and its interactions with other lower mantle mineral phases should be included when considering deformation behavior of the lowermost mantle.
Determining the dominant contributor to lower mantle seismic anisotropy from multiphase experiments is important because variations in strain partitioning among phases may change the effective anisotropy of a polycrystalline aggregate with respect to simple averaging expected from single-phase properties. A limited number of experimental studies have examined texture in situ in multiphase samples composed of lower mantle minerals and analogs (Wang et al., 2013; Kaercher et al., 2016; Miyagi and Wenk, 2016), but no study has analyzed texture development in a lower mantle rock deformed at lower mantle pressures and high temperature.
Here, we report results of in situ high-temperature deformation experiments at lower mantle pressures on an aggregate composed mostly of bridgmanite and ferropericlase. Our experiments are performed using a resistive heated radial diamond anvil cell (RDAC) (Liermann et al., 2009; Merkel et al., 2013; Miyagi et al., 2013; Immoor et al., 2018; Immoor et al., 2020) that allows for a continuous and uniform heating of samples deformed at lower mantle pressures. In-situ radial X-ray diffraction records lattice strain and texture development. While this study did not achieve lowermost mantle pressures and temperatures, it is the first to examine texture formation in a multiphase aggregate composed of lower mantle minerals at simultaneous high temperature and pressure. Therefore, our results add new information to inferences made from texturing in mono-mineralic samples and to the understanding of the effects of strain partitioning among minerals in the lower mantle.
Materials and Methods
Experiment
Experiments were carried out at beamline P02.2 at the 3rd generation light source, PETRA III, in Hamburg, Germany. Starting material was San Carlos olivine (Mg0.89–0.91Fe0.9–0.11SiO4; Fournelle, 2011) with a small platinum flake added as a pressure standard (Fei et al., 2007). The 50 μm wide sample was housed in an amorphous boron epoxy gasket (50 μm initial thickness) with a Kapton confining ring (Merkel and Yagi, 2005) and compressed between two 300 μm flat culet diamond anvils using a gas membrane. The sample was compressed offline to 30 GPa, as measured by the diamond Raman edge pressure scale (Akahama and Kawamura, 2004). The sample was then converted with offline laser heating by rastering the laser (20–30 μm spot size) over the sample for ∼15 min. Constraints imposed by the resistive heated-DAC sample stage do not allow online laser heating when the end station is configured for resistive heating (Liermann et al., 2009; Immoor et al., 2020). Thus, laser heating was done offline and no diffraction images were taken prior to or during conversion. To inhibit the growth of large grains, laser heating was performed at the lowest possible temperature that the phase transformation could be induced following the protocol described in Miyagi and Wenk (2016). Temperature was below the threshold that can be measured with spectroradiometry, but we estimate average temperatures were on the order of 1,300 K. Conversion was monitored by the change in sample appearance from transparent to opaque when viewed in transmitted light (Miyagi and Wenk 2016).
The resistive heating array (Liermann et al., 2009; Immoor et al., 2020) was assembled post-conversion, and a radial diffraction image was taken to confirm the presence of bridgmanite. The aggregate was then gradually heated to ∼1,000 K over the course of 3 h and 15 min. Temperature was measured with an R-type thermocouple placed on the diamond pavilion near the culet and previous studies have found temperature gradients of no more than ±60 K with this method (Liermann et al., 2009; Merkel et al., 2013). Once the sample was at ∼1,000 K, a radial diffraction image was taken to record aggregate properties such as pressure, lattice strains, and textures among phases prior to simultaneous heating and compression (Figure 1). Pressure was 28 GPa based on the platinum equation of state (Fei et al., 2007) with errors on the order of ±1 GPa (Liermann et al., 2009). Over 75 min, the sample was compressed in five steps from ∼28 to ∼39 GPa while maintaining a constant temperature of 1,000 K (Table 1). Diffraction images were collected in situ in radial geometry on a Perkin Elmer (XRD1621) detector located ∼600 mm from the sample. The detector was exposed for 30 s to a 42.7 keV (0.28965 Å) X-ray beam focused by compound refractive optics to a spot with a full width of 8 μm × 3 μm at half its maximum intensity. Due to failure of the gasket and diamonds at ∼39 GPa, no diffraction images could be gathered on decompression and the sample was not recoverable.
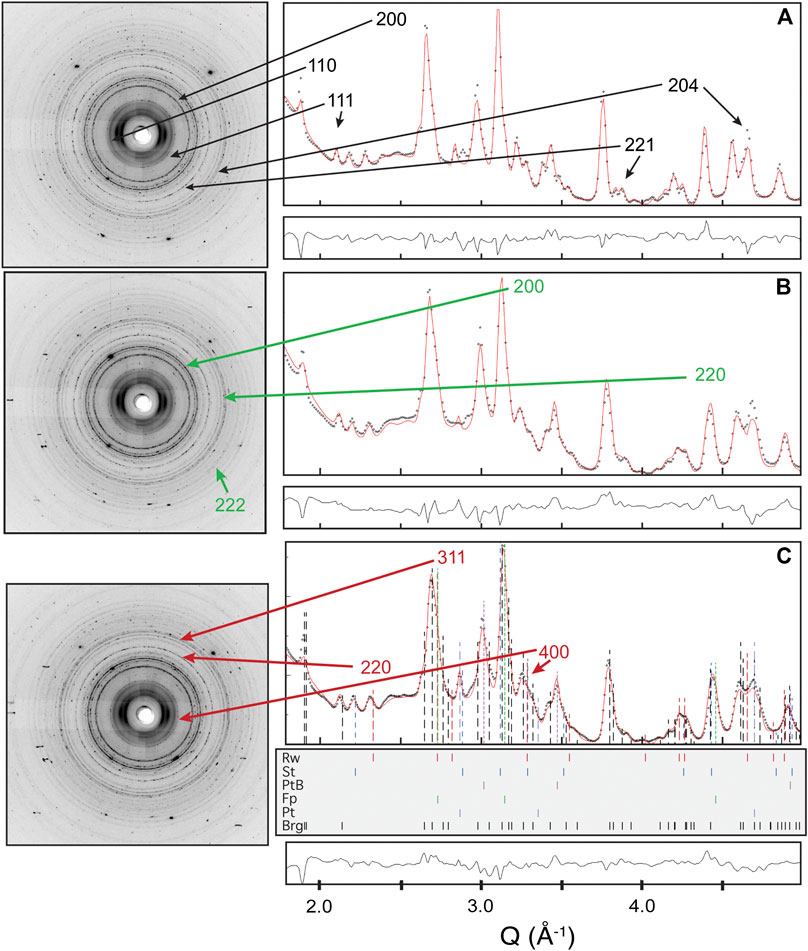
FIGURE 1. Diffraction images (left) and Rietveld refinement fits for the average of all 5° spectra (right) from the software Materials Analysis Using Diffraction for (A) image 139 taken after raising the temperature of the converted aggregate to 1,000 K but before additional compression, (B) image 160 showing the partially compressed aggregate, and (C) image 172 taken at the final stage of compression. Colored, dashed vertical lines of arbitrary height indicate peak locations. Diffraction peaks used for reported Q(hkl) for bridgmanite, ferropericlase, and ringwoodite are labeled on plots (A), (B), and (C), respectively.
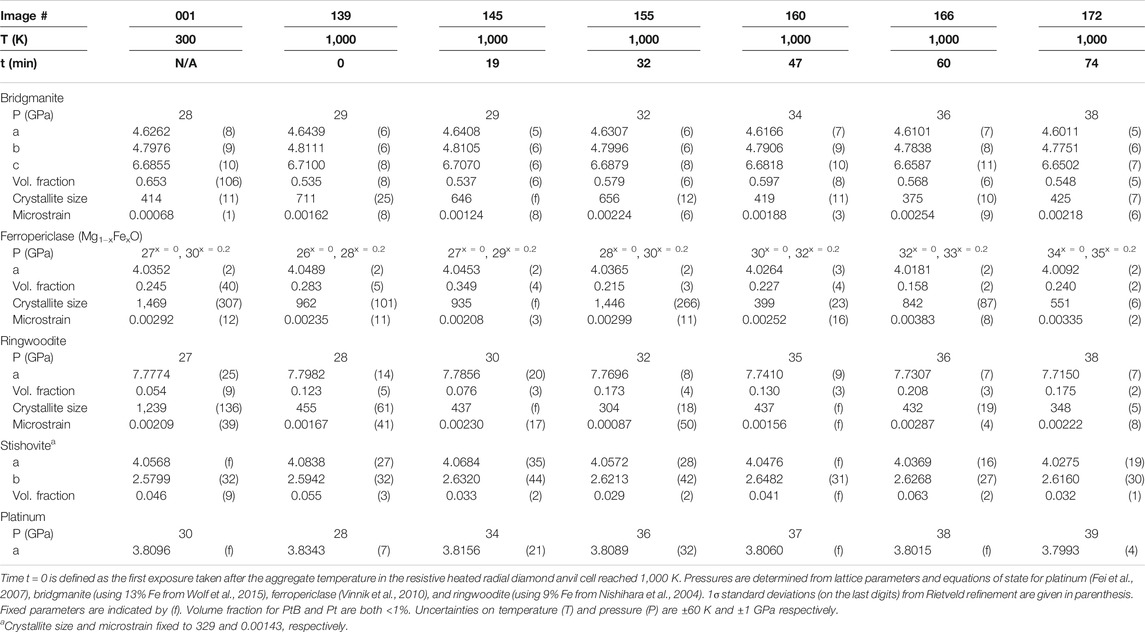
TABLE 1. Experimental conditions and Rietveld fit results (using Materials Analysis Using Diffraction) of in situ diffraction images.
Data Refinement
2-D diffraction images were converted in 5° increments to 72 spectra using Fit2d (Hammersley et al., 1996) and converted into single datasets (.esg files) using the program fit2d2maud (Merkel, 2008). The .esg files from this conversion are available from the repository Zenodo. The diffraction patterns were analyzed by the Rietveld method using the software package Materials Analysis Using Diffraction (MAUD; Lutterotti et al., 1997; Figures 1, 2). The first two steps of the data analysis are: one, calibration; two, lattice strain and texture analysis (Lutterotti et al., 2014; Wenk et al., 2014). Lattice strains are fit with the model “radial diffraction in the DAC” (Singh et al., 1998). Textures were refined using the Entropy modified Williams, Imhof, Matthies and Vinel (E-WIMV) model (Chateigner et al., 2019) to produce an orientation distribution function with a resolution of 10°. The E-WIMV model is optimized for incomplete and arbitrary pole figure coverage, and alleviates problems associated with overlapping diffraction peaks. Inverse pole figures are calculated from the orientation distribution function by exporting data into Beartex (Wenk et al., 1998) and smoothing with a 7.5° Gaussian filter. The inverse pole figures of the compression direction show the probability of finding a pole to a plane in the compression direction. This probability is expressed in multiples of random distribution (m.r.d.), where an m.r.d. of 1 is random, an m.r.d. > 1 indicates higher probability, and an m.r.d. < 1 indicates lower probability.
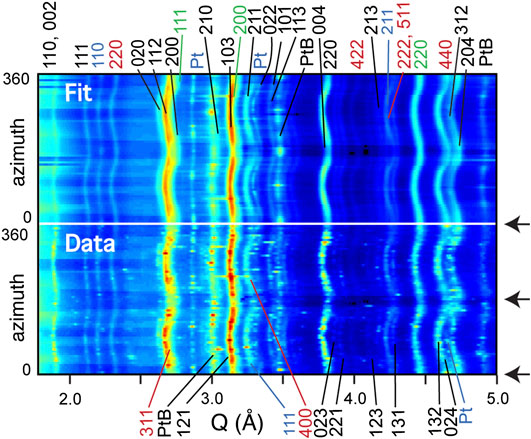
FIGURE 2. “Map-plot” of spectra obtained by integrating the diffraction image in 5° azimuthal sectors and corresponding Rietveld refinement (top). Map-plot is of image 172 and was taken in-situ at ∼39 GPa and 1,000K. Black arrows indicate compression direction. Pt, PtB peaks are labeled. Peaks for stishovite shown in blue, ringwoodite in red, and ferropericlase in green. Black labeled peaks are bridgmanite.
The ferropericlase 111 peak overlaps with both the ringwoodite 311 and the bridgmanite 200 peak (Figures 1, 2) and changes in refined values of one of these has an effect on the refinement of the other. Therefore, unless one of the diffraction peaks is independently informed, the interplay between the overlapping diffraction peaks may bias lattice strain and texture refinement for all three phases. A practical solution to this problem is refinement over a d-spacing range that includes the ferropericlase diffraction peak for 222 (∼1.75–5.90 Å−1). Unfortunately, this range contains a large number of low-intensity diffraction peaks which destabilizes the refinement and convergence could not be obtained. We refine over ∼1.75–5.90 Å−1 only to obtain lattice strains for the diffraction peaks of ferropericlase 222 and 311. Any unstable parameters are fixed to allow refinement of the ferropericlase lattice strain. Once completed, the lattice strain value of 222 is input as the value for 111 and fixed. The refinement is then restricted ∼1.75–5.00 Å−1, previously fixed crystallographic parameters are freed, and the refinement proceeds for lattice strain and texture as described above.
Lattice Strain Analysis and Plastic Deformation
Lattice strains produced by uniaxial stress along diffracting lattice plain normals, Q(hkl), are determined following the theory presented by Singh et al. (1998) as part of the Rietveld full spectrum analysis described above. In an elastic regime, lattice strains are related to differential stress (t) and the aggregate shear modulus under Voigt condition (iso-strain; GV) and the Reuss condition [iso-stress; GR(hkl)] (Singh et al., 1998).
Where α is a parameter giving the weight between the Voigt and Reuss bounds. An aggregate deforming elastically should have a value for α that falls within the bounds of the Voigt and Reuss conditions (0 ≤ α ≤ 1).
When plastic deformation occurs the value of α is instead unconstrained, and can exceed the elastic bounds (Chen et al., 2006). The analysis of the evolution of lattice strains with compression is thus useful to evaluate the presence of plastic deformation in the case of weak or absent texture development in complex multiphase aggregates such as we observe for ferropericlase in this experiment (see Discussion below).
Elasto-Viscoplastic Self-Consistent Modeling
Texture development is dependent on deformation geometry and deformation mechanisms. Since the deformation geometry is known for a DAC experiment, texture development can be used to constrain deformation mechanisms (Wenk et al., 2006b). However, inferring the mechanism of texture formation can result in a non-unique solution. Such is the case for bridgmanite, where models of different slip systems may produce the same texture (Miyagi and Wenk, 2016). Lattice strain, Q(hkl), further constrains active slip systems because Q(hkl) anisotropy is also a function of deformation mechanisms (Turner and Tomé, 1994). The elasto-viscoplastic self-consistent (EVPSC) code (Wang et al., 2010) models both texture and Q(hkl) as a function of deformation mechanisms and is therefore preferable to VPSC code (Lebensohn and Tomé, 1993) where only texture can be modeled. EVPSC has been recently adapted to model high pressure deformation experiments (Lin et al., 2017). Using the EVPSC code, we have modeled the deformation of bridgmanite and compared the results with our experimental lattice strains and textures in order to identify the combination of slip systems consistent with both elastic and plastic behavior observed in our complex sample material (Supplementary Text 1.1).
Results
Experimental Results
Synthesis with laser heating resulted in an aggregate composed of bridgmanite, ferropericlase, ringwoodite, and stishovite (Table 1). Pt and PtB (platinum boride) were also present and make up <1% of the aggregate volume. The volume fraction of phases is determined by the least squares full spectrum Rietveld fits. Due to the complexity of bridgmanite and ringwoodite structures, the uncertainty on Fe partitioning (which affects relative peak intensities), and the complexity of the combined stress and texture fit, we consider these volume fractions an estimation with an uncertainty not smaller than ±5 vol%. This uncertainty propagates to our calculated total (Fe + Mg)/Si ratio (∼1.88 for image 145) based on the estimated volume fractions. In addition, different diffraction images likely sample slightly different regions of the sample. This is due to the very small size of the X-ray beam with respect to the width of the sample chamber.
After conversion by laser heating, the inverse pole figure for bridgmanite has a maximum near 100 (1.8 m.r.d) that is offset toward 110 (Figure 3A; Supplementary Table S1). This is consistent with previously observed transformation textures associated with synthesis of bridgmanite from olivine (Wenk et al., 2006b; Miyagi and Wenk 2016). Both ferropericlase and ringwoodite show a weak texture (1.3 m.r.d.) (Figure 3A; Supplementary Table S1). Upon reaching 1,000 K in the resitive heating assemblage, texture in bridgmanite is slightly weaker (1.6 m.r.d.) and has shifted toward 100. Ferropericlase (1.1 m.r.d.) and ringwoodite (1.2 m.r.d.) are near random (Figure 3B; Supplementary Table S1). Throughout the course of the experiment, bridgmanite develops a deformation texture with (100) at high angles to compression (Figures 3C–F). At 39 GPa, just before gasket failure, texture development near 201 is the most pronounced (2.3 m.r.d.; Figure 3F; Supplementary Table S1). In contrast, ferropericlase does not develop a coherent texture during the duration of the experiment. Texture in ferropericlase remains weak (<1.4 m.r.d.) from 28–37 GPa (Figures 3B,C; Supplementary Table S1), is nearly random (1.3 m.r.d.) by 38 GPa (Figures 3D,E; Supplementary Table S1), and remains nearly random (1.2 m.r.d.) until the end of the experiment at 39 GPa (Figure 3F; Supplementary Table S1). This is different from single-phase experiments where ferropericlase develops significantly stronger textures at similar pressures (∼9.1 m.r.d. at 35 GPa; Merkel et al., 2002) and temperatures (>2.2 m.r.d. at 39 GPa and 1,150 K; Immoor et al., 2018). Ringwoodite shows weak and varied texture (<1.4 m.r.d.) from 28 up to 38 GPa (Figures 3B–E; Supplementary Table S1). At 39 GPa, a modest (011) texture (1.6 m.r.d.) develops in ringwoodite (Figure 3F; Supplementary Table S1) similar to that seen in single-phase experiments by Wenk et al. (2005).
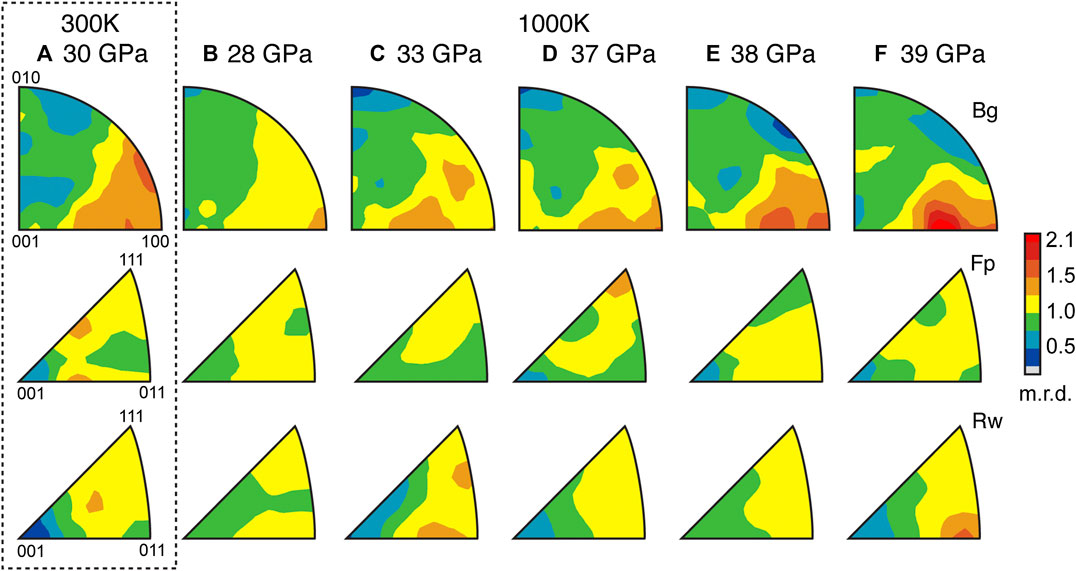
FIGURE 3. Inverse Pole figures (compression direction) of a bridgmanite (Bg), ferropericlase (Fp), and ringwoodite (Rw) aggregate compressed non-hydrostatically at a constant temperature of ∼1,000 K. The post-conversion texture is shown for reference in (A) at 30 GPa and 300 K and is separated from the resistive heating textures by a black, dashed, and rectangular contour. The onset of simultaneous heating and compression occurs at (B) ∼28 GPa, and the experiment ends at (F) ∼39.0 GPa. Pressures are calculated from the cell parameter of Pt (Table 1). Associated diffraction images are (A) 001, (B) 139, (C) 145, (D) 160, (E) 166, and (F) 172. The scale bar shows multiples of random distribution (m.r.d.).
Q(hkl) are a measure of the strains induced by axial stress along individual (hkl) diffracting plane normals and were chosen for analysis based on degree of overlap with, and intensity relative to, other peaks. Throughout the course of the experiment, the bridgmanite 200 diffraction peak shows the largest lattice strain (Figure 4A; Supplementary Table S1). Immediately post-conversion, all other Q(hkl) for bridgmanite are within error of one another. From ∼28 to ∼37 GPa, Q(200) > Q(204). From ∼28 to ∼36 GPa, Q(110) ≅ Q(221) and Q(111) is slightly larger (Figure 4B; Supplementary Table S1). At higher pressures (≥ 37 GPa), Q(110) ≅ Q(111) ≅ Q(221). At 38 GPa, the magnitude of Q(204) decreases and it becomes similar in magnitude to Q(111), Q(110), and Q(221). Ferropericlase shows Q(111) ≅ Q(220) > Q(200) post-conversion (Figure 4B; Supplementary Table S1). During pressure increase at high temperature, Q(111) > Q(220) > Q(200) until ∼36 GPa, where Q(111) ≅ Q(220) (Figure 4B; Supplementary Table S1). An anomalous value of Q(111) at ∼38 GPa is associated with a lower volume fraction of ferropericlase in the diffraction image (166; Table 1). In ringwoodite, the magnitude of Q(311) is less than Q(400) post-conversion, at ∼28 GPa, and ∼34 GPa. From 36 to 38 GPa, Q(311) is within error of Q(400). Q(311) is slightly greater than Q(400) at 39 GPa (Figure 4C; Supplementary Table S1).
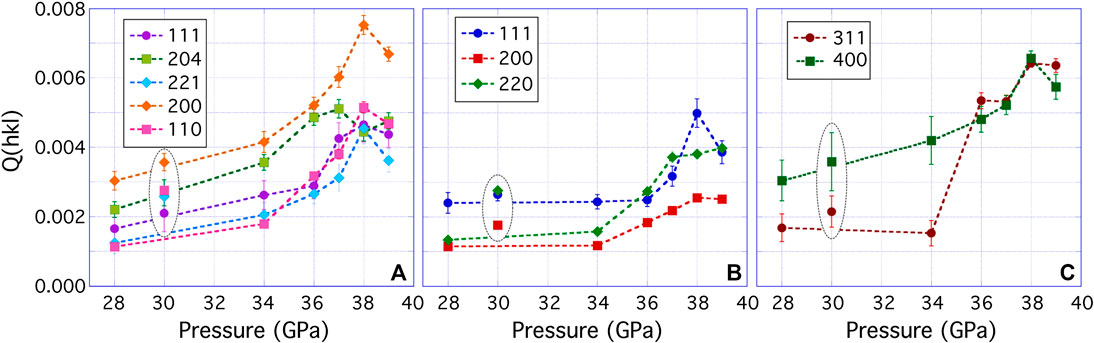
FIGURE 4. Variation with pressure of experimental Q(hkl) values of the individual phases (A) bridgmanite (B) ferropericlase, and (C) ringwoodite present in the aggregate compressed non-hydrostatically at ∼1,000 K. Additional values of Q(hkl) of the converted assemblage at 30 GPa and 300 K (image 001) are shown inside black, dashed elliptic contours for reference. Pressures are based on the unit cell parameter of Pt (Table 1). Experimental values for Q(hkl), based on lattice strain theory (Singh et al., 1998) were determined as part of the Rietveld refinement procedure performed with Materials Analysis Using Diffraction software. Bars showing standard deviations from the software are given on each data point and dashed lines are a guide for the eye.
Elasto-Viscoplastic Self-Consistent and Viscoplastic Self-Consistent Models of Bridgmanite
Over 100 EVPSC models were compared to the experimental textures and Q(hkl) for bridgmanite (Figures 3, 4). Ten different slip systems (Supplementary Table S2) were used to account for deformation. Eight of these slip systems were chosen because they are commonly cited in literature (Supplementary Text 1.2). Initial runs emphasized a single, dominant slip system (Supplementary Figure S2) by setting the critical resolved shear stress (CRSS) of the desired dominant slip system to 1.0 GPa and the auxiliary slip systems to 30 GPa to minimize their activity (i.e. <1 % active). While physically unrealistic (see Wenk and Christie, 1991 for a discussion), this minimizes the effect of non-dominant slip systems on texture and Q(hkl) values and isolates the effects of individual slip systems. Results then inform our choice of slip systems for runs with two or more dominantly active slip systems and lead to a first order approximation of a more physically realistic set of slip systems. To best compare plastic strain in models to experimental texture development, we model to a total plastic strain of 20% which is estimated to be achieved at similar pressures in a DAC (Merkel and Yagi, 2005).
EVPSC models match experimental textures (Figure 3) well for slip on (100)[010] (Supplementary Figure S2A) and (100)〈011〉 (Supplementary Figure S2C) and moderately well for slip on (100)[001] (Supplementary Figure S2B) and (110)〈−110〉 (Supplementary Figure S2H). Of these four, none have a Q(hkl) order which matches experimental data. To fit the magnitude and order of Q(hkl) and texture evolution, several runs testing combinations of slip systems were performed (Table 2; Figures 5, 6, Supplementary Figure S3).
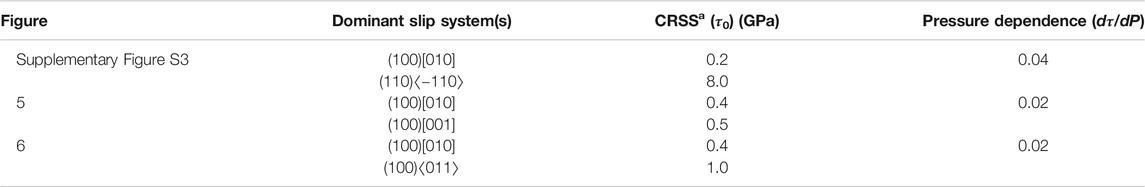
TABLE 2. Critical Resolved Shear Stresses (CRSS) for the three paired slip models of bridgmanite. Pressure dependence applies only to elasto-viscoplastic self-consistent models.
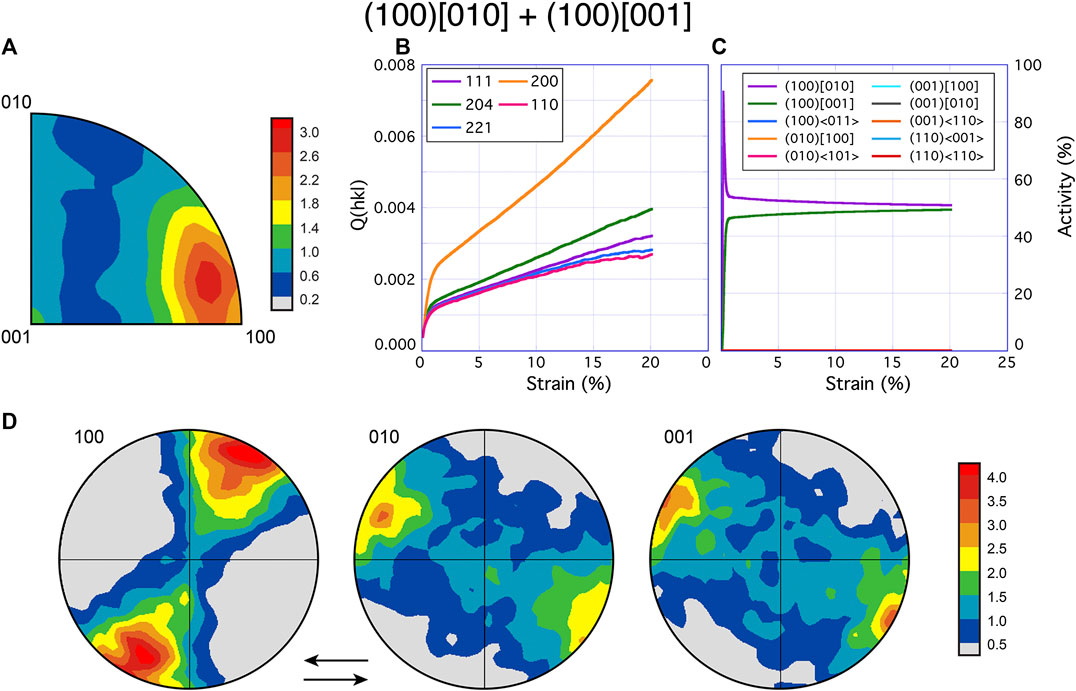
FIGURE 5. Model results of bridgmanite for the slip system pair (100)[010] and (100)[001]. The results of elasto-viscoplastic self-consistent (EVPSC) modeling show (A) texture with color scales of the inverse pole figure (compression direction) given in multiples of random distribution. Q(hkl) and slip system activity are shown in plot (B) and (C), respectively. Pole figures (D) from VPSC models were simulated with the same critical resolved shear stress values as the EVPSC model. Shear orientation is top to the left, shown by the arrows. The activity of all but (100)[010] and (100)[001] is <1% at all conditions.
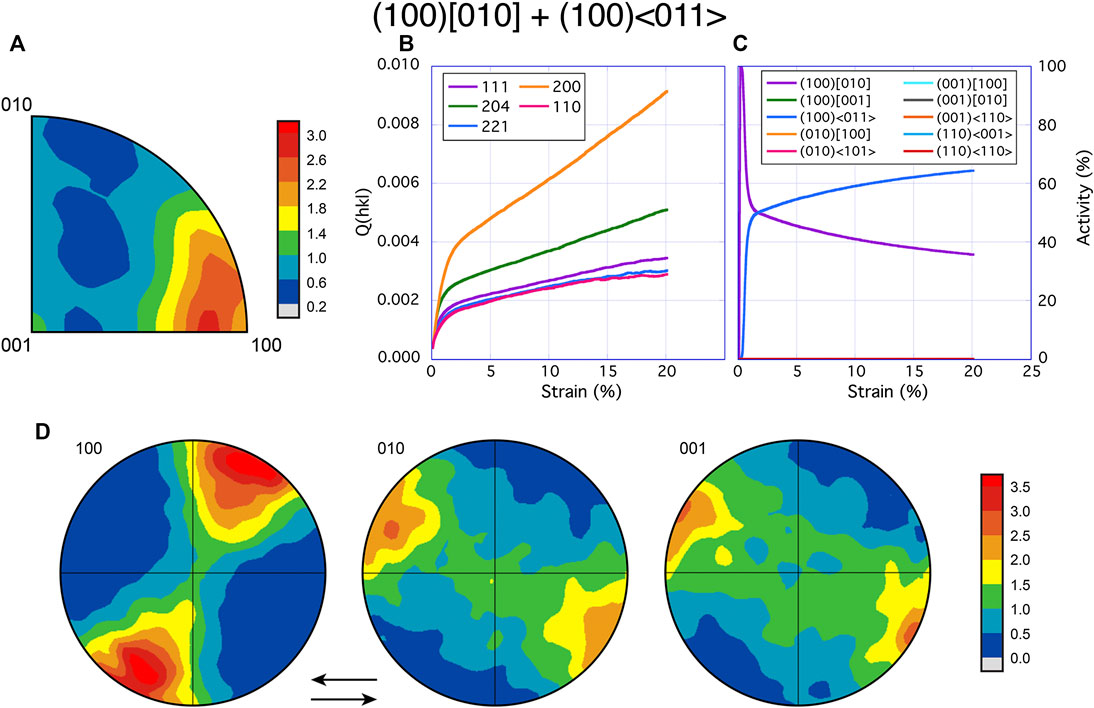
FIGURE 6. Model results for the slip systems pair (100)[010] and (100)〈011〉. The results of elasto-viscoplastic self-consistent (EVPSC) modeling are shown in (A–C). Panel (A) shows texture with color scales of the inverse pole figure (compression direction) giving multiples of random distribution. Q(hkl) and slip system activity are shown in plot (B) and (C), respectively. VPSC models were run with the same critical resolved shear stress values as the EVPSC model and pole figures are shown in (D). The sense of shear is top to the left. The activity of all but (100)[010] and (100)〈011〉 is <1% at all conditions.
Of the three paired slip system models that provide a satisfactory fit to textures, slip on (100)[010] + (110)〈−110〉 (Supplementary Figure S3) does not match experimental Q(hkl) order (Figure 4A) in that Q(200) and Q(204) are inverted. Slip system pairs (100)[010] + (100)[001] (Figure 5) and (100)[010] + (100)〈011〉 (Figure 6) have a Q(hkl) order most closely matching our experimental results. While neither model captures the rapid decrease in Q(204) at ∼38 GPa (image 166), rapidly increased slip activity on either (100)[001] or (100)〈011〉 will cause Q(204) to be surpassed by all other Q-factors without causing significant texture differences to experimental values (Figure 3) and thus does not require altering our interpretation of which slip systems are active. Adding a third slip system does not improve model fits to experimental results.
Comparing texture development to the results of Tsujino et al. (2016) provides additional constraints. Tsujino et al. deformed a sintered bridgmanite aggregate at 1,873 K and 25 GPa to 80% shear strain in a deformation-DIA (D-DIA where DIA refers to diamond as this press geometry was originally used for diamond synthesis) apparatus and, based on phenomenological considerations of recovered samples, concluded slip on (100)[001] dominates in bridgmanite (2016). We simulate simple shear texture development with the slip systems proposed by Tsujino et al. (2016) using VPSC (Lebensohn and Tomé, 1993), which does not model Q(hkl) and is computationally less intensive than EVPSC. Our modeled (010) pole figure (Supplementary Figure S4) lacks development of the maximum in the vertical direction (i.e., at the center) of the (010) pole figure presented by Tsujino et al. (2016). Part of this discrepancy may be that our VPSC simulations model only simple shear and would not capture any texture development caused by a significant component of pure shear. However, the reciprocal space coverage of the measurements by Tsujino et al. (2016) allows only for a direct detection of signal from planes oriented such that their poles plot on the periphery of the pole figure and thus there is no data coverage where the (010) maximum appears in their ReciPro analysis. This maximum is reconstructed and is notably absent in their analysis using MAUD, where the (010) pole figure exhibits more of a girdle in the shear plane (Tsujino et al., 2016). Therefore, our VPSC model provides a satisfactory match to their experimental results. However, EVPSC models of compression lattice strains caused by slip on (100)[001] (Supplementary Figure S2B) are inconsistent with our experiment (Figure 4A). Simulations with dominant (100)[010] + (100)[001] (Figure 5D) or dominant (100)[010] + (100)〈011〉 (Figure 6D) provide the best fit to both the data of Tsujino et al. (2016) and our data.
Discussion
Deformation of Bridgmanite in the Lower Mantle
At room temperature, deformation within the DAC occurs via dislocation glide. Even at the temperature of 1,000 K in this experiment it is likely that deformation is dominated by dislocation glide. However, in the lower mantle anisotropy is likely generated by deformation via dislocation creep. Given that our results and the results of Tsujino et al. (2016) show activation of slip on (100) at high temperatures as opposed to the low temperature slip plane of (001) (Miyagi and Wenk, 2016), we propose slip on (100) could be active during dislocation creep in the mantle. Although the results presented here are most directly applicable to uppermost lower mantle, adjacent to the transition zone, we cautiously apply our results to lowermost mantle anisotropy with the following assumptions: 1) 1,000 K is adequately representative of high temperature slip in bridgmanite up to 4,000 K and 2) increased pressure (up to ∼136 GPa at the D”) does not change the dominant slip systems.
Experimental results and first principles calculations on bridgmanite at high temperature suggest a large variety of slip systems with no strong consensus (e.g., Cordier et al., 2004; Miyajima et al., 2009; Kraych et al., 2016; Tsujino et al., 2016). Disagreements between deformation experiments (all performed at 25 ± 0.5 GPa) are more likely to be the result of different experimental design or differences in temperature (1,700 K, Cordier et al., 2004; 2,023 K, Miyajima et al., 2009 1,873 K, Tsujino et al., 2016). For example, the results of Cordier et al. (2004) may be due to very high deviatoric stress as suggested by Tsujino et al. (2016). Comparatively, Miyajima et al. (2009) observed curly dislocation lines and suggested that diffusion-assisted dislocation creep was therefore active at 2,023 K. The majority of their observed dislocations did not show alignment in a specific crystallographic direction, consistent with simultaneous activity of multiple slip systems (Miyajima et al., 2009). In perovskite CaTiO3 deformed at 1,973 K and 25–120 MPa, where deviatoric stress is low and dislocation creep is likely, clear screw dislocations with slip in the pseudocubic directions [001]pc and [011]pc (where the subscript pc means pseudocubic) on the (01−1)pc plane formed dislocation walls (Besson et al., 1996). In orthorhombic geometry this may correspond to slip on (100) or (010) planes in the
Bridgmanite compressed at room temperature shows a textural change at pressures >55 GPa (Miyagi and Wenk, 2016). While Miyagi and Wenk (2016) did not model Q(hkl) and thus do not provide specific slip directions, their high pressure (>55 GPa) texture is consistent with dominant slip on (100). It is therefore possible that in addition to high temperature, higher pressures may also favor slip on (100). Similar behavior in ferropericlase is supported by calculations (Amodeo et al., 2012) and experiments (Girard et al., 2012; Immoor et al., 2018) where the {100}〈011〉 slip is favored by both high temperature and pressure over the lower pressure and temperature {110}〈1−10〉 slip system.
First principles calculations on bridgmanite at 0 K indicate dislocation glide is most easily activated on (100)[010] from 0 to 30 GPa (Ferré et al., 2007; Mainprice et al., 2008). Combining first principles calculations with VPSC modeling, Mainprice et al. (2008) find that for simple shear deformation (100)[010] slip is dominant at all pressures between 0 and 100 GPa. While the relative CRSS of other slip systems are reduced with increasing pressure in first principles calculations, no single slip system surpasses (100)[010] over 0–100 GPa when both 0 K and high temperature calculations are considered (Ferré et al., 2007; Mainprice et al., 2008; Kraych et al., 2016). Given this and the above high temperature studies, we consider it plausible that slip on (100) is dominant at temperatures and pressures of the lowermost mantle.
Presence of Ringwoodite
Ringwoodite has been reported elsewhere to be present post-conversion from olivine to bridgmanite and ferropericlase when relatively low conversion temperatures are used (1,500 K; Martinez et al., 1997). As our laser heating method (Miyagi and Wenk, 2016) utilized low laser power and temperatures to prevent grain growth, it is not surprising that ringwoodite is present post-conversion. Further dissociation of ringwoodite during the course of resistive heating (4.5 h) is unlikely as the kinetics of ringwoodite dissociation are slow (Kubo et al., 2002) and ringwoodite may persist even at temperatures as high as 2,000 K (Katsura et al., 2003).
While the ringwoodite transition has recently been confirmed to be consistent with the 660 km discontinuity in the mantle (23.4 GPa; Ishii et al., 2018), both nucleation rates (Kubo et al., 2002) and the negative Clapeyron slope of the post-spinel transition (Ito and Takahashi, 1989; Ito et al., 1990) may depress the transition depth in a cold subducting slab (see Faccenda and Zilio, 2017 for a review). Earthquakes as deep as 730 km in the Tonga-Kermadec region (Niu and Kawakatsu, 1995) were suggested to be a result of a kinetically delayed post-spinel transition by Fukao and Obayashi (2013). For these reasons, the presence of ringwoodite in our aggregate is comparable to cold, down-welling slabs in the uppermost lower mantle where amounts of residual, unconverted ringwoodite may be preserved. As ringwoodite is elastically isotropic at pressures and temperatures of the uppermost mantle (Li et al., 2006), it should not alter shear wave splitting directions, though it may dampen anisotropic effects of bridgmanite and ferropericlase.
For extrapolation to the lowermost mantle, ringwoodite’s mechanical and elastic properties suggest that it can be used as an analog for the third most abundant phase in the lower mantle, Ca-silicate perovskite. Aggregate volumes of ringwoodite (Table 1) are well below the upper bound of experimentally predicted Ca-silicate perovskite in Mid-Ocean Ridge Basalt composition slabs (30% by weight; Ricolleau et al., 2010). Both phases have cubic or near cubic symmetry and have been reported to exhibit high flow strength (Kavner and Duffy, 2001; Miyagi et al., 2009). We therefore investigate the possibility of ringwoodite as a strength analog for Ca-Pv by comparing the shear strength (t) of both materials at 30 GPa and ambient temperature.
Miyagi et al. (2009) and Kavner and Duffy (2001) report t/G of 0.07 and 0.06 for Ca-silicate perovskite and ringwoodite, respectively. The average value of G, the shear modulus, of Ca‐silicate perovskite at 30 GPa and 300 K is 162 GPa ± 15 (Stixrude et al., 2007; Xu et al., 2008; Tsuchiya, 2011; Kudo et al., 2012). However, the most recent experimental studies (including those at high temperatures) indicate that G was previously overestimated for Ca-silicate perovskite and it could be as low as 152 ± 3 GPa at 300 K (Gréaux et al., 2019; Thomson et al., 2019). The shear modulus of Fe-bearing ringwoodite, when linearly extrapolated from Sinogeikin et al. (2003) and Higo et al. (2008), is found to be 157 ± 3 GPa. This corresponds to a shear strength of 11 GPa for ringwoodite and between 10 and 9 GPa (depending on the choice of available extant results) for Ca-silicate perovskite. Based on the uncertainties on both the values of t/G and G, we estimate that the uncertainty on shear strength is at least 1 GPa; in addition, we expect that the strength of cubic Ca-silicate perovskite (the stable polymorph at temperatures of the lower mantle) is larger than the tetragonal modification because it is stiffer and more rigid (Kawai and Tsuchiya, 2015; Gréaux et al., 2019; Thomson et al., 2019). Thus, ringwoodite serves as an approximation for the strength contrast between Ca-silicate perovskite and bridgmanite and ferropericlase for cold, subducting slabs in the lowermost mantle.
In addition to bridgmanite, ferropericlase and ringwoodite, stishovite is also present in our sample. While only a small fraction of the aggregate by volume (Table 1), stishovite is comparatively stiff (Hunt et al., 2019) to ringwoodite (Miyagi et al., 2009) and could thus also behave similarly to Ca-silicate perovskite.
Plastic Strain in Ferropericlase
Through the course of the experiment, ferropericlase develops a weak texture at the limit of our resolution (Supplementary Table S1; igures 3A–F). This is not surprising if we consider that a lack of texture development in ferropericlase has been previously observed in room-temperature multi-phase experiments on bridgmanite and ferropericlase aggregates (Miyagi and Wenk, 2016). Similarly, a two-phase study in the D-DIA with a hard orthorhombic phase, NaMgF3 (iso-structural with bridgmanite), and a soft cubic phase, NaCl (iso-structural with ferropericlase), found that NaCl did not develop significant texture over a range of phase proportions (Kaercher et al., 2016).
One potential reason for the lack of texture development in ferropericlase in our experiment may be insufficient plastic strain by dislocations in this phase at our experimental conditions. Single-phase experiments on ferropericlase at similar pressure and temperature conditions in a DAC result in clear and consistent deformation textures (>2.2 m.r.d.; Immoor et al., 2018) and previous studies on bridgmanite and ferropericlase suggests that the weaker ferropericlase accommodates large amounts of strain in a two phase aggregate (Girard et al., 2016; Thielmann et al., 2020). Since both bridgmanite and ringwoodite in our experiment show similar texture development to that of a single-phase case (Wenk et al., 2005; Tsujino et al., 2016), we expect that ferropericlase also deforms plastically.
The absence of coherent texture in the soft phase may also be a result of heterogeneous stress and strain caused by multi-phase interactions. If the lack of significant texture development in isostructural NaCl in a previous two-phase MgO-bridgmanite “analogue” deformation study (Kaercher et al., 2016) results from strain heterogeneity as suggested by Kaercher and coauthors, then disruption of texture development due to this phenomenon should be absent or reduced in cases where stress and strain is more homogeneous throughout the aggregate (for example, for more plastically isotropic cubic phases). Deformation of pseudo-cubic CaGeO3 perovskite and MgO in the D-DIA apparatus results in texture development in both phases (Wang et al., 2013). Similarly, two-phase deformation experiments on cubic MgO and a soft NaCl phase in a DAC over a range of phase proportions shows texturing in both phases, however a few phase proportions do show anomalous textures in NaCl (Lin et al., 2019). Thus, it appears that texturing in a two-phase aggregate likely depends on phase volume proportions, strength contrast, and on the symmetry and plastic anisotropy of the phases involved.
One way to investigate if a phase is deforming plastically is by analysis of lattice strains (e.g., Chen et al., 2006). Several studies have documented that the onset of plastic deformation by dislocations results in lattice strains that deviate from those predicted from elastic anisotropy and exceed Voigt-Reuss elastic bounds (e.g., Li et al., 2004; Chen et al., 2006; Merkel et al., 2006; Weidner and Li, 2006; Burnley and Zhang, 2008). To confirm the variance in Q(hkl) across diffraction planes is not the result of elastic anisotropy, we derive the weight parameter, α, by plotting 3Q(hkl) for peaks 222, 220, 200, and 311 (Supplementary Table S1) against [2GR(hkl)]−1 as described in detail in Chen et al. (2006). Due to the dependence of [2GR(hkl)]−1 on our choice of single crystal elastic constants, we derive α using three different literature sources for C11, C12, and C44 of ferropericlase (Karki et al., 1999; Wu et al., 2009; Fan et al., 2019) calculated at the pressures and temperature of our experiment (Table 1).
Values of α fall outside the elastic bounds when the elastic constants of Fan et al. (2019), Karki et al. (1999), and Wu et al. (2009) are used (Figure 7). The fact that ferropericlase lattice strains systematically exceed the elastic bounds strongly supports that ferropericlase is deforming plastically via dislocations even though we do not observe texture development. This evidence for deformation via dislocations without texture development in ferropericlase suggests complicated interactions between ferropericlase and the other phases, and it is likely that ferropericlase grains deform heterogeneously in response to this interaction.
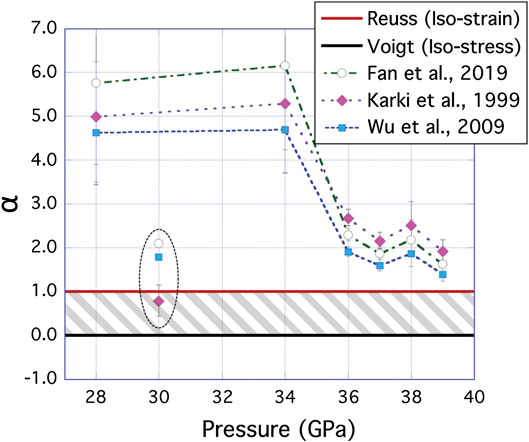
FIGURE 7. Results of fits for the Voigt-Reuss weight parameter, α, for ferropericlase as determined for three different sets of single crystal elastic constants (Karki et al., 1999; Wu et al., 2009; Fan et al., 2019). Voigt and Reuss bounds (0 ≤ α ≤ 1) are shown as a solid black and a solid red line, respectively, with the elastic regime indicated by gray hatching. Bars represent the range of uncertainty in α based on the standard deviations in Q(hkl) from the Rietveld fit. Values of alpha for the post-conversion pattern 001 (30 GPa, 300 K) are encircled by a black, dashed elliptic contour and shown for comparison with successive resistive heating data.
End-Member Effects of Strain Partitioning on Seismic Anisotropy
VPSC modeled textures for simple shear were combined with published single-crystal elastic constants (Supplementary Table S3) to estimate individual contributions to seismic anisotropy from bridgmanite and ferropericlase. The averaging was performed using a geometric mean in the Beartex software (Wenk et al., 1998). Evidence for plastic deformation despite experimental absence of strong and coherent texture development in ferropericlase indicates that the magnitude of resultant seismic anisotropy is heavily dependent on the degree of deformation heterogeneity in each constituent phase in addition to the total amount of deformation accommodated by dislocations within the aggregate. To capture possible effects of strain heterogeneity, we calculate both individual contributions of pure bridgmanite (Figures 8, 9) and pure ferropericlase (Figure 10), and also effects of texture variation caused by textured bridgmanite and non-textured ferropericlase as in our experiment (Figure 11), and a hypothetical inverse case with non-textured bridgmanite and textured ferropericlase (Figure 12). Since diffusion likely plays a significant role in accommodating deformation in the lower mantle, we assume that deformation by dislocations only accounts for a small amount of the total strain in the lower mantle. Here we present models for 50 and 100% strain by dislocations, which provide a qualitative match to the magnitude of anisotropies observed in the lower mantle.
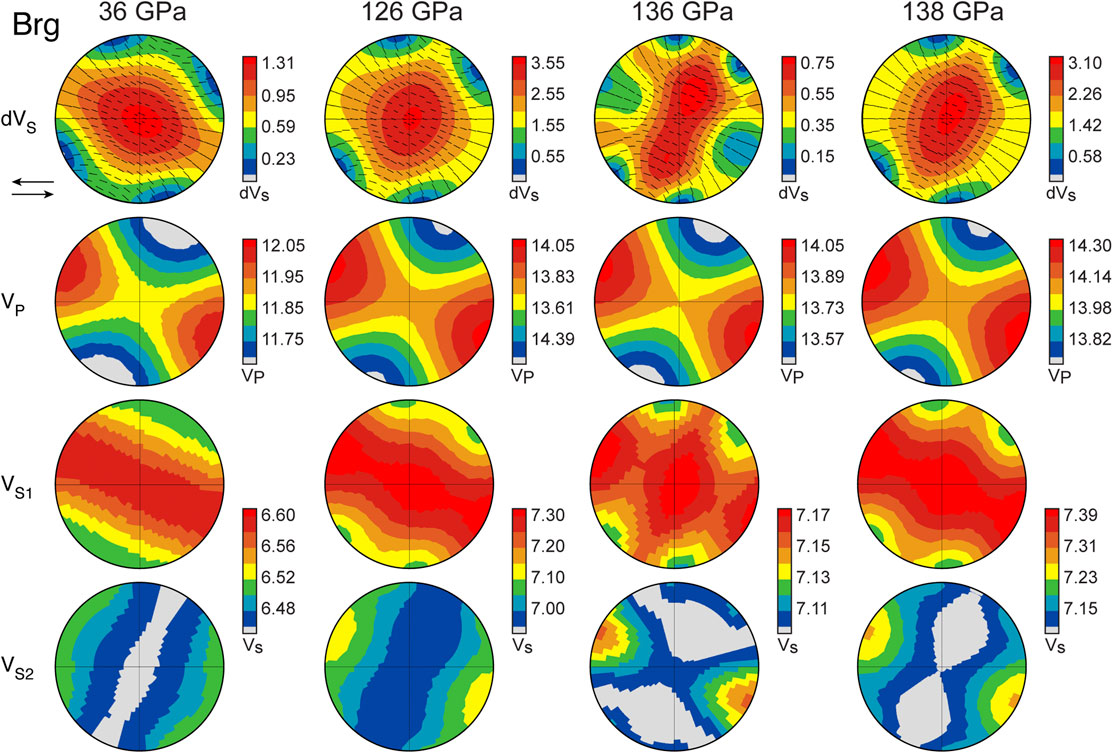
FIGURE 8. Stereo-plots (produced by Beartex software) of shear wave splitting (δVS in percent), P-wave velocity (VP in km/s), the fast shear wave (VS1 in km/s), and the slow shear wave (VS2 in km/s) for a bridgmanite aggregate at 100% strain. Visco-plastic self-consistent textures used to create the stereo-plots are from our results for the slip system pair (100)[010] + (100)[001] when extrapolated to pressure and temperature conditions of 36 GPa and 2,000 K, 126 GPa and 2,800 K, 136 GPa and 4,000 K, and 138 GPa and 3,500 K. Elastic constants used to create velocity surfaces are summarized in Supplementary Table S3. Sense of shear is top left, shown by the arrows. Eigenvectors of the fast S-wave polarization are shown as black dashes. Note that each hemispheric projection shows a different range of δVS.
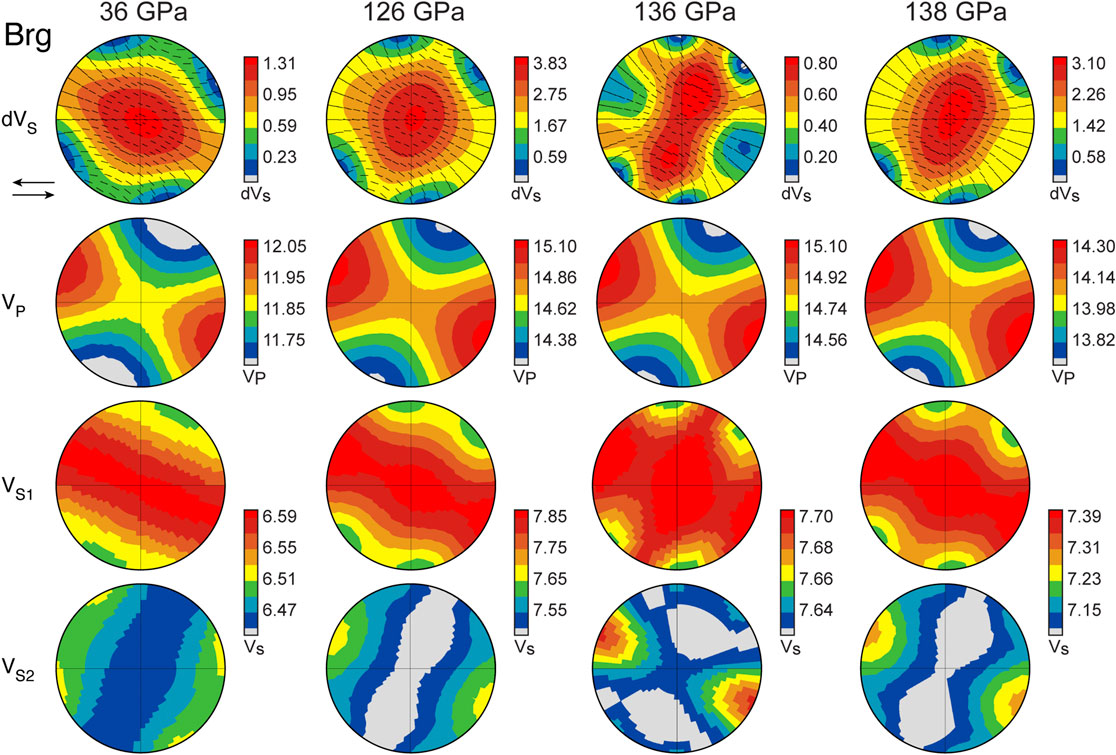
FIGURE 9. Stereo-plots (produced by Beartex software) of shear wave splitting (δVS in percent), P-wave velocity (VP in km/s), the fast shear wave (VS1 in km/s), and the slow shear wave (VS2 in km/s) for a bridgmanite aggregate at 100% strain. VPSC textures used to create the stereo-plots are from our results for the slip system pair (100)[010] + (100)〈011〉 when extrapolated to pressure and temperature conditions of 36 GPa and 2,000 K, 126 GPa and 2,800 K, 136 GPa and 4,000 K, and 138 GPa and 3,500 K. Elastic constants used to create velocity surfaces are summarized in Supplementary Table S3. Sense of shear is top left, shown by the arrows. Eigenvectors of the fast, polarized S-wave are shown as black dashes. Note that each hemispheric projection shows a different range of δVS.
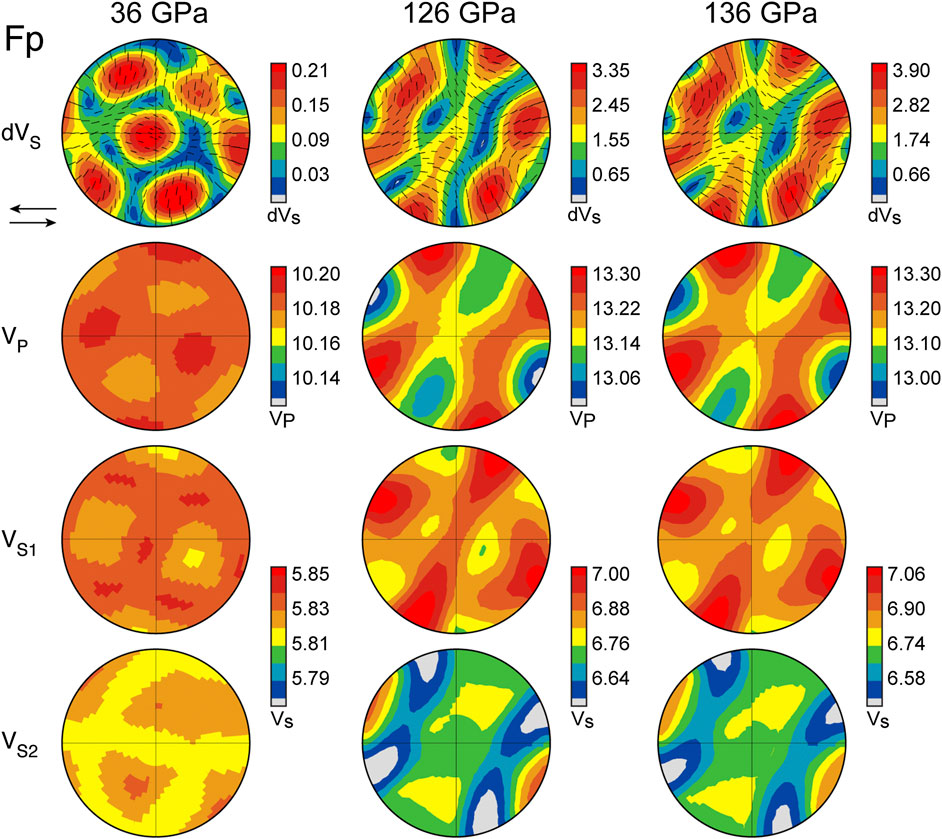
FIGURE 10. Stereo-plots (produced by Beartex software) of shear wave splitting (δVS in percent), P-wave velocity (VP in km/s), the fast shear wave (VS1 in km/s), and the slow shear wave (VS2 in km/s) for a ferropericlase aggregate at 100% strain. VPSC textures used to create the stereo-plots are from extrapolating the results of Immoor et al. (2018) to pressure and temperature conditions of 36 GPa and 2,000 K, 126 GPa and 3,000 K, and 136 GPa and 4,000 K. Elastic constants used to create velocity surfaces are summarized in Supplementary Table S3. Sense of shear is top left, shown by the arrows. Eigenvectors of the fast S-wave polarization are shown as black dashes. Note that each hemispheric projection shows a different range of δVS.
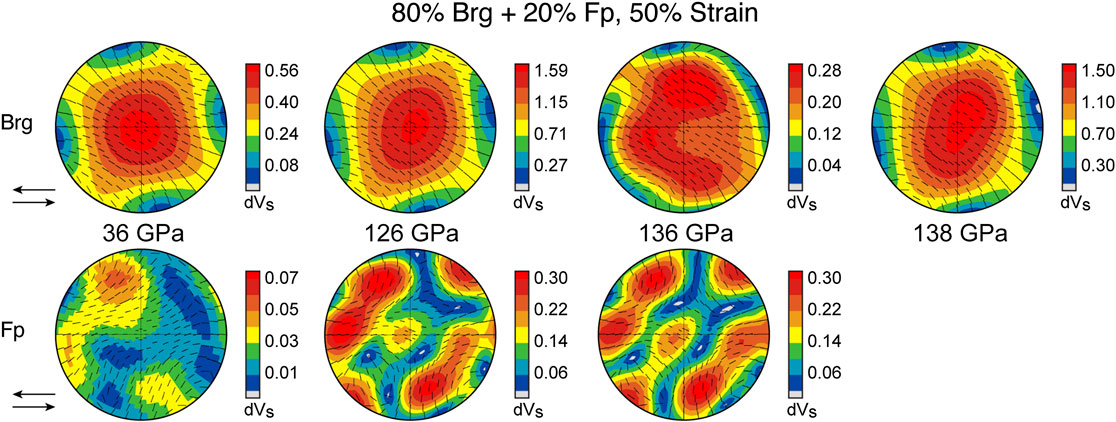
FIGURE 11. Percent shear wave splitting (δVS) for the case of 50% strain. The top row (Brg) shows random ferropericlase orientations and texture development in bridgmanite. The bottom row (Fp) shows random bridgmanite orientations and texture development in ferropericlase. Both rows assume a lower mantle composition of ∼80% bridgmanite and ∼20% ferropericlase. Sense of shear is top left, shown by the arrows. Eigenvectors of the fast S-wave polarization are shown as black dashes. Note that each hemispheric projection shows a different range of δVS.
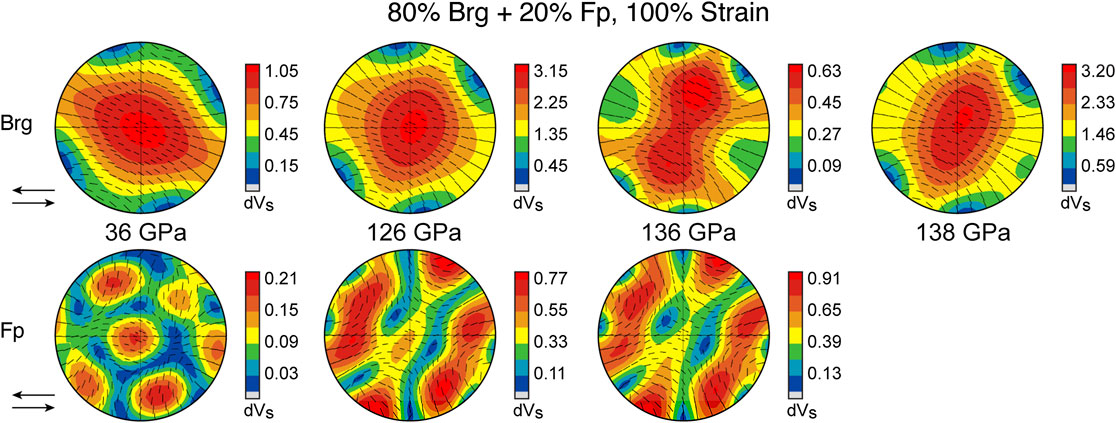
FIGURE 12. Percent shear wave splitting (δVS) for the case of 100% strain. The top row (Brg) shows random ferropericlase orientations and texture development in bridgmanite. The bottom row (Fp) shows random bridgmanite orientations and texture development in ferropericlase. Both rows assume a lower mantle composition of ∼80% bridgmanite and ∼20% ferropericlase. Sense of shear is top left, shown by the arrows. Eigenvectors of the fast S-wave polarization are shown as black dashes. Note that each hemispheric projection shows a different range of δVS.
For bridgmanite, we use VPSC textures both for slip on (100)[010] + (100)[001] (Figure 8) and (100)[010] + (100)〈011〉 (Figure 9) and the elastic tensors by Wentzcovitch et al. (2004) and Wookey et al. (2005). At these pressure and temperature conditions, there are no nominal differences in seismic anisotropy between the two models. The overall pattern of the seismic velocity plots for the two models are nearly identical and the slip system pair (100)[010] + (100)〈011〉 shows only slightly higher values for shear wave splitting (δVS = 100((VS1 − VS2)/VS)), p-wave velocity, and s-wave velocity. Values for seismic anisotropy are more strongly affected by the choice of elastic constants, and we provide an alternate calculation for bridgmanite bulk anisotropy using the single crystal elastic constants of Zhang et al. (2013) at 138 GPa, 3,500 K for comparison with 136 GPa, 4,000 K calculations (Supplementary Table S3; Figures 8, 9).
As ferropericlase in our experiment did not form strong texture, we instead model ferropericlase textures and calculate anisotropy at ∼ 36 GPa in VPSC using CRSS values from the results of Immoor et al. (2018) (Figure 10). To represent lowermost mantle conditions, pressure and temperature effects on slip system activity in Immoor et al. (2018) were used as a guideline for the activities at 126 and 136 GPa. As their results indicate {100}〈011〉 is more active than {110}〈1−10〉 at high pressures and temperatures (Immoor et al., 2018), we assume the majority of slip occurs along {100}〈011〉 in the lowermost mantle. To represent the pressure and temperature effects on slip systems between 126 and 136 GPa, we use a higher activity of {100}〈011〉 vs. {110}〈1−10〉 at 136 GPa (90:10) compared to 126 GPa (80:20). For all the models we used the elastic tensor determined by Wu et al. (2009). Note that for single crystal elastic constants at 126 GPa, variations in published temperature conditions resulted in the use of slightly different temperatures to calculate material properties of bridgmanite (2,800 K) and ferropericlase (3,000 K; Supplementary Table S3).
We show end-members of possible texture partitioning among these phases by calculating two cases of seismic anisotropy for an aggregate composed of 80% bridgmanite and 20% ferropericlase: 1) assuming texture development in bridgmanite and no texture development in ferropericlase such as in our experimental results (top row indicated by “Brg” in Figures 11, 12), and 2) the opposite bound, assuming no texture development in bridgmanite and texture development in ferropericlase (bottom row indicated by “Fp” in Figures 11, 12). We use the slip system pair (100)[010] + (100)〈011〉 (Figure 9) to calculate the end-member seismic anisotropy for textured bridgmanite and random ferropericlase as this model shows equal or slightly higher shear wave splitting than (100)[010] + (100)[001] (Figure 8). As a large proportion of strain in the lower mantle is likely accommodated by diffusion, we show results for 50% (Figure 11) and 100% (Figure 12) simple shear strain by dislocations. This represents the effects of strain on the relative magnitude of seismic anisotropy.
At 36 GPa, ferropericlase is seismically isotropic and bridgmanite shows maximum shear wave splitting (δVS) for a ray path along the shear plane and perpendicular to the path of flow, i.e., through the stereo-plot center. For 50% strain in a hypothetical mantle rock with textured bridgmanite and random ferropericlase, rays traveling parallel or sub-parallel to the plane of shear (i.e., left to right or horizontally across the stereoplot) would show a range of splitting of ∼0.0 to ∼0.2% δVS with the fast polarization (VS1) in the shear plane, i.e., particle motion is in and out of the page, (Figure 11). At higher strains (100%), the same aggregate results in δVS of ∼0.0 to ∼0.8% (Figure 12). At 126 GPa and 2,800 K/3,000 K, the δVS of a textured bridgmanite and random ferropericlase aggregate increases to ∼0.1–0.7% δVS (50% strain; Figure 11) and ∼0.9–1.8% δVS (100% strain; Figure 12) for ray paths in the direction of flow. Similar to 36 GPa, maximum shear wave splitting is into the page. For rays left to right through the stereoplot, VS1 is polarized in the shear plane. For rays crossing top-bottom through the stereoplot (i.e., normal to the shear plane), the VS1 polarization is at a high angle to the plane of the page. At pressures and temperatures of 136 GPa and 4,000 K, shear wave splitting caused by texturing in bridgmanite is nearly zero for 50% strain (Figure 11) and ranges between ∼0.2 and ∼0.5% for 100% strain (Figure 12) for ray paths in the horizontal plane. Averaging using the alternate single crystal elastic constants at 138 GPa and 3,500 K (Zhang et al., 2013), δVS values range instead from ∼0.1–0.7% for 50% strain and ∼1.0–1.9% for 100% strain.
In the hypothetical case where ferropericlase textures, but bridgmanite remains random, shear wave splitting is heavily dependent on ray path for both 126 and 136 GPa. A ray path passing horizontally through the stereo-plot still results in VS1 polarized in the horizontal direction, but a ray passing vertically results in VS1 ≈ VS2. Other ray paths result in complex and varied splitting. The maximum shear wave splitting caused by texturing in ferropericlase is ∼0.9% assuming shear strain of 100% (Figure 12). At shear strains of 50%, the maximum shear wave splitting is only ∼0.3% (Figure 11).
Implications for Seismic Anisotropy in the Lower Mantle
As ferropericlase is nearly isotropic in the uppermost lower mantle, bridgmanite is the strongest candidate for explaining widespread seismic anisotropy observed around subducting slabs (Long and Silver, 2009; Mohiuddin et al., 2015; Nowacki et al., 2015; Ferreira et al., 2019). Based on our experiments and modeling, slip in bridgmanite creates VSH fast parallel to flow (i.e., trench perpendicular). Our inferences from these experiments therefore support the conclusion given in Tsujino et al. (2016) that was based on the analysis of a mono-mineralic bridgmanite sample.
In the lowermost mantle, pPv is often proposed as the dominant contributor to anisotropy (e.g., Miyagi et al., 2010; Wu et al., 2017). However, seismic anisotropy has been observed more than 1,000 km above the CMB (de Wit and Trampert, 2015), where pPv is not stable. In addition, the positive Clapeyron slope of the bridgmanite to pPv phase transition and its dependency on Fe and Al (see both Grocholski et al., 2012; Hirose et al., 2017 for a review) calls into question the global presence of pPv above the entirety of the CMB. To explain seismic anisotropy in this region, a different phase, or phases, may be needed.
Near the D”, relative contributions of bridgmanite and ferropericlase will depend on the partitioning of strain and texture between the phases as well as strain variations and microstructure throughout the rock. Changes in microstructure affect strain partitioning between phases (Handy, 1994) and thus texture formation in a multiphase aggregate. Simple shear simulations of textured bridgmanite and random ferropericlase combined with elastic constants representing cold slab conditions (126 GPa, 2,800 K; region A in Figure 13) produce anisotropy similar to observations at the CMB. In the Caribbean (Kendall and Silver, 1996; Rokosky et al., 2006), Alaska (Matzel et al., 1996; Fouch et al., 2001), Antarctic Ocean (Usui et al., 2008), Indian Ocean (Ritsema, 2000), and Siberia (Thomas and Kendall, 2002), most measurements show VSH fast with δVS between 0 and 3%.
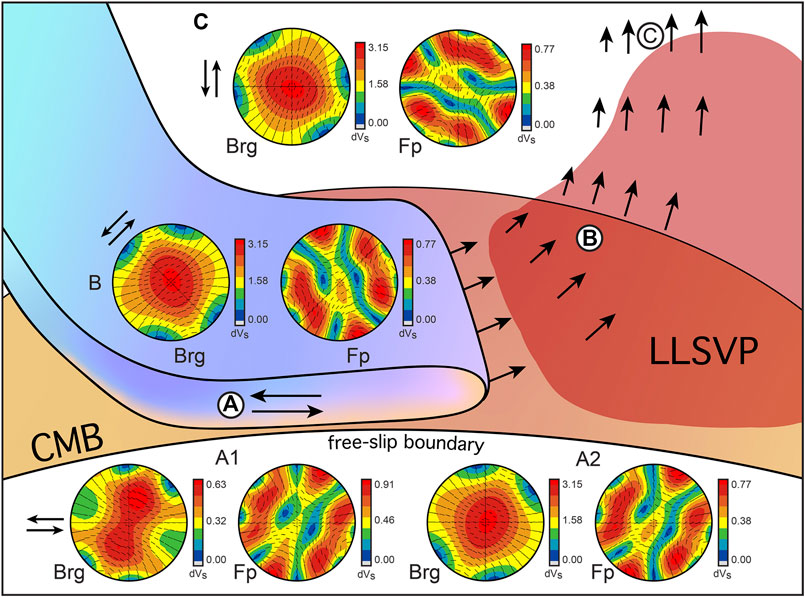
FIGURE 13. Schematic diagram of shear wave splitting associated with a subducting slab in the D” region. The slab is shown subducting along the core-mantle boundary (CMB). Large arrows show mantle flow around the edge of a large low-shear-velocity province (LLSVP). The schematic shows three possible locations of seismic anisotropy indicated by circled, capital letters: (A) deformation within the slab; (B) mantle flow at an angle to the CMB; (C) regions of upwelling. Uncircled letters refer to these regions and are adjacent to plots of percent shear wave splitting (δVS) made for a hypothetical mantle “rock” composed of 80% bridgmanite and 20% ferropericlase at 100% strain. Plots labeled Brg show a case where bridgmanite textures and ferropericlase is randomly oriented. Plots labeled Fp show a case where ferropericlase textures and bridgmanite is randomly oriented. Arrows adjacent to plots indicate the sense of shear. In order to represent possible P/T variation in a subducting slab, region (A) includes CMB conditions (A1, 136 GPa and 4000 K) and a possible pressure/temperature condition at the top of the D” (A2, 126 GPa and 2,800 K/3,000 K). A pressure and temperature condition of 126 GPa and 2,800 K/3,000 K was used for shear-wave splitting plots (B) and (C). The black lines in the stereo plots are the orientation of displacement for the fast shear velocity (VS1, see text).
At the CMB (136 GPa, 4,000 K), strains caused by dislocation accommodated deformation in bridgmanite would need to exceed 100% in order to explain shear wave splitting greater than 0.6% δVS. Seismic anisotropy in excess of this value may be due in part to deformation in ferropericlase since both bridgmanite and ferropericlase give VSH > VSV for ray paths parallel to flow (region A in Figure 13). Another consideration is that the calculated seismic anisotropy is underestimated due to our choice of single crystal elastic constants. At similar pressure and temperature conditions (∼138 GPa, 3,500K), the adiabatic single crystal elastic constants of Zhang et al. (2013) yield a maximum shear wave splitting of 3.2% in our aggregate with textured bridgmanite and random ferropericlase strained to 100% (Figure 12).
If shear flow is at an angle to the CMB, bridgmanite shows strong VSH > VSV for ray paths parallel to the CMB, while ferropericlase varies from VSV to VSH fast (region B in Figure 13). If ferropericlase textures, it may strengthen or dampen shear wave splitting depending on ray path. This may explain seismically complicated regions such as the eastern edge of the African large low shear velocity province (Cottaar and Romanowicz, 2013; Lynner and Long, 2014; Reiss et al., 2019) and the edges of the Caribbean (Nowacki et al., 2010). When shear flow is perpendicular to the CMB (region C in Figure 13) and ray paths are perpendicular to the flow direction and parallel to the CMB (region C in Figure 13), ferropericlase is relatively isotropic, and bridgmanite is the dominant contributor to shear wave splitting. Shear wave splitting varies from a horizontally to vertically polarized fast VS, but ray paths with the largest shear wave splitting have fast VS polarized vertically with respect to the CMB. This is consistent with VSV > VSH in the Central Pacific (Pulliam and Sen, 1998) where observations of seismic anisotropy are associated with upwelling (Ritsema et al., 1998; Kawai and Geller, 2010).
While higher degrees of strain accommodated by dislocations (100%) in a mantle rock composed of 80% bridgmanite and 20% ferropericlase are consistent with many observations in the D”, there are regions of VSH > VSV in the Central Pacific where δVS exceeds 3% (Fouch et al., 2001) and one study cites a δVS of 10% (Vinnik et al., 1998). Explaining such high shear wave splitting would require larger strains or almost certainly a phase with greater anisotropy, such as pPv.
Conclusions
Slip on paired systems (100)[010] + (100)〈011〉 and (100)[010] + (100)[001] in bridgmanite best match experimental data compared to other paired systems and models of a single, dominant slip system. Both of these paired slip systems show approximately half shared activity between pairs. We propose that at shallow lower mantle conditions, about half of dislocation glide activity in bridgmanite occurs along (100)[010] with the rest of the activity concentrated along either (100)[001], (100)〈011〉, or both. Since ringwoodite texture is weak and ferropericlase remains random, bridgmanite controls anisotropy in our multiphase aggregate.
Though ferropericlase remains random, its lattice strains fall outside of the elastic bounds during the experiment and are therefore not consistent with single-crystal elastic anisotropy of this phase. We conclude that plastic deformation by dislocations occurs even though no significant texture develops. This is likely due to heterogeneous strain caused by microstructural variations in the sample, indicating that microstructure in the very deep mantle plays an important role in controlling which phase is the main contributor to seismic anisotropy.
Shear wave splitting behavior of bridgmanite is consistent with observations of anisotropy around subducting slabs in the circumpacific regions. As ferropericlase is seismically isotropic at conditions of the uppermost lower mantle, ferropericlase will not alter the sign and maximum splitting direction of shear waves, though it may decrease the magnitude of observed shear wave splitting.
In most regions above the CMB, shear wave splitting caused by a “rock” composed of bridgmanite and ferropericlase will show VSH > VSV for ray paths parallel to the CMB, but in regions of upwelling, ray paths with the strongest shear wave splitting will show VSV > VSH. This is generally consistent with seismic observations in the lowermost mantle. Maximum shear wave splitting will occur perpendicular to the flow direction and in the shear plane. Regions of laterally varying anisotropy may be due to complicated interactions of shear wave splitting between bridgmanite and ferropericlase, variation in microstructure, or the presence of pPv. While pPv remains the best fit for regions of very high δVS, texture development in bridgmanite and ferropericlase can explain most cases of lower mantle anisotropy above the CMB.
Data Availability Statement
The datasets analyzed for this study can be found in the repository Zenodo: https://doi.org/10.5281/zenodo.4047107. The provided .esg files are compatible with the software package Materials Analysis Using Diffraction (MAUD; Lutterotti et al., 1997).
Author Contributions
LM, SS, HM, and HL conceived and designed the study and conducted data acquisition. SC performed the data analysis, ran plasticity models, and wrote the first draft. All authors contributed to the manuscript revision and read and approved the submitted version.
Funding
LM acknowledges support from the National Science Foundation through EAR-1654687. This work has been supported by the US Department of Energy, National Nuclear Security Administration, through the Capital-DOE Alliance Center (DE-NA0003858) which provided financial support for SC. HM acknowledges support from the German Science Foundation (grant MA4534/3-1) as well as the Bavarian Academy of Sciences.
Conflict of Interest
The authors declare that the research was conducted in the absence of any commercial or financial relationships that could be construed as a potential conflict of interest.
The handling editor declared a past co-authorship with one of the authors (SS).
Acknowledgments
We acknowledge DESY (Hamburg, Germany), a member of the Helmholtz Association HGF, for the provision of experimental facilities. Parts of this research were carried out at PETRA III and beamline P02.2.
Supplementary Material
The Supplementary Material for this article can be found online at: https://www.frontiersin.org/articles/10.3389/feart.2020.540449/full#supplementary-material
References
Akahama, Y., and Kawamura, H. (2004). High-pressure Raman spectroscopy of diamond anvils to 250 GPa: method for pressure determination in the multimegabar pressure range. J. Appl. Phys. 96 (7), 3748–3751. doi:10.1063/1.1778482
Akber-Knutson, S., Steinle-Neumann, G., and Asimow, P. D. (2005). Effect of Al on the sharpness of the MgSiO3 perovskite to post-perovskite transition. Geophys. Res. Lett. 32 (L14303), 1–4. doi:10.1029/2005gl023192
Amodeo, J., Carrez, P., and Cordier, P. (2012). Modelling the effect of pressure on the critical shear stress of MgO single crystals. Philos. Mag. 92 (12), 1523–1541. doi:10.1080/14786435.2011.652689
Andrault, D., Muñoz, M., Bolfan-Casanova, N., Guignot, N., Perrillat, J.-P., Aquilanti, G., et al. (2010). Experimental evidence for perovskite and post-perovskite coexistence throughout the whole D” region. Earth Planet. Sci. Lett. 293, 90–96. doi:10.1016/j.epsl.2010.02.026
Besson, P., Poirier, J. P., and Price, G. D. (1996). Dislocations in CaTiO3 perovskite deformed at high-temperature: a transmission electron microscopy study. Phys. Chem. Miner. 23 (6), 337–344. doi:10.1007/bf00199499
Burnley, P. C., and Zhang, D. (2008). Interpreting in situ x-ray diffraction data from high pressure deformation experiments using elastic-plastic self-consistent models: an example using quartz. J. Phys. Condens. Matter. 20, 285201. doi:10.1088/0953-8984/20/28/285201
Carrez, P., Ferré, D., and Cordier, P. (2007). Implications for plastic flow in the deep mantle from modelling dislocations in MgSiO3 minerals. Nature 446 (7131), 68–70. doi:10.1038/nature05593
Catalli, K., Shim, S.-H., and Prakapenka, V. (2009). Thickness and Clapeyron slope of the post-perovskite boundary. Nature 462, 782–785. doi:10.1038/nature08598
Chateigner, D., Lutterotti, L., and Morales, M. (2019). “EWIMV method” in the international tables for crystallography Editors C. J. Gilmore, J. A. Kaduk and H. Schenk, Chap. 5.3, Vol. H, 150.
Chen, J., Li, L., Yu, T., Long, H., Weidner, D., Wang, L., et al. (2006). Do Reuss and Voigt bounds really bound in high-pressure rheology experiments? J. Phys. Condens. Matter. 18 (25), S1049–S1059. doi:10.1088/0953-8984/18/25/s11
Cordier, P., Ungár, T., Zsoldos, L., and Tichy, G. (2004). Disclocation creep in MgSiO3 perovskite at conditions of the Earth’s uppermost lower mantle. Nature 428, 837–840. doi:10.1038/nature02472
Cottaar, S., and Romanowicz, B. (2013). Observations of changing anisotropy across the southern margin of the African LLSVP. Geophys. J. Int. 195 (2), 1184–1195. doi:10.1093/gji/ggt285
Creasy, N., Miyagi, L., and Long, M. (2020). A library of elastic tensors for lowermost mantle seismic anisotropy studies and comparison with seismic observations. Geochem. Geophys. Geosyst. 21 (4), e2019GC008883. doi:10.1029/2019GC008883
Dawson, P. R., and Wenk, H.-R. (2000). Texturing of the upper mantle during convection. Philos. Mag. A 80 (3), 573–598. doi:10.1080/01418610008212069
de Wit, R. W. L., and Trampert, J. (2015). Robust constraints on average radial lower mantle anisotropy and consequences for composition and texture. Earth Planet. Sci. Lett. 429, 101–109. doi:10.1016/j.epsl.2015.07.057
Faccenda, M., and Dal Zilio, L. (2017). The role of solid-solid phase transitions in mantle convection. Lithos 268–271, 198–224. doi:10.1016/j.lithos.2016.11.007
Fan, D., Fu, S., Yang, J., Tkachev, S. N., Prakapenka, V. B., and Lin, J.-F. (2019). Elasticity of single-crystal periclase at high pressure and temperature: the effect of iron on the elasticity and seismic parameters of ferropericlase in the lower mantle. Am. Mineral. 104 (2), 262–275. doi:10.2138/am-2019-6656
Fei, Y., Ricolleau, A., Frank, M., Mibe, K., Shen, G., and Prakapenka, V. (2007). Toward an internally consistent pressure scale. Proc. Natl. Acad. Sci. U. S. A. 104 (22), 9182–9186. doi:10.1073/pnas.0609013104
Ferré, D., Carrez, P., and Cordier, P. (2007). First principles determination of dislocations properties of MgSiO3 perovskite at 30 GPa based on the Peierls-Nabarro model. Phys. Earth Planet. Inter. 163 (1–4), 283–291. doi:10.1016/j.pepi.2007.05.011
Ferreira, A. M. G., Faccenda, M., Sturgeon, W., Chang, S.-J., and Schardong, L. (2019). Ubiquitous lower-mantle anisotropy beneath subduction zones. Nat. Geosci. 12, 301–306. doi:10.1038/s41561-019-0325-7
Fouch, M. J., Fischer, K. M., and Wysession, M. E. (2001). Lowermost mantle anisotropy beneath the Pacific: imaging the source of the Hawaiian plume. Earth Planet. Sci. Lett. 190, 167–180. doi:10.1016/s0012-821x(01)00380-6
Fournelle, J. (2011). An investigation of “San Carlos Olivine”: comparing USNM-distributed material with commercially available material. Microsc. Microanal. 17 (S2), 842–843. doi:10.1017/s1431927611005083
Fukao, Y., and Obayashi, M. (2013). Subducted slabs stagnant above, penetrating through, and trapped below the 660 km discontinuity. J. Geophys. Res. Solid Earth. 118 (11), 5920–5938. doi:10.1002/2013jb010466
Girard, J., Amulele, G., Farla, R., Mohiuddin, A., and Karato, S.-i. (2016). Shear deformation of bridgmanite and magnesiowustite aggregates at lower mantle conditions. Science 351 (6269), 144–147. doi:10.1126/science.aad3113
Girard, J., Chen, J., and Raterron, P. (2012). Deformation of periclase single crystals at high pressure and temperature: quantification of the effect of pressure on slip-system activities. J. Appl. Phys. 111 (11), 112605–112607. doi:10.1063/1.4726200
Gréaux, S., Irifune, T., Higo, Y., Tange, Y., Arimoto, T., Liu, Z., et al. (2019). Sound velocity of CaSiO3 perovskite suggests the presence of basaltic crust in Earth’s lower mantle. Nature 565, 218–221. doi:10.1038/s41586-018-0816-5
Grocholski, B., Catalli, K., Shim, S.-H., and Prakapenka, V. (2012). Mineralogical effects on the detectability of the postperovskite boundary. Proc. Natl. Acad. Sci. U. S. A. 109 (7), 2275–2279. doi:10.1073/pnas.1109204109
Hammersley, A. P., Svensson, S. O., Hanfland, M., Fitch, A. N., and Hausermann, D. (1996). Two-dimensional detector software: from real detector to idealised image of two-theta scan. High Pres. Res. 14 (4–6), 235–248. doi:10.1080/08957959608201408
Handy, M. R. (1994). Flow laws for rocks containing two non-linear viscous phases: a phenomenological approach. J. Struct. Geol. 16 (3), 287–301. doi:10.1016/0191-8141(94)90035-3
Hernlund, J. W., and Labrosse, S. (2007). Geophysically consistent values of the perovskite to post-perovskite transition Clapeyron slope. Geophys. Res. Lett. 34 (L05309), 1–4. doi:10.1029/2006gl028961
Hernlund, J. W., Thomas, C., and Tackley, P. J. (2005). A doubling of the post-perovskite phase boundary and structure of the Earth’s lowermost mantle. Nature 434 (7035), 882–886. doi:10.1038/nature03472
Higo, Y., Inoue, T., Irifune, T., Funakoshi, K.-i., and Li, B. (2008). Elastic wave velocities of (Mg0.91Fe0.09)2SiO4 ringwoodite under P–T conditions of the mantle transition region. Phys. Earth Planet. Inter. 166 (3–4), 167–174. doi:10.1016/j.pepi.2008.01.003
Hirose, K., Sinmyo, R., and Hernlund, J. (2017). Perovskite in Earth’s deep interior. Science 358, 734–738. doi:10.1126/science.aam8561
Hunt, S. A., Whitaker, M. L., Bailey, E., Mariani, E., Stan, C. V., and Dobson, D. P. (2019). An experimental investigation of the relative strength of the silica polymorphs quartz, coesite, and stishovite. Geochem. Geophys. Geosyst. 20, 1975–1989. doi:10.1029/2018gc007842
Immoor, J., Marquardt, H., Miyagi, L., Lin, F., Speziale, S., Merkel, S., et al. (2018). Evidence for {100}〈011〉 slip in ferropericlase in Earth’s lower mantle from high-pressure/high-temperature experiments. Earth Planet. Sci. Lett. 489, 251–257. doi:10.1016/j.epsl.2018.02.045
Immoor, J., Marquardt, H., Miyagi, L., Speziale, S., Merkel, S., Schwark, I., et al. (2020). An improved setup for radial diffraction experiments at high pressures and high temperatures in a resistive graphite-heated diamond anvil cell. Rev. Sci. Instrum. 91 (4), 45121. doi:10.1063/1.5143293
Ishii, T., Huang, R., Fei, H., Koemets, I., Liu, Z., Maeda, F., et al. (2018). Complete agreement of the post-spinel transition with the 660-km seismic discontinuity. Sci. Rep. 8 (1), 1–6. doi:10.1038/s41598-018-24832-y
Ito, E., Akaogi, M., Topor, L., and Navrotsky, A. (1990). Negative pressure-temperature slopes for reactions forming MgSiO3 perovskite from calorimetry. Science 249 (4974), 1275–1278. doi:10.1126/science.249.4974.1275
Ito, E., and Takahashi, E. (1989). Postspinel transformations in the system Mg2SiO4-Fe2SiO4 and some geophysical implications. J. Geophys. Res. 94 (B8), 10637–10646. doi:10.1029/jb094ib08p10637
Kaercher, P., Miyagi, L., Kanitpanyacharoen, W., Zepeda-Alarcon, E., Wang, Y., Parkinson, D., et al. (2016). Two-phase deformation of lower mantle mineral analogs. Earth Planet. Sci. Lett. 456, 134–145. doi:10.1016/j.epsl.2016.09.030
Karato, S.-I., and Li, P. (1992). Diffusion creep in perovskite: implications for the rheology of the lower mantle. Science 255 (5049), 1238–1240. doi:10.1126/science.255.5049.1238
Karki, B., Wentzcovitch, R. M., de Gironcoli, S., and Baroni, S. (1999). First-principles determination of elastic anisotropy and wave velocities of MgO at lower mantle conditions. Science 286 (5445), 1705–1707. doi:10.1126/science.286.5445.1705
Karki, B. B., Wentzcovitch, R. M., de Gironcoli, S., and Baroni, S. (2001). First principles thermoelasticity of MgSiO3‐perovskite: consequences for the inferred properties of the lower mantle. Geophys. Res. Lett. 28 (14), 2699–2702. doi:10.1029/2001gl012910
Katsura, T., Yamada, H., Shinmei, T., Kubo, A., Ono, S., Kanzaki, M., et al. (2003). Post-spinel transition in Mg2SiO4 determined by high P–T in situ X-ray diffractometry. Phys. Earth Planet. Inter. 136 (1–2), 11–24. doi:10.1016/s0031-9201(03)00019-0
Kavner, A., and Duffy, T. S. (2001). Strength and elasticity of ringwoodite at upper mantle pressures. Geophys. Res. Lett. 28 (14), 2691–2694. doi:10.1029/2000gl012671
Kawai, K., and Geller, R. J. (2010). The vertical flow in the lowermost mantle beneath the Pacific from inversion of seismic waveforms for anisotropic structure. Earth Planet. Sci. Lett. 297 (1–2), 190–198. doi:10.1016/j.epsl.2010.05.037
Kawai, K., and Tsuchiya, T. (2015). Small shear modulus of cubic CaSiO3 perovskite. Geophys. Res. Lett. 42 (8), 2718–2726. doi:10.1002/2015gl063446
Kendall, J. M., and Silver, P. G. (1996). Constraints from seismic anisotropy on the nature of the lowermost mantle. Nature 381, 409–412. doi:10.1038/381409a0
Kraych, A., Carrez, P., and Cordier, P. (2016). On dislocation glide in MgSiO3 bridgmanite at high-pressure and high-temperature. Earth Planet. Sci. Lett. 452, 60–68. doi:10.1016/j.epsl.2016.07.035
Kubo, T., Ohtani, E., Kato, T., Urakawa, S., Suzuki, A., Kanbe, Y., et al. (2002). Mechanism and kinetics of the post-spinel transformation in Mg2SiO4. Phys. Earth Planet. Inter. 129 (1–2), 153–171. doi:10.1016/s0031-9201(01)00270-9
Kudo, Y., Hirose, K., Murakami, M., Asahara, Y., Ozawa, H., Ohishi, Y., et al. (2012). Sound velocity measurements of CaSiO3 perovskite to 133 GPa and implications for lowermost mantle seismic anomalies. Earth Planet. Sci. Lett. 349–350, 1–7. doi:10.1016/j.epsl.2012.06.040
Kurnosov, A., Marquardt, H., Frost, D. J., Boffa Ballaran, T., and Ziberna, L. (2017). Evidence for a Fe3+-rich pyrolitic lower mantle from (Al,Fe)-bearing bridgmanite elasticity data. Nature 543 (7646), 543–546. doi:10.1038/nature21390
Lebensohn, R. A., and Tomé, C. N. (1993). A self-consistent anisotropic approach for the simulation of plastic deformation and texture development of polycrystals: application to zirconium alloys. Acta Mater. 41 (9), 2611–2624. doi:10.1016/0956-7151(93)90130-k
Li, L., Weidner, D. J., Brodholt, J., Alfè, D., and Price, G. D. (2006). Elasticity of Mg2SiO4 ringwoodite at mantle conditions. Phys. Earth Planet. Inter. 157 (3–4), 181–187. doi:10.1016/j.pepi.2006.04.002
Li, L., Weidner, D. J., Chen, J., Vaughan, M. T., Davis, M., and Durham, W. B. (2004). X-ray strain analysis at high pressure: effect of plastic deformation in MgO. J. Appl. Phys. 95 (12), 8357–8365. doi:10.1063/1.1738532
Liermann, H. P., Merkel, S., Miyagi, L., Wenk, H.-R., Shen, G., Cynn, H., et al. (2009). Experimental method for in situ determination of material textures at simultaneous high pressure and high temperature by means of radial diffraction in the diamond anvil cell. Rev. Sci. Instrum. 80, 104501. doi:10.1063/1.3236365
Lin, F., Giannetta, M., Jugle, M., Couper, S., Dunleavy, B., and Miyagi, L. (2019). Texture development and stress-strain partitioning in periclase + halite aggregates. Minerals 9 (11), 679. doi:10.3390/min9110679
Lin, F., Hilairet, N., Raterron, P., Addad, A., Immoor, J., Marquardt, H., et al. (2017). Elasto-viscoplastic self consistent modeling of the ambient temperature plastic behavior of periclase deformed up to 5.4 GPa. J. Appl. Phys. 122, 205902. doi:10.1063/1.4999951
Long, M. D., and Silver, P. G. (2009). Shear wave splitting and mantle anisotropy: measurements, interpretations, and new directions. Surv. Geophys. 30 (4–5), 407–461. doi:10.1007/s10712-009-9075-1
Lutterotti, L., Matthies, S., Wenk, H.-R., Schultz, A. S., and Richardson, J. W. (1997). Combined texture and structure analysis of deformed limestone from time-of-flight neutron diffraction spectra. J. Appl. Phys. 81 (2), 594–600. doi:10.1063/1.364220
Lutterotti, L., Vasin, R., and Wenk, H.-R. (2014). Rietveld texture analysis from synchrotron diffraction images. I. Calibration and basic analysis. Powder Diffr. 29 (1), 76–84. doi:10.1017/s0885715613001346
Lynner, C., and Long, M. D. (2014). Lowermost mantle anisotropy and deformation along the boundary of the African LLSVP. Geophys. Res. Lett. 41 (10), 3447–3454. doi:10.1002/2014gl059875
Lynner, C., and Long, M. D. (2015). Heterogeneous seismic anisotropy in the transition zone and uppermost lower mantle: evidence from South America, Izu-Bonin and Japan. Geophys. J. Int. 201 (3), 1545–1552. doi:10.1093/gji/ggv099
Mainprice, D., Tommasi, A., Ferré, D., Carrez, P., and Cordier, P. (2008). Predicted glide systems and crystal preferred orientations of polycrystalline silicate Mg-perovskite at high pressure: implications for the seismic anisotropy in the lower mantle. Earth Planet. Sci. Lett. 271 (1–4), 135–144. doi:10.1016/j.epsl.2008.03.058
Marquardt, H., Speziale, S., Reichmann, H. J., Frost, D. J., Schilling, F. R., and Garnero, E. J. (2009). Elastic shear anisotropy of ferropericlase in Earth’s lower mantle. Science 324 (5924), 224–226. doi:10.1126/science.1169365
Martinez, I., Wang, Y., Guyot, F., Liebermann, R. C., and Doukhan, J. C. (1997). Microstructures and iron partitioning in (Mg,Fe)SiO3 perovskite-(Mg,Fe)O magnesiowüstite assemblages: an analytical transmission electron microscopy study. J. Geophys. Res. 102 (B3), 5265–5280. doi:10.1029/96jb03188
Matzel, E., Sen, M. K., and Grand, S. P. (1996). Evidence for anisotropy in the deep mantle beneath Alaska. Geophys. Res. Lett. 23 (18), 2417–2420. doi:10.1029/96gl02186
McNamara, A. K., van Keken, P. E., and Karato, S. -I. (2002). Development of anisotropic structure in the Earth’s lower mantle by solid-state convection. Nature 416 (6878), 310–314. doi:10.1038/416310a
Merkel, S. (2008). Fit2d2maud. Available at: http://merkel.texture.rocks/Fit2d2maud/index.php?lang=en (Accessed June 18, 2019). doi:10.18356/218a80d4-en
Merkel, S., Liermann, H.-P., Miyagi, L., and Wenk, H.-R. (2013). In situ radial X-ray diffraction study of texture and stress during phase transformations in bcc-, fcc-, and hcp-iron up to 36 GPa and 100 K. Acta Mater. 61 (14), 5144–5151. doi:10.1016/j.actamat.2013.04.068
Merkel, S., Miyajima, N., Antonangeli, D., Fiquet, G., and Yagi, T. (2006). Lattice preferred orientation and stress in polycrystalline hcp-Co plastically deformed under high pressure. J. Appl. Phys. 100, (023510). doi:10.1063/1.2214224
Merkel, S., Wenk, H.-R., Shu, J., Shen, G., Gillet, P., Mao, H.-K., et al. (2002). Deformation of polycrystalline MgO at pressures of the lower mantle. J. Geophys. Res. 107 (B11), ECV 3-1–ECV 3-17. doi:10.1029/2001jb000920
Merkel, S., and Yagi, T. (2005). X-ray transparent gasket for diamond anvil cell high pressure experiments. Rev. Sci. Instrum. 76, 046109. doi:10.1063/1.1884195
Miyagi, L., Kanitpanyacharoen, W., Kaercher, P., Lee, K. K. M., and Wenk, H. -R. (2010). Slip systems in MgSiO3 post-perovskite: implications for D” anisotropy. Science 329 (5999), 1639–1641. doi:10.1126/science.1192465
Miyagi, L., Kanitpanyacharoen, W., Raju, S. V., Kaercher, P., Knight, J., MacDowell, A., et al. (2013). Combined resitive and laser heating technique for in situ radial X-ray diffraction in the diamond anvil cell at high pressure and temperature. Rev. Sci. Instrum. 84, 025118. doi:10.1063/1.4793398
Miyagi, L., Merkel, S., Yagi, T., Sata, N., Ohishi, Y., and Wenk, H. -R. (2009). Diamond anvil cell deformation of CaSiO3 perovskite up to 49 GPa. Phys. Earth Planet. Inter. 174 (1–4), 159–164. doi:10.1016/j.pepi.2008.05.018
Miyagi, L., and Wenk, H.-R. (2016). Texture development and slip systems in bridgmanite and bridgmanite + ferropericlase aggregates. Phys. Chem. Miner. 43 (8), 597–613. doi:10.1007/s00269-016-0820-y
Miyajima, N., Yagi, T., and Ichihara, M. (2009). Dislocation microstructures of MgSiO3 perovskite at a high pressure and temperature condition. Phys. Earth Planet. Inter. 174 (1–4), 153–158. doi:10.1016/j.pepi.2008.04.004
Mohiuddin, A., Long, M. D., and Lynner, C. (2015). Mid-mantle seismic anisotropy beneath southwestern Pacific subduction systems and implications for mid-mantle deformation. Phys. Earth Planet. Inter. 245, 1–14. doi:10.1016/j.pepi.2015.05.003
Nishihara, Y., Takahashi, E., Matsukage, K. N., Iguchi, T., Nakayama, K., and Funakoshi, K. (2004). Thermal equation of state of (Mg0.91Fe0.09)2SiO4 ringwoodite. Phys. Earth Planet. Inter. 143–144, 33–46. doi:10.1016/j.pepi.2003.02.001
Niu, F., and Kawakatsu, H. (1995). Direct evidence for the undulation of the 660‐km discontinuity beneath Tonga: comparison of Japan and California array data. Geophys. Res. Lett. 22 (5), 531–534. doi:10.1029/94gl03332
Nowacki, A., Kendall, J. M., Wookey, J., and Pemberton, A. (2015). Mid-mantle anisotropy in subduction zones and deep water transport. Geochem. Geophys. Geosyst. 16 (3), 764–784. doi:10.1002/2014gc005667
Nowacki, A., Wookey, J., and Kendall, J. M. (2010). Deformation of the lowermost mantle from seismic anisotropy. Nature 467 (7319), 1091–1094. doi:10.1038/nature09507
Pulliam, J., and Sen, M. K. (1998). Seismic anisotropy in the core-mantle transition zone. Geophys. J. Int. 135 (1), 113–128. doi:10.1046/j.1365-246x.1998.00612.x
Reiss, M. C., Long, M. D., and Creasy, N. (2019). Lowermost mantle anisotropy beneath africa from differential SKS‐SKKS shear‐wave splitting. J. Geophys. Res. Solid Earth. 124, 8540–8564. doi:10.1029/2018jb017160
Ribe, N. M. (1989). Seismic anisotropy and mantle flow. J. Geophys. Res. 94 (B4), 4213–4223. doi:10.1029/jb094ib04p04213
Ricolleau, A., Perrillat, J. P., Fiquet, G., Daniel, I., Matas, J., Addad, A., et al. (2010). Phase relations and equation of state of a natural MORB: implications for the density profile of subducted oceanic crust in the Earth’s lower mantle. J. Geophys. Res. Solid Earth. 115, B08202. doi:10.1029/2009jb006709
Ritsema, J. (2000). Evidence for shear velocity anisotropy in the lowermost mantle beneath the Indian Ocean. Geophys. Res. Lett. 27 (7), 1041–1044. doi:10.1029/1999gl011037
Ritsema, J., Lay, T., Garnero, E., and Benz, H. (1998). Seismic anisotropy in the lowermost mantle beneath the Pacific. Geophys. Res. Lett. 25 (8), 1229–1232. doi:10.1029/98gl00913
Rokosky, J. M., Lay, T., and Garnero, E. J. (2006). Small-scale lateral variations in azimuthally anisotropic D” structure beneath the Cocos Plate, Earth Planet. Sci. Lett. 248, 411–425. doi:10.1016/j.epsl.2006.06.005
Romanowicz, B., and Wenk, H.-R. (2017). Anisotropy in the deep earth. Phys. Earth Planet. Inter. 269, 58–90. doi:10.1016/j.pepi.2017.05.005
Singh, A. K., Balasingh, C., Mao, H. K., Hemley, R. J., and Shu, J. (1998). Analysis of lattice strains measured under nonhydrostatic pressure. J. Appl. Phys. 83 (12), 7567–7575. doi:10.1063/1.367872
Sinogeikin, S. V., Bass, J. D., and Katsura, T. (2003). Single-crystal elasticity of ringwoodite to high pressures and high temperatures: implications for 520 km seismic discontinuity. Phys. Earth Planet. Inter. 136 (1–2), 41–66. doi:10.1016/s0031-9201(03)00022-0
Spera, F. J., Yuen, D. A., and Giles, G. (2006). Tradeoffs in chemical and thermal variations in the post-perovskite phase transition: mixed phase regions in the deep lower mantle? Phys. Earth Planet. Inter. 159, 234–246. doi:10.1016/j.pepi.2006.07.007
Stixrude, L., Lithgow-Bertelloni, C., Kiefer, B., and Fumagalli, P. (2007). Phase stability and shear softening in CaSiO3 perovskite at high pressure. Phys. Rev. B Condens. Matter. 75 (2), 024108. doi:10.1103/physrevb.75.024108
Tateno, S., Hirose, K., Sata, N., and Ohishi, Y. (2007). Solubility of FeO in (Mg,Fe)SiO3 perovskite and the post-perovskite phase transition. Phys. Earth Planet. Inter. 160, 319–325. doi:10.1016/j.pepi.2006.11.010
Thielmann, M., Golabek, G. J., and Marquardt, H. (2020). Ferropericlase control of lower mantle rheology: impact of phase morphology. Geochem. Geophys. Geosyst. 21 (2), 1–19. doi:10.1029/2019gc008688
Thomas, C., and Kendall, J. -M. (2002). The lowermost mantle beneath northern Asia-II. Evidence for lower-mantle anisotropy. Geophys. J. Int. 151 (1), 296–308. doi:10.1046/j.1365-246x.2002.01760.x
Thomson, A. R., Crichton, W. A., Brodholt, J. P., Wood, I. G., Siersch, N. C., Muir, J. M. R., et al. (2019). Seismic velocities of CaSiO3 perovskite can explain LLSVPs in Earth’s lower mantle. Nature 572, 643–647. doi:10.1038/s41586-019-1483-x
Tsuchiya, T. (2011). Elasticity of subducted basaltic crust at the lower mantle pressures: insights on the nature of deep mantle heterogeneity. Phys. Earth Planet. Inter. 188 (3–4), 142–149. doi:10.1016/j.pepi.2011.06.018
Tsujino, N., Nishihara, Y., Yamazaki, D., Seto, Y., Higo, Y., and Takahashi, E. (2016). Mantle dynamics inferred from the crystallographic preferred orientation of bridgmanite. Nature 539 (7627), 81–84. doi:10.1038/nature19777
Turner, P. A., and Tomé, C. N. (1994). A study of residual stresses in Zircaloy-2 with rod texture. Acta Mater. 42 (12), 4143–4153. doi:10.1016/0956-7151(94)90191-0
Usui, Y., Hiramatsu, Y., Furumoto, M., and Kanao, M. (2008). Evidence of seismic anisotropy and a lower temperature condition in the D” layer beneath Pacific Antarctic Ridge in the Antarctic Ocean. Phys. Earth Planet. Inter. 167 (3–4), 205–216. doi:10.1016/j.pepi.2008.04.006
Vinnik, L., Breger, L., and Romanowicz, B. (1998). Anisotropic structures at the base of the Earth’s mantle. Nature 393 (June), 564–567. doi:10.1038/31208
Vinnik, L. P., Oreshin, S. I., Speziale, S., and Weber, M. (2010). Mid-mantle layering from SKS receiver functions. Geophys. Res. Lett. 37 (L24302), 1–5. doi:10.1029/2010gl045323
Wang, H., Wu, P. D., Tomé, C. N., and Huang, Y. (2010). A finite strain elastic-viscoplastic self-consistent model for polycrystalline materials. J. Mech. Phys. Solid. 58 (4), 594–612. doi:10.1016/j.jmps.2010.01.004
Wang, X., Tsuchiya, T., and Hase, A. (2015). Computational support for a pyrolitic lower mantle containing ferric iron. Nat. Geosci. 8 (7), 556–559. doi:10.1038/ngeo2458
Wang, Y., Hilairet, N., Nishiyama, N., Yahata, N., Tsuchiya, T., Morard, G., et al. (2013). High-pressure, high-temperature deformation of CaGeO3 (perovskite)±MgO aggregates: implications for multiphase rheology of the lower mantle. Geochem. Geophys. Geosyst. 14 (9), 3389–3408. doi:10.1002/ggge.20200
Weidner, D. J., and Li, L. (2006). Measurement of stress using synchrotron x-rays. J. Phys. Condens. Matter. 18 (25), S1061–S1067. doi:10.1088/0953-8984/18/25/s12
Wenk, H.-R., and Christie, J. M. (1991). Comments on the interpretation of deformation textures in rocks. J. Struct. Geol. 13 (10), 1091–1110. doi:10.1016/0191-8141(91)90071-p
Wenk, H.-R., Ischia, G., Nishiyama, N., Wang, Y., and Uchida, T. (2005). Texture development and deformation mechanisms in ringwoodite. Phys. Earth Planet. Inter. 152 (3), 191–199. doi:10.1016/j.pepi.2005.06.008
Wenk, H.-R., Lonardelli, I., Merkel, S., Miyagi, L., Pehl, J., Speziale, S., et al. (2006b). Deformation textures produced in diamond anvil experiments, analysed in radial diffraction geometry. J. Phys. Condens. Matter. 18 (25), S933–S947. doi:10.1088/0953-8984/18/25/s02
Wenk, H.-R., Lutterotti, L., Kaercher, P., Kanitpanyacharoen, W., Miyagi, L., and Vasin, R. (2014). Rietveld texture analysis from synchrotron diffraction images. II. Complex multiphase materials and diamond anvil cell experiments. Powder Diffr. 29 (3), 220–232. doi:10.1017/s0885715614000360
Wenk, H.-R., Matthies, S., Donovan, J., and Chateigner, D. (1998). BEARTEX: a windows-based program system for quantitative texture analysis. J. Appl. Crystallogr. 31 (2), 262–269. doi:10.1107/s002188989700811x
Wenk, H.-R., Speziale, S., McNamara, A. K., and Garnero, E. J. (2006a). Modeling lower mantle anisotropy development in a subducting slab. Earth Planet. Sci. Lett. 245 (1–2), 302–314. doi:10.1016/j.epsl.2006.02.028
Wentzcovitch, R. M., Karki, B. B., Cococcioni, M., and de Gironcoli, S. (2004). Thermoelastic properties of MgSiO3-perovskite: insights on the nature of the earth’s lower mantle. Phys. Rev. Lett. 92 (1), 4. doi:10.1103/physrevlett.92.018501
Wentzcovitch, R. M., Karki, B. B., Karato, S., and Da Silva, C. R. S. (1998). High pressure elastic anisotropy of MgSiO3 perovskite and geophysical implications. Earth Planet. Sci. Lett. 164 (1–2), 371–378. doi:10.1016/s0012-821x(98)00230-1
Wentzcovitch, R. M., Tsuchiya, T., and Tsuchiya, J. (2006). MgSiO3 postperovskite at D” conditions. Proc. Natl. Acad. Sci. U. S. A. 103 (3), 543–546. doi:10.1073/pnas.0506879103
Wolf, A., Jackson, J. M., Dera, P., and Prakapenka, V. (2015). The thermal equation of state of (Mg, Fe)SiO3 bridgmanite (perovskite) and implications for lower mantle structures. J. Geophys. Res. Solid Earth. 120, 7450–7489. doi:10.1002/2015jb012108
Wookey, J., Stackhouse, S., Kendall, J.-M., Brodholt, J., and Price, D. (2005). Efficacy of the post-perovskite phase as an explanation for lowermost-mantle seismic properties. Nature 438, 1004–1007. doi:10.1038/nature04345
Wu, X., Lin, J.-F., Kaercher, P., Mao, Z., Liu, J., Wenk, H. -R., et al. (2017). Seismic Anisotropy of the D” layer induced by (001) deformation of post-perovskite. Nat. Commun. 8 (14669), 1–6. doi:10.1038/ncomms14669
Wu, Z., Justo, J. F., Da Silva, C. R. S., De Gironcoli, S., and Wentzcovitch, R. M. (2009). Anomalous thermodynamic properties in ferropericlase throughout its spin crossover transition. Phys. Rev. B Condens. Matter. 80 (1), 1–8. doi:10.1103/physrevb.80.014409
Xu, W., Lithgow-Bertelloni, C., Stixrude, L., and Ritsema, J. (2008). The effect of bulk composition and temperature on mantle seismic structure. Earth Planet. Sci. Lett. 275 (1–2), 70–79. doi:10.1016/j.epsl.2008.08.012
Keywords: bridgmanite, ferropericlase, multiphase, lower mantle, strain heterogeneity, radial diffraction, resistively heated, seismic anisotropy
Citation: Couper S, Speziale S, Marquardt H, Liermann H-P and Miyagi L (2020) Does Heterogeneous Strain Act as a Control on Seismic Anisotropy in Earth’s Lower Mantle?. Front. Earth Sci. 8:540449. doi:10.3389/feart.2020.540449
Received: 04 March 2020; Accepted: 04 September 2020;
Published: 14 October 2020.
Edited by:
Mainak Mookherjee, Florida State University, United StatesReviewed by:
Yu Nishihara, Ehime University, JapanSimon A Hunt, University College London, United Kingdom
Copyright © 2020 Couper, Speziale, Marquardt, Liermann and Miyagi. This is an open-access article distributed under the terms of the Creative Commons Attribution License (CC BY). The use, distribution or reproduction in other forums is permitted, provided the original author(s) and the copyright owner(s) are credited and that the original publication in this journal is cited, in accordance with accepted academic practice. No use, distribution or reproduction is permitted which does not comply with these terms.
*Correspondence: Samantha Couper, u0883460@gcloud.utah.edu