Large-Scale High-Resolution Coastal Mangrove Forests Mapping Across West Africa With Machine Learning Ensemble and Satellite Big Data
 Xue Liu1,2*
  Temilola E. Fatoyinbo3
  Nathan M. Thomas3,4
  Weihe Wendy Guan1
  Yanni Zhan2 Pinki Mondal2,5,6
  David Lagomasino7 Marc Simard8 Carl C. Trettin9 Rinki Deo1 Abigail Barenblitt3,4
- 1Center for Geographic Analysis (CGA), Harvard University, Cambridge, MA, United States
- 2Center for International Earth Science Information Network (CIESIN), Columbia University, Palisades, NY, United States
- 3Biospheric Sciences Laboratory, NASA/GSFC, Greenbelt, MD, United States
- 4Earth System Science Interdisciplinary Center, University of Maryland, College Park, MD, United States
- 5Department of Geography and Spatial Sciences, University of Delaware, Newark, DE, United States
- 6Department of Plant and Soil Sciences, University of Delaware, Newark, DE, United States
- 7Department of Coastal Studies, East Carolina University, Wanchese, NC, United States
- 8Jet Propulsion Laboratory, California Institute of Technology, Pasadena, CA, United States
- 9Center for Forested Wetlands Research, Southern Research Station, US Forest Service, Cordesville, SC, United States
Coastal mangrove forests provide important ecosystem goods and services, including carbon sequestration, biodiversity conservation, and hazard mitigation. However, they are being destroyed at an alarming rate by human activities. To characterize mangrove forest changes, evaluate their impacts, and support relevant protection and restoration decision making, accurate and up-to-date mangrove extent mapping at large spatial scales is essential. Available large-scale mangrove extent data products use a single machine learning method commonly with 30 m Landsat imagery, and significant inconsistencies remain among these data products. With huge amounts of satellite data involved and the heterogeneity of land surface characteristics across large geographic areas, finding the most suitable method for large-scale high-resolution mangrove mapping is a challenge. The objective of this study is to evaluate the performance of a machine learning ensemble for mangrove forest mapping at 20 m spatial resolution across West Africa using Sentinel-2 (optical) and Sentinel-1 (radar) imagery. The machine learning ensemble integrates three commonly used machine learning methods in land cover and land use mapping, including Random Forest (RF), Gradient Boosting Machine (GBM), and Neural Network (NN). The cloud-based big geospatial data processing platform Google Earth Engine (GEE) was used for pre-processing Sentinel-2 and Sentinel-1 data. Extensive validation has demonstrated that the machine learning ensemble can generate mangrove extent maps at high accuracies for all study regions in West Africa (92%–99% Producer’s Accuracy, 98%–100% User’s Accuracy, 95%–99% Overall Accuracy). This is the first-time that mangrove extent has been mapped at a 20 m spatial resolution across West Africa. The machine learning ensemble has the potential to be applied to other regions of the world and is therefore capable of producing high-resolution mangrove extent maps at global scales periodically.
Introduction
Land cover classification using remotely sensed data is capable of generating information that can play an important role in forest resource inventory, agricultural monitoring, and environmental change (Zhan et al., 2002; Atzberger, 2013; White et al., 2016). In recent years, the increased availability of computing power through openly available cloud platforms (e.g., Google Earth Engine) and readily accessible machine learning algorithms from open source software tools (e.g., Python Scikit-learn) have enabled the processing of large volumes of satellite imagery over increasingly large geographical areas with reduced complexity (Gorelick et al., 2017; Hird et al., 2017). Despite this, the use of complex machine learning algorithms in land cover remote sensing remains in its infancy and choosing the most suitable method for large-scale land cover mapping remains a challenge (Mondal et al., 2019; Zhang et al., 2020). This problem is exacerbated in the tropics where cloud cover inhibits optical imagery, particularly in regions such as West Africa where persistent clouds can render large volumes of data unsuitable for land cover mapping. While machine learning methods have been demonstrated to perform well in land cover mapping (Yuan et al., 2009; Walsh, 2015; Godinho et al., 2016; Ming et al., 2016), they have not been fully assessed for mapping large-scale high-resolution coastal mangrove forest extent.
Mangrove forests are critically important ecosystems, covering approximately 138,000 km2 of coastal area spanning 118 countries (Giri et al., 2011; Siikamaki et al., 2012; Bunting et al., 2018). They are distributed in the intertidal areas between the sea and the land and predominantly occur between 30°N and 30°S latitudes (Giri et al., 2011). Mangrove forests constitute a significant proportion of the total tropical forest carbon stock although they only represent between 3–5% of the total forest area (Donato et al., 2011; Murray et al., 2011; Fatoyinbo and Simard, 2013; Simard et al., 2019) with recent studies suggesting that mangrove forests store three to four times more carbon per equivalent area than other types of tropical forests, and can sequester two to four times more carbon compared to mature tropical forests (Murdiyarso et al., 2015). In addition, mangrove forests can protect lives and properties from ocean-originated natural disasters, such as storm surges and sea level rise (Danielsen et al., 2005; Kathiresan and Rajendran, 2005), and benefit many coastal communities in tropical regions with important ecosystem goods and services including food, fuel, and construction materials (Bandaranayake, 1998; Giri, 2016). Within the West Africa region, mangroves cover an area of approximately 17,000 km2, and range from relatively small lagoons and estuaries in Cote D’Ivoire, to vast deltas in Nigeria. They have often been heavily impacted by human activities such as urban expansion and oil exploration in recent decades.
Multispectral and SAR satellite data have been effectively used in mapping and monitoring coastal mangrove forests at the global scale (Giri et al., 2011; Lucas et al., 2014; Bunting et al., 2018; Thomas et al., 2018), however, significant inconsistencies remain among these mangrove extent data products, particularly in cloudy regions of West Africa. The spatial resolution of the input satellite data determines the minimum size of mangrove forest patches that satellite imagery can detect, however, almost all existing mangrove extent data products currently available are produced at 30 m resolution, predominantly derived from Landsat imagery. As mangrove forests can occur in small continuous extents across continental scales and are often limited to small stands, they are readily confused in Landsat-based imagery with other adjacent flooded wetland ecosystems. Using satellite data with a finer spatial resolution has the potential to identify smaller patches of forests, thus generating more detailed mangrove extent maps, capable of monitoring areas that have been previously omitted. These small mangrove patches still provide substantial ecosystem services for low-lying vulnerable communities (Curnick et al., 2019). The recently available multispectral data from Sentinel-2 and C-band Synthetic Aperture Radar (SAR) data from Sentinel-1 provide 10–20 m land observations, enabling smaller mangrove stands to be distinguished and increase our understanding of the distribution of mangrove extent (Kaplan and Avdan, 2018). This is particularly pertinent in West Africa where a heterogeneous landscape, driven by both natural environmental gradients and anthropogenic activity, can contain measurably more mangroves in small patches that are poorly resolved in 30 m resolution imagery.
A suite of machine learning classifiers are available for image analysis such as Naive Bayes, Support Vector Machine (SVM), Classification and Regression Trees (CART), Random Forest (RF), Gradient Boosting Machine (GBM), Neural Network (NN), and others. They have become increasingly popular within the field of remote sensing in recent years due to their applicability across large datasets and their ability to generate more accurate and consistent results (Yuan et al., 2009; Ali et al., 2016; Godinho et al., 2016; Kussui et al., 2016; Ming et al., 2016; Rogers et al., 2017; Shelestov et al., 2017; Xiong et al., 2017; Bunting et al., 2018; Gauci et al., 2018; Karakizi et al., 2018; Maxwell et al., 2018; Liu et al., 2019). Machine learning algorithms such as maximum-likelihood are well established within the field, but an increasing number of non-parametric classifiers have emerged, providing decision trees, plane fitting, clustering and deep-learning algorithms such as neural networks. In mangrove forest mapping, RF, CART, SVM, multi-layer perception, convolution neural network, adaptive boosting (AdaBoost), the rotation forest (RoF), and K-Means all are commonly used at small scales with satisfactory results (Wang et al. 2008; Zhao et al., 2014; Jhonnerie et al., 2015; Mondal et al., 2018, 2019; Wan et al., 2018; Pham et al., 2019; Toosi et al., 2019), but advanced machine learning methods have not been trialed at regional to continental scales.
Among all the machine learning methods, RF, GBM, and NN are relatively mature and are commonly used in land cover mapping applications, but all have limitations in practice (Maxwell et al., 2018). Ensembles of machine learning methods can combine the base models in order to produce one optimal predictive model, capable of yielding improved results over a single model (Zhu, 2012; Walsh, 2015; Liu et al., 2019). The objective of this study is to evaluate the performance of an ensemble of the commonly used machine learning methods, namely, Random Forest (RF), Gradient Boosting Machine (GBM), and Neural Network (NN) for mapping mangrove extent at 20 m resolution at a continental scale (West Africa) using a combination of Sentinel-2 and Sentinel-1 satellite data. Through this we aim to significantly improve mangrove extent mapping accuracy and develop a method that is scalable to the global level.
Methods
Machine Learning Algorithms
Random Forest (RF)
RF is a machine learning method using the results from many different models to calculate a response (Gislason et al., 2004; Pal, 2005; Horning, 2010; Na et al., 2010; Tian et al., 2016). It constructs a large number of decision trees during the training phase then returns a class based on the greatest number of occurrences, making it robust against overfitting (Breiman, 2001; Shelestov et al., 2017). The training for RF follows the general rules of bootstrap aggregating or bagging. That is, given a training set with corresponding responses, it repeatedly selects a random sample with replacement of the training set and fits trees to the samples. The only difference of RF from the general bagging is that it uses a modified tree learning algorithm that selects a random subset of the features at each candidate split in the learning process. After training, predictions can be made by taking the majority vote of the classification trees. Our RF was implemented using the “randomForest” package included in R software.
RF is advantageous as its non-parametric nature is suited to remote sensing data and it is simple to train and tune. However, the split rules determined for classification are unknown and the classification accuracy can be poor when applied to large-scale land cover and land use mapping based on Landsat data (Shelestov et al., 2017; Pham et al., 2019).
Gradient Boosting Machine (GBM)
GBM, like RF, is also a learning method that predicts by combining the outputs from individual trees. But GBM differs from RF in the way the trees are built, that is, the order and the way the results are combined. It is a forward stage-wise additive model and implements gradient descent in the function space. During the iteration procedure, the steepest descent direction is controlled by the negative gradient of the loss function while line search is often used for determining the step length (Natekin and Knoll, 2013). GBM can outperform RF and SVM for land cover and land use mapping based on Landsat data in larger sample sizes (Walsh, 2015; Godinho et al., 2016; Colin et al., 2017; Georganos et al., 2018), but the overall accuracy can remain low (Abdi, 2019) which may be caused by the GBM’s inherent overfitting problem. Our GBM was implemented using the “GBM” package included in R.
Neural Network (NN)
NN is generally organized as a series of connected layers including an input layer, hidden layers, and output layer with each layer composed of a different numbers of nodes. Nodes are the basic units of NN, and each gets a certain number of inputs and bias values. The multiple input values arriving at a node are multiplied by the weights per the node connections, and the output of the node is the weighted total of all its input values with the weights adjusted during the training procedure (Reed and Marks 1999):
Where O is the output of a node, I and W are the input values and connection weights, and B is the bias. NN learns to perform specific tasks by understanding examples, generally without a need to use task-specific rules. It outperforms other machine learning methods in land cover and land use mapping but still cannot achieve consistently high accuracy across all accuracy metrics (Miller et al., 1995; Yuan et al., 2009; Shelestov et al., 2017; Pan and Zhao, 2018; Piramanayagam et al., 2018; Liu et al., 2019). In addition, NN can also result in unexplained behavior as it does not provide information on how the results are produced. Our NN was implemented using the “neuralnet” package included in R software.
Ensemble of RF, GBM, and NN
Ensembles of machine learning methods are capable of producing more accurate results than a single model (Dietterich, 2000), and it has been demonstrated that ensemble learning helps improve land cover and land use mapping when different machine learning models are combined effectively (Walsh, 2015; Liu et al., 2019). The overall scheme for machine learning in this study is to let the individual machine learning methods (RF, GBM, and NN) predict the probabilities of mangrove forests rather than only outputting the most likely class that each pixel should belong to. Then the probabilities for the test reference samples are used for regularizing the weights of individual machine learning methods when forming the ensemble model.
In general, there are three methods for combining the predictions from different machine learning models, including: (1) bagging, which builds multiple same-type models from different subsamples of the training dataset, (2) boosting, which builds multiple same-type models with each of them learning to fix the prediction errors of a prior model in the chain, and (3) stacking, which builds multiple different types of models and a supervisor model that learns how to best combine the predictions of the primary models. Here we used the stacking method to build the ensemble, with the test dataset for this ensemble containing the remaining samples after randomly selecting part of the samples for training the RF, GBM, and NN algorithms. Regularization is necessary to reduce overfitting and increase predictive accuracy of machine learning ensembles, typically including regularization with an L2 penalty (ridge), an L1 penalty (lasso) or a combination of the two (elastic net). As elastic net is always preferred over lasso and ridge because it solves the limitations of both methods, elastic net stacking regularization was used for the ensemble of RF, GBM, and NN. Specifically, the stacking algorithm builds a model on top of the RF, GBM, and NN predictions (probability) based on the test dataset, which was implemented in R through the “glmnet” package fitting the elastic-net regularization path for a binomial model.
Study Area
Our study area covers eleven countries in West Africa: Senegal, The Gambia, Guinea Bissau, Guinea, Sierra Leone, Liberia, Côte d’Ivoire, Ghana, Togo, Benin, and Nigeria (Figure 1). The region is located within 20°N of the Equator and between 20°W and 10°E of the Prime Meridian. The area is bordered to the west by the Atlantic Ocean and to the south by the Gulf of Guinea.
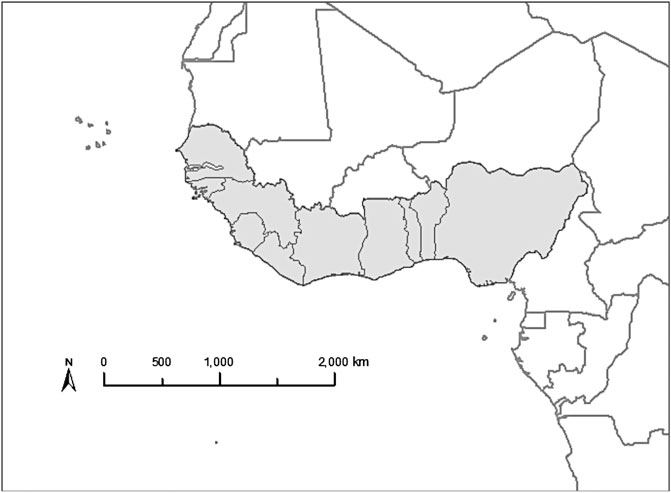
FIGURE 1. Illustration of the study area, including 11 coastal countries in West Africa, namely Senegal, The Gambia, Guinea Bissau, Guinea, Sierra Leone, Liberia, Côte d’Ivoire, Ghana, Togo, Benin, and Nigeria.
Coastal West Africa is characterized by tropical, hot, and humid conditions with extremes in mean annual precipitation ranging from around 250 mm in the north, to more than 1,800 mm in the south. Nigeria, Senegal, Guinea Bissau, and Sierra Leone have abundant mangrove forests, and the mangrove extent has been experiencing significant declines in recent decades (Feka and Ajonina, 2011). For example, it is estimated that mangrove cover decreased by 24% in Senegal from 1980 to 2006, from 1,690 km2 to 1,287 km2 (Corcoran et al., 2007) and Nigeria lost approximately 432 km2 of mangrove forest between 1975 and 2013 (USGS, 2016). The vast majority of this area is relatively flat and low in elevation. Major land cover and land use types include forest, wetland, savanna, shrubland, water, mangrove, cropland, and human settlement. In addition, these countries are investing heavily in scientific and logistical aspects of developing monitoring systems for mangrove change dynamics, and need complementary remote sensing capabilities and data products to specifically address large-scale sustainable management needs for mangrove forest ecosystems.
Satellite Datasets
For this study, Sentinel-2 multispectral data and Sentinel-1 C-band SAR data were utilized. All remote sensing data from Sentinel-2 and Sentinel-1 are free and open, and available from the European Space Agency (ESA)’s Copernicus Access Hub and geospatial cloud platforms such as the Google Earth Engine (GEE), Earth on AWS, and ESRI Cloud (Sentinel-2 Only). Our target year for mangrove extent mapping was 2017. Both Sentinel-2 multispectral and Sentinel-1 C-band SAR data used here were accessed through the Google Earth Engine (GEE).
Sentinel-2
Sentinel-2 (S2) multi-spectral instrument (MSI) collects multispectral data with 13 bands in the visible/near infrared (VNIR), and shortwave infrared (SWIR) regions of the spectrum, every 5 days or less. It is different from traditional multispectral satellite sensors such as Landsat, by including three vegetation red edge bands. Blue (490 nm), Green (560 nm), Red (665 nm) and NIR (842 nm) bands are collected at 10 m spatial resolution while the three Vegetation Red Edge bands (705 nm, 740 nm, and 783 nm), Narrow NIR band (865 nm), and two shortwave infrared bands (1610 nm and 2190 nm) collect data at 20 m spatial resolution.
We used S2 MSI Level 1C data representing TOA (top of atmosphere) reflectance scaled by 10,000 available in GEE (GEE, 2019b). The S2-TOA imagery was used because of the higher data accessibility compared to processed S2-Surface Reflectance (SR) data that was not available for the 2017 timeframe. Cloud contamination is a major issue for optical sensors, particularly for the tropical regions of West Africa, thus we applied annual greenest pixel compositing (maximum greenness is defined by maximum NDVI) for all available S2 images during the year at each pixel to remove cloud contamination, for all the VNIR, Vegetation Red Edge, and SWIR bands. All 10 m bands of S2 images were resampled to 20 m to be consistent with the 20 m bands of Sentinel-2 images.
Sentinel-1
The Sentinel-1 (S1) C-Band SAR Mission consists of two polar-orbiting satellites capturing data at 10 m resolution and with multiple polarizations (e.g., vertical-vertical (VV) and vertical-horizontal (VH)) every 6–12 days. We used the GEE-processed Sentinel-1 Level 1 Ground Range Detected (GRD) Image Collection data which have been converted to backscatter coefficient (σ°) in decibels (dB), representing target backscattering area (radar cross-section) per unit ground area (unit: backscatter coefficient (σ°) in decibels (dB)). GEE provided preprocessed Sentinel-1 backscatter coefficient data using the Sentinel-1 Toolbox framework: (1) applying orbit file to update orbit metadata using restituted orbits; (2) removing thermal noise to remove additive noises in sub-swaths and thus reduce the discontinuities between sub-swaths; (3) performing radiometric calibration to compute backscatter intensity using sensor calibration parameters in the GRD metadata; and (4) performing terrain correction to convert data from ground range geometry to σ° using high resolution Digital Elevation Model (DEM). As the backscatter coefficient can vary by several orders of magnitude, it is converted to dB as 10*log10σ° (GEE, 2019a). To be temporally consistent with the Sentinel-2 annual composite (greenest pixel compositing), annual compositing was conducted on all the available Sentinel-1 C-band SAR images during the 2017 year at each pixel for both VV and VH polarizations. All Sentinel-1 images were resampled to 20 m resolution to be consistent with the 20 m bands of Sentinel-2 images.
Auxiliary Datasets
The auxiliary data used in this study include the 30 m digital elevation data from NASA Shuttle Radar Topography Mission (SRTM) data which is also available on the GEE platform. We used this data to identify the low elevation coastal zone (LECZ) which is defined by an elevation ≤ 40 m, a criterion widely used to delineate the LECZ where mangroves are expected to occur (Fatoyinbo and Simard, 2013).
Training and Validation Data
To train and validate the machine learning classifications, reference sample data were established for both mangrove and non-mangrove land cover types, including non-mangrove forest, cropland, water, grassland, bare land, and settlement. In order to ensure rigorous accuracy assessment, the reference sample data were collected from very high-resolution ESRI World Imagery which provides 1 m or better satellite and aerial imagery dated close to 2017 through two separate data collection procedures respectively for training and validation.
To reduce sampling bias, we applied a stratified random sampling method. That is, in addition to considering randomness when picking a reference sampling site, we also considered the balance of sample sites collected for different land cover and land use types within the image boundary and geographic locations across the coastal landscape. For each reference sample site, as long as the 20 m by 20 m square area contains only mangrove trees (pure pixels), it was recorded as a mangrove sample. The same rule was applied when collecting non-mangrove land cover samples. In total, 4,967 reference samples (2,655 mangrove samples and 2,312 non-mangrove samples) were collected solely for training the machine learning model and 8,204 reference samples (3,973 mangrove samples and 4,231 non-mangrove samples) were collected solely for validation and accuracy assessment for the mangrove mapping results generated by the machine learning model.
Mangrove Extent Data Production Workflow
The overall workflow for mangrove extent data production is shown in Figure 2. The general scheme is to use the output probabilities of the RF, GBM, and NN algorithms to create an ensemble-weighted probability of mangrove for each pixel location. In order to build the ensemble, each of the three individual machine learning models (RF, GBM, and NN) was trained and the probability of mangrove forest occurring at each pixel location was predicted. The RF, GBM, and NN created three separate mangrove probability data layers, respectively. The three layers were then stacked into an ensemble layer with regularized weights for RF, GBM, and NN that were then used to predict the probability of the mangrove.
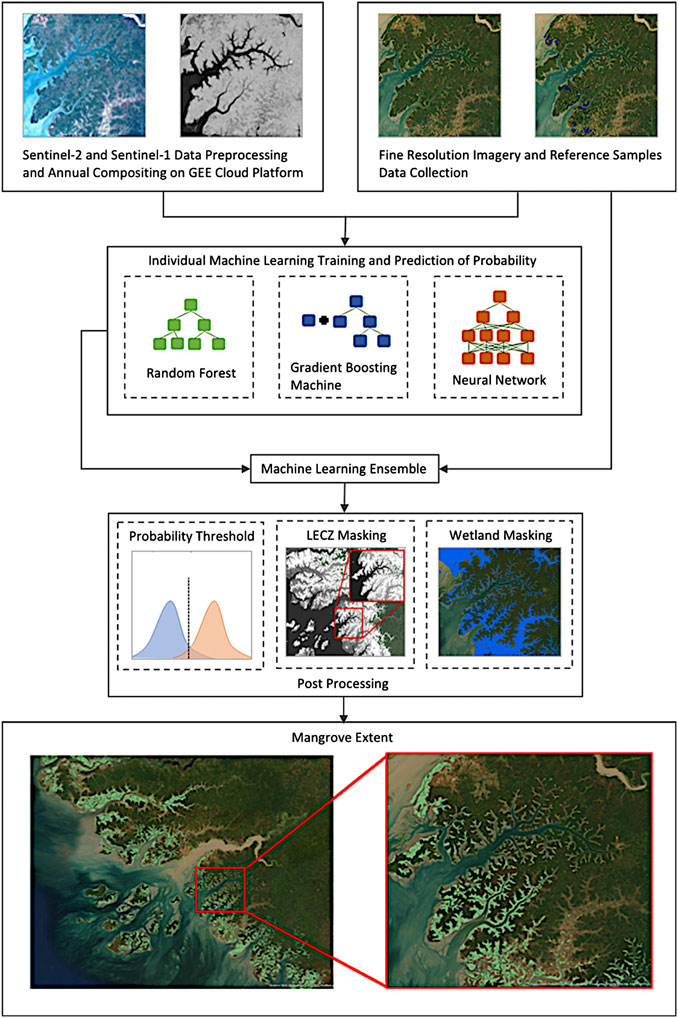
FIGURE 2. Illustration of the overall workflow for mangrove extent data production using the machine learning ensemble of RF, GBM, and NN. All the procedures are automatic except the wetland masking in the post processing step for which we interactively removed some minor pixel clusters through overlaying with existing wetland maps and comparing with fine resolution images, as we assume mangrove pixels must be located within wetland areas.
As all reference samples, Sentinel-2, and Sentinel-1 images were linked geographically, for each of the sample sites, the corresponding pixel values on Sentinel-2 and Sentinel-1 images were extracted as follows for training and validation purposes:
Where:
(i, j) indicates the location of a reference sample site
S2(i, j) = Sentinel-2 TOA reflectance for VNIR, Red Edge, and SWIR bands at pixel (i, j)
S1(i, j) = Sentinel-1 backscatter coefficients for VV and VH polarizations at pixel (i, j)
The collection of Z(i, j), including mangrove forests and non-mangrove land cover and land use types, is a multi-dimensional vector of covariates to be used for training individual machine learning algorithms and regularizing the weighting of the ensemble.
Two thirds of reference samples and corresponding covariates were randomly selected for training while the remaining one third of reference samples and corresponding covariates were used for regularizing the weighting of the ensemble. The output of each individual machine learning method is a grid or image with each pixel value representing the probability of mangrove forest (1 indicating most probable while 0 indicating least probable).
Specifically, the following parameters were used when running the individual machine learning models: 1) RF used out-of-bag (OOB) for training control, and probability as the spatial prediction type, 2) GBM used repeated cross-validation (CV) with the number set as 10 and repeats set as five for training control, and probability as the spatial prediction type, 3) NN used cross-validation (CV) with the number set as 10 for training control, and probability as the spatial prediction type, and 4) the stacking ensemble of RF, GBM, and NN used cross-validation (CV) with the number set as 10 and binomial modeling for regularizing the ensemble weighting, and probability as the spatial prediction type. Therefore, the output of the ensemble step at each pixel location was the probability of mangrove forest with a probability threshold of 0.9 applied to identify mangrove pixels.
Accuracy Assessment
To understand the performance of the machine learning ensemble in mapping mangrove extent and to make the mangrove extent data products readily applicable to various users, a rigorous quantitative accuracy assessment must be conducted. As stated above, for validation and accuracy assessment, an independent set of reference sample data were identified from high-resolution imagery. The accuracy was assessed by comparing the machine learning ensemble created mangrove extent maps against the independent reference samples.
We generated a confusion matrix and calculated all relevant accuracy metrics including the producer’s accuracy, the user’s accuracy, and overall accuracy to assess the model uncertainties. Here, the producer’s accuracy refers to how often are validation reference samples correctly shown on the classified map, the user’s accuracy refers to how often the classified pixels on the maps actually exist on the ground. In addition, to understand if the machine learning ensemble can perform consistently well across the different coastal landscape of West Africa for mapping mangrove, an accuracy assessment was conducted for nine sub-regions of West Africa separately including Senegal and The Gambia, Guinea-Bissau, Guinea, Sierra Leone, Liberia, Côte d’Ivoire, Ghana, Togo and Benin, and Nigeria.
Comparison with Existing Mangrove Data Products
We compared our final mangrove extent data product for West Africa with other published mangrove data products. The USGS 2014 and GMW 2010 mangrove extent data products are the two most widely used baseline mangrove extent data products available for West Africa. Because they were produced for different years especially the GMW 2010 which has a seven-year difference with our 2017 data product, these two data products cannot be used for validating our data product quantitatively. However, they can be used for verifying the spatial distribution patterns of mangrove forests across the West Africa coastal landscape, demonstrating the more details revealed by our higher resolution data product relative to the USGS 2014 data product (it is closer in time to our mapping year 2017, thus not much changes might have occurred), and for comparing the mangrove area changes during the years. By overlaying the country boundaries and mangrove extent data products, we visually compared the mangrove extent spatial distribution patterns and calculated the total mangrove areas for each of the countries or subregions (Senegal and The Gambia combined, and Togo and Benin combined).
Results
Mangrove Map Results
A high-resolution 2017 mangrove extent map for 11 countries in West Africa was successfully achieved using a combination of Sentinel-2 and Sentinel-1 imagery. Mangrove forest extent across Senegal, The Gambia, Guinea Bissau, Guinea, Sierra Leone, Liberia, Côte D’Ivoire, Ghana, Togo, Benin, and Nigeria totaled 20,074.11 km2 (Figure 3). Nigeria contained the largest area of mapped mangroves, with a total area of 8,725.22 km2 with the smallest mangrove forest in Cote D’Ivoire of 35.34 km2 (Table 1). This demonstrates the ability of the machine learning ensemble to map mangroves across a range of scales. This map represents the most up-to-date and highest resolution mangrove extent map for West Africa compared to the GMW 2010 and USGS 2014 baseline mangrove extents. This higher resolution enables land cover boundaries to be more accurately distinguished and allows for smaller mangrove stands to be mapped in greater detail, particularly where mangroves are heavily fragmented or occur as fine fringes within river channels (Figure 4).
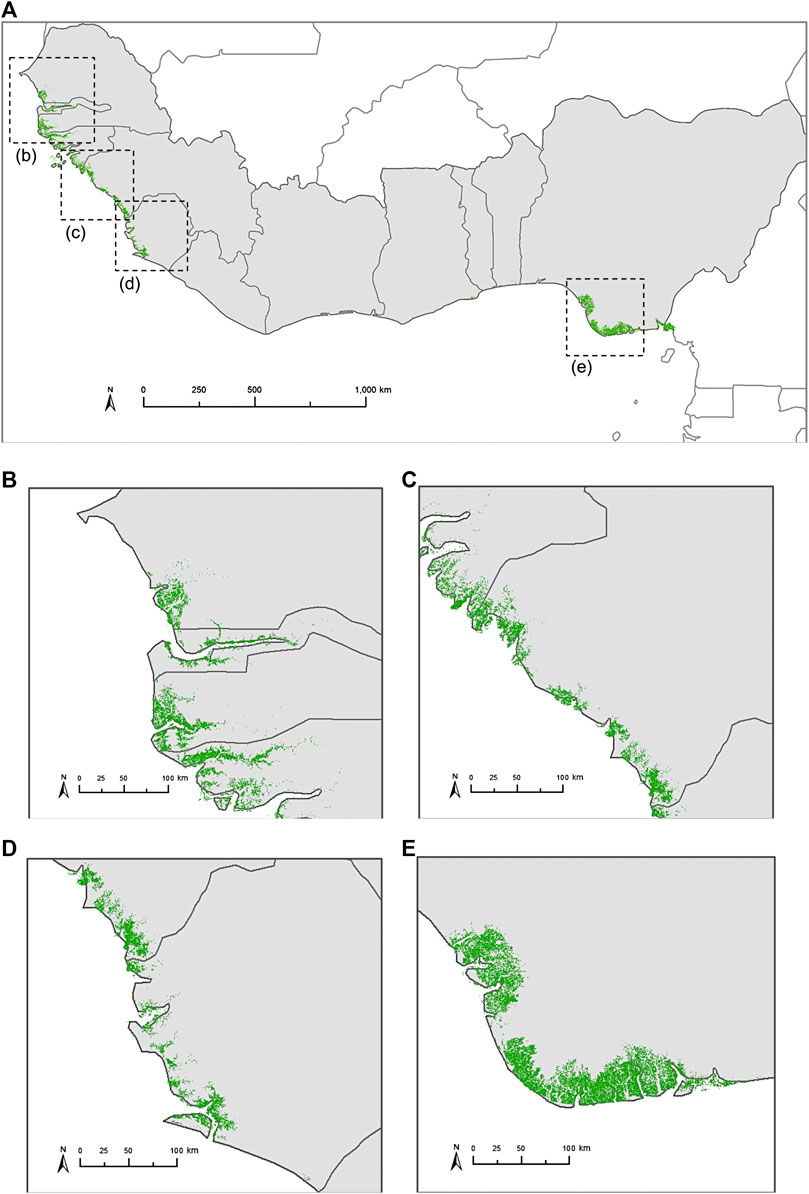
FIGURE 3. 2017 mangrove extent map at 20 m resolution created by the ensemble of RF, GBM and NN for the West Africa coast based on the combination of Sentinel-2 multispectral data and Sentinel-1 C-band SAR data: (A) The entire West Africa, (B) Senegal and The Gambia, (C) Guinea, (D) Sierra Leone, and (E) Nigeria.
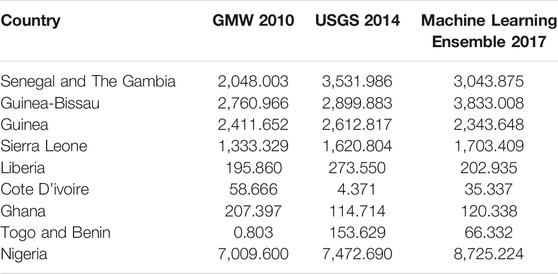
TABLE 1. Comparison for the total mangrove areas (km2) calculated from our 2017 data product, USGS 2014 data product, and GMW 2010 data product.
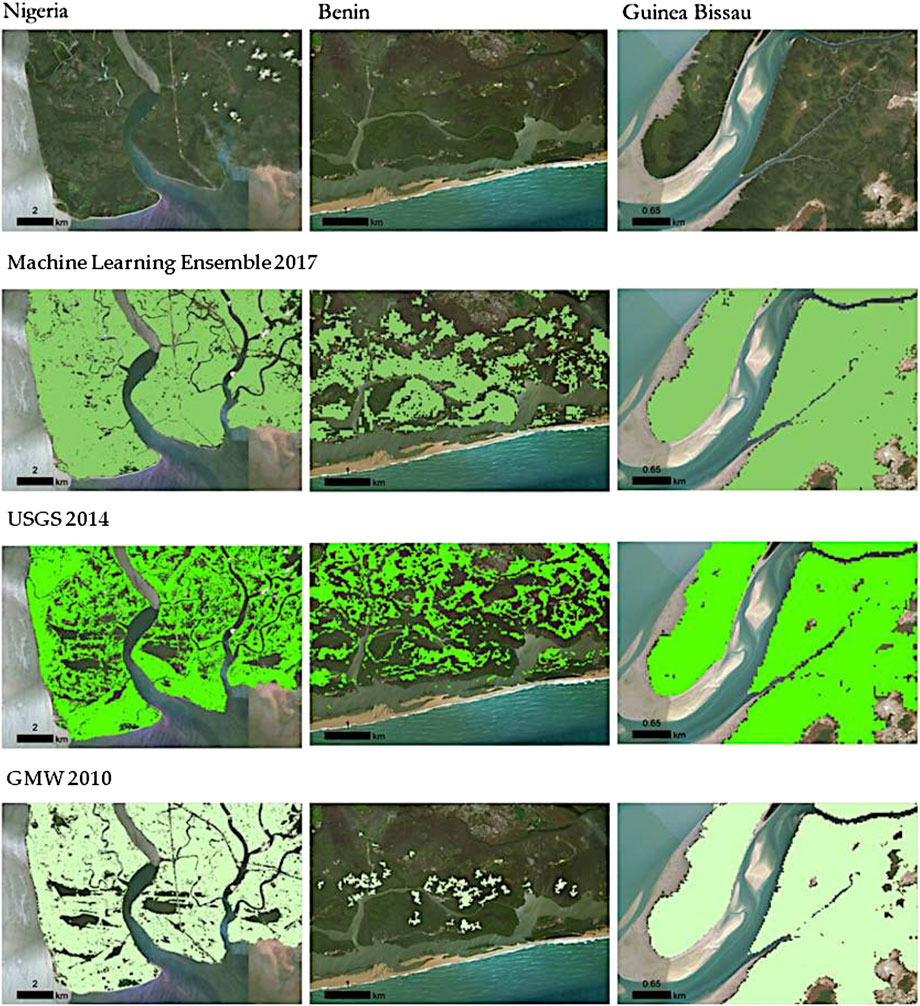
FIGURE 4. Illustration for the comparison of mangrove extent data products from our machine learning ensemble 2017, USGS 2014, and GMW 2010. It reveals that in general, our mangrove extent map is highly consistent with the spatial distribution patterns of mangrove forests identified by both USGS 2014 and GMW 2010 (Nigeria and Guinea Bissau), and ours performs better (relative to the USGS 2014) when they are not consistent by checking the details against fine resolution imagery (Benin).
Mangrove Mapping Comparison
Extensive visual comparisons were made between our mangrove extent data product, and the two most widely used existing baseline mangrove extent data products by the USGS and Global Mangrove Watch (GMW). Such visual comparisons revealed that our mangrove extent map is highly consistent with the spatial distribution patterns of mangrove forests identified by both USGS 2014 and GMW 2010, and ours performs better relative to the USGS 2014 when they are not consistent through checking the details against fine resolution imagery. In addition, our mangrove extent map is more consistent with those patterns shown on the USGS 2014 data product than the GMW 2010 data product. This is reasonable as our 2017 mangrove extent map is only three years apart from the USGS 2014 mangrove extent map instead of seven years difference in time from the GMW 2010 mangrove extent map.
By overlaying the country boundaries and mangrove extent data products, we calculated the total mangrove areas for each of the countries or subregions (Senegal and The Gambia combined, Togo and Benin combined) based on our 2017 mangrove extent data product and the USGS and GMW mangrove extent data products (Table 1).
The comparison between GMW 2010 and our 2017 data products shows that total mangrove areas increased in Senegal and The Gambia, Guinea-Bissau, Sierra Leone, Liberia, Togo and Benin, and Nigeria while decreased in Guinea and Cote D'ivoire between 2010 and 2017. However, the comparison between USGS 2014 and our 2017 data products shows that total mangrove areas increased in Guinea-Bissau, Sierra Leone, Cote D'ivoire, Ghana, and Nigeria, while decreased in Senegal and The Gambia, Guinea, Liberia, and Togo and Benin between 2014 and 2017. These estimated changes in total mangrove areas contain both the real changes of mangrove extents during the time periods and the errors in the data products, therefore we cannot depend on such a comparison to quantitatively assess the quality of our mangrove extent data products, and must use reference sample data collected by ourselves to validate and conduct accuracy assessment.
Accuracy
GMW 2010 and USGS 2014 data products are respectively seven and three years apart from our mangrove mapping year, and they both contain inherent mapping errors, therefore it is not appropriate to use them to quantitatively validate and assess accuracy for our mangrove extent data product. As such, a rigorous quantitative accuracy assessment for our 2017 mangrove extent data product was conducted quantitatively using the validation reference samples solely collected for validation purposes through overlaying reference samples with the classified mangrove extent maps. The resulting confusion matrices (Table 2) shows that our mangrove extent data product achieved similar high accuracies across all geographic areas and all accuracy metrics (92–99% Producer’s Accuracy, 98–100% User’s Accuracy, 95–99% Overall Accuracy, and 0.93–0.99 Kappa Coefficient). This verifies that this machine learning ensemble classifier can yield very high mangrove extent mapping accuracy.
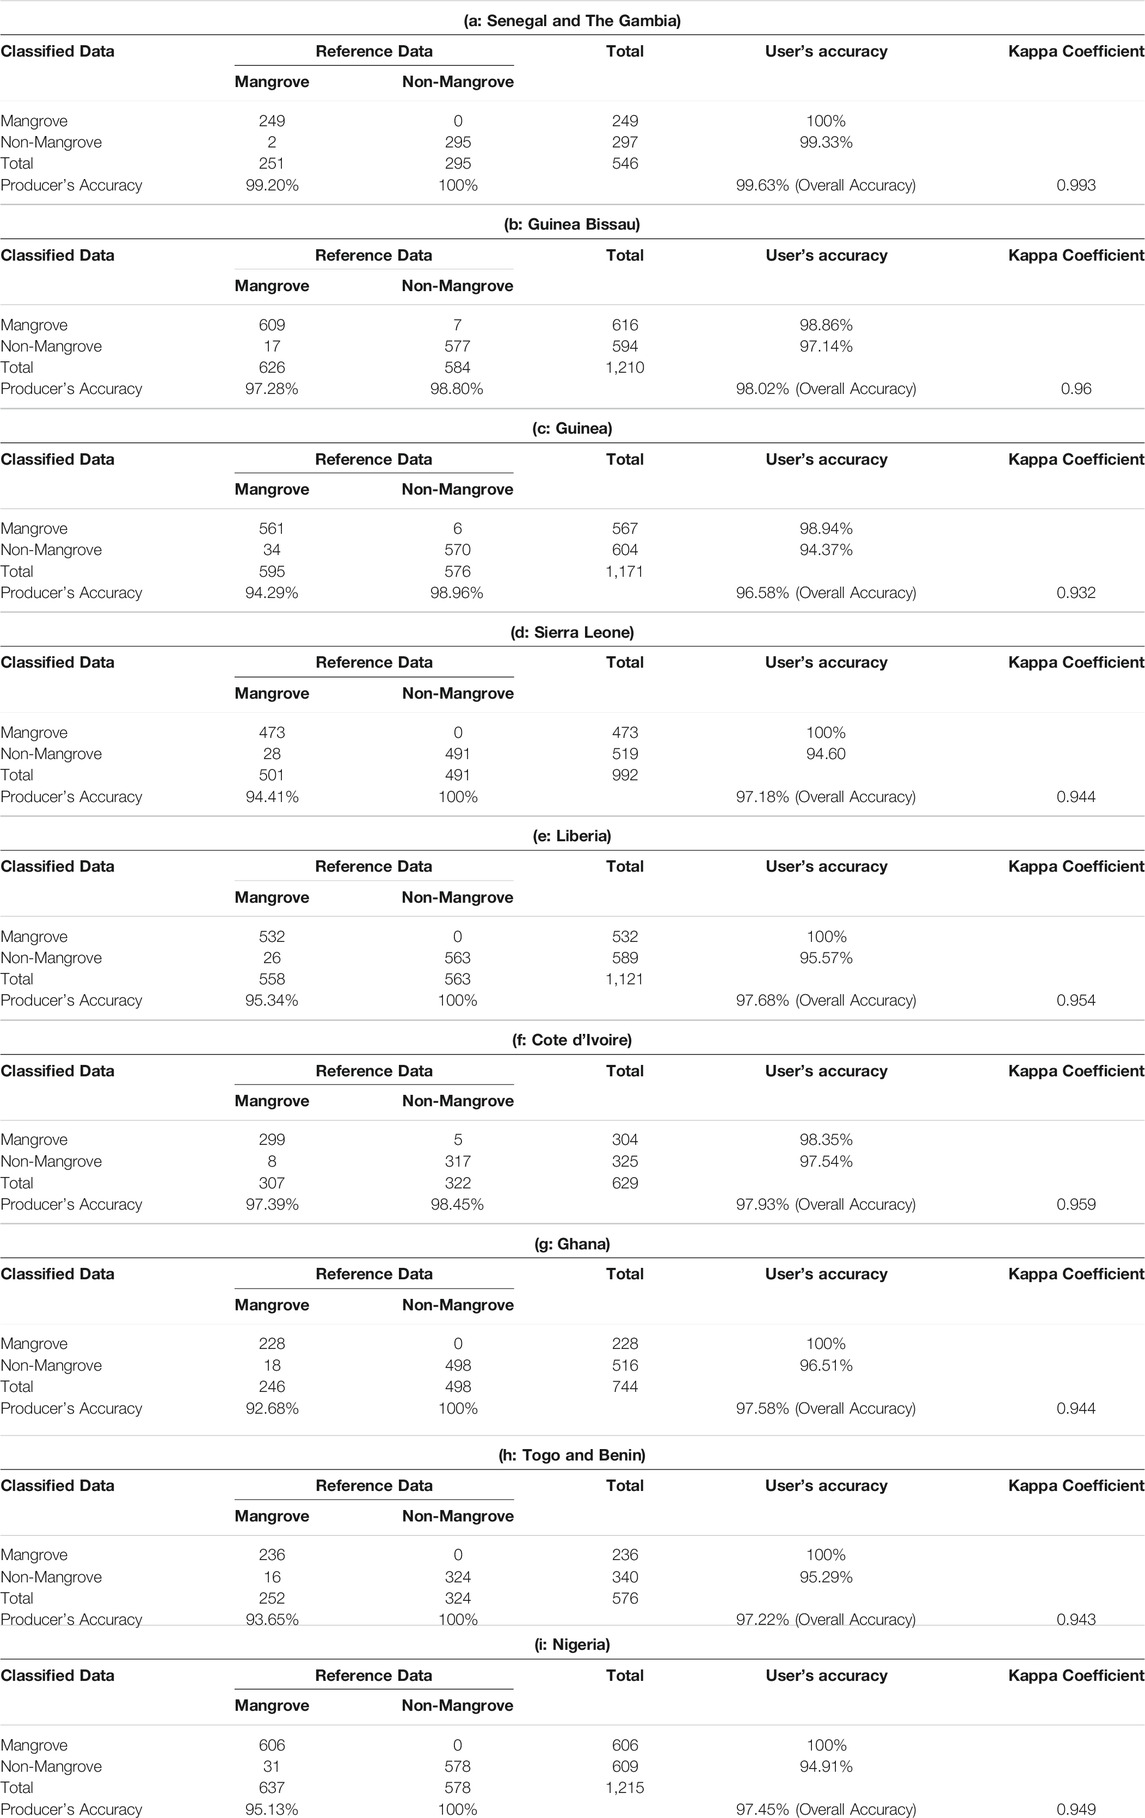
TABLE 2. Quantitative accuracy assessment for the machine learning ensemble performance and related mangrove extent data product: confusion matrix for (a) Senegal and The Gambia, (b) Guinea-Bissau, (c) Guinea, (d) Sierra Leone, (e) Liberia, (f) Côte d’Ivoire, (g) Ghana, (h) Togo and Benin, and (i) Nigeria.
Discussion
Existing large area mangrove maps have been produced using Landsat data for both baseline mapping (Giri et al., 2011; Bunting et al., 2018) and time-series change detection (Hamilton and Casey, 2016; Lagomasino et al., 2019) at 30 m spatial resolution. This yields satisfactory results at the global level but differences in methodologies and localized errors and inconsistencies between maps can be significant. This study provides a means for efficiently creating accurate and up-to-date mangrove extent maps across large geographical areas that are able to resolve mangrove patches and landforms at a finer spatial resolution than currently available.
West Africa is an area with some of the poorest quality mangrove extent maps. Data availability has been a major limitation for mapping mangrove extent in this region caused by a shortage of satellite downlink stations, persistent cloud cover, and long sensor revisit times (e.g., 16-day repeat cycle of Landsat). Sentinel-2 optical data are routinely collected at a consistent high quality with more applicable bands (e.g., three more vegetation red edge bands) and shorter revisit time (every 5 days or less) than Landsat. The all-weather Sentinel-1 C-band SAR observations are especially beneficial for mangrove mapping in West Africa as optical sensors such as Landsat and Sentinel-2 are very difficult to obtain cloud-free observations in the region (Aslan et al., 2016; Pimple et al., 2018). In addition, mangroves contain a large quantity of woody biomass (Simard et al., 2019) and their canopies and root structures form large complex aboveground structures. Radar imagery is sensitive to target structure and can be useful when combined with optical imagery for discriminating vegetation types which may be spectrally similar to mangrove forests. Therefore, fusion of the complementary information on vegetation characteristics from the optical Sentinel-2 and radar Sentinel-1 data provided the capability to improve mangrove mapping accuracies (Hamdan et al., 2014; Aslan et al., 2016; Lopes et al., 2020).
The use of higher-resolution imagery was, in part, responsible for the improved mangrove maps (Figure 4). Most prior efforts to map mangrove extent in this area using satellite remote sensing are based on 30 m imagery (Giri et al., 2011; Bunting et al., 2018; Thomas et al., 2018), which overlook small mangrove patches or narrow mangrove shorelines less than 900 m2 (30 m × 30 m pixel), therefore limiting detailed mangrove mapping, especially in heterogeneous landscapes and tidal channels. This is common in West Africa where mangroves occur as narrow riverine fringes, which decrease in size in narrow channels and in upstream reaches where terrestrial and often arid environments dominate (Figure 5). Higher resolution Sentinel-2 and Sentinel-1 data make it possible to map these detailed extents across large geographical scales at 10 or 20 m resolutions, particularly among small isolated fragmented stands.
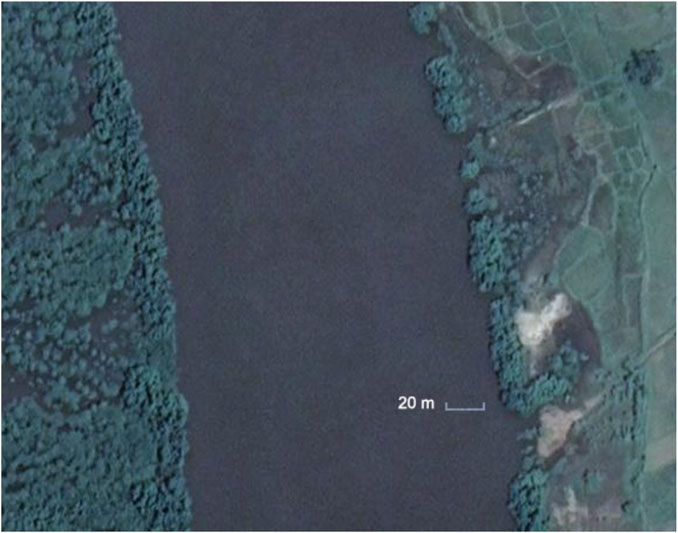
FIGURE 5. Illustration of small mangrove patches less than 30 m × 30 m in the study area.
Machine learning methods can outperform parametric classifiers for land cover classification from remote sensing data, particularly with very large quantities of data, as is currently available. While most of the recent work has focused on the application of a single machine learning method (Dietterich, 2000; Zhu, 2012; Walsh, 2015; Liu et al., 2019; Thomas et al., 2019), this study is the first effort to evaluate a combination of several mature and popular machine learning algorithms to map mangrove extent at large spatial scales. The very high accuracies achieved (Table 2) are a testament to the performance of our machine learning ensemble method, which are improved over existing mangrove maps using machine learning algorithms in isolation (Bunting et al., 2018; Thomas et al., 2018). For example, the widely-used GMW 2010 mangrove extent mapping data product, using the Extremely Randomized Trees classifier which is similar to RF, obtained 94.0% overall accuracy while our machine learning ensemble achieved 96.6–99.6% overall accuracies (Bunting et al., 2018). At the same time, our high producer’s accuracies (92.7–99.2%) demonstrate that there was little class confusion with other vegetation types despite the study region spanning a wide range of coastal geomorphological landforms (e.g., estuaries, lagoons, deltas) and ecotones. In addition, most existing single machine learning methods for mangrove mapping have been contained to smaller study areas (Knudby et al., 2014; Zhang and Xie, 2014; Zhang et al., 2018), yet we provide a tractable means of using an ensemble method across very large geographic domains. This demonstrates that the use of ensemble methods is scalable and could be readily applied to other large geographical domains including continental and global scales.
Accurate and high-resolution mangrove forest extent data products at large spatial scales are needed for mangrove change analysis (Lagomasino et al., 2019) and regular monitoring (Emuedo et al., 2014; Kuenzer et al., 2014; Duke 2016; Onyena and Sam, 2020). The 2017 mangrove extent maps provided here are the highest quality and highest resolution data products for West Africa region so far, which can be used by the wider research community to derive more accurate estimates of other mangrove properties, including mangrove aboveground biomass (AGB) and carbon (Hutchison et al., 2014; Simard et al., 2019) and belowground carbon (Rovai et al., 2018; Sanderman et al., 2018). Facilitated by the big satellite data processing capability from the open geospatial computing cloud platform Google Earth Engine, such mangrove extent mapping can be quickly implemented for the West Africa region or other large geographic regions.
Conclusion
This study has generated the first 20 m mangrove extent data product for the West Africa sub-continent, which is the highest resolution mangrove extent data product so far, based on the Google Earth Engine satellite big data processing, a machine learning ensemble from the commonly used machine learning methods, namely RF, GBM, and NN, and fusion of Sentinel-2 optical data and Sentinel-1 radar data. It has achieved the highest mangrove mapping overall accuracy relative to existing large-scale mangrove extent data product (GMW 2010). The combination of 10–20 m Sentinel-2 and Sentinel-1 satellite data lead to greater details than currently available 30 m resolution mangrove extent data products.
Through combining the capability of efficient satellite big data processing on Google Earth Engine or other similar cloud platforms and the performance benefits of this machine learning ensemble, high-accuracy mangrove extent mapping at 20 m or higher resolutions may be achieved on continental to global scales periodically therefore mangrove forest change can be more frequently monitored and assessed. This will be critical for improving terrestrial carbon accounting and implementing UN SDGs regarding climate actions, sustainable cities and communities, and clean water in tropical regions.
Data Availability Statement
Publicly available datasets were analyzed in this study. This data can be found here: The original satellite data from Sentinel-1 and Sentinel-2 are publically accessible from the open cloud platform Google Earth Engine: Sentinel-1 Data Link: https://developers.google.com/earth-engine/datasets/catalog/COPERNICUS_S1_GRD. Sentinel-2 Data Link: https://developers.google.com/earth-engine/datasets/catalog/COPERNICUS_S2. The mangrove extent data products from this research project have been published by Harvard Dataverse and can be accessed through the following link: https://doi.org/10.7910/DVN/9EVOEO.
Author Contributions
XL and TF conceived and designed the experiments; XL wrote the original draft of the paper, which was revised by TF, PM, WG, DL, and NT; XL and PM designed the “ground-truth” reference sampling plan and collected the samples; PM contributed in writing the initial GEE data processing codes; YZ contributed to the programming for processing Sentinel-2 data, Sentinel-1 data, and machine learning methods to generate the mangrove probability; XL analyzed the mangrove probability results and post-processed mangrove mapping classification results; RD calculated mangrove extents and compared their difference for the three mangrove extent data products; AB and XL created the figures for the manuscript; and TF, DL, CT, MS, and NT provide valuable suggestions during the project work regarding available mangrove extent data products for referencing and constructive feedbacks for the initial data products.
Funding
This research was funded by the NASA Carbon Monitoring System Program Project “Estimating Total Ecosystem Carbon in Blue Carbon and Tropical Peatland Ecosystems (Award Number: 16-CMS16-0073).
Conflict of Interest
The authors declare that the research was conducted in the absence of any commercial or financial relationships that could be construed as a potential conflict of interest.
Acknowledgments
We appreciate the anonymous reviewers who provide valuable comments for improving this manuscript. We also appreciate the remote sensing data preprocessing work conducted by the Harvard CGA’s interns Samantha Carr and Venus Meza who were sponsored by the NSF I/UCRC Spatiotemporal Innovation Center (Award Number: 1841520). Part of this work was performed at the Jet Propulsion Laboratory, California Institute of Technology, under contract with the National Aeronautics and Space Administration (NASA).
References
Abdi, A. M. (2019). Land cover and land use classification performance of machine learning algorithms in a boreal landscape using Sentinel-2 data. GISci. Remote Sens. 57 (1), 1–20. doi:10.1080/15481603.2019.1650447
Ali, K., Rahman, H. U., Khan, R., Siddiqui, M. Y., Najeeb, F., Amin, S., et al. (2016). Land usage analysis: a machine learning approach. Int. J. Comput. Appl. 141 (12), 0975–8887. doi:10.5120/ijca2016909936
Aslan, A., Rahman, A. F., Warren, M. W., and Roberson, S. M. (2016). Mapping spatial distribution and biomass of coastal wetland vegetation in Indonesian Papua by combining active and passive remotely sensed data. Remote Sens. Environ. 183, 65–81. doi:10.1016/j.rse.2016.04.026
Atzberger, C. (2013). Advances in remote sensing of agriculture: context description, existing operational monitoring systems and major information needs. Remote Sens. 5, 949–981. doi:10.3390/rs5020949
Bandaranayake, W. M. (1998). Traditional and medicinal uses of mangroves. Mangroves Salt Marshes. 2 (3), 133–148.
Bunting, P., Rosenqvist, A., Lucas, R., Rebelo, L. M., Hilarides, L., Thomas, N., et al. (2018). The Global Mangrove Watch – a new 2010 global baseline of mangrove extent. Remote Sens. 10, 1669. doi:10.3390/rs10101669
Colin, B., Clifford, S., Wu, P., Rathmanner, S., and Mengersen, K. (2017). Using boosted regression trees and remotely sensed data to drive decision-making. Open J. Stat. 7, 859–875. doi:10.4236/ojs.2017.75061
Corcoran, E., Ravilious, C., and Skuja, M. (2007). Mangroves of western and Central Africa. Cambridge, UK: UNEP.
Curnick, D., Pettorelli, N., Amir, A. A., Balke, T., Barbier, E. B., Crooks, S., et al. (2019). The value of small mangrove patches. Science. 363, 239. doi:10.1126/science.aaw0809
Danielsen, F., Sørensen, M. K., Olwig, M. F., Selvam, V., Parish, F., Burgess, N. D., et al. (2005). The Asian tsunami: a protective role for coastal vegetation. Science. 310, 643. doi:10.1126/science.1118387
Dietterich, T. G. (2000). “Ensemble methods in machine learning,” in Computer vision. Berlin, Germany: Springer Science and Business Media LLC, 1857, 1–15.
Donato, D. C., Kauffman, J. B., Murdiyarso, D., Kurnianto, S., Stidham, M., and Kanninen, M. (2011). Mangroves among the most carbon-rich forests in the tropics. Nat. Geosci. 4, 293–297. doi:10.1038/ngeo1123
Duke, N. C. (2016). Oil spill impacts on mangroves: recommendations for operational planning and action based on a global review. Mar. Pollut. Bull. 109 (2), 700–715. doi:10.1016/j.marpolbul.2016.06.082
Emuedo, O. A., Anoliefo, G. O., and Emuedo, C. O. (2014). Oil pollution and water quality in the Niger Delta: implications for the sustainability of the mangrove ecosystem. Glob. J. Hum. Soc. Sci. Res. 14 (6), 9–16.
Fatoyinbo, T. E., and Simard, M. (2013). Height and biomass of mangroves in Africa from ICESat/GLAS and SRTM. Int. J. Remote Sens. 34, 668–681. doi:10.1080/01431161.2012.712224
Feka, N. Z., and Ajonina, G. N. (2011). Drivers causing decline of mangrove in West-Central Africa: a review. Int. J. Biodivers. Sci. Ecosyst. Serv. Manag. 7 (3), 217–230. doi:10.1080/21513732.2011.634436
Gauci, A., Abela, J., Austad, M., Cassar, L. F., and Adami, K. Z. (2018). A machine learning approach for automatic land cover mapping from DSLR images over the Maltese Islands. Environ. Model. Software. 99, 1–10. doi:10.1016/j.envsoft.2017.09.014
Georganos, S., Grippa, T., Vanhuysse, S., and Lennert, M. (2018). Very high resolution object-based land use-land cover urban classification using extreme gradient boosting. IEEE Geosci. Remote Sens. Lett. 15, 607–611. doi:10.1109/LGRS.2018.2803259
Giri, C. (2016). Observation and monitoring of mangrove forests using remote sensing: opportunities and challenges. Remote Sens. 8 (9), 783. doi:10.3390/rs8090783
Giri, C., Ochieng, E., Tieszen, L. L., Zhu, Z., Singh, A., Loveland, T., et al. (2011). Status and distribution of mangrove forests of the world using earth observation satellite data. Global Ecol. Biogeogr. 20, 154–159. doi:10.1111/j.1466-8238.2010.00584.x
Gislason, P. O., Benediktsson, J. A., and Sveinsson, J. R. (2004). “Random forest classification of multisource remote sensing and geographic data,” in Proceedings of the 2004 IEEE international geoscience and remote sensing symposium, Anchorage, AK, September 20–24, 2004 (IEEE).
Godinho, S., Guiomar, N., and Gil, A. (2016). Using a stochastic gradient boosting algorithm to analyze the effectiveness of Landsat 8 data for montado land cover mapping: application in southern Portugal. Int. J. Appl. Earth Obs. Geoinf. 49, 151–162. doi:10.1016/j.jag.2016.02.008
GEE (2019a). Sentinel 1 algorithms. Available at:https://developers.google.com/earth-engine/sentinel1.
GEE (2019b). Sentinel-2 MSI: MultiSpectral instrument, Level-1C. Available at:https://developers.google.com/earth-engine/datasets/catalog/COPERNICUS_S2.
Gorelick, N., Hancher, M., Dixon, M., Ilyushchenko, S., Thau, D., and Moore, R. (2017). Google Earth Engine: planetary-scale geospatial analysis for everyone. Remote Sens. Environ. 202, 18–27. doi:10.1016/j.rse.2017.06.031
Hamdan, O., Hasmadi, I. M., and Aziz, H. K. (2014). Combination of SPOT-5 and ALOS PALSAR images in estimating aboveground biomass of lowland Dipterocarp forest. IOP Conf. Series: Earth Environ. Sci. 18, 12. doi:10.1088/1755-1315/18/1/012016
Hamilton, S. E., and Casey, D. (2016). Creation of a high spatio-temporal resolution global database of continuous mangrove forest cover for the 21st century (CGMFC-21). Glob. Ecol. Biogeogr. 25 (6), 729–738.
Hird, J. N., DeLancey, E. R., McDermid, G. J., and Kariyeva, J. (2017). Google earth engine, open-access satellite data, and machine learning in support of large-area probabilistic wetland mapping. Remote Sens. 9 (12), 1315. doi:10.3390/rs9121315
Horning, R. (2010). “Random Forests: an algorithm for image classification and generation of continuous fields data sets,” in International conference on geoinformatics for spatial infrastructure development in earth and allied sciences, Hanoi, Vietnam, December 9–11, 2010.
Hutchison, J., Manica, A., Swetnam, R., Balmford, A., and Spalding, M. (2014). Predicting global patterns in mangrove forest biomass. Conserv. Lett. 7 (3), 233–240. doi:10.1111/conl.12060
Jhonnerie, R., and Siregar, V. P., Nababan, B., Prasetyo, L. B., and Wouthuyzen, S. (2015). Random Forest classification for mangrove land cover mapping using Landsat 5 TM and Alos Palsar imageries. Procedia Environ. Sci. 24, 215–221. doi:10.1016/j.proenv.2015.03.028
Kaplan, G., and Avdan, U. (2018). “Sentinel -1 and Sentinel-2 data fusion for wetland mapping: Balikdami, Turkey. The International archives of the photogrammetry, remote sensing and spatial information sciences,” in 2018 ISPRS TC III Mid-term symposium “developments, technologies and applications in remote sensing, Beijing, China, May 7–10, 2018.
Karakizi, C., Karantzalos, K., Vakalopoulou, M., and Antoniou, G. (2018). Detailed land cover mapping from multitemporal Landsat-8 data of different cloud cover. Remote Sens. 10, 1214. doi:10.3390/rs10081214
Kathiresan, K., and Rajendran, N. (2005). Coastal mangrove forests mitigated tsunami. Estuar. Coast. Shelf Sci. 65, 601–606. doi:10.1016/j.ecss.2005.06.022
Knudby, A., Nordlund, L. M., Palmqvist, G., Wikström, K., Koliji, A., Lindborg, R., et al. (2014). Using multiple Landsat scenes in an ensemble classifier reduces classification error in a stable nearshore environment. Int. J. Appl. Earth Obs. Geoinf. 28, 90–101. doi:10.1016/j.jag.2013.11.015
Kuenzer, C., Beijma, S. V., Gessner, U., and Dech, S. (2014). Land surface dynamics and environmental challenges of the Niger Delta, Africa: remote sensing-based analyses spanning three decades (1986–2013). Appl. Geogr. 53, 354–368. doi:10.1016/j.apgeog.2014.07.002
Kussui, N., Shelestov, A., Lavrebiuk, M., Butko, I., and Skakun, S. (2016). “Deep learning approach for large scale land cover mapping based on remote sensing data fusion,” in Proceedings of IEEE Geoscience and Remote Sensing Society, Beijing, China, July, 10–15, 2016.
Lagomasino, D., Fatoyinbo, T., Lee, S., Feliciano, E., Trettin, C., Shapiro, A., et al. (2019). Measuring mangrove carbon loss and gain in deltas. Environ. Res. Lett. 14 (2), 025002.
Liu, X., Sherbinin, A. D., and Zhan, Y. (2019). Mapping urban extent at large spatial scales using machine learning methods with VIIRS nighttime light and MODIS daytime NDVI data. Remote Sens. 11 1247. doi:10.3390/rs11101247
Lopes, M., Frison, P. L., Crowson, M., Warren‐Thomas, E., Hariyadi, B., Kartika, W. D., et al. (2020). Improving the accuracy of land cover classification in cloud persistent areas using optical and radar satellite image time series. Methods Ecol. Evol. 11 (4), 532–541. doi:10.1111/2041-210X.13359
Lucas, R., Robelo, L., Fatoyinbo, T., Rosenqvist, A., Itoh, T., Shimada, M., et al. (2014). Contribution of L-band SAR to systematic global mangrove monitoring. Mar. Freshw. Res. 65 (7), 589–603. doi:10.1071/MF13177
Maxwell, A. E., Warner, T. A., and Fang, F. (2018). Implementation of machine-learning classification in remote sensing: an applied review. Int. J. Remote Sens. 39, 2784–2817. doi:10.1080/01431161.2018.1433343
Miller, D. M., Kaminsky, E. J., and Rana, S. (1995). Neural network classification of remote-sensing data. Comput. Geosci. 21 (3), 377–386. doi:10.1016/0098-3004(94)00082-6
Ming, D., Zhou, T., Wang, M., and Tan, T. (2016). Land cover classification using random forest with genetic algorithm-based parameter optimization. J. Remote Sens. 10 (3), 035021. doi:10.1117/1.JRS.10.035021
Mondal, P., Liu, X., Fatoyinbo, T. E., and Lagomasino, D. (2019). Evaluating combinations of Sentinel-2 data and machine-learning algorithms for mangrove mapping in West Africa. Remote Sens. 11 (24), 2928. doi:10.3390/rs11242928
Mondal, P., Trzaska, S., and Sherbinin, A. D. (2018). Landsat-derived estimates of mangrove extents in the Sierra Leone coastal landscape complex during 1990–2016. Sensors. 18 (1), 12. doi:10.3390/s18010012
Murdiyarso, D., Purbopuspito, J., Kauffman, J. B., Warren, M. W., Sasmito, S. D., Donato, D. C., et al. (2015). The potential of Indonesian mangrove forests for global climate change mitigation. Nat. Clim. Chang. 5, 1089–1092. doi:10.1038/NCLIMATE2734
Murray, B. C., Pendleton, L., Jenkins, W. A., and Sifleet, S. (2011). Report NI R 11-04. Green payments for blue carbon economic incentives for protecting threatened coastal habitats. Nicholas Institute for Environmental Policy Solutions, 1–52.
Na, X., Zhang, S., Li, X., Yu, H., and Liu, C. (2010). Improved land cover mapping using Random Forests combined with Landsat Thematic Mapper imagery and ancillary geographic data. Photogramm. Eng. Remote Sens. 76 (7), 833–840. doi:10.14358/PERS.76.7.833
Natekin, A., and Knoll, A. (2013). Gradient boosting machines, a tutorial. Front. Neurorobot. 7, 21. doi:10.3389/fnbot.2013.00021
Onyena, A. P., and Sam, K. (2020). A review of the threat of oil exploitation to mangrove ecosystem: insights from Niger Delta, Nigeria. Glob. Ecol. Conserv. 22, e00961. doi:10.1016/j.gecco.2020.e00961
Pal, M. (2005). Random Forest classifier for remote sensing classification. Int. J. Remote Sens. 1, 217–222. doi:10.1080/01431160412331269698
Pan, X., and Zhao, J. (2018). High-resolution remote sensing image classification method based on convolutional neural network and restricted conditional random field. Remote Sens. 10 (6), 920. doi:10.3390/rs10060920
Pham, T. D., Yokoya, N., Bui, D. T., Yoshino, K., and Friess, D. A. (2019). Remote sensing approaches for monitoring mangrove species, structure, and biomass: opportunities and challenges. Remote Sens. 11, 230. doi:10.3390/rs11020230
Pimple, U., Simonetti, D., Sitthi, A., Pungkui, S., Leadprathom, K., Skupek, H., et al. (2018). Google Earth Engine based three decadal Landsat imagery analysis for mapping of mangrove forests and its surroundings in the Trat Province of Thailand. J. Comput. Commun. 06 (1), 81443. doi:10.4236/jcc.2018.61025
Piramanayagam, S., Saber, E., Schwartzkopf, W., and Koehler, F. W. (2018). Supervised classification of multisensor remotely sensed images using a deep learning framework. Remote Sens. 10 (9), 1429, doi:10.3390/rs10091429
Reed, R., and Marks, R. J. (1999). Neural smithing: supervised learning in feedforward artificial neural networks. MIT Press, Cambridge, MA, USA
Rogers, K., Lymburner, L., Salum, R., Brooke, B. P., and Woodroffe, C. D. (2017). Mapping of mangrove extent and zonation using high and low tide composites of Landsat data. Hydrobiologia. 803 (1), 49–68. doi:10.1007/s10750-017-3257-5
Rovai, A. S., Twilley, R. R., Castaneda-Moya, E., Riul, P., Cifuentes-Jara, M., and Manrow-Villalobos, M., et al. (2018). Global controls on carbon storage in mangrove soils. Nature Clim. Change. 8, 534–538. doi:10.1038/s41558-018-0162-5
Sanderman, J., Hengl, T., Fiske, G., Solvik, K., and Adame, M. F., et al. (2018). A global map of mangrove forest soil carbon at 30 m spatial resolution. Environ. Res. Lett. 13, 055002. doi:10.1088/1748-9326/aabe1c
Shelestov, A., Lavreniuk, M., Kussul, N., Novikov, A., and Skakun, S. (2017). Exploring Google Earth Engine platform for big data processing: classification of multi-temporal satellite imagery for crop mapping. Front. Earth Sci. 5, 1–10. doi:10.3389/feart.2017.00017
Siikamäki, J., Sanchirico, J. N., and Jardine, S. L. (2012). Global economic potential for reducing carbon dioxide emissions from mangrove loss. Proc. Natl. Acad. Sci. U.S.A. 109 (36), 14369–14374. doi:10.1073/pnas.1200519109
Simard, M., Fatoyinbo, L., Smetanka, C., Rivera-Monroy, V. H., Castafieda-Moya, E., Thomas, N., et al. (2019). Mangrove canopy height globally related to precipitation, temperature and cyclone frequency. Nat. Geosci. 12, 40–45. doi:10.1038/s41561-018-0279-1
Thomas, N., Bunting, P., Lucas, R., Hardy, A., Rosenqvist, A., and Fatoyinbo, T. (2018). Mapping mangrove extent and change: a globally applicable approach. Remote Sens. 10, 1466. doi:10.3390/rs10091466
Thomas, N., Simard, M., Castañeda-Moya, E., Byrd, K., Windham-Myers, L., Bevington, A., et al. (2019). High-resolution mapping of biomass and distribution of marsh and forested wetlands in southeastern coastal Louisiana. Int. J. Appl. Earth Obs. Geoinf. 80, 257–267. doi:10.1016/j.jag.2019.03.013
Tian, S., Zhang, X., Tian, J., and Sun, Q. (2016). Random Forest classification of wetland land covers from multi-sensor data in the arid region of Xinjiang, China. Remote Sens. 8 (11), 954. doi:10.3390/rs8110954
Toosi, N. B., Soffianian, A. R., Fakheran, S., Pourmanafi, S., Ginzler, C., and Waser, L. T. (2019). Comparing different classification algorithms for monitoring mangrove cover changes in southern Iran. Glob. Ecol. Conserv. 19, e00662. doi:10.1016/j.gecco.2019.e00662
USGS (2016). West Africa: land use and land cover dynamics. Available at:https://eros.usgs.gov/westafrica/mangrove.
Walsh, G. M. (2015). New cropland and rural settlement maps of Africa. Available at: http://africasoils.net/2015/06/07/new-cropland-and-rural-settlement-maps-of-africa/.
Wan, L., Zhang, H., Lin, G., and Lin, H. (2018). A small-patched convolutional neural network for mangrove mapping at species level using high-resolution remote-sensing image. Annuals of GIS. 25 (1), 45–55. doi:10.1080/19475683.2018.1564791
Wang, L., Silvan-Cardenas, J. L., and Sousa, W., (2008). Neural network classification of mangrove species from multi-seasonal ikonos imagery. Photogramm. Eng. Remote Sens. 74 (7), 921–927. doi:10.14358/PERS.74.7.921
White, J. C., Coops, N. C., Wulder, M. A., Vastaranta, M., Hilker, T., and Tompalski, P. (2016). Remote sensing technologies for enhancing forest inventories: a review. Can. J. Remote Sens. 42, 5, 619–641. doi:10.1080/07038992.2016.1207484
Xiong, J., Thenkabail, P. S., Tilton, J. C., Gumma, M. K., Teluguntla, P., Oliphant, A., et al. (2017). Nominal 30-m cropland extent map of continental Africa by integrating pixel-based and object-based algorithms using Sentinel-2 and Landsat-8 data on Google Earth Engine. Remote Sens. 9 (10), 1065. doi:10.3390/rs9101065
Yuan, H., Wiele, C. F. V. D., and Khorram, S. (2009). An automated artificial neural network system for land use and land cover classification from Landsat TM imagery. Remote Sens. 1, 243–265. doi:10.3390/rs1030243
Zhan, X., Sohlberg, R. A., Townshend, J. R. G., DiMiceli, C., Carroll, M. L., Eastman, J. C., et al. (2002). Detection of land cover changes using MODIS 250 m data. Remote Sens. Environ. 83, 336–350. doi:10.1016/S0034-4257(02)00081-0
Zhang, C., Denka, S., Cooper, H., and Mishra, D. R. (2018). Quantification of sawgrass marsh aboveground biomass in the coastal Everglades using object-based ensemble analysis and Landsat data. Remote Sens. Environ. 204, 366–379. doi:10.1016/j.rse.2017.10.018
Zhang, C., and Xie, Z. (2014). Data fusion and classifier ensemble techniques for vegetation mapping in the coastal Everglades. Geocarto Int. 29 (3), 228–243. doi:10.1080/10106049.2012.756940
Zhang, X., Han, L., Han, L., and Zhu, L. (2020). How well do deep learning-based methods for land cover classification and object detection perform on high resolution remote sensing imagery? Remote Sens. 12, 417. doi:10.3390/rs12030417
Zhao, S., Liu, Y., Jiang, J., Cheng, W., Zhou, M., Li, M., et al. (2014). “Extraction of mangrove in Hainan Dongzhai Harbor based on CART decision tree,” in The 22nd International Conference on Geoinformatics, Kaohsiung, China, June 25–27, 2014.
Keywords: coastal environment, land cover and land use, mangrove forests, remote sensing, machine learning, high resolution, satellite big data, large scale
Citation: Liu X, Fatoyinbo TE, Thomas NM, Guan WW, Zhan Y, Mondal P, Lagomasino D, Simard M, Trettin CC, Deo R and Barenblitt A (2021) Large-Scale High-Resolution Coastal Mangrove Forests Mapping Across West Africa With Machine Learning Ensemble and Satellite Big Data. Front. Earth Sci. 8:560933. doi: 10.3389/feart.2020.560933
Received: 11 May 2020; Accepted: 07 December 2020;
Published: 21 January 2021.
Edited by:
Maged Marghany, Syiah Kuala University, IndonesiaReviewed by:
Dimitris Poursanidis, Foundation for Research and Technology Hellas (FORTH), GreeceYuichi S. Hayakawa, Hokkaido University, Japan
Copyright © 2021 Liu, Fatoyinbo, Thomas, Guan, Zhan, Mondal, Lagomasino, Simard, Trettin, Deo and Barenblitt. This is an open-access article distributed under the terms of the Creative Commons Attribution License (CC BY). The use, distribution or reproduction in other forums is permitted, provided the original author(s) and the copyright owner(s) are credited and that the original publication in this journal is cited, in accordance with accepted academic practice. No use, distribution or reproduction is permitted which does not comply with these terms.
*Correspondence: Xue Liu, xliu@fas.harvard.edu