 Jingwei Xu1,2*
 Nikolay V. Koldunov3*
 Min Xu4*Xiuhua Zhu5Klaus Fraedrich1,2Xi Jiang1Shoupeng Zhu1Xiefei Zhi1
- 1Key Laboratory of Meteorological Disaster, Ministry of Education (KLME)/Joint International Research Laboratory of Climate and Environment Change (ILCEC)/Collaborative Innovation Center on Forecast and Evaluation of Meteorological Disasters (CIC-FEMD)/Joint Center for Data Assimilation Research and Applications, Nanjing University of Information Sciences and Technology (NUIST), Nanjing, China
- 2Max Planck Institute for Meteorology, Hamburg, Germany
- 3Alfred Wegener Institute (AWI), Bremerhaven, Germany
- 4Meteorological Bureau of Jiangsu Province, Nanjing, China
- 5Center for Earth System Research and Sustainability, CliSAP, University of Hamburg, Hamburg, Germany
One of the main water vapor sources of eastern China is the Bay of Bengal, over which the circulation is influenced by the Tropical Indian Ocean Dipole (TIOD). The TIOD has a long-lasting effect on weather patterns, which in turn influence the rice yield and quality in eastern China, such as in Jiangsu Province. To identify the main mechanism involved, we perform a detailed investigation of the connections between the TIOD-like sea surface temperature (SST) and the climatic suitability for growing rice, and the subsequent rice yield anomalies, in Jiangsu Province. In particular, we compare the relationships, and identify the underlying mechanisms, of TIOD SST with suitable sunshine duration, temperature and precipitation during the period of rice culture in the province. Singular Value Decomposition (SVD) results show that the TIOD-like SST has a close correlation with the rice yield anomalies, with a temporal correlation coefficient of 0.43 for 53 years, passing the 99% significance level. Furthermore, in the negative TIOD-like SST years, the background circulation weakens the transport effect of the atmospheric river through which water vapor is transported from the Bay of Bengal to eastern China. This decreased amount of transported water vapor decreases the precipitation and total cloud cover in the province. In turn, this significantly increases the sunshine duration, which plays a key role in rice yield anomalies. The increased sunshine duration and higher temperatures lead to positive rice yield anomalies, and vice versa. Our findings highlight that climatic factors, such as TIOD-like SST, have a far-reaching influence on agricultural production (in this case, rice yield), and thus special attention should be paid to interdisciplinary research in the fields of climate and agriculture.
Introduction
Weather patterns during periods of crop culture have an influence on crop yield and quality. Climatic factors can tune these weather patterns and thus have a far-reaching effect on crop yield. The most consumed crop in southern China is rice (Xu et al., 2018). It was the first and most widely cultivated crop in Jiangsu Province, and over the past 30 years has had a relatively stable annual planting area of about 2.2 million hectares, accounting for 40% of the province’s grain area. Establishing a rice yield forecast method based on climatic factors is therefore critical for agricultural management, food security and food trade policy in this region.
Although rice shows notable adaptability to climate, specific climatic conditions are still required for successful ripening and to ensure a high quality product (Huang et al., 2018). The climate background also has a remarkable influence on agricultural yield (Lobell and Asner, 2003; Xu et al., 2018). There are many methods available to predict rice yields, including statistical meteorological models, rice growth models, and field sampling (Lai et al., 2009; Ju et al., 2010; Guo et al., 2017; Huang et al., 2017; Xu et al., 2018). Among these methods, studies have shown that statistical meteorological models based on climate indices can be effective at predicting crop yield (Lobell and Asner, 2003; Ju et al., 2010; Holzkämper et al., 2013; Iizumi et al., 2014; Yuan et al., 2014; Guo et al., 2017; Huang et al., 2017; Huang et al., 2018).
Recent studies have shown that the Indian monsoon shows strong correlation with the southern trough over the Bay of Bengal (Guan and Yamagata, 2003), which controls the amount of total precipitable water transported to eastern China. Greater total precipitable water transport from the Indian monsoon is usually associated with a weaker western Pacific subtropical high in the southwestern part of this subtropical high (Zhang, 2001), which leads to greater westerly wind anomalies instead of dominant southwesterly winds in the southwestern part of this subtropical high. These southwesterly winds would normally transport water vapor to eastern China. Thus, without them, conditions are unfavorable for the transport of water vapor into eastern China, therefore leading to less rainfall over the middle and lower reaches of the Yangtze River valley. Hence, there is a link between the Indian monsoon and weather patterns in eastern China. The Tropical Indian Ocean Dipole (TIOD), a climate index, can represent the circulation over the Indian Ocean, which can influence the transported water vapor and in particular have an effect on the western Pacific subtropical high. However, accounting for the weather patterns in a specific area (i.e., in Jiangsu Province) the target sea surface temperature (SST) area is the TIOD-like SST. The TIOD-like SST can indicate the circulation which affects the temperature and sunshine duration in Jiangsu Province, which are key factors for rice yield.
The extent of the far-reaching influence of the TIOD-like SST on agricultural industry in eastern China is still uncertain. Accordingly, the aim of this study is to clarify the relationship between the TIOD-like SST, climatic suitability and rice yield anomalies. In this paper, we suggest a mechanism by which the background circulation characterized by the climate index can tune the weather patterns, affect the crop-specific climatic suitability and, consequently, the rice yield response. Our approach can improve the ability to forecast rice yield evolution based on climate indices for a particular year or under a given climate scenario. Moreover, this approach can provide a scientific basis for shaping food security warning systems and food trade policy, as well as improve the management of rice cultivation.
To investigate the connection between the TIOD-like SST and rice yield anomalies, we focus on the following topics:
• Establishing whether the TIOD-like SST has a close connection with rice yield anomalies in Jiangsu Province;
• Describing the possible mechanism involved in the influence of the TIOD-like SST on the proposed variables that affect the climatic suitability; and
• Analyzing the link between the climatic suitability and the rice yield anomalies.
The rest of the paper is structured as follows: Data and Methods section describes the observational datasets, rice yield data, and the method used to calculate the climatic suitability. In Results section we describe the connection between the TIOD-like SST and the rice yield anomalies, the possible mechanism involved in the influence of the TIOD-like SST on the climatic suitability, and the link between the climatic suitability and rice yield anomalies. Discussion and conclusions are presented in Conclusion and Discussion section.
Data and Methods
Weather Observations and Rice Yield Data
We used a county-level rice yield dataset for the period 1961–2017 (from the Jiangsu Provincial Bureau of Statistics). The daily observations from 70 weather stations in Jiangsu Province, including 2-m air temperature, sunshine duration and precipitation, provided a high spatial and temporal resolution. These daily observations were used to calculate the daily suitability and then the monthly means, which were used to calculate the climatic suitability during the rice-growing period (June–October) from 1961 to 2017. We also used a dataset called the China Daily Gridded Precipitation dataset, version 5.1 (CN05.1; Wu and Gao, 2013; Xu et al., 2009), which has a spatial resolution of 0.25° × 0.25°.
We also collected data on rice-growth stages in Jiangsu for the 1984–2018 from 19 agrometeorological observation stations, which is the longest set of agrometeorological observation data available in Jiangsu. The observations include the start and end dates of each rice stage in every year: the seedling, regreening, tillering, jointing—boot, heading—flowering, and milking—maturity periods. These observations were used to determine the average rice-growth-stage dates and parameters in the suitability equations, which are the key factors for calculating the climatic suitability.
Reanalysis Data
In order to analyze the transported water vapor in the entire air column, we employed the water vapor flux and total Precipitable Water (PW). The water vapor flux data were from ERA-Interim: https://apps.ecmwf.int/datasets/data/interim-full-moda/levtype=sfc/. The PW data were taken from the NCEP/DOE AMIP-II Reanalysis (Reanalysis-2): http://www.cpc.ncep.noaa.gov/products/wesley/reanalysis2/. The Total Cloud Cover (TCC) was the vertical integral of high-cloud cover, medium-cloud cover and low-cloud cove. The SST is Hadley Center Global Sea Ice and Sea Surface Temperature (HadISST), (Rayner et al., 2003).
Calculation of Annual Rice Yield Anomalies
We followed the approach of Iizumi et al. (2014) to calculate the annual rice yield anomalies. For a given year, t, and county, c, the percentage yield anomaly deviating from a normal yield,
where Yt,c denotes the real yield. The calculation of the percentage yield anomaly emphasizes the yield changes caused by short-term, primarily climate-related factors, although demand, prices, technology and other factors may also affect year-to-year variations. Due to the 5-year running window, the first 2 years (1961 and 1962) and last 2 years (2016 and 2017) were not calculated. The values of the percentage yield anomalies are likely to be sensitive to the methods used to calculate normal yield. Among the methods for calculating normal yields (e.g., Kucharik and Ramankutty, 2005; Xu et al., 2018), we used the 5-year running mean method because of its simplicity. Although the yield anomalies are sensitive to the number of years used to calculate normal yield, the results based on different calculation methods are similar.
Precipitation Anomaly Percentage
The precipitation anomaly percentage is calculated as follows:
Climatic Suitability Based on Temperature
Previous studies (Geerts et al., 2006; Läderach et al., 2013; Fraga et al., 2016) have shown that climatic suitability has a close relationship with crop yield. Identification of climatic suitability is therefore an effective way to predict crop yields in a particular year or under a specific climate scenario (Teixeira et al., 2013). Most studies analyze three types of climatic suitability, based on temperature, sunshine duration and precipitation.
Fuzzy mathematics is applied to calculate the temperature response of rice (Cutforth and Shaykewich, 1990). The β-function can reasonably well reflect the nonlinear relationship between crop growth and temperature. The effect of temperature on rice differs above and below the optimum temperature range. The temperature suitability
The parameters in this formula vary in different rice-growth periods based on agrometeorological observations, where B is the temperature-dependent factor,
Many studies (e.g., Zhao et al., 2003; Lai et al., 2009) have shown that, during the growth process, the daily sunshine duration (Shaw, 1964) has a critical value of 70% of the required sunshine duration. When the sunshine duration exceeds this critical value, the response of the crop to sunlight reaches a suitable state, and the suitability value is one when the crop then reaches a suitable state for its growth; otherwise, the sunshine duration suitability rises with the increasing number of hours of sunshine. The suitability based on sunshine duration
As the temperature suitability, the parameters S and S0 are also obtained from the 30 years of agrometeorological observations in Jiangsu, where S is sunshine duration in hours, S0 is 70% of the required sunshine duration, which varies with the rice growth stage, and b is an empirical parameter that also varies with the growth stage.
Precipitation is the main source of water and soil moisture for the crop. The degree of rice suitability regarding precipitation is characterized by the ratio of incoming and required water (Doll, 1967). Incoming water is mainly provided by natural precipitation and artificial irrigation. Expenditure of plant water is mainly due to the evapotranspiration during the crop’s own physiological and ecological processes. The crop suitability based on precipitation Sp, without considering artificial irrigation, is calculated as (Xu et al., 2018):
As with the temperature and sunshine duration, the parameter P0 is based on the agrometeorological observations during the period of rice culture. Where this suitability is based on 10 days of precipitation, P0 is the 10-days physiological water requirement of the crop (unit: mm) and P is the actual 10-days precipitation (unit: mm). It is worth noting that when precipitation is excessive, it will harm the crop. So, in water vapor–enhanced years, the precipitation suitability sometimes decreases.
In a relatively recent review paper, Holzkämper et al. (2013) commented that there have not been many international publications on the topic of climatic suitability, for the key parameters are based on local agrometeorological field observations. The rice growth conditions depend on the local climate conditions and rice type. The climatic suitability estimates are obtained through field experiments and control experiments, but many of the publications relevant to the climate suitability for rice are not often available in English. Although Eqs 2–4 came from the Chinese literature, climatic suitability is a relatively common methodology for cultivation yield research. There have, for example, been relationships reported between corn yield variance and temperature and precipitation in North America (Lobell and Asner, 2003; Almaraz et al., 2008).
Improvement in Climatic Suitability Model Parameters
Based on the rice growth period in Jiangsu Province (Lai et al., 2009; Xu et al., 2018), we observed the key parameters for the climatic suitability model during the different stages of growth, which were determined by in-situ observation (Table 1). The crop growth and development parameters and meteorological indicators have been fixed for each growth stage of rice. Therefore, there is a “jump” between two successive stages. In reality, the meteorological conditions over the rice growth areas are continuous. To solve this “jumping” issue, data corresponding to the rice growth and development stages (Table 1) were obtained for the most recent 30 years. Then, using polynomial fitting, the temperature parameters and parameter b were fitted to the day of the rice growth in stages from in-situ observation (X). Finally, a continuous curve was established, with which the daily optimum temperature and the temperature range in which the rice can grow were calculated. The polynomial fitting equations are as follows:
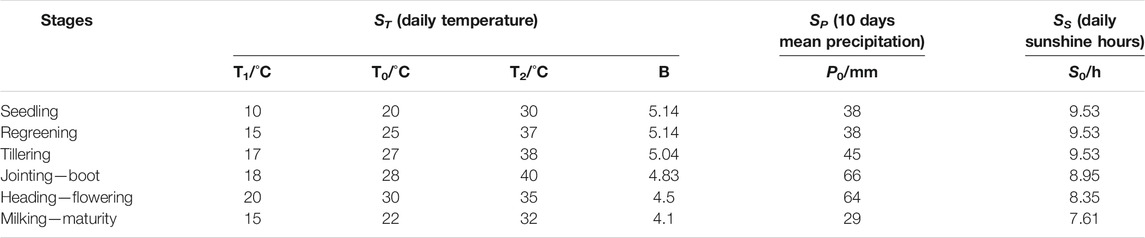
TABLE 1. Parameters used to determine the suitability of climatic variables, ST, SS, and SP, during rice growth and development stages, determined by the 19 longest agrometeorological observation datasets available in Jiangsu.
Other Methods
In this paper, most variables and observations have been calculated based on the corresponding climate mean and standard deviation for the period 1963–2015. The relative bias denotes the yearly deviation from the climate mean divided by the standard deviation. This normalized bias indicates not only the sign of the anomaly but also how far the value is from the climate state.
To acquire the possible connections between the climate background and the annual rice yield anomalies, the Singular Value Decomposition (SVD) method (Bretherton et al., 1992) is employed. In addition, the climatic suitability, estimated from weather-station daily observations and agrometeorological observation data, is calculated to quantify the cumulative effects of the climate conditions.
Results
Relationship Between the TIOD-Like SST and Rice Yield Anomalies
In order to obtain the connection between rice yield and the SST in the Indian Ocean, the statistical method of SVD (Bretherton et al., 1992) was employed, which is a powerful method for identifying the dominant coupling modes between two data fields. The leading SVD mode shows the heterogeneous pattern maps, which are the amplitude of variation from SST and rice yield anomalies (Figure 1a, b). The time series of the first leading mode (SVD1) shows the temporal evolution of the amplitude and polarity of the characteristic patterns, which indicates that SVD1 describes 70.97% of the variability in total anomalies. This time series of SVD1 illustrates that the SST pattern has a strong temporal relationship with the rice yield anomaly pattern, with a temporal correlation coefficient (TCC) of 0.43, passing the 99% significance level, for the 53-years sample. The TIOD index is defined based on the SST anomaly difference between the western (10°S–10°N, 50–70°E) and southeastern (10°S to the equator, 90–110°E) regions. For the tropical Indian Ocean SST, it is a TIOD-like SST pattern, which shows the key SST areas are in the 30–15°S, in the south of the traditional TIOD SST regions. The rice yield anomaly pattern shows a jigsaw-like distribution, which has been documented in many previous studies (Ju et al., 2010; Guo et al., 2017; Huang et al., 2017; Xu et al., 2018).
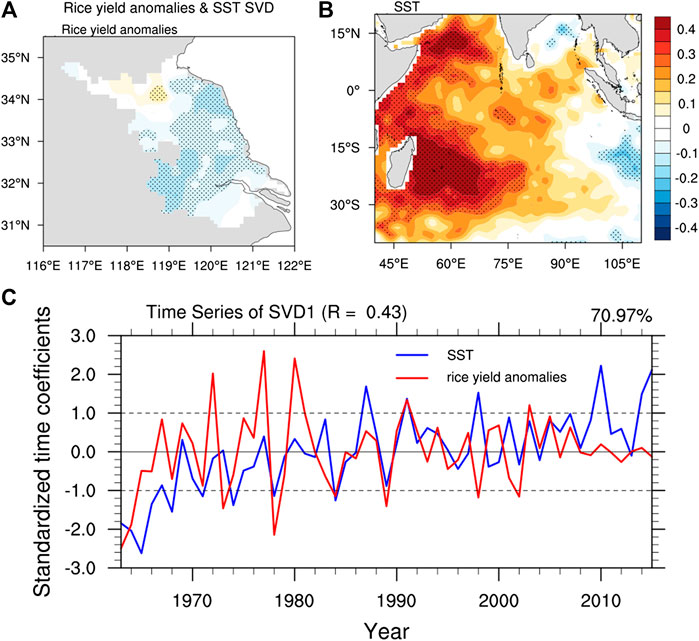
FIGURE 1. The first leading SVD modes for (A) the rice yield anomaly pattern, (B) the TIOD-like SST pattern, and (C) the expanded time coefficients. The temporal correlation coefficient of rice yield anomalies (red line) and TIOD-like SST (blue line) is 0.43, which is significant at the 0.01% confidence level based on the two-tailed t-test. The first leading SVD describes 70.97% of the variability.
To ensure that the obtained SVD patterns are not spurious results, we also performed EOF analysis separately for the two fields, which display the leading EOF structures (not shown here), and are very similar to the leading SVD structures. Considering the relative levels of rice cultivation in Jiangsu Province (Figure 2), special attention should be paid to central and southern Jiangsu, since more rice is planted there. This means these areas have a greater weight in the total Jiangsu rice yield anomaly.
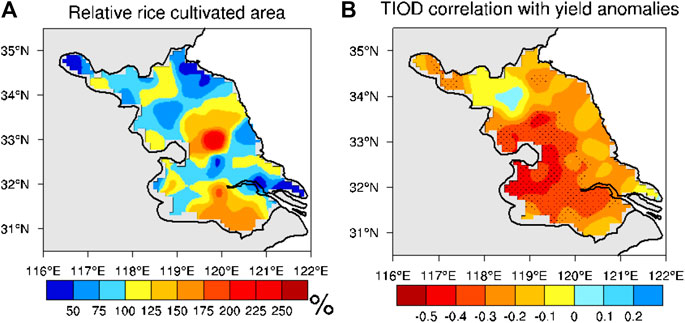
FIGURE 2. Relative rice cultivation areas (A) and the temporal correlation of the TIOD and rice yield anomalies (B). Similar to the relative bias, the value is calculated by the actual area minus the Jiangsu mean of 70 county-level-based rice cultivation areas, and then divided by the standard deviation of the 70 county-level-based rice cultivation areas, as explained in Improvement in Climatic Suitability Model Parameters section. Dotted areas in (B) are statistically significant at the 95% confidence level in the period 1963–2015.
The Indian monsoon affects rainfall in the middle and lower reaches of the Yangtze River valley (Zhang, 2001), such as Jiangsu Province, via modulation of transported water vapor. Atmospheric circulation can affect the rice yield by influencing rainfall, duration of sunlight hours, and temperature (Figure 3) (Lai et al., 2009; Huang et al., 2017; Huang et al., 2018; Xu et al., 2018). We found that the TIOD-like SST has a close relationship with rice yield anomalies, with a TCC of 0.43 in 1963–2015, especially in the periods 1970–1990 and 2002–2012 (Figure 1C). This TCC is greater than the TCC of a single suitability with rice anomalies. Furthermore, lots of extreme TIOD-like SST events coincide with the rice yield anomalies.
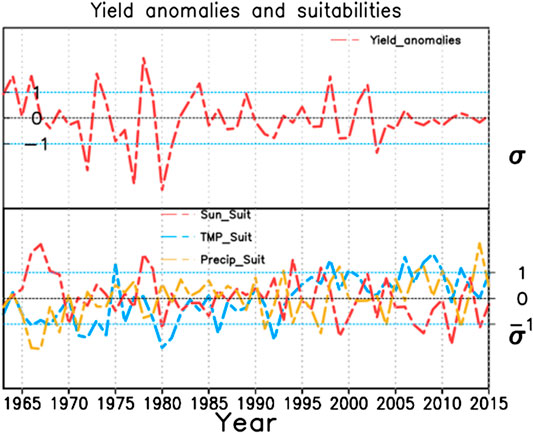
FIGURE 3. Time series of yield anomalies (upper panel, red line), and the climatic variables ST (lower panel, blue line), SS (lower panel, red line) and SP (lower panel, yellow line).
Possible Mechanism of Impact of the TIOD-Like SST With the Proposed Variables of Climatic Suitability
To study the possible mechanisms through which the positive TIOD-like SST anomalies lead to negative sunshine duration, we analyze the total PW for the entire atmosphere during the extreme high or low TIOD-like SST years (Figure 4). Because reliable reanalysis circulation data are only available for the period after 1979, the composited circulation in the five extremely positive TIOD-like SST years (1987, 1998, 2010, 2014, and 2015) and the five extremely negative TIOD-like SST years (1984, 1989, 1996, 1999, and 2002) are studied. A high positive relationship with the transported water vapor means that, during the positive TIOD-like SST years, the transported water vapor usually increases in Jiangsu Province and vice versa, which passed the 95% level of statistical significance (Figure 4).
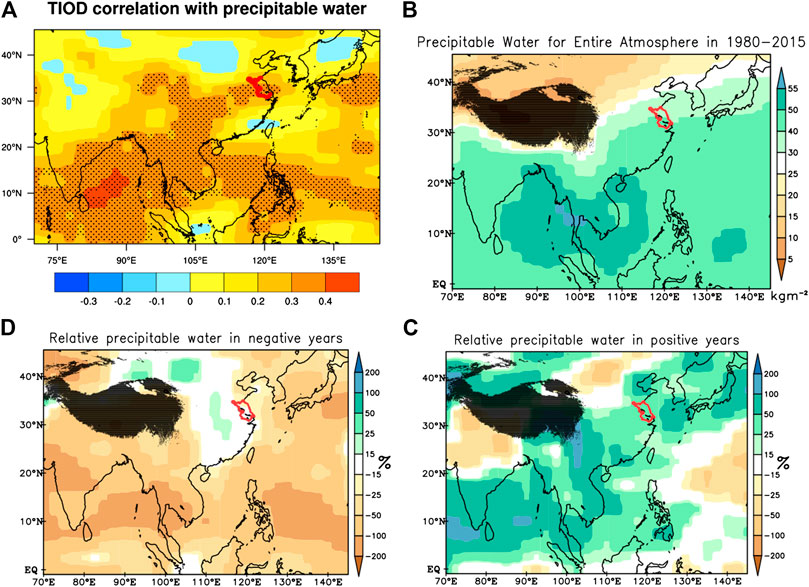
FIGURE 4. Correlation of TIOD with the amount of precipitable water for the entire atmosphere (A) during the rice-growing period (June–October). Dotted areas passed the two-tailed t-test at the 95% level of statistical significance. (B) The mean precipitable water for the entire atmosphere in 1980–2015, (C) precipitable water for the entire atmosphere in positive TIOD years, and (D) precipitable water for the entire atmosphere in negative TIOD years. Black shading indicates regions with an elevation exceeding 3,000 m above sea level.
One of the main sources of total PW transport over eastern China is the southwesterly winds from the Bay of Bengal (Xu et al., 2019b). In positive TIOD years (Figure 5), the TIOD has a positive connection with the amount of water vapor transported to China via the Bay of Bengal (Guan and Yamagata, 2003; Xu et al., 2019a). When the TIOD is in its positive phase, the total PW is increased almost 50% compared with the standard deviation in the same grid box, which causes an increase in the transported water vapor convergence, TCC, and extremely low sunshine duration (Figure 6). Under this weather situation, sunshine duration is reduced over Jiangsu Province. Meanwhile, the precipitation in the rice-growth period is usually excessive in water vapor–enhanced years, which leads to a low precipitation suitability. Therefore, it is not as strong as that with sunshine duration (Figure 6). The sunshine duration suitability and precipitation anomaly appear in almost all extreme rice yield years. The spatial correlation coefficient of the sunshine duration suitability pattern and the SVD1 rice yield anomaly pattern is 0.71 in positive TIOD-like SST years and −0.63 in negative TIOD-like SST years, whereas the other two spatial correlation coefficients of suitability are around 0.3.
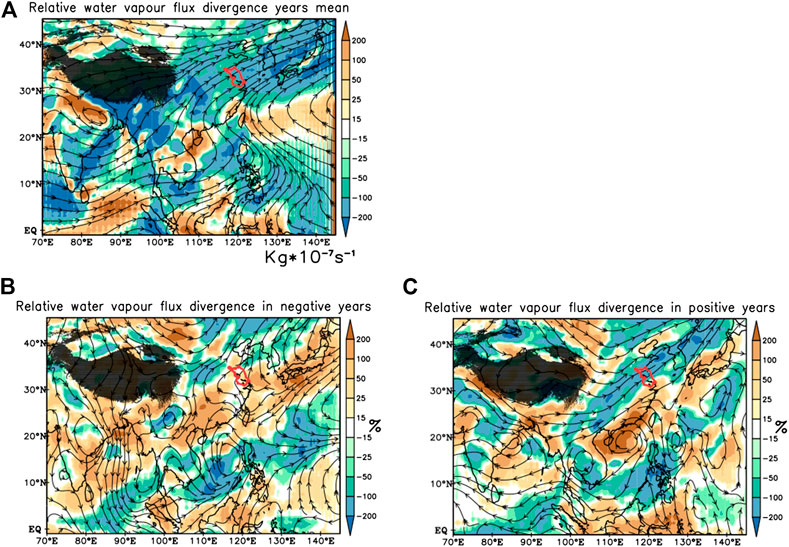
FIGURE 5. (A) Mean water vapor flux divergence in 1963–2015, (B) the relative bias of water vapor flux divergence in positive TIOD-like SST years, and (C) negative TIOD-like SST years. Colors indicate the water vapor flux divergence; vectors indicate the water vapor flux.
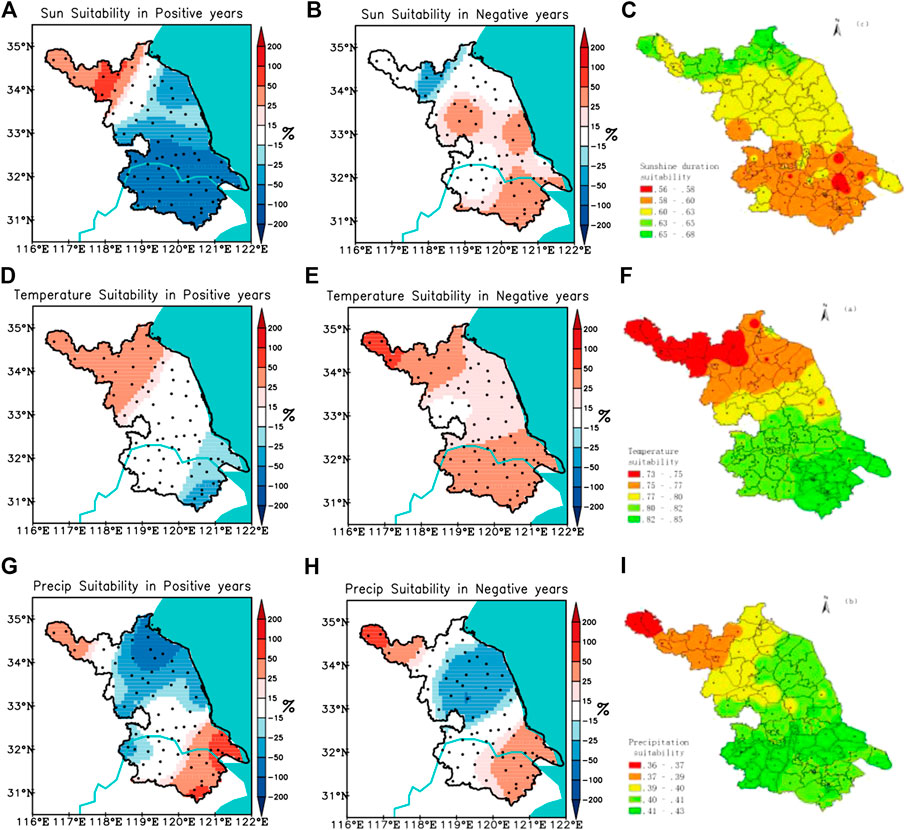
FIGURE 6. (A) Relative bias of sunshine duration suitability in positive TIOD-like SST years, (B) negative TIOD-like SST and (C) mean sunshine duration suitability in June–October in 1963–2015 . Panels (D–F) are the same as (A–C) but for temperature suitability. Panels (G–I) are the same as (A–C) but for precipitation suitability. The Yangtze River is shown as a blue line and the blue shaded area indicates the sea. Black points indicate the weather observation stations. The sunshine duration suitability pattern has a close relationship with the SVD1 rice yield anomaly pattern, with a spatial correlation coefficient of 0.71 in positive TIOD-like SST years and −0.63 in negative TIOD-like SST years.
However, during the negative TIOD-like SST years, the enhanced water vapor flux path disappears in the background circulation in positive TIOD years (Figure 5). In these years, relatively dry conditions are shown over the vast area of central and eastern China; the total PW is decreased by about 50% compared with the standard deviation in the grid box, indicating a connection between the TIOD-like SST and precipitation in the lower reaches of the Yangtze River (Zhang, 2001). In these dry conditions, there is relatively less water vapor convergence and precipitation. This reduction in water vapor convergence and TCC lead to an increase in sunshine duration—a key factor in increasing rice yields.
As mentioned above, the TIOD-like SST has a high TCC with sunshine duration and yield anomalies. The TIOD-like SST can indicate the background circulation by itself. In TIOD-like SST negative years, the circulation over Southwest China blocks the transported vertical integral of water vapor from the Bay of Bengal to East China (Guan and Yamagata, 2003). Relatively dry conditions are shown throughout the vast area of China. In these dry conditions, there is probably a low water vapor convergence, TCC, and usually less precipitation. These reductions in TCC and precipitation, however, lead to increases in sunshine duration and sometimes temperature—key factors that improve rice yields. In positive phases of the TIOD, the circulation over Southwest China is suitable for water vapor transport to Jiangsu Province, which causes a greater water vapor convergence, TCC and precipitation, and reduced sunshine duration. The precipitation in Jiangsu is usually exceeds the upper limit of water requirement of rice, leading to a lower precipitation suitability in TIOD-like SST positive years, and the precipitation suitability is nonlinear with the TIOD-like SST.
Connection Between Rice Yield Anomalies and Variables of Climatic Suitability
To explore the cumulative effect of the climate on annual rice yields, we calculated the variables contributing to climatic suitability throughout the rice growth period for the extreme yield anomaly years, based on daily observations (Table 2). The correlation coefficients of temperature, sunshine and precipitation suitability to relative meteorological yield during the whole growing period of rice from 1961 to 2014, were 0.12, 0.36, and −0.30, respectively (Xu et al., 2018), which is less than the TCC from the TIOD-like SST with rice yield anomalies.
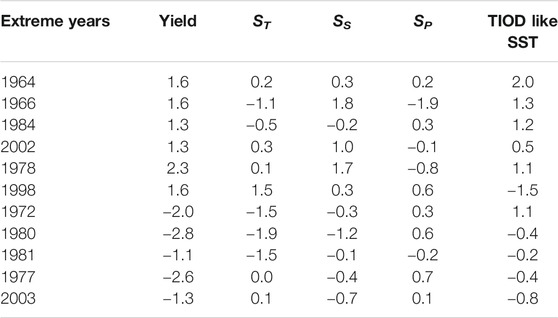
TABLE 2. Relative bias of ST, SS, SP and TIOD-like SST from SVD1 during the lifetime of rice (June–October) in the years of extreme rice yield anomalies.
The sunshine duration suitability pattern has a close relationship with the SVD1 rice yield anomaly pattern, with a spatial correlation coefficient of 0.71 in positive TIOD-like SST years and −0.63 in negative TIOD-like SST years. The spatial correlation coefficient for the temperature suitability pattern is about 0.44 in positive and negative TIOD-like SST years, while for the precipitation suitability pattern it is 0.12 and 0.31 in positive and negative TIOD-like SST years, respectively.
Comparing the three main contributors to climatic suitability in the extremely high rice yield anomaly years, sunshine duration matches the major part of them (Figure 6). The extreme sunshine duration suitability events coincide with the greatest rice yield anomalies in Jiangsu Province. Since rice cultivation in Jiangsu Province can use water from other resources, including the Yangtze River, the Huaihe River and even underground water, precipitation is not the only water supply; hence, farm irrigation can reduce the potential damage caused by low rainfall (Xu et al., 2018). For extreme heavy precipitation events, only when the precipitation anomaly exceeds 40% in July can it affect rice yield, which is statistically significant at the 90% confidence level (Figure 7). Except in some extreme dry years, the irrigation condition is sufficient for rice cultivation (Xu et al., 2018). Rice yield does not show any great connection with temperature suitability, with a temporal correlation coefficient of 0.12. Among the historical rice-crop disasters in Jiangsu Province between 1949 and 2019, damage was caused by temperature only twice—in the extreme high temperature years of 2003 and 2013 (Huang et al., 2018).
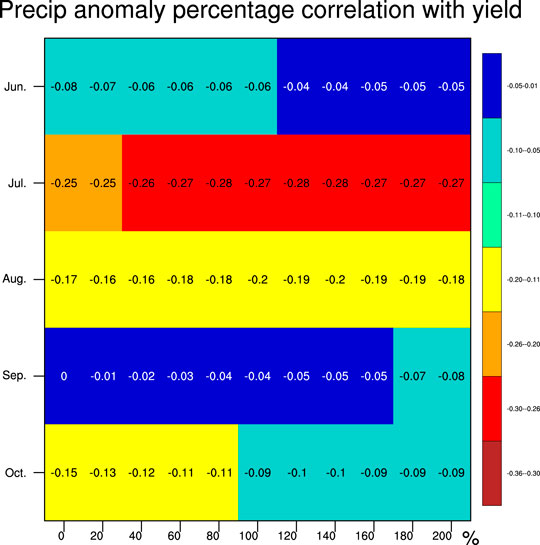
FIGURE 7. The yearly precipitation anomaly percentage in June–October, respectively, with yearly rice yield anomalies. Red boxes are statistically significant at the 90% confidence level.
Conclusion and Discussion
The Indian monsoon and East Asian summer monsoon are relatively isolated systems, although recent findings have demonstrated that the Indian monsoon influences rainfall over the middle and lower reaches of the Yangtze River valley, such as in Jiangsu Province in eastern China, via its control over the transport of water vapor (Zhang, 2001). In this work, we identified the main connections between the TIOD-like SST and rice yield anomalies in Jiangsu Province. The results show that background circulation anomalies, indicated by the TIOD-like SST, can directly lead to anomalies in transported water vapor over Jiangsu Province. Precipitable water and water vapor flux convergence cause TCC anomalies that lead to sunshine duration and temperature anomalies. Sunshine duration—the variable that is least influenced by human activity in rice cultivation—plays a major part in rice yield anomalies. Although we identify the main mechanism connecting the TIOD-like SST with rice yield anomalies in Jiangsu Province, further detailed simulations with a rice yield model are needed to identify the magnitude of the effect of certain climate indices. Our results can be summarized as follows:
(1) The time series of SVD1 describes 70.97% of the variability in total variations. The time series of SVD1 illustrates the SST pattern has a strong temporal relationship with the rice yield anomaly pattern, with a temporal correlation coefficient of 0.43, passing the 99% significance level, for the 53-years sample.
(2) The transport of total PW over eastern China can be blocked or enhanced by the circulation in Southwest China, accompanied by TIOD-like SST anomalies (Xu et al., 2019b). On the one hand, in the negative phase of the TIOD, the circulation over Southwest China blocks the transported water vapor and leads to relatively dry conditions over the vast area of eastern China. Under these dry conditions, there is probably a low water vapor flux convergence, TCC, and usually less precipitation. These conditions can lead to increased sunshine duration, which is a key factor in increasing rice yields. On the other hand, in the positive phase of the TIOD-like SST, the circulation over Southwest China is suitable for the transport of water vapor over Jiangsu Province, which causes an increased water vapor convergence, TCC, and precipitation. In turn, this significantly decreases the sunshine duration. Therefore, usually, the negative TIOD-like SST accompanies positive sunshine duration and positive rice yield anomalies, and vice versa.
(3) In Jiangsu Province, the most important variable for climatic suitability is sunshine duration. It was found to be a factor in most years that recorded rice yield anomalies, with the greatest spatial correlation coefficients of 0.71 and −0.63, for positive and negative TIOD like years, respectively, with the SVD1 rice anomaly pattern among the three suitabilities. This is because precipitation is not the only water supply for rice cultivation in Jiangsu Province. Moreover, rice can also survive under a wide range of temperatures. It is therefore worth noting that sunshine duration plays a key role in rice yield anomalies in Jiangsu Province.
To sustain a clear focus in this study, we have mainly discussed the impact and mechanism of the TIOD-like SST on rice yield anomalies in Jiangsu Province. The climatic suitability based on observations is so far the closest approach to the actual growth of rice. Since 2010, this climatic suitability method has been used to characterize the quantitative impacts of sunshine, temperature and rainfall on crops growth in Jiangsu Meteorological Bureau. The operational agrometeorological services during these years prove that the climatic suitability method is an effective method to describe the accumulate effect of weather on crops. Nonetheless, irrigation data are not available for every cultivation area in Jiangsu Province. The effect of irrigation on rice yield is thus far still uncertain. Other climatic factors, such as the western Pacific subtropical high, different rice varieties, and human activity (e.g., irrigation or agriculture policy), all have an impact on climatic suitability and rice yield anomalies. The climate has cumulative influences on the various stages of rice growth and development. The primary focus of this work has been the connection between the TIOD-like SST, sunshine duration and rice yield anomalies. This study emphasizes again the connection between the TIOD-like SST and eastern China, which has a far-reaching influence on agricultural industry. Special attention should be paid to climatic circulation and its influence on crop yield. Future work should investigate the relationship between climate factors and climatic suitability for the other major crops in the region (e.g., wheat, maize and soybean).
Data Availability Statement
The datasets generated for this study are available on request to the corresponding author.
Author Contributions
JX initiated and coordinated the work. JX and MX provided the calculation and analysis of rice yield anomalies. JX, NK, and MX wrote the manuscript. XZ, KF, and XJ gave valuable suggestions for revisions. SZ and XZ revised the basic flow anomalies analysis.
Funding
This work was jointly supported by a project entitled “Relationships between glacier changes and atmospheric circulation in High Mountain Asia,” supported by the National Natural Science Foundation of China (Grant Nos. 41871053, 41371095, and 91337218), the China Special Fund for Meteorological Research in the Public Interest (Grant No. GYHY 201406008), project S1 (Diagnosis and Metrics in Climate Models) of the Collaborative Research Centre TRR 181 Energy Transfer in Atmosphere and Ocean program funded by the German Research Foundation (project 274762653). This study was also funded by “the Priority Academic Program Development of Jiangsu Higher Education Institutions” (PAPD).
Conflict of Interest
The authors declare that the research was conducted in the absence of any commercial or financial relationships that could be construed as a potential conflict of interest.
Acknowledgments
We thank reviewers for comments and suggestions that helped to improve the manuscript. Also, we thank the ECMWF NCEP and CMA for providing the gridded data. We also thank the Jiangsu Provincial Bureau of Statistics for providing the rice yield data.
References
Almaraz, J. J., Mabood, F., Zhou, X., Gregorich, E. G., and Smith, D. L. (2008). Weather variability and corn yield at a higher latitude locale: south‐western Quebec. Clim. Change. 88 (2), 187–197. doi:10.1007/s10584-008-9408-y
Bretherton, C. S., Smith, C., and Wallace, J. M. (1992). An intercomparison of methods for finding coupled patterns in climate data. J. Clim. 5, 541–560. doi:10.1175/1520-0442(1992)005<0541:AIOMFF>2.0.CO;2
Cutforth, H. W., and Shaykewich, C. F. (1990). A temperature response function for corn development. Agric. For. Meteorol. 50, 159–171. doi:10.1016/0168-1923(90)90051-7
Doll, J. P. (1967). An analytical technique for estimating weather indexes from meteorological measurements. J. Farm Econ. 49, 79–88. doi:10.2307/1237069
Fraga, H., Santos, J. A., Malheiro, A. C., Oliveira, A. A., Moutinho‐Pereira, J., and Jones, G. V. (2016). Climatic suitability of portuguese grapevine varieties and climate change adaptation. Int. J. Climatol. 36, 1–12. doi:10.1002/joc.4325
Geerts, S., Raes, D., Garcia, M., Del Castillo, C., and Buytaert, W. (2006). Agro-climatic suitability mapping for crop production in the Bolivian Altiplano: a case study for quinoa. Agric. For. Meteorol. 139, 399–412. doi:10.1016/j.agrformet.2006.08.018
Guan, Z., and Yamagata, T. (2003). The unusual summer of 1994 in East Asia: IOD teleconnections. Geophys. Res. Lett. 30, 1544. doi:10.1029/2002GL016831
Guo, J., Hu, X., Gao, L., Xie, K., Ling, N., Shen, Q., et al. (2017). The rice production practices of high yield and high nitrogen use efficiency in Jiangsu, China. Sci. Rep. 7, 2101. doi:10.1038/s41598-017-02338-3
Holzkämper, A., Calanca, P., and Fuhrer, J. (2013). Identifying climatic limitations to grain maize yield potentials using a suitability evaluation approach. Agric. For. Meteorol. 168, 149–159. doi:10.1016/j.agrformet.2012.09.004
Huang, J., Islam, A. R. M. T., Zhang, F., and Hu, Z. (2017). Spatiotemporal analysis the precipitation extremes affecting rice yield in Jiangsu province, southeast China. Int. J. Biometeorol. 61, 1863–1872. doi:10.1007/s00484-017-1372-7
Huang, J., Zhang, F., Zhou, L., Hu, Z., and Li, Y. (2018). Regional changes of climate extremes and its effect on rice yield in Jiangsu province, southeast China. Environ. Earth Sci. 77, 106. doi:10.1007/s12665-018-7295-8
Iizumi, T., Luo, J., Challinor, A. J., Sakurai, G., Yokozawa, M., Sakuma, H., et al. (2014). Impacts of el niño southern oscillation on the global yields of major crops. Nat. Commun. 5, 3712. doi:10.1038/ncomms4712
Ju, W., Gao, P., Zhou, Y., Chen, J. M., Chen, S., and Li, X. (2010). Prediction of summer grain crop yield with a process-based ecosystem model and remote sensing data for the northern area of the Jiangsu Province, China. Int. J. Rem. Sens. 31, 1573–1587. doi:10.1080/01431160903475357
Kucharik, C. J., and Ramankutty, N. (2005). Trends and variability in US corn yields over the twentieth century. Earth Interact. 9, 1–29. doi:10.1175/EI098.1
Läderach, P., Martinez-Valle, A., Schroth, G., and Castro, N. (2013). Predicting the future climatic suitability for cocoa farming of the world’s leading producer countries, Ghana and Côte d’Ivoire. Clim. Change. 119, 841–854. doi:10.1007/s10584-013-0774-8
Lai, C., Qian, H., Duan, H., and Song, Q. (2009). Climate suitabiltiy and its change trend of double cropping rice in Huaihe River Basin. Chin. J. Ecol. 28, 2339–2346. doi:10.13292/j.1000-4890.2009.0382 [in Chinese].
Lobell, D. B., and Asner, G. P. (2003). Climate and management contributions to recent trends in U.S. agricultural yields. Science 299, 1032. doi:10.1126/science.1077838
Oury, B. (1965). Allowing for weather in crop production model building. Am. J. Agric. Econ. 47, 270–283. doi:10.2307/1236574
Rayner, N. A., Parker, D. E., Horton, E. B., Folland, C. K., Alexander, L. V., Rowell, D. P., et al. (2003). Global analyses of sea surface temperature, sea ice, and night marine air temperature since the late nineteenth century. J. Geophys. Res. Atmos 108, 4407. doi:10.1029/2002JD002670
Shaw, L. H. (1964). The effect of weather on agricultural output: a look at methodology. Am. J. Agric. Econ. 46, 218–230. doi:10.2307/1236485
Teixeira, E. I., Fischer, G., Van Velthuizen, H., Walter, C., and Ewert, F. (2013). Global hot-spots of heat stress on agricultural crops due to climate change. Agric. For. Meteorol. 170, 206–215. doi:10.1016/j.agrformet.2011.09.002
Wu, J., and Gao, X. (2013). A gridded daily observation dataset over China region and comparison with the other datasets. Chin. J. Geophys. 56, 1102–1111.
Xu, J., Koldunov, N., Remedio, A. R. C., Sein, D. V., Zhi, X., Jiang, X., et al. (2019a). On the role of horizontal resolution over the Tibetan Plateau in the REMO regional climate model. Clim. Dynam. 51, 4525–4542. doi:10.1007/s00382-018-4085-7
Xu, J., Koldunov, N. V., Remedio, A. R. C., Sein, D. V., Rechid, D., Zhi, X., et al. (2019b). Downstream effect of Hengduan Mountains on East China in the REMO regional climate model. Theor. Appl. Climatol. 135, 1641–1658. doi:10.1007/s00704-018-2721-0
Xu, M., Wu, H., Zhang, P., Gao, P., and Xu, J. (2018). Long-term prediction method of rice annual agricultural climate status in Jiangsu Province based on climatic suitability. Meteorol. Mon. 44, 1220–1227. doi:10.7519/j.issn.1000-0526.2018.09.008 [in Chinese].
Xu, Y., Gao, X., Shen, Y., Xu, C., Shi, Y., and Giorgi, F. (2009). A daily temperature dataset over China and its application in validating a RCM simulation. Adv. Atmos. Sci. 26, 763–772.
Yuan, L., Yang, X., Wang, E., and Xue, C. (2014). Climate and crop yields impacted by ENSO episodes on the North China Plain: 1956–2006. Reg. Environ. Change. 14, 49–59. doi:10.1007/s10113-013-0455-1
Zhang, R. (2001). Relations of water vapor transport from Indian monsoon with that over East Asia and the summer rainfall in China. Adv. Atmos. Sci. 18, 1005–1017. doi:10.1007/BF03403519
Keywords: rice yield anomalies, climatic suitability, East Asian summer monsoon, Jangsu, Indian ocean dipole, sea surfce temperature
Citation: Xu J, Koldunov NV, Xu M, Zhu X, Fraedrich K, Jiang X, Zhu S and Zhi X (2021) Impacts of Indian Ocean Dipole–Like SST on Rice Yield Anomalies in Jiangsu Province. Front. Earth Sci. 8:568365. doi: 10.3389/feart.2020.568365
Received: 01 June 2020; Accepted: 10 December 2020;
Published: 10 March 2021.
Edited by:
Kyung-Ja Ha, Pusan National University, South KoreaReviewed by:
Bijoy Vengasseril Thampi, Science Systems and Applications, Inc., United StatesRenguang Wu, Zhejiang University, China
Copyright © 2021 Xu, Koldunov, Xu, Zhu, Fraedrich, Jiang, Zhu and Zhi. This is an open-access article distributed under the terms of the Creative Commons Attribution License (CC BY). The use, distribution or reproduction in other forums is permitted, provided the original author(s) and the copyright owner(s) are credited and that the original publication in this journal is cited, in accordance with accepted academic practice. No use, distribution or reproduction is permitted which does not comply with these terms.
*Correspondence: Jingwei Xu, eHVfJiN4MDIwMDk7andAc2luYS5jbg==; Nikolay V. Koldunov, a29sZHVub3ZuQGdtYWlsLmNvbQ==; Min Xu, YW1pbjA1MDZAMTYzLmNvbQ==