An Attempt to Recover a Paleomonsoon Signal in the Chinese Loess Plateau Using Anisotropy of Magnetic Susceptibility
 Feng Xian
 Rui Zhang
- 1State Key Laboratory of Loess and Quaternary Geology, Institute of Earth Environment, Chinese Academy of Sciences, X’ian, China
- 2CAS Center for Excellence in Quaternary Science and Global Change, Chinese Academy of Sciences, X’ian, China
- 3Shaanxi Key Laboratory of Accelerator Mass Spectrometry and Application, Xi’an AMS Center, Xi’an, China
- 4Institute of Cenozoic Geology and Environment, State Key Laboratory of Continental Dynamics, Department of Geology, Northwest University, Xi’an, China
The paleowind direction in the Chinese Loess Plateau (CLP) was studied using anisotropy of magnetic susceptibility (AMS) data. Magnetic fabrics were examined for the last glacial loess (L1) and last inter-glacial paleosol (S1) in the southern and central CLP along a present day precipitation zone of 600 mm per year. Statistical analyses of AMS ellipsoid orientations indicate that strong rainwater events may cause random distributions in the maximum axis of the AMS azimuth, but with no deviation in the vertical plane for the average minimum axis. As high rainfall can distort paleowind determinations, it is challenging to conduct paleowind studies on the southern CLP - a topography with high precipitation density.
Introduction
The Chinese Loess Plateau (CLP) has the best preserved and most continuous sequence of eolian deposits in the world (Liu, 1985) (Figure 1). A number of studies of Chinese loess have established reliable chronologies, described their pedogenesis, and examined relationships to the uplift of the Tibetan Plateau (e.g., Ding et al., 1994; Porter and An, 1995). Dust flux and grain size have been shown to reflect winter monsoon intensity; and a variety of chemical indicators, as well as magnetic susceptibility, have been shown to be related to weathering and summer monsoon intensity. Such studies have revealed variations in the ancient monsoon in northern China since at least 8 Ma (An et al., 2001; An, 2014). Previous research on climate change in the CLP has focused on monsoon intensity and mechanisms of cyclical climate change (Ding et al., 1994). However, methods of determining paleowind directions in different portions of the CLP remain scarce and controversial.
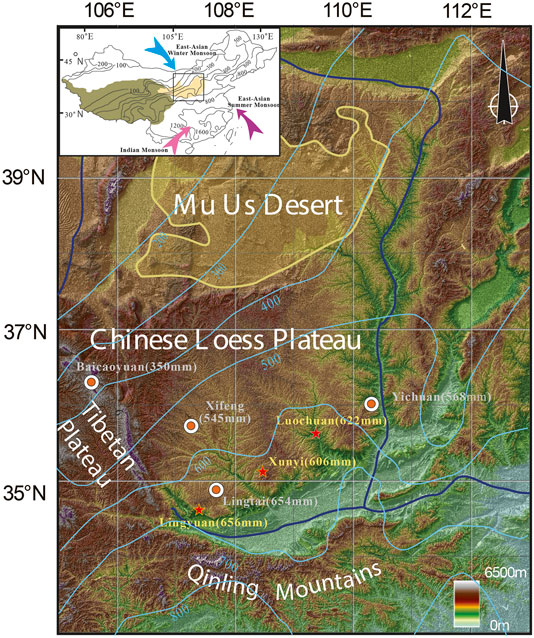
FIGURE 1. Chinese Loess Plateau, prevailing monsoon circulation, and model precipitation gradients. Solid red stars show locations of three sites investigated in this study, and black circles denote locations of sites previously studied (Zhu et al., 2004; Zhang et al., 2010).
Heller et al. (1987) first introduced the anisotropy of magnetic susceptibility (AMS) into loess studies. They verified that the reliability of paleomagnetic remanence is based on the consistency of the magnetic fabric in the Luochuan section and the relatively stable sedimentation rates observed within the loess-paleosol sequence. With improvements in the accuracy of AMS measurements, research on magnetic fabrics has gradually begun to compare the dynamic index with monsoon direction; that is, establish a linkage between the azimuth of the maximum axis of magnetic susceptibility and wind direction (Thistlewood and Sun, 1991). By taking AMS measurements from extant mineral assumblages and using statistical and kinetic analyses, ancient wind directions and intensities can by determined (e.g., Lagroix and Banerjee, 2002; Zhu et al., 2004; Zhang et al., 2010).
Based on mechanistic models inferred from AMS orientations, several recent studies have determined paleowind variations in the CLP. For example, Zhu et al. (2004) estimated dominant wind directions by considering magnetic lineations in loess (represented by maximum axes of AMS), whose orientations were observed to be clustered in different orientations during warm and cold periods. Zhang et al. (2010) proposed that the summer monsoon could facilitate the consolidation of the eolian particles that preserve AMS orientations. Ge et al. (2014) suggested that spatial variations in paleowind direction can be explained by regional surface winds. Other workers have reached much different conclusions. Zhu et al. (2007) and Liu and Sun (2012) pointed out that the model of eolian consolidation under such weak dynamics could not record dynamic wind directions. In most cases however, researchers determined orientations based on their measurements alone, without reference to dynamics in the horizontal surface (Zhu et al., 2007; Liu and Sun, 2012; Ge et al., 2014; Peng et al., 2015; Xie et al., 2016). We attempted to test further whether paleowind directions could be recorded in Chinese loess, and to discern the underlying mechanisms that govern the paleowind signal.
For all sediments, each mineral grain (ferromagnetic, paramagnetic, and diamagnetic) contributes to the total (bulk) magnetic susceptibility (MS). Several studies have already shown that precipitation is the main factor causing differences in total bulk k (MS) during the formation of loess and paleosols (i.e., Maher and Thompson, 1991; Maher and Thompson, 1992; Maher and Possolo, 2013). Precipitation also plays a significant role in consolidating particles and affects AMS orientations in different loess and paleosol units (Zhu et al., 2004; Zhang et al., 2010). For this study, we chose three loess sections—Lingyuan (LY), Xunyi (XY), and the classic Luochuan (LC) section—in the southern and central CLP, where stratigraphy and paleomagnetic results have been well-studied (e.g., Ding et al., 1994; Porter and An, 1995; Xue et al., 2003)—and tested whether loess samples that formed in a humid environment retain a paleowind signal. The chosen sections all lie within areas with more than 600 mm present-day annual precipitation, and are among the wettest sections we could find in the CLP. Yang et al. (2015) studied the grain size and distribution pattern of organic carbon in the CLP from the last glaciation to the present, and proposed that the northwestward migration of the monsoon was closely related to the position of the rainfall belt during the last glacial period. We note that the present day 600 mm precipitation zone is higher than rainfall levels in the last glacial (L1) loess. To assist our selection of CLP sites, we also reviewed and compared previous records to find those that satisfy our requirements for AMS orientations and from the same time interval (i.e., Zhang et al., 2010).
Methods and Results
The study sections LY, XY, and LC, were chosen from the southern and central CLP (Figure 1), and receive present-day precipitation of more than 600 mm per year. We initially planed to collect the last glacial (top loess layer L1) and last interglacial (paleosol layer S1) from each section. After removing 1 m thick coverage, this was accomplished for the XY (11 m collected) and LC (10 m collected) sections, however due to local weathering and erosion, we were limited to a portion of L1 and no S1 for the LY section (5 m collected).
Porter and An (1995) and Porter (2001) demonstrated that L1 and S1 correspond to marine isotope stage (MIS) 2–5, spanning 130–10k years ago. L1 consists of two primary loess units (L1LL1 and L1LL2) and one underdeveloped paleosol (L1SS). All stratigraphic subdivisions of L1 correlate with marine oxygen-isotope stages observed in the LC section (Porter, 2001). Only L1SS (partly) and L1LL2 were recovered from the XY section and subdivisions in the LY section were absent, possibly because rainfall homogenized the weak paleosol. Oriented samples were taken at a spacing of 2–5 cm in three sections and cut into 2 cm thick cubes. The AMS of each sample was measured using a KLY-4S KappaBridge coupled with an automated sample handling system. Each sample was rotated through three orthogonal planes, and the susceptibility ellipsoid was calculated by the least-squares method. Lineations (L), foliation (F), degree of anisotropy (P), and orientations of the three principle axes were obtained with Anisoft software using the statistical method of Jelínek and Kropáček (1978). All samples were also weighed to normalize mass MS results and facilitate comparisons among sections.
AMS tensors are defined by maximum (Kmax), intermediate (Kint), and minimum (Kmin) principal susceptibility axes. Following an established technique (e.g., Lagroix and Banerjee 2004b; Zhu et al., 2004; Zhang et al., 2010), the area of uncertainty around the orientation of the principal axes is quantified by 95% confidence ellipses that have semi-axes, denoted herein by epsilon ε, oriented parallel to the orthogonal planes defined by the three principal axes. Here we used ε23 and ε12, which represent the 95% confidence interval for Kmin or Kint in the plane joining Kmin and Kint and the uncertainty of Kmax or Kint in the plane joining Kmax and Kint, respectively. Figure 2 demonstrates the relationship between these AMS parameters. An inverse relationship between L (F) and ε12 (ε23) was observed (Figures 2B,C), demonstrating that L-(F) decreases as ε12 (ε23) increases due to the increasing importance of random measurement errors for Kmax (Kmin) in a lineation (foliation) plane with weak lineations (foliations) (Zhang et al., 2010). For the majority of samples, ε12 < 22.5°, with a statistically significant level (81.7% for Xunyi, 93.8% for Luochuan, 90.6% for Lingyuan), yielding a confidence ratio of 1.0 for maximum and intermediate susceptibility axes in the foliation plane (Lagroix and Banerjee 2004b).
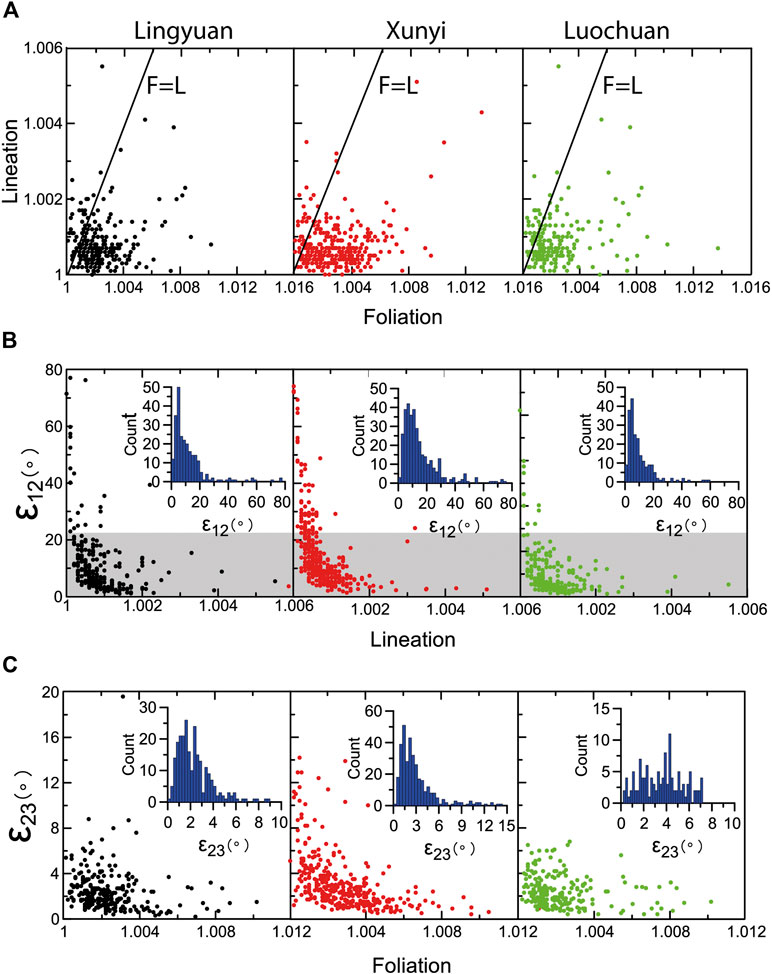
FIGURE 2. (A) Flinn-type plots of lineation (L) vs. foliation. (B) Plots of Ɛ12 (the 95% confidence ellipse of Kmax in the plane joining Kmax and Kint) against lineation. (C) Plots of Ɛ23 (the 95% confidence ellipse of Kmin in the plane joining Kint and Kmin) against foliation. The inserts are frequency distributions of Ɛ12 using 2° bin sizes (B) and Ɛ23 using 0.5° bin sizes (C).
Kmin axis orientations are distributed along the vertical axis of a stereographic projection. The mean I-Kmin was equal to 88.8° in LY, 87.8° in XY, and 88.4° in LC. Table 1 compares I-Kmin in sections in the northern and western CLP (Zhang et al., 2010). The dip in Kmin axes displays a noticeable steep upright among these sections in the CLP. I-Kmin showed only 1°–2° deviation from the vertical plane in all three sections which means there are no clearly preferred tilted Kmin axes directions (Tarling and Hrouda, 1993; Zhang et al., 2010).
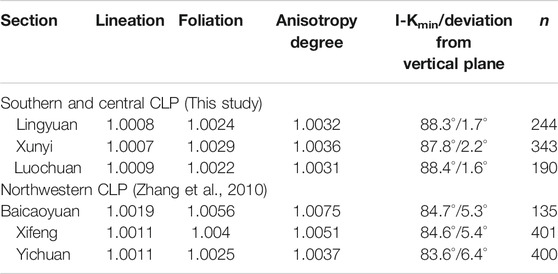
TABLE 1. Descriptive parameters of the mean anisotropy of magnetic susceptibility used in this study.
The iron oxide magnetite (and maghemite), especially its pseudo-single domain particles are the main carriers of the AMS signal in loess-paleosol sequences (e.g., Zhu et al., 2004; Zhang et al., 2010; Ge et al., 2014). Spherical projection of Kmax and Kmin for three sections were plotted using the Stereonet3D program in Figure 3 (Cardozo and Allmendinger, 2013). The magnetic minerals in loess show strong foliation and weak lineation (Figures 2A, 3) because gravitational forces are dominant and cause a strong oblate fabric within the bedding plane (Rees and Woodall, 1975; Tarling and Hrouda, 1993; Zhang et al., 2010; Gong et al., 2015).
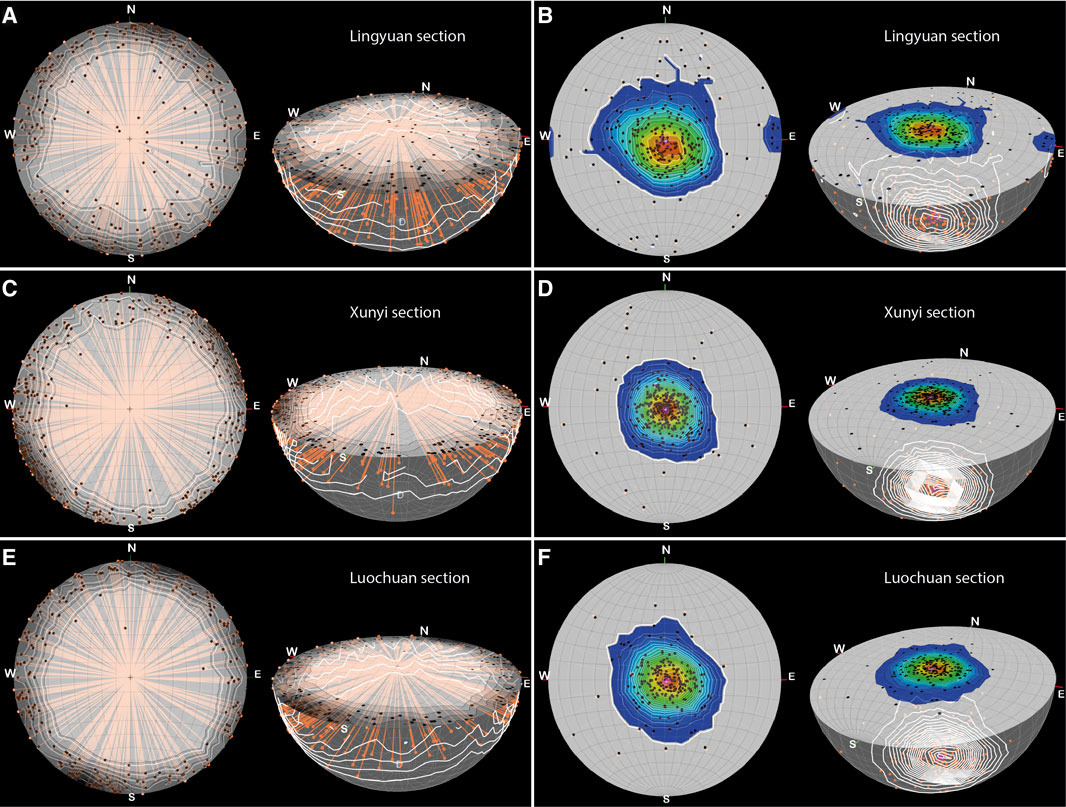
FIGURE 3. (A,C,E) 3D stereographic projections of Kmax (black dots) displaying the stereonet as the top of a bowl, the bowl as a transparent half-sphere in addition, horizon contour features are shown. Orange dots and lines represent Kmax projected in the bowl. (B,D,F) 3D stereographic projection of Kmin (black dots) displaying the stereonet as the top of a bowl, the bowl as a transparent half-sphere in addition horizon contour features are shown. Orange dots and white lines represent Kmin and contours projected in the bowl. The pink dots and circles represent mean Kmin orientation and its error.
The variation of AMS parameters vs. depth in the LY section are shown in Figure 4. The highest MS values in L1 observed among all of the sections was in LY, and fell between 1 × 10⁻⁶ and 3 × 10⁻⁶ m3/kg. Principal axis eigenvalues show clear bi-axial oblate distributions (Kmax–Kint > Kmin) throughout every section as has been seen in many other loess sections (e.g., Lagroix and Banerjee, 2004a; Lagroix and Banerjee, 2004b). The sections frequently show fluctuations in the uppermost 1.5 m, which could be affected by the agricultural activity. For the XY and LC sections, we obtained AMS records from both the loess (L1) and paleosol (S1) layers (Figures 5, 6). These show a trend of increased oblate distributions from top to bottom (a decreased eigenvalue τmin indicates that the tensor in the vertical direction has been flattened), suggesting that increased compaction with depth influenced both the upper loess layer (L1) and upper paleosol layer (S1).
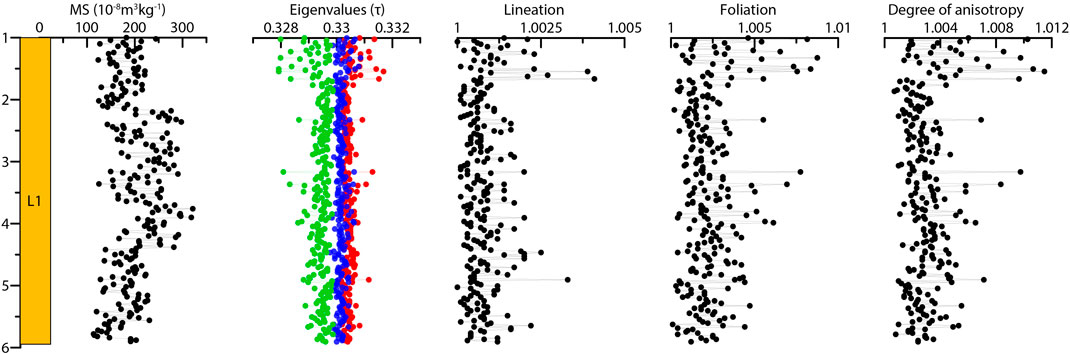
FIGURE 4. The depth vs. variation of magnetic susceptibility, eigenvalues of three principal anisotropy of magnetic susceptibility axes (τmax in red, τint in blue, and τmin in green), lineation, foliation, and degree of anisotropy in the Lingyuan section.
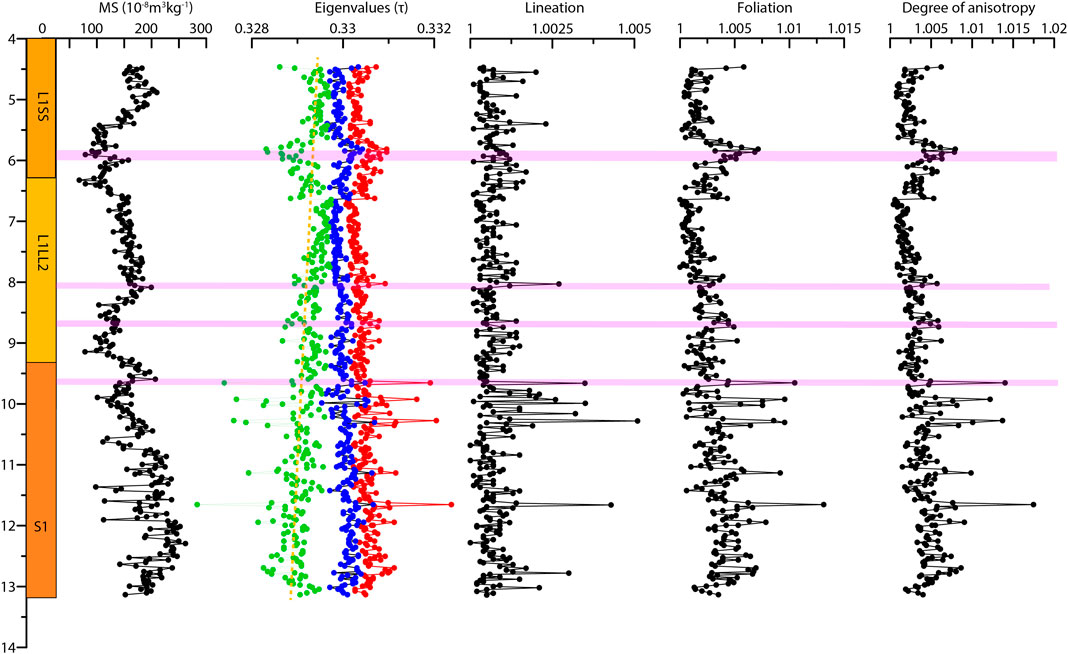
FIGURE 5. The depth vs. variation of magnetic susceptibility, eigenvalues of three principal anisotropy of magnetic susceptibility axes (τmax in red, τint in blue, and τmin in green), lineation (L), foliation (F), and degree of anisotropy (P) in the Xunyi section. Pink bars showing extreme or spurious cases with high P and F, related to high MS values and τ-max, and low τ-imin.
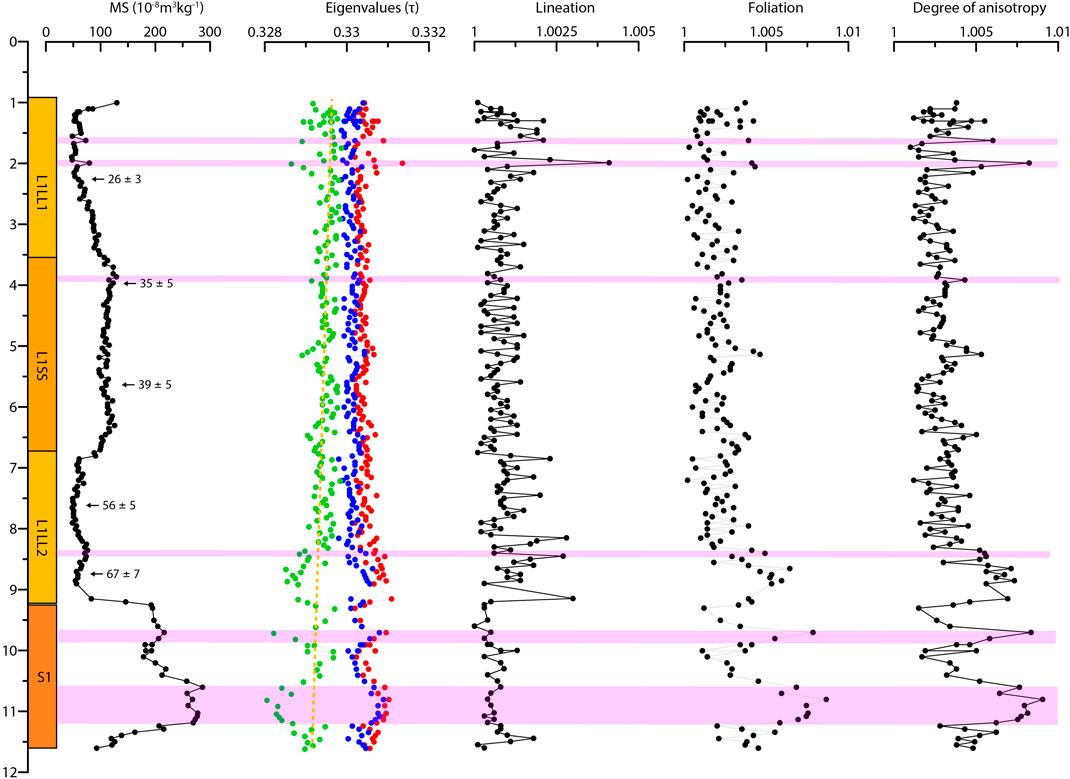
FIGURE 6. The depth vs. variation of magnetic susceptibility, eigenvalues of three principal anisotropy of magnetic susceptibility axes (τmax in red, τint in blue, and τmin in green), lineation (L), foliation (F), and degree of anisotropy (P) in the Luochuan section. TL ages are from Porter and An (1995). Pink bars showing some extreme cases with high P and F, related to high MS values and τ-max, and low τ-imin.
Following the division and subdivision of loess units, four distinct stages of MS variability are recognized in our sections (especially for LC and XY) (Figure 7A). Due to higher precipitation in the past, we find higher MS in our sections than others (e.g., Zhang et al., 2010) except in stage three of the Luochuan section, which has lower MS. We observe that sections with average higher MS often have lower AMS parameters (P, F, and L) which is also seen in the results given in Table 1, where we report mean P, F, and L values from our sites, along with several other sites from the literature (BCY, XF, and YC). As an example, the BCY section has the lowest observed MS among all of the sections, and it has the highest AMS parameter values (P, F, and L). It should also be noted that in order to compare all the sections with similar depth scales, we use only the data of L1 in Figure 7.
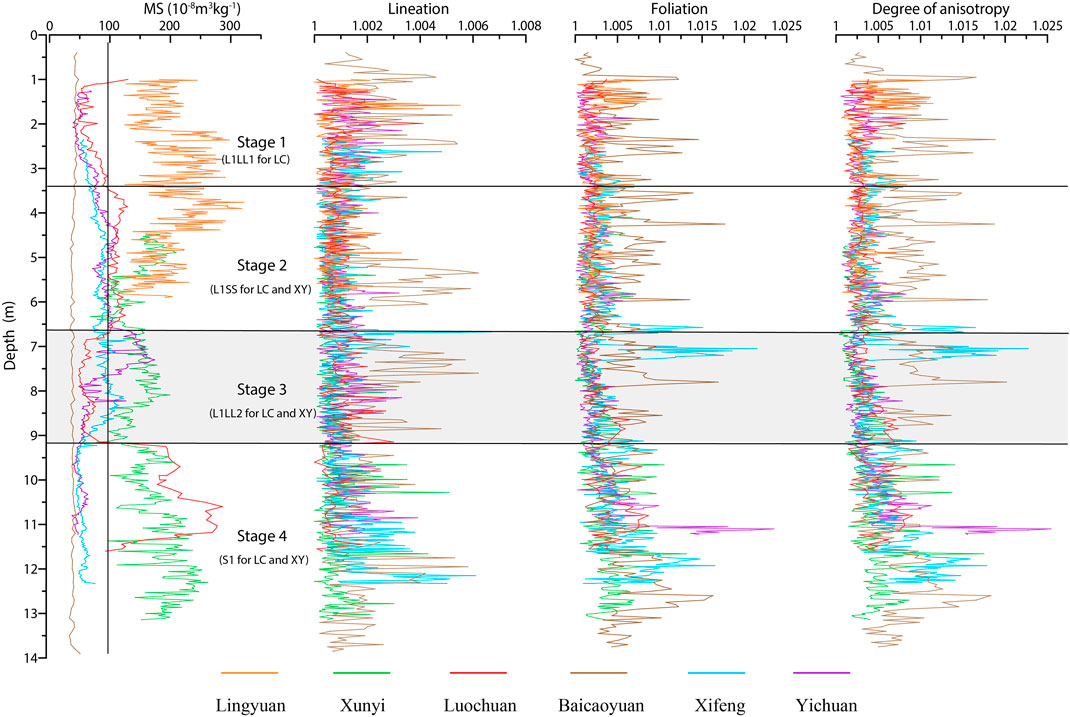
FIGURE 7. Comparing the depth vs. variations of MS, L, F, and degree of anisotropy in different sections: LY (orange), XY (green), LC (red), BCY (brown), XF (blue), and YC (purple).
Discussion
Zhang et al. (2010) used the statistical azimuth of Kmax (D-Kmax) and Kmin (D-Kmin) to infer a pattern of summer paleomonsoon routes. Under relatively weak dynamic conditions, D-Kmax indicates the direction of the source of the current/paleowind while under relatively strong current/paleowind, a component of D-Kmax turns toward the perpendicular of the horizontal dynamic/flow direction (Tarling and Hrouda, 1993; Zhang et al., 2010). D-Kmin is always tilted in the direction of the current/paleowind under weak or relatively strong current/paleowind (Tarling and Hrouda, 1993). The oblate AMS ellipsoid of grain distributions, gives a more reliable Kmin orientation than Kmax. In such cases, changes in I-Kmin correspond to hydrodynamics, and can be more than 10° for a relatively strong current (Tarling and Hrouda, 1993), 5°–7° for a weak paleowind in the northern and western CLP (e.g., Zhang et al., 2010), and less than 3° for quiet conditions. Figure 3 shows that quiet model conditions were observed in all three sections. D-Kmax was randomly distributed in all directions around the edges of the steronet (Figure 3A) and orientations of Kmin were perpendicular to the horizontal plane (Figure 3B). Considering the eolian origin of the sediment grains, we expect that pedogenesis and neoformed magnetic minerals may produce chaotic AMS values. For example, rapid growth of summer vegetation and consequent plant root development can interfere with the alignment of detrital particles and obscure the paleowind AMS signal (Zhang et al., 2010). In this manner, relatively high rainfall may have influenced ellipsoid orientations at the LY site (Figure 3), where rainfall was relatively high. This is consistent with the steep I-Kmax gradient we observe in the LY section, suggesting deep rainwater penetration. We summarize modern precipitation distribution with isopotential density maps (Figure 1), and ground surface wind vectors (Figure 9). The present-day 600 mm precipitation zone experiences more rainfall than during the last glacial, when the (L1) loess was deposited (Yang et al., 2015). Although the distribution pattern might be similar, we expect that quantitative differences between the last glacial period and the present exist. Future paleowind investigations on the CLP would do well to choose a low rainfall area for study, to avoid the effects of reworked/water-lain sediments. We find that the orientation of Kmin is be the most noteworthy feature, as it represents the placement of the dominant AMS parameter—foliation, in the loess.
For a single section, there is no obvious relation between MS variations and AMS parameters. In the LY section for example, some extremely high F, P or L values are randomly distributed, and are not concentrated on horizons with higher or lower MS (Figure 4). For the XY and LC sections (Figures 5, 6), we indicate with pink horizontal bars those with high P and F (and L in most cases) values. These stem from high eigenvalues of τ-max (and τ-int in most cases) and high MS values. Aside from these extreme cases, we are unable to establish a relationship between AMS fluctuations and MS values. In the LC section for example, we have observed two large MS peaks in S1 with high AMS variability. However, the rest of S1 has lower AMS values than the average loess horizon values. For the XY section, there is no distinct difference between the AMS values of the loess and paleosol. In such cases we infer that the relations between AMS parameters and MS values cannot be attributed to a single factor (for example, precipitation or paleowind intensity). On the CLP, during a strong monsoon rainfall season, water could remain longer in pores within the loess layer. Such extended saturated conditions could disturb the AMS signal and distort inferred paleowind directions. All of our sections (LY, XY, and LC) experienced relatively high precipitation as compared with sections from the northwest CLP (i.e., Zhang et al., 2010), and in most cases, we observe low values of L, F, and P (Table 1). Therefore, although precipitation might increase MS, it does not increase L, F, and P.
In Figure 8, we show Kmax and Kmin orientation distributions for the four stages seen in the sections. We find large Kmin deviations from the vertical plane that could be random, and the spread of D-Kmax values do not show a clear trend with which to evaluate the paleowind direction without ambiguity. We also found clustered major Kmin in the projection (shadow ellipsoid in Figure 8), mainly in the NW-SE direction. This could suggest that the major horizontal dynamic variations correspond to two flow directions (NW and SE), with implied ground surface wind directions similar to the present—SE (summer) and NW (winter) (Figure 9). The only exception is the clustered Kmin in the LC section, which shows a slight clockwise rotation from W-E (stage 4, S1) to N-S (stage 1, L1LL1) in the stereo-graphic projection (Figure 8A). Under the present major winter wind patterns, winds can vary from NW, to N, to NE, and even to E, with a slight shift to the south (Figure 9). Such scenarios imply that paleowinds recorded in the LC section may have varied since the last interglacial. These results can also explain why a previous study of the LC section found no preferred paleowind directions (Liu and Sun, 2012).
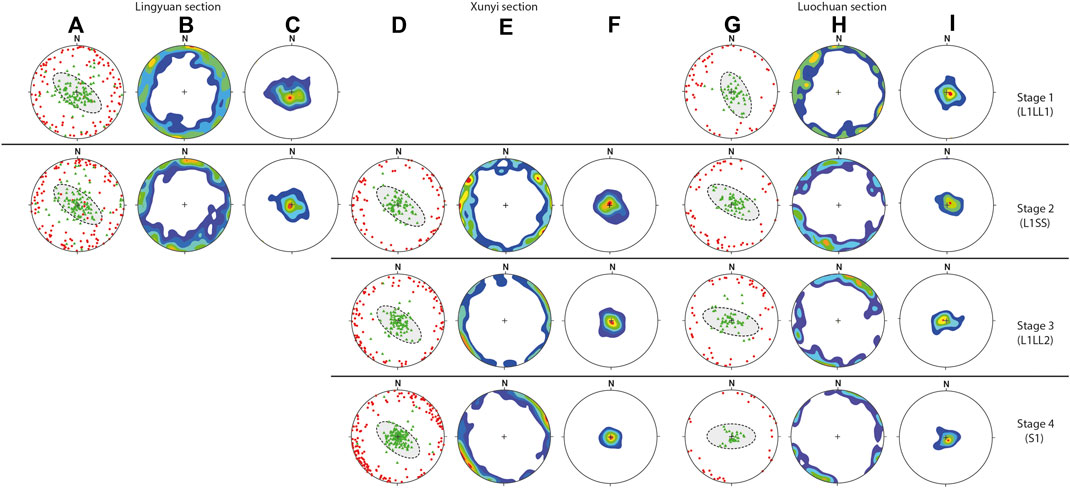
FIGURE 8. Anisotropy of magnetic susceptibility orientations for the LY, XY, and LC sections: stereographic projection (A,D,G) of Kmax (red dots) and Kmin (green triangles); contours of Kmax(B,E,H) and Kmin(C,F,I).
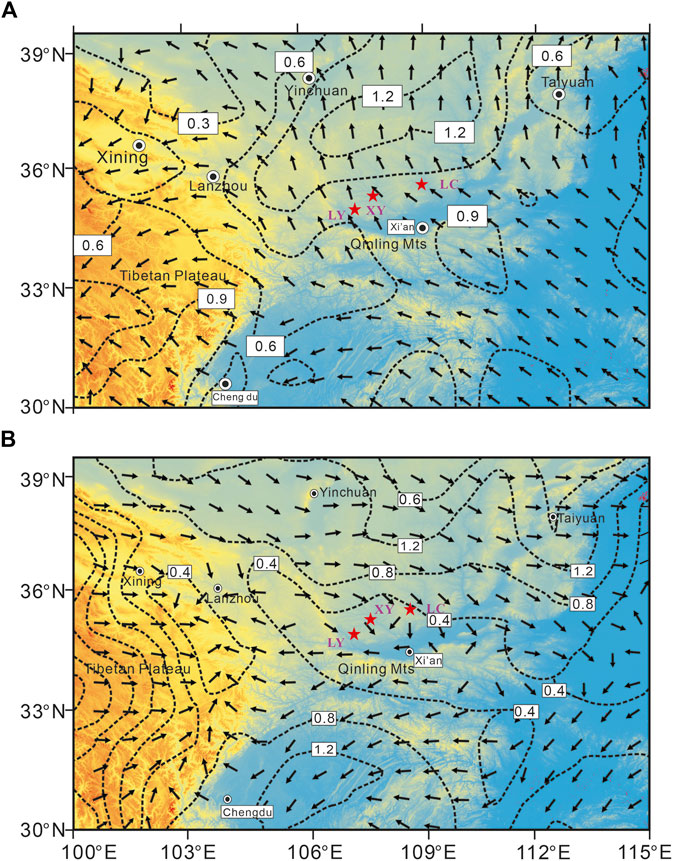
FIGURE 9. The surface wind vectors for (A) the summer months, May–September and (B) the winter months, November–March, calculated from the 1950 to 2015 monthly long-term means. Data was compiled by NOAA-CIRES’s NCEP reanalysis atlas. On the CLP, summer prevailing winds come from the SE while winter prevailing winds comes from the NW, N, NE, E, and SE.
Conclusion
Magnetic fabrics in eolian sediments can be measured by AMS to infer paleowind directions. However, high precipitation in the southern and central part of the CLP impart variability in the inferred paleowinds. We suggest that studies of paleowind would be more consistent in the northwest CLP, where there is less rainfall. In particular, the orientation of Kmin may be used as a dual-level indicator of horizontal dynamics and direction. It should first be determined if there is an absence of horizontal force or tilt response, then the flow direction should be decided by studying the statistical trend of Kmin with time. In future studies, we recommend that statistical parameters of AMS orientations, especially Kmin, should be used to interpret whether the paleowind can be recorded.
Data Availability Statement
The raw data supporting the conclusions of this article will be made available by the authors, without undue reservation.
Author Contributions
RZ is the corresponding author and he collected the AMS data. FX and RZ contributed equally to this work. FX and RZ performed the experiments, carried out data analysis, and wrote the manuscript.
Funding
This work was co-supported by the National Natural Science Foundation of China (41772027, 41930321, 41972035, and 41950410574) and State Key Laboratory of Loess and Quaternary Geology (SKLLQG1732).
Conflict of Interest
The authors declare that the research was conducted in the absence of any commercial or financial relationships that could be construed as a potential conflict of interest.
The reviewer (XW) declared a past co-authorship with one of the authors (FX) to the handling editor.
Acknowledgments
We thank J. Jiao, F. Du, X. Wei, and X. Jing for their help with laboratory measurement and in the field. We are grateful to two reviewers and associate editor Q. Liu for their thoughtful suggestions. We also thank M. Craig and G. S. Burr for editing the first and second version of manuscript.
References
An, Z. S., Kutzbach, J. E., Prell, W. L., and Porter, S. C. (2001). Evolution of Asian Monsoons and phased uplift of the Himalayan Tibetan plateau since Late Miocene times. Nature 411, 62–66. doi:10.1038/35075035
Cardozo, N., and Allmendinger, R. W. (2013). Spherical projections with OSXStereonet. Comput. Geosci. 51, 193–205. doi:10.1016/j.cageo.2012.07.021
Ding, Z., Yu, Z., and Rutter, N. W. (1994). Towards an orbital time scale for Chinese loess deposits. Quat. Sci. Rev. 13, 39–70. doi:10.1016/0277-3791(94)90124-4
Ge, J. Y., Guo, Z. T., Zhao, D. A., Zhang, Y., Wang, T., Yi, L., et al. (2014). Spatial variations in paleowind direction during the last glacial period in north China reconstructed from variations in the anisotropy of magnetic susceptibility of loess deposits. Tectonophysics 629, 353–361. doi:10.1016/j.tecto.2014.07.002
Gong, H., Zhang, R., Yue, L. P., Zhang, Y., and Li, J. (2015). Magnetic fabric from red clay sediments in the Chinese Loess Plateau. Sci. Rep. 5, 9706. doi:10.1038/srep09706
Heller, F., Beat, M., Wang, J., Liu and, H., and Liu, T. (1987). “Magnetization and sedimentary history of loess in the central Loess Plateau of China,” in Aspects of loess research. Editor T. S. Liu, (Beijing: China Ocean Press), 147–163.
Jelínek, V., and Kropáček, R. V. (1978). Statistical processing of anisotropy of magnetic susceptibility measured on groups of specimens. Studia Geophys. Geod. 22, 50–62. doi:10.1007/BF01613632
Lagroix, F., and Banerjee, S. K. (2002). Paleowind directions from the magnetic fabric of loess profiles in central Alaska. Earth Planet. Sci. Lett. 195 (1), 99–112. doi:10.1016/S0012-821X(01)00564-7
Lagroix, F., and Banerjee, S. K. (2004a). Cryptic post-depositional reworking in aeolian sediments revealed by the anisotropy of magnetic susceptibility. Earth Planet. Sci. Lett. 224 (3–4), 453–459. doi:10.1016%2Fj.espl.2004.05.029
Lagroix, F., and Banerjee, S. K. (2004b). The regional and temporal significance of primary aeolian magnetics fabrics preserved in Alaskan loess: Earth planet. Sci. Lett. 225, 379–395. doi:10.1016/j.epsl.2004.07.003
Liu, W. M., and Sun, J. M. (2012). High-resolution anisotropy of magnetic susceptibility record in the central Chinese Loess Plateau and its paleoenvironment implications. Sci. China Earth Sci. 55, 488–494. doi:10.1007%2Fs11430-011-4354-3
Maher, B. A., and Possolo, A. (2013). Statistical models for use of palaeosol magnetic properties as proxies of palaeorainfall. Global Planet. Change 111, 280–287. doi:10.1016/j.gloplacha.2013.09.017
Maher, B. A., and Thompson, R. (1991). Mineral magnetic record of the Chinese loess and paleosols. Geology 19, 3–6. doi:10.1130%2F0091-7613(1991)019%3C0003%3AMMROTC%3E2.3.CO%3B2
Maher, B. A., and Thompson, R. (1992). Paleoclimatic significance of the mineral magnetic record of the Chinese loess and paleosols. Quat. Res. 37, 155–170. doi:10.1016/0033-5894(92)90079-x
Peng, S., Ge, J., Li, C., Liu, Z., Qi, L., Tan, Y., et al. (2015). Pronounced changes in atmospheric circulation and dust source area during the mid-Pleistocene as indicated by the Caotan loess-soil sequence in North China. Quat. Int. 372, 97–107. doi:10.1016%2Fj.quaint.2014.09.075
Porter, S. C. (2001). Chinese loess record of monsoon climate during the last glacial-interglacial cycle. Earth Sci. Rev. 54, 115–128. doi:10.1016%2FS0012-8252(01)00043-5
Porter, S. C., and An, Z. (1995). Correlation between climate events in the North Atlantic and China during the last glaciation. Nature 375, 305–308. doi:10.1038/375305a0
Rees, A. I., and Woodall, W. A. (1975). The magnetic fabric of some laboratory-deposited sediments. Earth Planet. Sci. Lett. 25, 121–130. doi:10.1016/0012821X(75)90188-0
Tarling, D. H., and Hrouda, F. (1993). The magnetic anisotropy of rocks. London: Chapman & Hall, 1–28.
Thistlewood, L., and Sun, J. Z. (1991). A palaeomagnetic and mineral magnetic study of the loess sequence at Liujiapo, Xian, China. J. Quat. Sci. 6, 13–26. doi:10.1002/jqs.3390060104
Xie, X., Xian, F., Wu, Z., Kong, X., and Chang, Q. (2016). Asian Monsoon variation over the late Neogene–early Quaternary recorded by Anisotropy of Magnetic Susceptibility(AMS) from Chinese loess. Quat. int. 399, 183–189.
Xue, X., Yue, L., Zhou, J., and Wang, J. (2003). Susceptibility of the later Cenozoic red earth loess in Xunyi, Shaanxi Province and environmental variation. Quat. Sci. 23, 103–108 (in Chinese with English Abstract).
Yang, S., Ding, Z., Li, Y., Wang, X., Jiang, W., and Huang, X. (2015). Warming-induced northwestward migration of the East Asian monsoon rain belt from the last Glacial Maximum to the mid-Holocene. Proc. Natl. Acad. Sci. U.S.A. 1129 (43), 13178–13183. doi:1073%2Fpnas.1504688112
Zhang, R., Kravchinsky, V. A., Zhu, R., and Yue, L. (2010). Paleomonsoon route reconstruction along a W-E transect in the Chinese Loess Plateau using the anisotropy of magnetic susceptibility: summer monsoon model. Earth Planet. Sci. Lett. 299, 436–446. doi:10.1016/j.epsl.2010. 09.026
Zhu, R. X., Liu, Q. S., and Jackson, M. J. (2004). Paleoenvironmental significance of the magnetic fabrics in Chinese loess-paleosols since the last interglacial (<130 ka). Earth Planet Sci. Lett. 221, 55–69. doi:10.1016/S0012-821X(04)00103-7
Keywords: anisotropy of magnetic susceptibility, Chinese loess plateau, ancient monsoon, precipitation, environmental magnetism
Citation: Xian F and Zhang R (2020) An Attempt to Recover a Paleomonsoon Signal in the Chinese Loess Plateau Using Anisotropy of Magnetic Susceptibility. Front. Earth Sci. 8:569072. doi: 10.3389/feart.2020.569072
Received: 10 June 2020; Accepted: 15 October 2020;
Published: 13 November 2020.
Edited by:
Qingsong Liu, Chinese Academy of Sciences (CAS), ChinaReviewed by:
Xisheng Wang, Chinese Academy of Geological Sciences (CAGS), ChinaBelén Oliva-Urcia, Autonomous University of Madrid, Spain
Copyright © 2020 Xian and Zhang. This is an open-access article distributed under the terms of the Creative Commons Attribution License (CC BY). The use, distribution or reproduction in other forums is permitted, provided the original author(s) and the copyright owner(s) are credited and that the original publication in this journal is cited, in accordance with accepted academic practice. No use, distribution or reproduction is permitted which does not comply with these terms.
*Correspondence: Rui Zhang, ruizhang@nwu.edu.cn