Influence of the North Pacific Victoria Mode on the Madden–Julian Oscillation
 Tao Wen
 Quanliang Chen2
  Ruiqiang Ding
- 1State Key Laboratory of Earth Surface Processes and Resource Ecology, Beijing Normal University, Beijing, China
- 2Plateau Atmosphere and Environment Key Laboratory of Sichuan Province, Chengdu University of Information Technology, Chengdu, China
- 3Laboratory for Regional Oceanography and Numerical Modeling, Qingdao National Laboratory for Marine Science and Technology, Qingdao, China
- 4State Key Laboratory of Earth Surface Processes and Resource Ecology, Beijing Normal University, Beijing, China
- 5Institute of Oceanography, National Taiwan University, Taipei, Taiwan
- 6CIC-FEMD/ILCEC, Key Laboratory of Meteorological Disaster of Ministry of Education, School of Atmospheric Sciences, Nanjing University of Information Science and Technology, Nanjing, China
Using the observational data and the Coupled Model Intercomparison Project phase 5 (CMIP5) models this study examined the influence of the North Pacific Victoria mode (VM) on the Madden–Julian Oscillation (MJO). The results show that the February–April VM had a significant influence on the development and propagation of the MJO over the equatorial central-western Pacific (ECWP) during spring (March-May) between 1979 and 2017. Specifically, MJO development was favored more by positive VM events than negative VM events. These complicated connections could have been caused by the SST gradient anomalies associated with positive VM events, enhancing the convergence of low-level over the ECWP. When this is combined with warm SST anomalies in the equatorial central Pacific it could have led to a boost in the Kelvin wave anomalies, resulting in enhanced MJO activity over the ECWP. These conclusions indicate that the VM is an important factor in MJO diversity.
Introduction
As one of the most important modes of intraseasonal variability in the tropics, the Madden–Julian oscillation (MJO; Hendon et al., 2007; Madden and Julian, 1971; Madden and Julian, 1972) has momentous academic value, due to its influence on short-term weather and climate phenomena globally (Lau and Chan, 1986). Many previous theoretical studies on MJO have indicated a few obvious natures, including its large-scale convective disturbance, the time scale between a month and a season, and the eastward propagation at ∼5 m/s (Weickmann, 1983). Although it has been the subject of comprehensive investigation in recent decades, accurate mode simulation and prediction of the MJO remain elusive (Adames and Wallace, 2014).
Previous studies have found that there are important modes that affect tropical climate variability, such as El Niño–Southern Oscillation (ENSO) and the Indian Ocean Dipole (IOD) can modulate the MJO (Woolnough et al., 2000; Jones et al., 2004; Hendon et al., 2007; Pohl and Matthews, 2007; Moon et al., 2011; DeMott et al., 2015; Zheng and Zhang, 2018). ENSO exerts a substantial influence on all stages of MJO: the initiation, maintenance, and propagation. MJO events are more frequent during El Niño episodes than under La Niña conditions (Jones et al., 2004), and have briefer periods (Pohl and Matthews, 2007; DeMott et al., 2015), and transmit further east of the Pacific (Tam and Lau, 2005). The warm water eastward development during El Niño events expedites the expanded eastward spread of the MJO (Woolnough et al., 2000; DeMott et al., 2015). In addition, Shinoda and Han (2005) and Wilson et al. (2013) showed that the IOD plays a role in MJO activity. During negative IOD events, the MJO activity of the eastern Indian Ocean is more frequent than that of the western Indian Ocean. This is due to warm sea surface temperature anomalies (SSTAs) of the eastern but gets cold in the western Indian Ocean. Homoplastically, the reverse is true for positive IOD events.
In addition to tropical climate modes, some extratropical climate modes such as the North Atlantic Oscillation and the Arctic Oscillation play a pivotal role in the extratropical zone (Ambaum et al., 2001; Wallace and Thompson, 2002; Vecchi et al, 2004, Zhou and Miller 2005; Lin et al., 2009). These can have important modulation effects on the MJO activity in the tropics. Lin et al. (2009) mentioned that MJO activity in tropical regions may be affected by changes in the zonal wind of the troposphere over the North Atlantic. Moreover, Yoo et al. (2011), Yoo et al. (2012) have pointed out that the poleward wave train associated with the surface air temperature over the Arctic is closely related to the MJO activity in the tropics.
Recent studies have named the second empirical orthogonal function mode (EOF2) of the SSTAs found north of 20°N in the North Pacific as the Victoria mode (VM; Bond et al., 2003), which has a significant impact on convection and precipitation over that part of the tropics during the coming summer (Ding et al., 2015a). Given that during the evolution and propagation of the MJO, the convection in the equatorial central Pacific makes a momentous contribution (Pohl and Matthews, 2007), and there may be a close connection between the February-April (FMA) and MJO activity. However, there is little research on the connection and influence between VM and MJO. The primary purpose of this study was to investigate the connection between the FMA VM and MJO activity the following spring. This study examined whether there is a fundamental connection between the FMA VM over the extratropical region following MJO activity and if there is, asking how this connection is established and exploring how it works.
Data and Methodology
Observational Data
This study used data from several observational, reconstructed, and reanalysis data sets. The monthly mean SST data set was drawn from the Hadley Center global sea ice and sea surface temperature (HadISST) dataset (Rayner et al., 2006). Specific humidity, u-wind, and v-wind data were sourced from the National Centers for Environmental Prediction (NCEP) reanalysis dataset (Kalnay et al., 1996). The Outgoing Longwave Radiation (OLR) data and precipitation data were sourced from the Climate Prediction Center Merged Analysis of Precipitation dataset (Xie and Arkin, 1997) and the NCEP/NOAA (Liebmann and Smith, 1996), respectively. Data were analyzed on a 2.5° × 2.5° spatial grid over the period January 1, 1979, to December 31, 2017, except for the monthly mean SST data set, which had a spatial resolution of 1° × 1.
Daily anomalies were calculated with the time series of each grid point by removing the linear trend, which was obtained using the least square fit, and by eliminating daily climatology, which was the average of each day. Then, using the 30–90°days bandpass Lanczos filter with 401 weights, we processed the daily anomalies (Duchon, 1979). The variability of the intraseasonal timescale was obtained by diagnosing these calculated daily anomalies. We calculated the monthly anomalies by removing the linear trend and climatological monthly means, to investigate variability at the interannual timescale.
Model Datasets
To account for the difference between the effect of FMA VM and ENSO on the precipitation patterns over the equatorial central-western Pacific regions (ECWP), we used the Geophysical Fluid Dynamics Laboratory global Atmospheric Model version 2.1 (AM2.1) at a horizontal resolution of 2.5°longitude × 2°latitude. The seasonal varying climatological SSTs were used to obtain the climatological state (CTRL). Two sensitivity experiments were conducted with the composite SSTAs of the VM (5°S–60°N, 105°E–110°W) and El Niño region (15°S–15°N, 150°E–70°W) over the tropical Pacific from February to April. SSTAs outside the forcing area were set to zero and only positive loading in the region was used. Each run was integrated for 40 years and the output from the last 30 years of the integration was averaged to reduce the possible impact of the internal variability.
To evaluate whether the FMA VM over the extratropical region can affect the subsequent MJO in the tropics, we reproduced activity using current coupled models. The study used daily and monthly outputs from control experiments from two coupled atmosphere-ocean models that participated in CMIP5 (Coupled Model Intercomparison Project, phase 5). The variables we analyzed were daily OLR and monthly SST, u-wind, v-wind, specific humidity, and precipitation. For ease of comparison and the ensemble mean computation, we transformed all variables from the CMIP5 output into a horizontal resolution of 2.5° × 2.5.
Definition of Indices
This study used the RMM index, a generally used MJO index, to select MJO events. The RMM index was constituted on the multivariate EOF analysis of the united fields of OLR, 850- and 200 hPa zonal wind anomalies (Wheeler and Hendon, 2004; Zheng and Zhang, 2018). Because of the convection and circulation change characteristics of the MJO, the RMM index was an effective way to reflect the MJO’s multiple structures. The RMM index is commonly used in MJO diagnostics and assessments of operational MJO forecast skill (Seo et al., 2009). Following convention, strong MJO activity was defined as occurring when the RMM amplitude exceeded 1 (i.e.,
Previous studies have reported that unlike the Pacific Decadal Oscillation (Ding et al., 2015a; Mantua et al., 1997), which coincides to the EOF1 of SSTAs found north of 20°N over the North Pacific, the VM is pushed by the North Pacific Oscillation like atmospheric variability through variation in heat fluxes of surface, and demonstrates a triple texture over the North Pacific (Alexander et al., 2010; Ding et al., 2015b; DeMott et al., 2015). As the VM shows the maximum variance between February and April (FMA), due to a lagging response to the affecting of North Pacific oscillation (Ding et al., 2015b), this study performed the EOF analysis method to the SSTA field of the FMA averaged in the North Pacific (100°E–100.5°W, 20.5°N–65.5°N; Figure 1). Hereafter, we define Pacific decadal oscillation as SSTA EOF1 mode, and the EOF2 mode is named VM. This study applies the second principal component (PC2) of time series, which is linked to the VM pattern to characterize the VM index (VMI; Ding et al., 2015a).
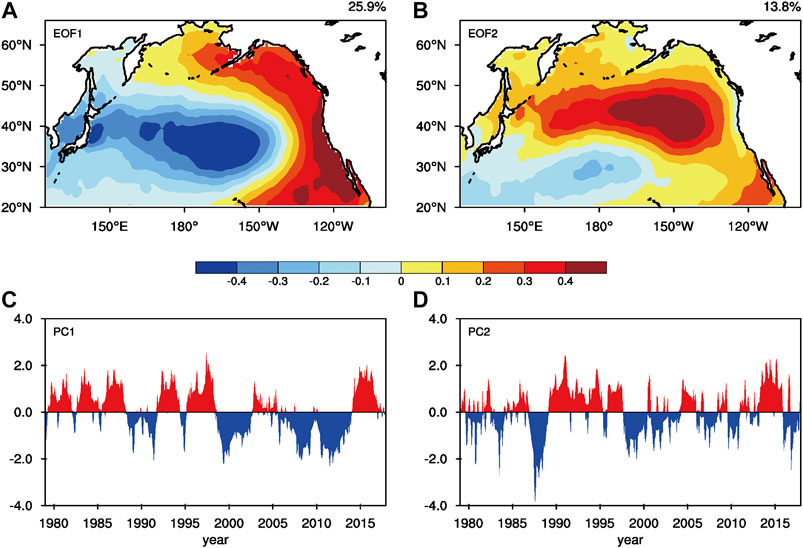
FIGURE 1. Spatial patterns and corresponding PCs of the first two leading EOF modes of FMA SST anomalies over the North Pacific poleward of 20°N (after removing the global mean SSTA).
We filtered strongly negative and strongly positive VM events by the value of VMI. When the VMI in a certain year is greater than a positive standard deviation, we defined this year as a positive VM event, and vice versa. Therefore, we identified six positive VM events (1986, 1991, 1996, 1997, 2014, and 2015) and eight negative VM events (1988, 1998, 1999, 2000, 2001, 2007, 2008, and 2010) in the 39 years from 1979 to 2017.
Statistical Methods
Other statistical methods were used in this study, such as correlation analysis, linear regression, and partial correlation analysis. A statistical significance test of these statistical methods was undertaken, using a two-sided Student’s t test, where the amount of effective degrees of freedom (Neff) was calculated as described by Bretherton et al. (1999):
where the N stands for the amount of effective time steps. The lag one autocorrelations of variables x and y are represented by rx and
Results
The Link Between the Victoria Mode and Intraseasonal Variability
Previous research results have shown that the FMA VM usually reaches a peak, but the seasonality of the MJO is out of sync with that of the VM. The MJO is usually the most active in boreal winter but it starts to weaken in the spring and the barrier effect on MJO propagation in the Maritime Continent is the most serious in spring (Salby and Hendon 1994; Ding et al., 2015a; Ding et al., 2015b). Taking this into account, this study aimed to verify whether there a possible delayed effect between the VM and MJO. We first investigated the connection between the FMA VM and MJO in the coming spring (March–April–May: MAM).
The calculation of a correlation analysis method is used between the FMA VMI and the tropical precipitation, OLR, and specific humidity anomalies in the following MAM (Figure 2). Use the average from 850 to 200 hPa as the specific humidity for this study. The distribution of precipitation correlation is not uniform in space, but it is a notable dipole type (Figure 2A). Over the west of the Maritime Continent, there are significant negative correlations, whereas positive correlations are found in the eastern Maritime Continent and the equatorial central-western Pacific regions (ECWP). Over the ECWP, the correlations of the OLR (humidity) anomalies are almost inconsistent (consistent) with those of precipitation anomalies. The regressions of the MAM precipitation and OLR anomalies onto the FMA VMI (Figures 2C,D) show a well-defined dipole structure over the ECWP, which is consistent with the correlation patterns. The above results point out that over the ECWP the FMA VM is closely connected to convection activity and precipitation intensity in the following MAM, which is coherent with the conclusions of Ding et al. (2015a). As convection activity and precipitation intensity over the ECWP make an important contribution to the propagation of MJO events, we hypothesize that the VM has an intimate relationship with MJO activity in the following spring.
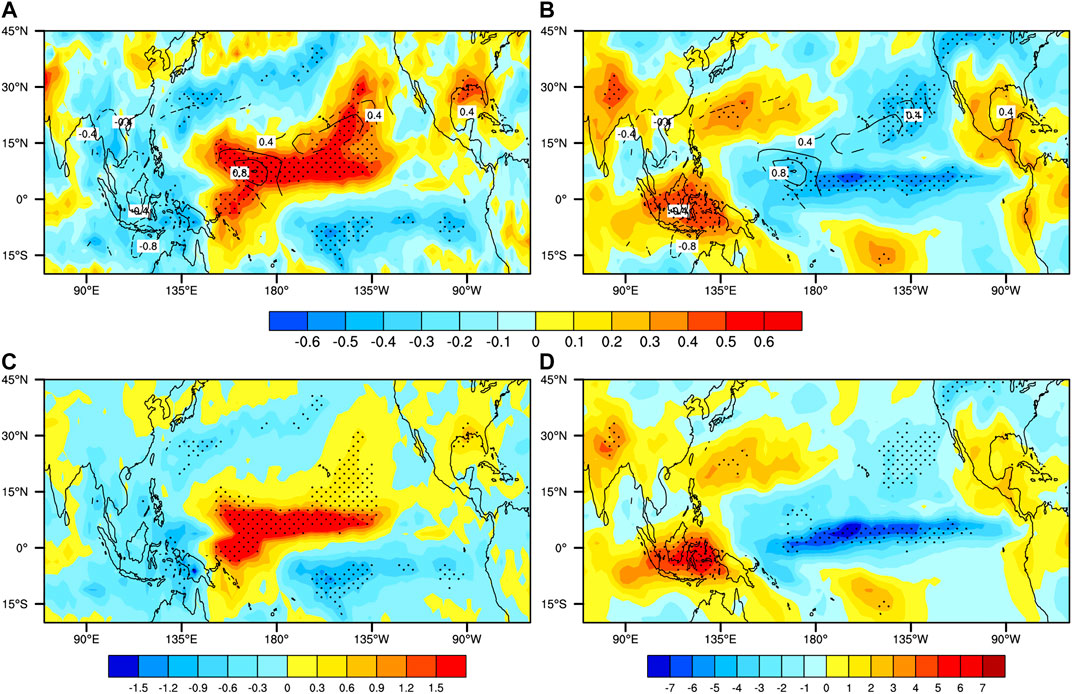
FIGURE 2. (A) Correlation map of the FMA VMI with the following spring precipitation (shaded) and specific humidity (contours) anomalies. (B) As (A) but for the correlations between the FMA VMI and the following spring OLR (specific humidity) anomalies. (C) MAM precipitation anomalies regressed on the FMA VMI. (D) As (C) but for the regressions between the FMA VMI and the MAM OLR anomalies. Only anomalies exceeding 95% significance, based on a two-tailed Student’s t test, are shown.
Next, we investigated the connection between the intraseasonal activity and VM over the ECWP. To facilitate this analysis, we used the variance sequence of the 30–90 days filtered OLR and 850-hPa zonal wind anomalies as surrogates for intraseasonal activity signals. A three-month moving window was used to calculate the variance of the filtered anomalies. The correlation coefficients of the FMA VMI with the filtered OLR variance sequence from the following MAM is shown in Figure 3A. There is one significantly correlated center between the FMA VM and the intraseasonal variability of OLR over the ECWP (0°–10°N, 140°E–160°W). The OLR intraseasonal variability was enhanced over the ECWP during positive VM events, but suppressed during negative VM events. We then investigated the connection between the FMA VMI and the coming spring (MAM) area-averaged OLR variance sequence anomalies over the ECWP (Figure 4B). As shown in Figure 4B, the correlation coefficients are 0.47 passing the 99% significant test. Furthermore, we calculated the lead-lag correlations between the FMA VMI and monthly OLR variance sequence anomalies area-averaged over the ECWP (Figure 4A). As shown in Figure 4A, the correlation over the ECWP is high when the FMA VMI leads the OLR variance by 1–2 months (R >0.27), and pass the 95% significant test. Conversely, when the FMA VMI lags the OLR variance by one month, the correlation is weak. These results indicate that, over the ECWP, there is a notable lag relationship between the VM and the intraseasonal OLR variability.
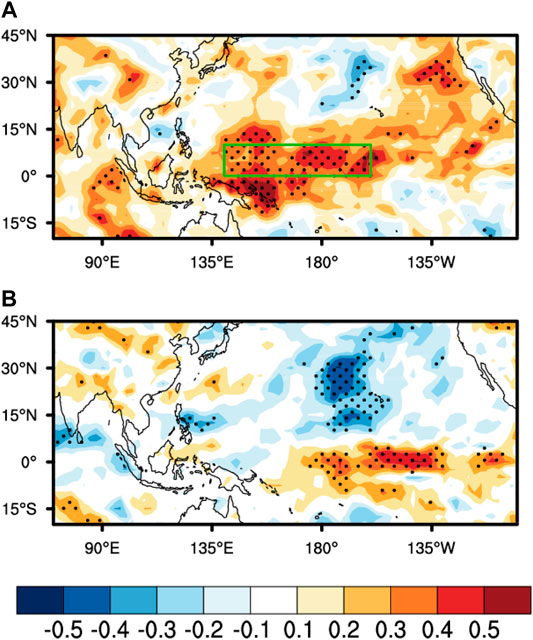
FIGURE 3. (A) Correlation between 30 and 90 days OLR variance and the VMI. (B) Correlation between 30 and 90 days OLR variance and the winter (DJF) Niño3.4 index. Correlations that exceed the 95% confidence level are stippled, based on a two-tailed Student’s t test.
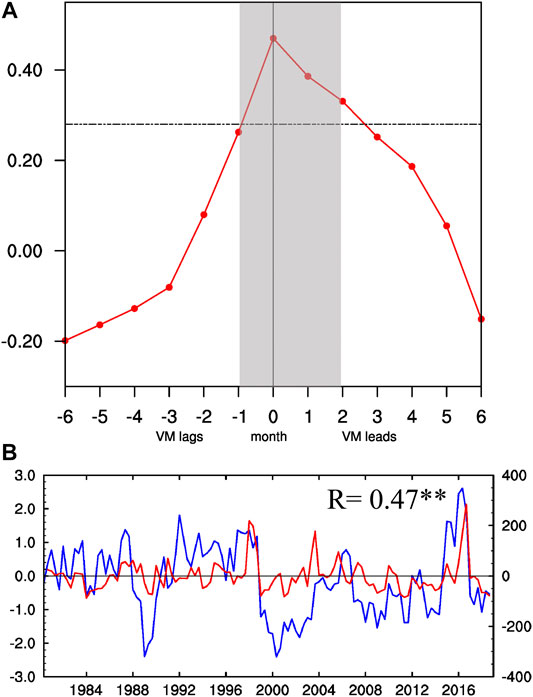
FIGURE 4. (A) Lead–lag correlation coefficients between the FMA VMI and the OLR variance area-averaged over ECWP. The horizontal dashed line indicates the 95% significance level. (B) Time series of the FMA VMI (blue line) and the OLR variance area-averaged over ECWP (red line) for the period 1979–2017.
As ENSO is a strong signal in the tropics and influences MJO activity, we examined whether the VM influence on the intraseasonal OLR variability over the ECWP is independent of ENSO. We calculated the correlation coefficient between the winter DJF (December–February) Niño3.4 index and the coming MAM filtered OLR variance sequence (Figure 3B). We note that there are relatively weak correlations between the ENSO and intraseasonal OLR variability over the ECWP. In other words, the VM and intraseasonal OLR variability have a significant connection over the ECWP, even after removing the ENSO effect. From these results, we can conclude that the VM influence on the intraseasonal OLR variability over the ECWP is relatively independent of ENSO.
In addition to the intraseasonal OLR variability, we calculated the analogous correlation coefficients of the FMA VMI with the filtered 850 hPa zonal wind variance sequence from the following MAM (Figure 5A). There is a momentous connection between the VM and intraseasonal zonal wind variability across the tropical Pacific. However, there is almost no relationship between the winter DJF Niño3.4 index and the filtered 850 hPa zonal winds variance sequence from the coming MAM (Figure 5B).
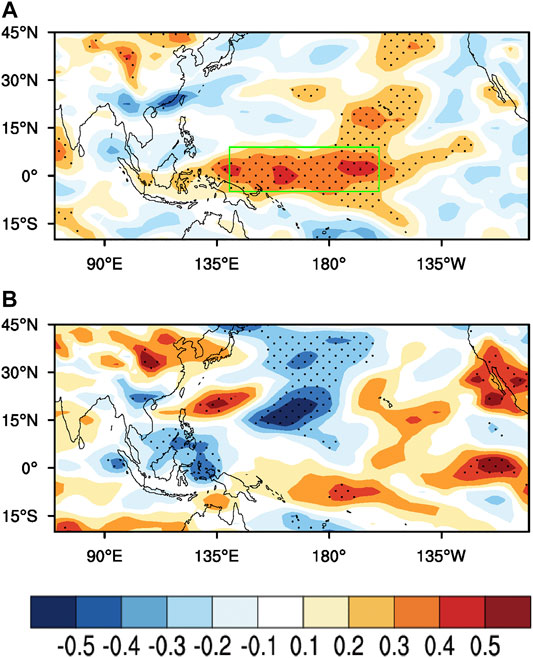
FIGURE 5. As Figure 3 but for 30–90 days 850 hPa zonal wind variance.
Victoria Mode Influence on Madden–Julian Oscillation Activity
In previous studies, composite anomalies of OLR and winds are often used to describe the MJO events (Wheeler and Hendon, 2004; DeMott et al., 2015). To better grasp the characteristics of spring MJO events, this study defined an event in which RMM amplitude was >1 for at least five days as an MJO event. Next, using the processed RMM index to screen the relevant RMM phase. For example, if we focus on MJO activities over WP, we will pay attention to RMM phase 6. To obtain the MJO events assigning to RMM phase 6, we slid the 10 days moving average to the RMM index to find the particular with RMM index amplitude >1 for at least 5 days. In particular, to avoid repeat filters of an MJO event, the period separating the individual MJO events must be more than 30 days, which is the lowest time required for a whole MJO cycle (Wheeler et al., 1999). This procedure was then repeated for the other RMM phases.
Figure 6 shows the composite trace of MJO events during negative VM events and positive VM events, described by the magenta and blue lines, respectively. The beginning and end of the MJO events in each phase are indicated by green and red boxes, respectively. The activity instances of MJO under different VM conditions are characterized by different trajectories. Hence, by considering them, we can better recognize the connection between the VM and MJO activity.
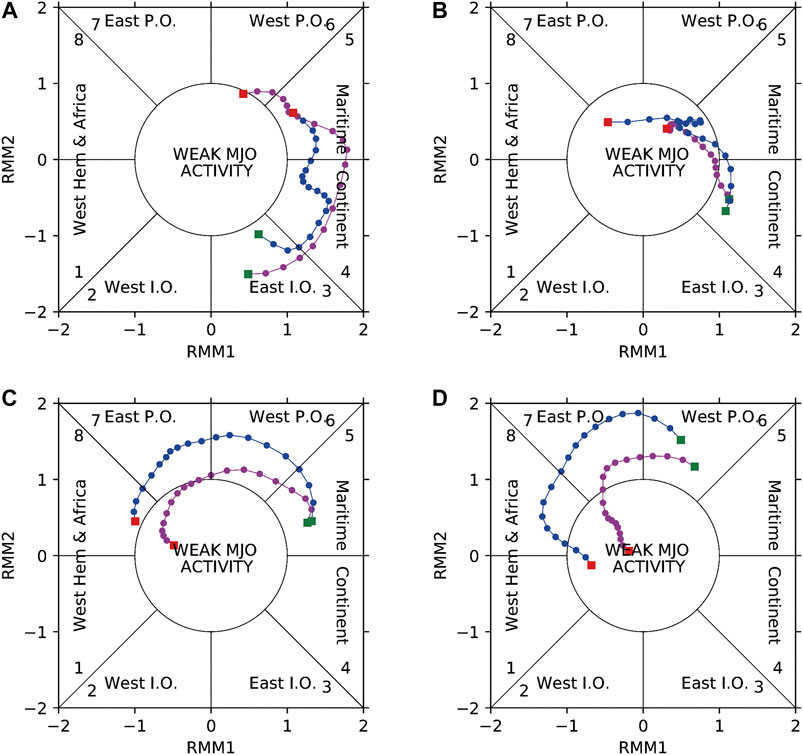
FIGURE 6. Composite trajectories in RMM phase space for MJO events that occurred during positive and negative VM events. (A)–(D) The evolution of MJO events as they enter RMM phases 3 through 6. The blue and magenta lines represent MJO events that occurred during positive and negative VM events. Green boxes represent where the MJO events begin in each phase, and red boxes show their locations 20 days later. We defined weak MJO activity as having RMM amplitude <1.
The propagation of MJO was weaker during negative VM events in most cases. This is most apparent in Figures 6C,D, in which convection is mainly gathered in the ECWP. Figures 6C,D show that during negative VM events, most MJO events weaken and even fade away almost immediately over the ECWP. In contrast, during positive VM events, the MJO events were comparably strong during RMM phase 6 and enhanced as the center of convective activity moved to the equatorial central Pacific. Taken together, Figures 6C,D suggest that during the positive (negative) VM events that the ECWP is more (less) conducive to MJO activity. These results are consistent with the intraseasonal activity anomaly patterns shown in Figures 3, 5.
To further verify the above relationship, we show two time series between 1979 and 2017 together, one for the FMA VMI and the other for the spring (MAM) occurrence frequency of the eight MJO phases (Figure 7). The total frequency of particular MJO phases in each year was obtained by adding the frequency of days in each phase in the spring of that year. In addition, the MJO amplitude must be greater than one for each calculated day. In order to highlight the interannual variation of the FMA VM, high-pass filtering is needed before computing the average time. We found that there was a stable correlation between the FMA VMI and the MAM occurrence frequency of MJO phases 6 and 7, in which correlation coefficients were 0.32 and 0.34, respectively, and both passed the 95% significant test (Figures 7F,G). The above results indicate that the FMA VM may have a positive effect on the increase of the spring (MAM) occurrence frequency of MJO phase 6 (7). These correlations are consistent with the FMA VM forcing response (Figure 2) and its coupling to the convection over the ECWP (Figures 3, 6).
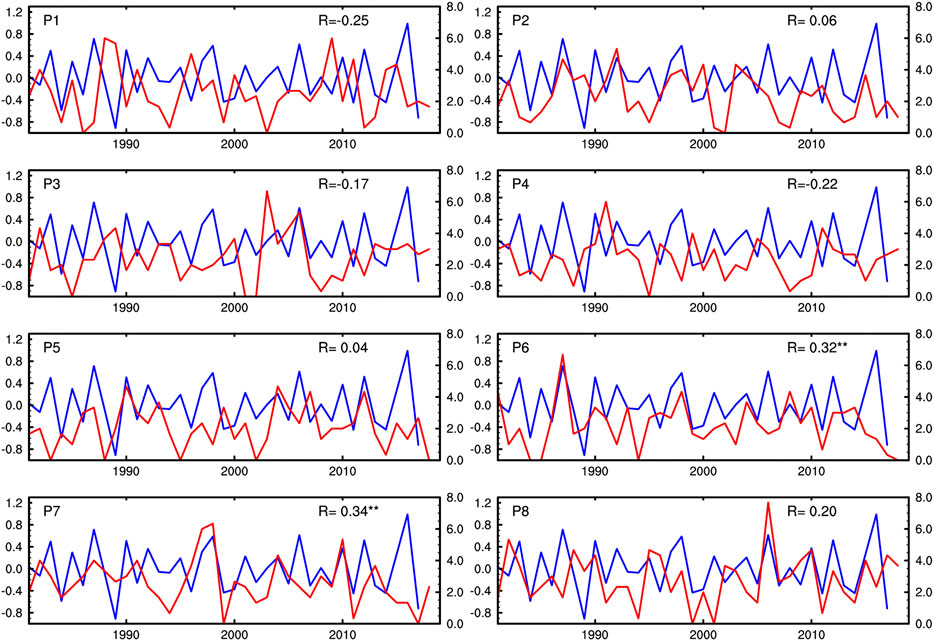
FIGURE 7. Time series of the occurrence frequency of the eight MJO phases (day; blue lines) and the revised VMI (red lines) during MAM from 1979 to 2017 based on NCEP–NCAR reanalysis data. The correlation coefficient between these two linearly detrended time series is shown in the top-right corner of each panel and the phase label in the top-left. Two asterisks indicate that the correlation coefficient is significant at the 95% confidence level based on the Student’s t test.
To verify the independence of the underlying connection between the FMA VM and the MAM occurrence frequency of MJO phases, we also selected MJO amplitudes of different sizes (1.25 and 1.50) for calculation (not shown). The results show that the relationship between the two is not affected by the selection of the MJO amplitude threshold.
Next, we looked into the impact of VM on the MJO activity by observing the OLR and wind vector fields directly. The composited OLR (shading) and wind vector anomalies during the eight MJO phases for positive (left) and negative (right) VM events in spring (MAM) are shown in Figure 8. From both the left and right panels, we see that a typical MJO event is a process that involves the convective anomaly spreading eastward from the tropical western Indian Ocean astride the Maritime Continent to the equatorial central Pacific. The patterns of convection anomalies during MJO phases 6 and 7 with positive and negative VM events are disparate (Figure 8). The tropical convection during the positive VM events is stronger than during the negative VM events over the ECWP, especially over the Maritime Continent, which is one of the key areas of MJO propagating (Zhang et al., 2005, 2013; Zhang and Ling 2017). This result can be obtained not only from the OLR anomalies but also from the wind vector anomalies.
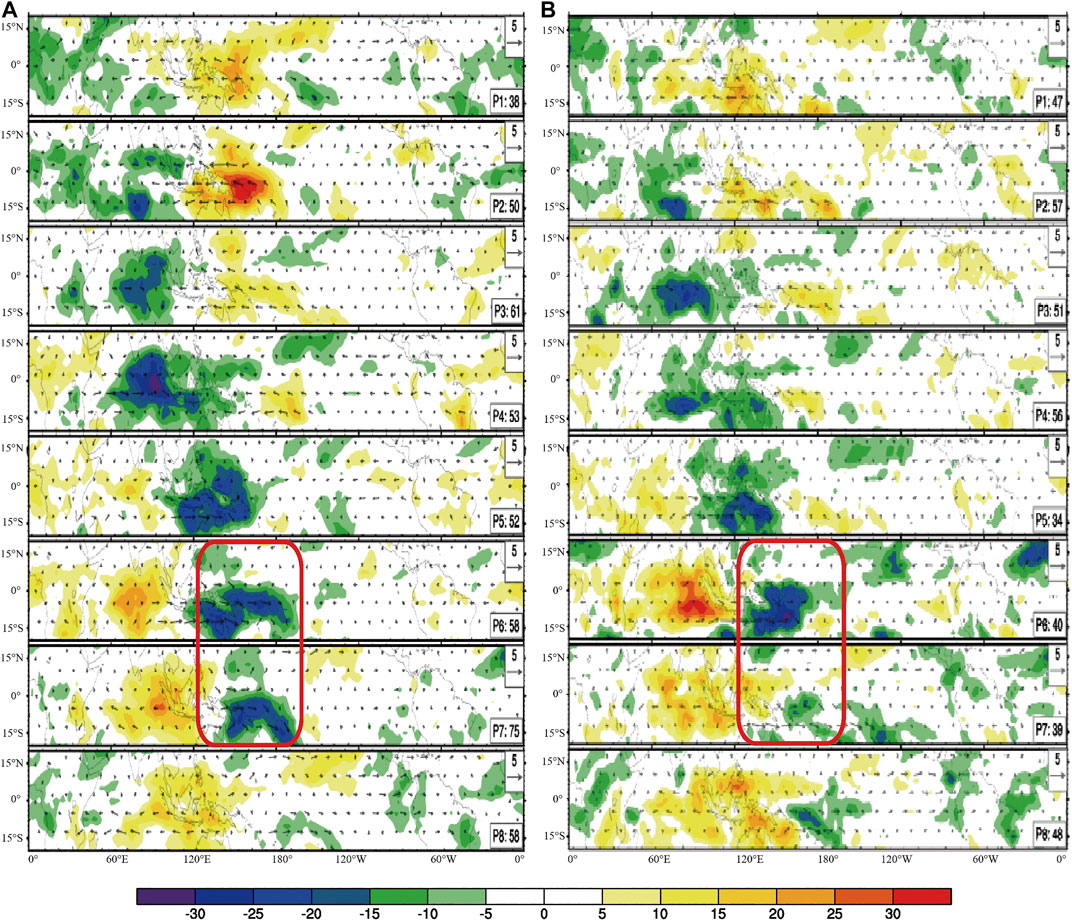
FIGURE 8. Composite OLR (color shading: W/m2) and 850 hPa wind vector (m/s) anomalies during the eight MJO phases in the boreal later spring (MAM) for (left) positive VM events and (right) negative VM events. MJO phases were defined using the RMM index. Only days with MJO amplitude >1 were used. OLR and 850 hPa wind vector anomalies were calculated by removing the daily seasonal cycle and then applying a 100 days high-pass digital filter to the daily time series. The size of the reference anomaly wind vector is in the upper right. Phases 1–8 are indicated as P1–P8, respectively, and the number of days used to create the composite are displayed on the lower right.
To reveal the potential MJO propagation differences associated with positive and negative VM events, we show Hovmöller charts for the 20–90 days filtered OLR anomalies averaged at 10°S–10°N from March to May between 1979 and 2017 (Figure 9). The composite may not represent all MJO events perfectly, but it can effectively grasp the overall difference between positive and negative VM events in MJO propagation. It is of note that the MJO exhibits a systematic eastward propagation from the tropical Indian Ocean across the Maritime Continent to the tropical eastern Pacific during positive VM events (Figure 9A), whereas it is difficult for convective anomalies to propagate eastward over the ECWP during negative VM events due to the suppressed convection (Figure 9B), which can also be seen as the Maritime Continent “barrier”, an interruption to the MJO propagation. Wang et al. (2019) used cluster analysis to divide MJO propagation patterns into four prototypes of clusters, named standing, jumping, slow eastward propagation, and fast eastward propagation, respectively. Our results demonstrate that MJO propagation exhibits a slow eastward propagation pattern during positive VM events, but a jumping pattern during negative VM events. Therefore, we conclude that the VM may be an important factor in MJO diversity.
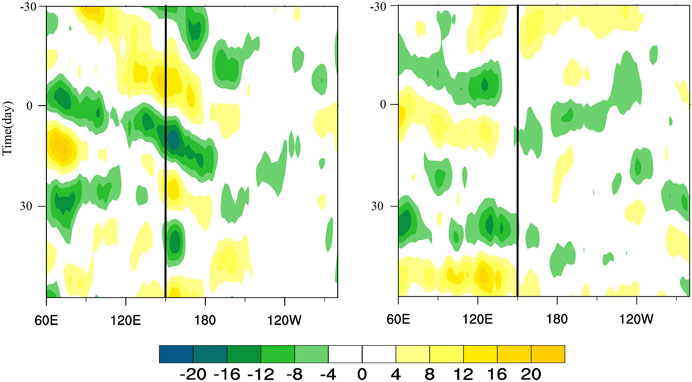
FIGURE 9. Time-longitude diagrams of 20–90 days filtered OLR anomalies averaged over 10°S–10°N (W/m2). Time 0 is when an MJO track crosses 150°E (the solid vertical lines), which marks the eastern boundary of the Maritime Continent.
Possible Mechanisms
The above results demonstrate that the FMA VM can influence MJO activity in the following spring over the ECWP. But how the VM affects MJO activity over the ECWP has yet to be determined. To identify the reasons that the VM affects the MJO, future studies will investigate the evolutionary features of vertical velocity, humidity, surface wind, and SSTAs linked to the VM.
Furthermore, we calculate the simultaneous correlation and lag correlation of the three-month average SSTAs and surface wind anomalies with the FMA VMI, respectively (Figure 10). During the FMA, a well-defined tripole-like SST type is evident in the North Pacific (Figure 10A). As a result, positive SSTAs in the central tropical Pacific, combined with negative SSTAs in the northwest North Pacific, increase the SST gradient and span the western to central tropical Pacific. The enhanced SST gradient, in turn, tends to advance the accumulation of the low-level humidity over the northwest Pacific by affecting SST-modulated heat fluxes (Blade and Hartmann, 1993; Hsu and Li, 2012; Sugiyama et al. 2009a,b), thereby leading to the convergence of the low-level humidity in the northwest Pacific, where the development of MJO convection in the lower layer is affected by the effect of moisture accumulation in the troposphere (Wang et al., 2018). Furthermore, as a response to anomalous southwesterly associated with the FMA VM in the low-level wind field (Figure 10D), the northeasterly trade winds weaken and consequently reduce the upward latent heat flux (not shown), warming the ocean from the northeastern Pacific to the ECWP and therefore leading to positive wind-evaporation-SST (WES) feedback (Xie and Philander, 1994; Sooraj et al., 2009). Finally, the positive WES feedback has an obvious amplification effect on the SSTAs near the equator, which leads to the evolution and persistence of anomalous low-level humidity and vertical velocity over the ECWP during MAM, even during April–May–June (AMJ) (Figure 10B). The above results prove the hypothesis that the VM affects MJO activity over the ECWP by positive WES feedback, enhancing the SST gradient, and increasing low-level humidity over the ECWP.
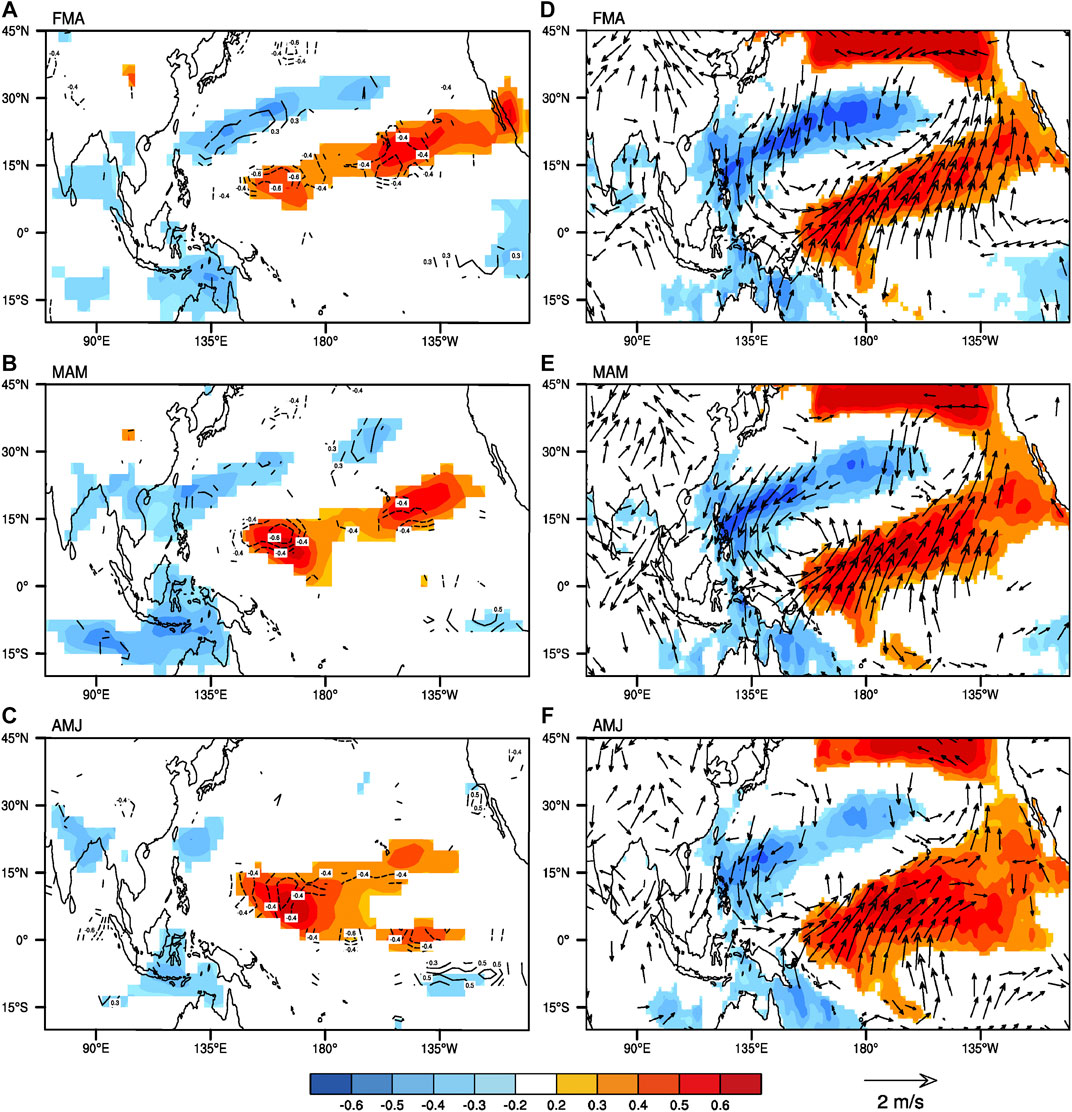
FIGURE 10. Correlation maps of the three-month 850 hPa specific humidity (g/kg; shading), vertical velocity (10−2 Pa s−1; contours) (left) and averaged SST (°C; shading), surface wind (m/s; vectors) (right) anomalies with the VMI from FMA season for simultaneous (FMA) and several lead times (MAM, AMJ). For vertical velocity, solid indicates positive anomalies, and dotted indicates negative anomalies. Only specific humidity, SST, and surface wind anomalies significant at the 90% confidence level are shown.
In addition to significant humidity anomalies over the ECWP, which are linked to the MJO, recent studies have noticed that MJO activity is associated with the equatorial moist Kelvin wave anomalies. (Salby and Hendon, 1994; Matthews, 2000; Wang et al., 1998, 2018). Wang et al. (2018) reported that the tropical central Pacific SSTAs can modulate MJO activity by adjusting the Kelvin wave response and its coupling to MJO convection. Our study has shown that positive VM events cause positive FMA SSTAs in the tropical central Pacific to persist until AMJ (Figure 10). Therefore, the SST anomaly (SSTA) forcing in the northwest Pacific, associated with positive VM events seems to be a favorable situation for the development of the MJO via the enhancement of Kelvin wave anomalies. Conversely, we can reach the homologous conclusion that the negative VM events will have an unfavorable effect on the MJO.
Model Simulations
To further confirm the difference between the effect of the VM and the ENSO (Figures 11A,B) on precipitation pattern over the ECWP, two sensitivity experiments were conducted (see experimental designs in Data and Methodology). Figures 11C,D show differences in low-level wind and precipitation in the FMA VM and El Niño runs relative to the CTRL run. The results of the two sensitivity experiments both show that there are two centers of positive and negative wind and precipitation anomalies in the equatorial region. In the FMA VM experiment, two precipitation centers of positive and negative are forced over the ECWP and west of MC (Figure 11C), which matches the effect of VM on the precipitation pattern in the equatorial obtained from the reanalysis data in Figure 2. In contrast, the El Niño associated SSTAs in the tropical Pacific, can affect a wider range of precipitation over the equatorial region but the center of the positive and negative precipitation it produces is more easterly (Figure 11D). The difference in the impact of the two sensitivity experiments on precipitation may be caused by the difference in the wind. In the FMA VM experiment, an anomalous anticyclone is forced over the western North Pacific but an anomalous cyclonic circulation has been produced in the El Niño experiments. The extratropical Pacific SST forcing can simulate the observed responses of precipitation over ECWP well, which further confirms that the influence of the VM and ENSO on the precipitation over ECWP are independent. The above results are also consistent with those of Ding et al. (2015), who conclude that there is a difference in the influence of ENSO and VM on the location of precipitation over the tropical Pacific.
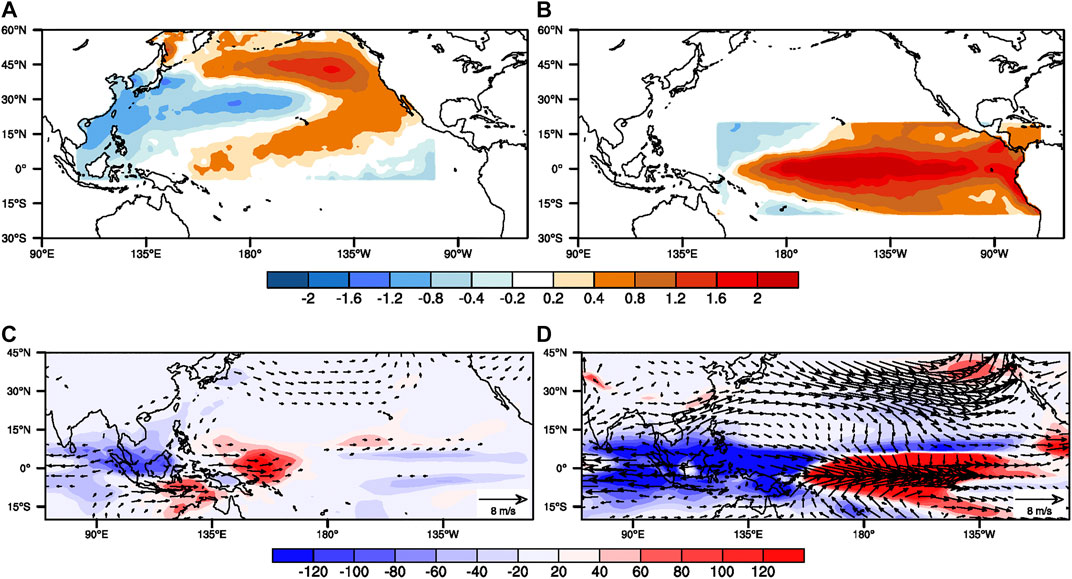
FIGURE 11. (A), (B) Averaged SST anomaly patterns specified in (A) the VM run and (B) the El Niño run from February to April (C), (D) Ensemble-mean FMA response of 850 hPa wind (vectors; m/s) and precipitation (shading; mm/month) to the tropical Pacific SST forcings in (A), (B), respectively.
To further confirm that there is a fundamental connection between the FMA VM over the extratropical region and following MJO activity in the tropics over the ECWP, we analyzed individual models from CMIP5. It should be noted that the simulation results of VM and MJO in the CMIP5 (Chen et al., 2020) are not perfectly in the same mode. Therefore, the following two modes, which can certainly simulate MJO and VM, are selected in this study (Table 1).
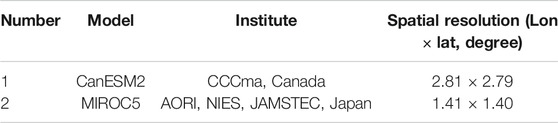
TABLE 1. Models used in this study.
First, we used the monthly output data of SST by the CanESM2 to calculate the VMI. A correlation analysis method was then used between the FMA VMI and the tropical precipitation and OLR anomalies in the following MAM (Figures 12A,B). The distribution of precipitation and OLR correlation is not uniform in space by CanESM2, but it is a notable dipole type like observational data. Over the equatorial Pacific, there are significant positive correlations. Especially, the correlations of the OLR anomalies are almost inconsistent with those of precipitation anomalies over the ECWP. In the output data by the MIROC5, a conclusion similar to Figure 12 can also be obtained (Figures 13C,D). Therefore, the above results indicate that the strong correlation between FMA VMI and convection (precipitation) over the ECWP in the following MAM can be reproduced in partly CMIP5 models.
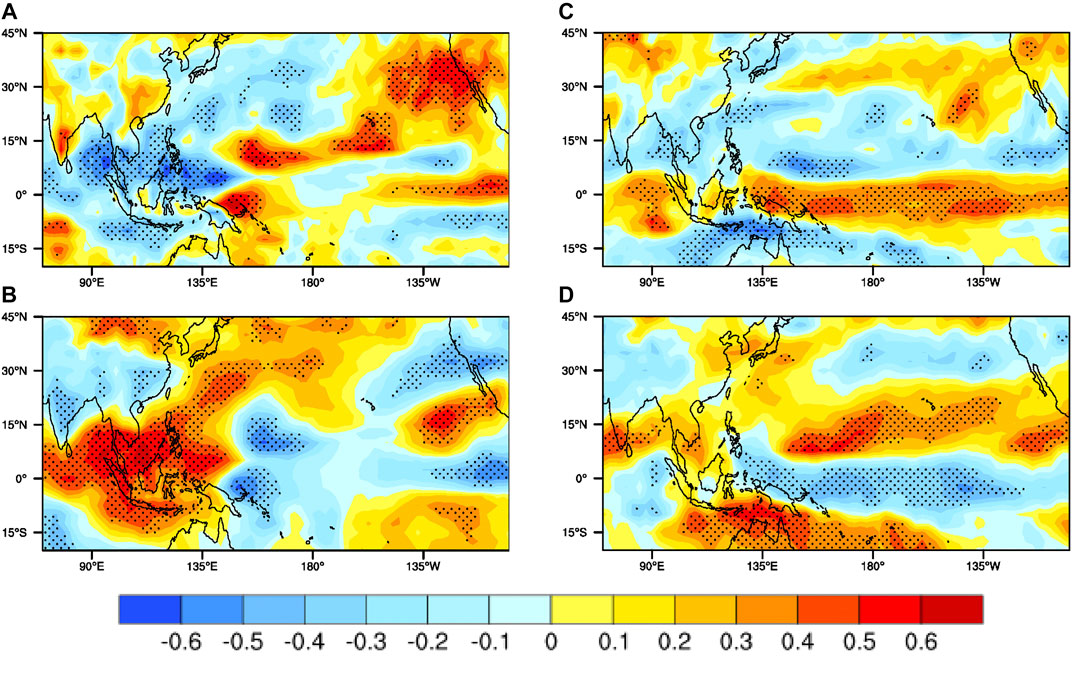
FIGURE 12. (A) Correlation map of the FMA VMI with the following spring precipitation anomalies by the output data of the CanESM2. (B) As (A) but for the correlations between the FMA VMI and the following spring OLR anomalies. (C) As (A) but for the MIROC5. (D) As (B) but for the MIROC5. Only anomalies exceeding 95% significance, based on a two-tailed Student’s t test, are shown.
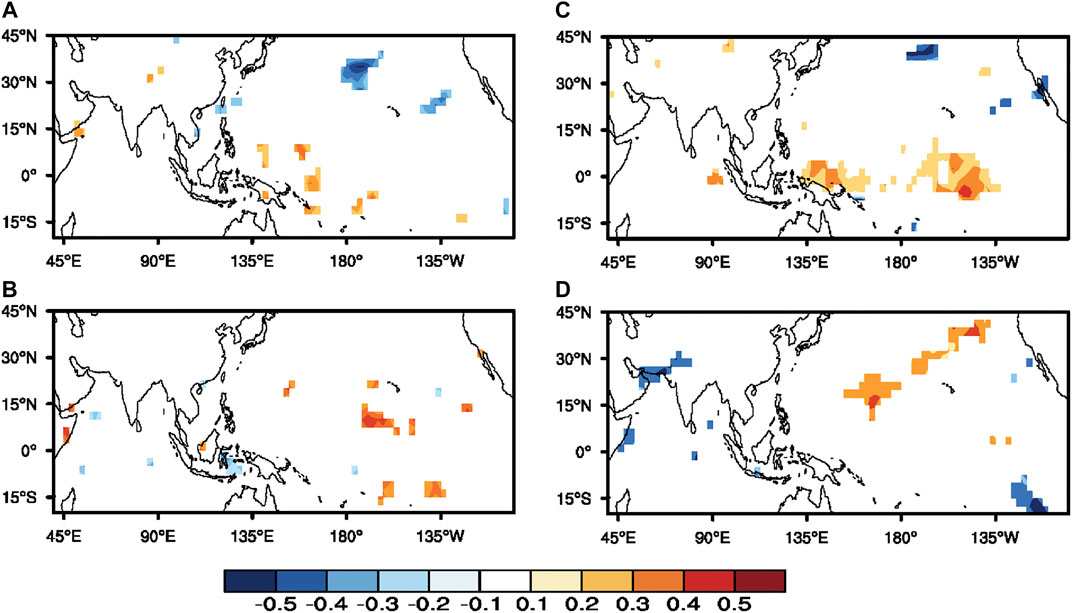
FIGURE 13. (A) Correlation between 30 and 90 days OLR variance and the VMI by the output data of the MRIOC5. (B) Correlation between 30 and 90 days OLR variance and the winter (DJF) Niño3.4 index by the output data of the MRIOC5. (C) as (A), (D) as (B) but for by the CanESM2. Correlation coefficients are significant at the 95% confidence level.
Next, we investigated the connection between the intraseasonal activity and VM over the ECWP from the partly CMIP5 models. To facilitate this analysis, we used the variance sequence of the 30–90-days filtered OLR anomalies as surrogates for intraseasonal activity signal. The correlation coefficients of the FMA VMI with the filtered OLR variance sequence from the following MAM calculated by the output data of partly CMIP5 are shown in Figures 13A,C. There are also two significantly correlated centers between the FMA VM and the intraseasonal variability of OLR over the ECWP. Then, we calculated the correlation coefficients between the winter DJF (December–February) Niño3.4 index and the coming MAM filtered OLR variance sequence (Figures 13B,D). We noted that there were relatively weak correlations between the ENSO and intraseasonal OLR variability over the ECWP. From these results, we can conclude that the relationship between the VM and the intraseasonal OLR variability over the ECWP can be reproduced in partly CMIP5 models and that they are relatively independent of ENSO.
Furthermore, we calculated the simultaneous correlation and lag correlation of the three-month average SSTAs and surface wind anomalies with the FMA VMI by the output data of CanESM2, respectively (Figure 14). It can be seen from Figure 14 that the results obtained by the model data are generally consistent with the observation data. The VM affects MJO activity over the ECWP by enhancing the SST gradient and increasing low-level humidity and changing the enhancement of Kelvin wave anomalies.
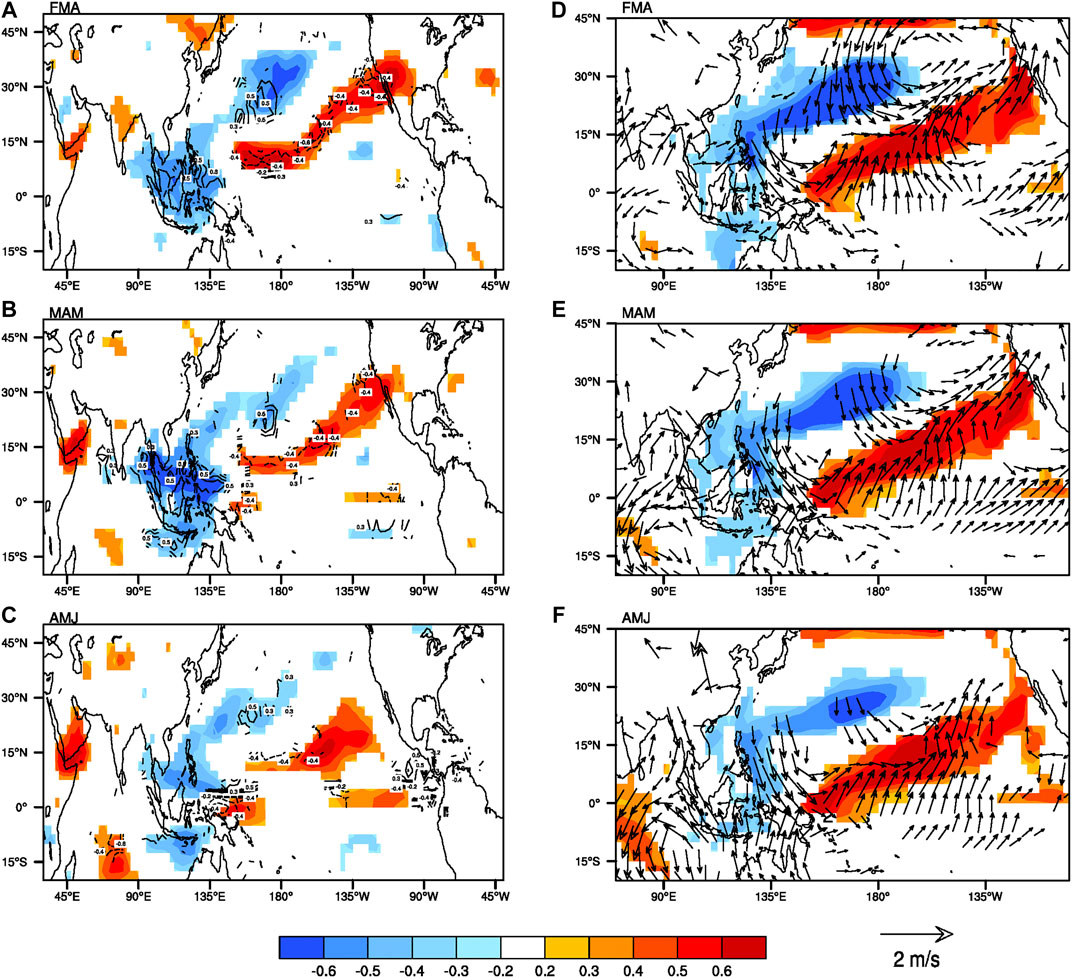
FIGURE 14. Correlation maps of the three-month 850 hPa specific humidity (g/kg; shading), vertical velocity (10−2 Pa s−1; contours) (left) and averaged SST (°C; shading), surface wind (m/s; vectors) (right) anomalies with the VMI from FMA season for simultaneous (FMA) and several lead times (MAM, AMJ) by the output data of the CanESM2. For vertical velocity, solid indicates positive anomalies and dotted indicates negative anomalies. Only specific humidity, SST and surface wind anomalies significant at the 90% confidence level are shown.
Summary and Discussion
This study has examined the connection between the FMA VM and ensuing MAM MJO activity over the ECWP by using observational data and partly CMIP5 models. This study has shown that the atmospheric variations related to the VM may be significant factors in affecting MJO activity. The ECWP appears to be more beneficial for MJO propagation during positive VM events than during negative VM events. During positive VM events, the evolution and persistence of MJO are stronger over the ECWP, while negative VM propagates are the opposite (Figures 6, 8, 9), which proves this conclusion. This result is not surprising given that preceding studies have also reported on convection activity and precipitation intensity increases over the central-eastern Pacific ITCZ region during positive VM events (Ding et al., 2015a). It is also supported by our modeling experiments in which we examined composite SSTAs of the FMA VM (5°S-60°N, 105°E-110°W) and the preceding DJF Niño3.4 region over the tropical Pacific from February to April. The observed precipitation pattern differences in the ECWP that are associated with FMA VM and preceding ENSO are effectively simulated by these modeling experiments. Wang et al. (2018) also showed that the eastward propagation of the MJO over the CP may be affected by the background SSTAs in that region.
We also found that the VM may be an important factor that is responsible for MJO diversity. Wang et al. (2018) used cluster analysis to divide MJO propagation patterns into four prototypes of clusters, and named them standing, jumping, slow eastward propagation, and fast eastward propagation, respectively. Our results demonstrate that MJO propagation exhibits a slow eastward propagation pattern during positive VM events, but a jumping pattern during negative VM events.
The schematic model in Figure 15 shows the processes by which the FMA VM might affect the following MAM MJO activity. One possible description for these connections is that the SST gradient anomalies associated with positive VM events enhance low-level convergence over the ECWP. Meanwhile, SSTA forcing in the CP enhances the Kelvin wave anomalies. As a result, MJO development is favored in this region. This hypothesis is further supported by other MJO theories, such as wave-CISK (Wang and Rui, 1990; DeMott et al., 2015), and MJO moisture mode theories (Sobel et al., 2010, 2013), which point out that the MJO is strongly dependent on the accumulation of moisture in the low-level.
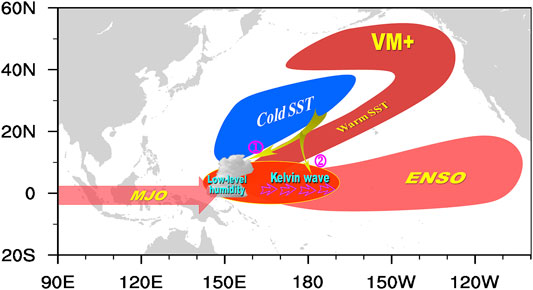
FIGURE 15. Schematic representation of the thermodynamic ocean-atmosphere coupling between the MJO and SSTAs associated with the VM. The VM possibly influences the MJO activity through two dominant processes: one is the SST gradient anomalies associated with positive VM events that enhance low-level convergence over the equatorial central-western Pacific (ECWP), and the other is warm SST anomalies in the equatorial central Pacific that increase Kelvin wave anomalies. Therefore, the VM enhances MJO activity over the ECWP.
Other factors may also play a role in influencing the connection between VM on MJO activity. For example, Pu and Chen (2019) argue that the FMA VM exhibits a strong connection with tropical cyclone frequency in the following summer over the western North Pacific. It is necessary to investigate the influence of tropical cyclones on MJO development during VM events. This may further reveal the role of extratropical signals in the development and propagation of MJO.
Data Availability Statement
The raw data supporting the conclusions of this article will be made available by the authors, without undue reservation.
Author Contributions
All authors listed have made a substantial, direct and intellectual contribution to the work, and approved it for publication
Funding
This work was jointly supported by the National Program on Global Change and Air-Sea Interaction (GASI-IPOVAI-03, GASI-IPOVAI-06). Thanks to the UK Met Office Hadley Center, NCEP/NCAR, NASA, and Australian Bureau of Meteorology for data and support.
Conflict of Interest
The authors declare that the research was conducted in the absence of any commercial or financial relationships that could be construed as a potential conflict of interest.
Acknowledgments
The numerical calculations in this paper have been done on the supercomputing system in the Supercomputing Center of Nanjing University of Information Science and Technology.
References
Adames, A. F., and Wallace, J. M. (2014). Three-dimensional structure and evolution of the MJO and its relation to the mean flow. J. Atmos. Sci. 71, 2007–2026. doi:10.1175/JAS-D-13-0254.1
Alexander, M. A., Vimont, D. J., Chang, P., and Scott, J. D. (2010). The impact of extratropical atmospheric variability on ENSO: testing the seasonal footprinting mechanism using coupled model experiments. J. Clim. 23, 2885–2901. doi:10.1175/2010JCLI3205.1
Ambaum, M. H. P., Hoskins, B. J., and Stephenson, D. B. (2001). Arctic oscillation or North Atlantic oscillation? J. Clim. 14, 3495–3507. doi:10.1175/1520-0442(2001)014<3495:AOONAO>2.0.CO;2
Blade, I., and Hartmann, D. L. (1993). Tropical intraseasonal oscillations in a simple nonlinear model. J. Atmos. Sci. 50, 2922–2939. doi:10.1175/1520-0469(1993)050<2922:TIOIAS>2.0.CO;2
Bond, N. A., Overland, J. E., Spillane, M., and Stabeno, P. (2003). Recent shifts in the state of the north pacific. Geophys. Res. Lett. 30, 2183. doi:10.1029/2003GL018597
Bretherton, C. S., Widmann, M., Dymnikov, V. P., Wallace, J. M., and Bladé, I. (1999). The effective number of spatial degrees of freedom of a time-varying field. J. Clim. 12, 1990–2009. doi:10.1175/1520-0442(1999)012<1990:TENOSD>2.0.CO;2
Chen, G., Ling, J., Li, C., Zhang, Y., and Zhang, C. (2020). Barrier effect of the indo-pacific Maritime continent on MJO propagation in observations and CMIP5 models. J. Clim. 33, 5173–5193. doi:10.1175/JCLI-D-19-0771.1
DeMott, C. A., Klingaman, N. P., and Woolnough, S. P. (2015). Atmosphere‐ocean coupled processes in the Madden‐Julian oscillation. Rev. Geophys. 53, 1099–1154. doi:10.1002/2014RG000478
Ding, R. Q., Li, J. P., Tseng, Y. H., and Ruan, C. Q. (2015a). Influence of the north pacific Victoria mode on the pacific ITCZ summer precipitation. J. Geophys. Res. Atmos. 120, 964–979. doi:10.1002/2014JD022364
Ding, R. Q., Li, J. P., Tseng, Y. H., Sun, C., and Guo, Y. P. (2015b). The Victoria mode in the North Pacific linking extratropical sea level pressure variations to ENSO. J. Geophys. Res. Atmos. 120, 27–45. doi:10.1002/2014JD022221
Duchon, C. (1979). Lanczos filtering in one and two dimensions. J. Appl. Meteorol. 18, 1016–1022. doi:10.1175/1520-0450(1979)018<1016:LFIOAT>2.0.CO;2
Hendon, H. H., Wheeler, M. C., and Zhang, C. (2007). Seasonal dependence of the MJO–ENSO relationship. J. Clim. 20, 531–543. doi:10.1175/JCLI4003.1
Hsu, P. C., and Li, T. (2012). Role of the boundary layer moisture asymmetry in causing the eastward propagation of the madden-julian oscillation. J. Clim. 25, 4914–4931. doi:10.1175/JCLI-D-11-00310.1
Jones, C., Waliser, D. E., Lau, K. M., and Stern, W. (2004). Global occurrences of extreme precipitation and the Madden-Julian oscillation: observations and predictability. J. Clim. 17, 4575–4589. doi:10.1175/3238.1
Kalnay, E., Tisu, M. K., Kistler, R., Collins, W. G., Deaven, D., and Gandin, L. S. (1996). The NCEP/NCAR 40-year reanalysis project. Bull. Am. Meteorol. Soc. 77, 437–471. doi:10.1175/1520-0477(1996)077<0437:TNYRP>2.0.CO;2
Liebmann, B., and Smith, C. A. (1996). Description of a complete (interpolated) outgoing longwave radiation dataset. Bull. Am. Meteorol. Soc. 77, 1275–1277.
Lin, H., Brunet, G., and Derome, J. (2009). An observed connection between the North Atlantic oscillation and the Madden–Julian oscillation. J. Clim. 22, 364–380. doi:10.1175/2008JCLI2515.1
Madden, R. A., and Julian, P. R. (1972). Description of global scale circulation cells in the Tropics with a 40–50 day period. J. Atmos. Sci. 29, 1109–1123. doi:10.1175/1520-0469(1972)029<1109:DOGSCC>2.0.CO;2
Madden, R. A., and Julian, P. R. (1971). Detection of a 40–50 day oscillation in the zonal wind in the tropical Pacific. J. Atmos. Sci. 28, 702–708. doi:10.1175/1520-0469(1971)028<0702:DOADOI>2.0.CO;2
Mantua, N. J., Hare, S. R., Zhang, Y., Wallace, J. M., and Francis, R. M. (1997). A Pacific interdecadal climate oscillation with impacts on salmon production. Bull. Am. Meteorol. Soc. 78, 1069–1079. doi:10.1175/1520-0477(1997)078<1069:APICOW>2.0.CO;2
Matthews, A. J. (2000). Propagation mechanisms for the madden-julian oscillation. Q. J. R. Meteorol. Soc. 126, 2637–2651. doi:10.1002/qj.49712656902
Moon, J., Wang, B., and Ha, K. (2011). ENSO regulation of MJO teleconnection. Clim. Dynam. 37, 1133–1149. doi:10.1007/s00382-010-0902-3
Pohl, B., and Matthews, A. J. (2007). Observed changes in the lifetime and amplitude of the Madden-Julian oscillation associated with interannual ENSO sea surface temperature anomalies. J. Clim. 20, 2659–2674. doi:10.1175/JCLI4230.1
Pu, X. S., Chen, Q. L., Zhong, Q. J., Ding, R. Q., and Liu, T. (2019). Influence of the north pacific Victoria mode on western North pacific tropical cyclone genesis. Clim. Dynam. 52, 245–256. doi:10.1007/s00382-018-4129-z
Rayner, N. A., Brohan, P., Parker, D. E., Folland, C. E., Kennedy, J. J., Vanicek, M., et al. (2006). Improved analyses of changes and uncertainties in sea surface temperature measured in situ since the mid-nineteenth century: the HadSST2 dataset. J. Clim. 19, 446–469. doi:10.1175/JCLI3637.1
Salby, M. L., and Hendon, H. H. (1994). Intraseasonal behavior of clouds, temperature, and motion in the tropics. J. Atmos. Sci. 51, 2207–2224. doi:10.1175/1520-0469(1994)051<2207:IBOCTA>2.0.CO;2
Seo, K. H., Wang, W. Q., Gottschalck, J., Zhang, Q., Schemm, J. K. E., Higgins, W. R., et al. (2009). Evaluation of MJO forecast skill from several statistical and dynamical forecast models. J. Clim. 22, 2372–2388. doi:10.1175/2008JCLI2421.1
Shinoda, T., and Han, W. Q. (2005). Influence of the Indian Ocean dipole on atmospheric subseasonal variability. J. Clim. 18, 3891–3909. doi:10.1175/JCLI3510.1
Sobel, A., and Maloney, E. (2013). Moisture modes and the eastward propagation of the MJO. J. Atmos. Sci. 70, 187–192. doi:10.1175/JAS-D-12-0189.1
Sobel, A. H., Maloney, E. D., Bellon, G., and Frierson, D. M. (2010). Surface fluxes and tropical intraseasonal variability: a reassessment. J. Adv. Model. Earth Syst. 2, 27. doi:10.3894/JAMES.2010.2.2
Sooraj, K. P., Kim, D., Kug, J. S., Yeh, S. W., Jin, F. F., and Kang, I. S. (2009). Effects of the low-frequency zonal wind variation on the high frequency atmospheric variability over the tropics. Clim. Dynam. 33, 495–507. doi:10.1007/s00382-008-0483-6
Sreekala, P. P., Rao, S. V. B., Rajeevan, K., and Arunachalam, M. S. (2018). Combined effect of MJO, ENSO and IOD on the intraseasonal variability of northeast monsoon rainfall over south peninsular India. Clim. Dynam. 51, 3865–3882. doi:10.1007/s00382-018-4117-3
Sugiyama, M. (2009a). The moisture mode in the Quasi-equilibrium tropical circulation model. Part I: analysis based on the weak temperature gradient approximation. J. Atmos. Sci. 66, 1507–1523. doi:10.1175/2008JAS2690.1
Sugiyama, M. (2009b). The moisture mode in the Quasi-equilibrium tropical circulation model. Part II: nonlinear behavior on an equatorial beta plane. J. Atmos. Sci. 66, 1525–1542. doi:10.1175/2008JAS2691.1
Tam, C. Y., and Lau, N. C. (2005). Modulation of the Madden-Julian oscillation by ENSO: inferences from observations and GCM simulations. J. Meteorol. Soc. Jpn. 83, 727–743. doi:10.2151/jmsj.83.727
Vecchi, G. A. (2004). The Madden-Julian Oscillation (MJO) and northern high latitude wintertime surface air temperatures. Geophys. Res. Lett. 31, L04104. doi:10.2151/jmsj.83.727
Wallace, J. M., and Thompson, D. W. J. (2002). The Pacific center of action of the Northern Hemisphere annular mode: real or artifact? J. Clim. 15, 1987–1991. doi:10.1175/1520-0442(2002)015<1987:TPCOAO>2.0.CO;2
Wang, B. (1988). Dynamics of tropical low-frequency waves - an analysis of the moist Kelvin wave. J. Atmos. Sci. 45, 2051–2065. doi:10.1175/1520-0469(1988)045<2051:DOTLFW>2.0.CO;2
Wang, B., Chen, G. S., and Liu, F. (2019). Diversity of the madden-julian oscillation. Sci. Adv. 5, eaax0220. doi:10.1126/sciadv.aax0220
Wang, B., and Rui, H. (1990). Dynamics of the coupled moist Kelvin-rossby wave on an equatorial beta-plane. J. Atmos. Sci. 47, 397–413. doi:10.1175/1520-0469(1990)047<0397:DOTCMK>2.0.CO;2
Wang, F., Tian, W., Xie, F., Zhang, J., and Han, Y. (2018). Effect of madden–julian oscillation occurrence frequency on the interannual variability of northern Hemisphere stratospheric wave activity in winter. J. Clim. 31, 5031–5049. doi:10.1175/JCLI-D-17-0476.1
Webster, P. J., Moore, A. M., Loschnigg, J. P., and Leben, R. R. (1999). Coupled ocean-atmosphere dynamics in the Indian Ocean during 1997–98. Nature 401, 356–360. doi:10.1038/43848
Weickmann, K. M. (1983). Intraseasonal circulation and outgoing longwave radiation modes during northern Hemisphere winter. Mon. Weather Rev. 111, 1838–1858. doi:10.1175/1520-0493(1983)111<1838:ICAOLR>2.0.CO;2
Wheeler, M. C., and Hendon, H. H. (2004). An all-season real-time multivariate MJO index: development of an index for monitoring and prediction. Mon. Weather Rev. 132, 1917–1932. doi:10.1175/1520-0493(2004)132<1917:AARMMI>2.0.CO;2
Wheeler, M. C., and Hendon, H. H. (2017). An all-season real-time multivariate MJO index: development of an index for monitoring and prediction. Mon. Weather Rev. 145.
Wilson, E. A., Gordon, A. L., and Kim, D. (2013). Observations of the madden julian oscillation during Indian Ocean Dipole events. J. Geophys. Res. Atmos. 118, 2588–2599. doi:10.1002/jgrd.50241
Woolnough, S. J., Slingo, J. M., and Hoskins, B. J. (2000). The relationship between convection and sea surface temperature on intraseasonal timescales. J. Clim. 13, 2086–2104. doi:10.1175/1520-0442(2000)013<2086:TRBCAS>2.0.CO;2
Xie, P. P., and Arkin, P. A. (1997). Global precipitation: a 17-year monthly analysis based on gauge observations, satellite estimates, and numerical model outputs. Bull. Am. Meteorol. Soc. 78, 2539–2558. doi:10.1175/1520-0477(1997)078<2539:GPAYMA>2.0.CO;2
Yoo, C., Feldstein, S., and Lee, S. (2011). The impact of the Madden-Julian Oscillation trend on the Arctic amplification of surface air temperature during the 1979-2008 boreal winter. Geophys. Res. Lett. 38, L24804. doi:10.1029/2011GL049881
Yoo, C., Lee, S., and Feldstein, S. B. (2012). Mechanisms of arctic surface air temperature change in response to the madden-julian oscillation. J. Clim. 25, 5777–5790. doi:10.1175/JCLI-D-11-00566.1
Zhang, C., and Zhang, B. (2018). QBO-MJO connection. J. Geophys. Res. Atmos. 123, 2957–2967. doi:10.1002/2017JD028171
Zhang, C., and Ling, J. (2017). Barrier effect of the indo-pacific Maritime continent on the MJO: perspectives from tracking MJO precipitation. J. Clim. 30, 3439–3459. doi:10.1175/JCLI-D-16-0614.1
Keywords: Madden Julian oscillation, Victoria mode, air-sea coupling, barrier effect, coupled model intercomparison project phase 5
Citation: Wen T, Chen Q, Li J, Ding R, Tseng Y-h, Hou Z and Li X (2020) Influence of the North Pacific Victoria Mode on the Madden–Julian Oscillation. Front. Earth Sci. 8:584001. doi: 10.3389/feart.2020.584001
Received: 16 July 2020; Accepted: 12 October 2020;
Published: 23 November 2020.
Edited by:
Jasti S. Chowdary, Indian Institute of Tropical Meteorology (IITM), IndiaReviewed by:
Maoqiu Jian, Sun Yat-sen University, ChinaKaiming Hu, Institute of Atmospheric Physics (CAS), China
Copyright © 2020 Wen, Chen, Li, Ding, Tseng, Hou and Li. This is an open-access article distributed under the terms of the Creative Commons Attribution License (CC BY). The use, distribution or reproduction in other forums is permitted, provided the original author(s) and the copyright owner(s) are credited and that the original publication in this journal is cited, in accordance with accepted academic practice. No use, distribution or reproduction is permitted which does not comply with these terms.
*Correspondence: Ruiqiang Ding, drq@bnu.edu.cn