 R. Guardo
 L. De Siena
 C. Dreidemie3
- 1Instituto de Investigaciòn en Paleobiologìa y Geologìa, UNRN, CONICET, IIPG, General Roca, Argentina
- 2Institute of Geosciences, Johannes Gutenberg University, Mainz, Germany
- 3LVCC Laboratorio de Investigaciòn y Desarrollo en Tecnologìas de Visualizaciòn, Computaciòn Gràfica y Còdigo Creativo, Universidad Nacional de Rìo Negro, San Carlos de Bariloche, Argentina
High-resolution seismic imaging enables the reconstruction of ascending paths of magma and fluids, shallow molten accumulation and flank collapse areas, all crucial information for developing an efficient eruption forecasting strategy. Here, the Marching Cubes algorithm (MC - generally applied to medical visualization and three-dimensional (3D) modeling) is applied to 16 years of earthquake location data at Mt. Etna (Italy). The algorithm defines three-dimensional seismic clusters that take into account seismic location uncertainties and are embedded in a novel volcano-oriented Geographyc Information Systems (VolGIS) offering an interpretational environment comprising tomographic images and alternative geophysical models. The results show that a volume of very-low-seismicity is embedded in a high-velocity body, and acts as a zone of transition between transient magmatic events (west) and eastern deep seismicity related to the sliding eastern flank. The eastern cluster represents the 3D seismic signature of a deep (2–8 km below sea level) instability, affecting the portion of the eastern flank nearest to the feeding systems. This instability is likely caused by a combination of gravitational spreading and magmatic intrusions.
1 Introduction
Imaging a volcano with seismic waves is challenging but rewarding. A reliable image of the structural features of a volcano allows to reconstruct the regions where molten materials rise across the lithosphere (Jaxybulatov et al., 2014; Huang et al., 2015). These images can be linked with field observations, giving us a clear picture of ongoing volcano dynamics (Patanè et al., 2003). They can also discriminate zones of fluid and magma accumulation (Koulakov, 2013) as well as interfaces that release stress at depth (De Siena et al., 2017), providing better constraints for seismic and volcanic hazard assessment. Regardless, the resolution of these maps is of the order of kilometres. Seismic locations, and particularly their “clustering,” generally recorded across short periods of unrest, are often used to interpret tomographic anomalies, and from these the larger-scale dynamics leading to volcanism (e.g., Giampiccolo et al., 2020). It is thus necessary: 1) to develop more quantitative methods to define seismic clustering at a volcano; 2) to apply these methods to seismic locations recorded across years or decades, most likely to represent stationary or recurrent processes at a volcano.
Such an ideal dataset of seismic locations is available at Mt. Etna volcano. Mt. Etna is one of the most hazardous and monitored volcanoes in the world due to both its persistent eruptive activity and its proximity to highly-urbanized areas. The volcano is monitored by permanent and mobile networks and produces dense seismicity related to eruptive events and volcanic unrests (Alparone et al., 2015; Gruppo Analisi Dati Sismici, 2017). This seismicity has been used for decades to image shape, dimension and location of the volcano feeding systems with seismic tomography. The resolution of the resulting models, reaching a maximum depth of 20 km, has steadily increased (Sharp et al., 1980; Hirn et al., 1991; Cardaci et al., 1993; De Luca et al., 1997; Villaseñor et al., 1998). From the beginning of this century, researchers have interpreted the models jointly with remote sensing and field data, providing reliable interpretations of the shallow volcano dynamics (De Gori et al., 1999; Chiarabba et al., 2000; Laigle et al., 2000; Patanè et al., 2002; Patanè et al., 2003; Chiarabba et al., 2004; Patanè et al., 2006; Alparone et al., 2012; Díaz-Moreno et al., 2018; Giampiccolo et al., 2020). These studies have progressively recognized and improved the reconstruction of a high-velocity body (HVB) below both the central cone and the eastern sides of the volcano (De Gori et al., 1999; Alparone et al., 2012; Giampiccolo et al., 2020), generally interpreted as a solidified intrusive body (Aloisi et al., 2002; Patanè et al., 2006; Alparone et al., 2012).
Unfortunately, seismic tomography models are affected by uneven resolution and instabilities caused by insufficient ray coverage (Rawlinson and Spakman, 2016). This makes it difficult, if not impossible, to model structures smaller than 1–2 km in an ever-changing volcanic environment (Koulakov, 2013). Due to the intrinsic limitations of the datasets used and the uncertainties related to ray-tracing algorithms in volcanic edifices, the highest resolution achieved by tomography on both the HVB and the nearby feeding systems is 1 km (De Gori et al., 1999; Alparone et al., 2012; Giampiccolo et al., 2020). The thickness of dikes is of the order of a few meters (Gudmundsson, 1983; Tibaldi, 2015), resolving them with travel time tomography is likely impossible. Also, there are strong uncertainties when detecting magma accumulation with tomography as demonstrated at Krafla volcano, where extensive geophysical imaging was available since the 90s (e.g., Julian et al., 1993). Based on these models, no large magma accumulation region was expected between depths of 3 and 7 km under the central caldera, at least until a deep geothermal well didn’t drill into rhyolitic magma at these depths in 2009. Even novel tomographic imaging performed after drilling is unable to reconstruct magma at these depths at resolutions higher than 2 km3 (Schuler et al., 2015).
Despite the dense seismicity and coverage offered by several seismic arrays, all recent tomographic works at Etna focus on specific time intervals related to volcanic eruptions (e.g., Patanè et al., 2002; Giampiccolo et al., 2020). In this way, the tomographic maps can be interpreted using geological and geophysical data produced by visible eruptive events. Regardless, such a dense seismicity should provide benchmark imaging models, necessary to understand the evolution of volcano dynamics across decades, including the relevant gravitational spreading observed across the wider eastern flank (Borgia et al., 1992; Urlaub et al., 2018). The shallow eastern flank is known to develop primarily aseismic creep (Rasà et al., 1996; Mattia et al., 2015; Bruno et al., 2017) and the wider flank is considered mostly aseismic. However, recent studies show that the deeper flank nearest to the feeding systems is associated with intense seismicity during unrest (Giampiccolo et al., 2020). At the edge of Mt. Etna’s unstable sector intrusions encourage sliding during unrest (Alparone et al., 2020). Understanding if and how widely this seismicity has clustered across years and decades can thus help clarify the nature of sliding and its debated origin (Tibaldi and Groppelli, 2002; Acocella et al., 2003; Urlaub et al., 2018). In particular, it can test numerical models proposing the existence of two sliding interfaces separating two domains: 1) a shallower flank, subject to gravitational instability and 2) a deeper flank, where compression is also caused by magmatic intrusions (Tibaldi and Groppelli, 2002; Apuani et al., 2013).
Forward methods that can properly account for data uncertainties can improve the resolution on, and interpretation of, seismic models. The “Marching Cubes” (MC - also known as “3D Contouring” o “Surface Reconstruction”) is an algorithm for surface reconstruction that generates the 3D contour of a volume in space (Lorensen and Cline, 1987). It operates over a scalar field defined on a given volume. The algorithm approximates the data, which have to be related to physical quantities, to an isosurface, i.e., the surface of constant values in the scalar field. For example, the isosurface generated at the constant value greater than zero represents the enveloping surface around the volume where the scalar field is not null. The MC algorithm is used in medical imaging for 3D surface reconstructions of organs, tissues and anatomic parts and applied to datasets obtained by magnetic resonance tomography (Cline et al., 1987) as well as in pharmacology, chemistry, and meteorology (Newman and Yi, 2006). It is a fundamental tool in the framework of computational graphics and 3D modeling and has become an important technique for visual communication in the 3D animation and gaming industries. A review of the steady advances made by this approach can be found in Masala et al. (2013).
In seismology, the MC algorithm has been used for quick visualization of three-dimensional meshes and voxels. Typical examples are those proposed by Subramanian and Fussell (1990), who used it to make voxels for volume rendering in a ray tracing algorithm, and Ma and Rokne (2004), who developed a mesh propagation algorithm useful for the generation of seismic horizon surfaces. As of today, the MC algorithm has never been applied directly to seismic data and metadata, like earthquake locations, for the purpose of interpretation. With their uncertainties (hundreds of meters), the earthquake locations available from INGV across 16 years (Alparone et al., 2015; Gruppo Analisi Dati Sismici, 2017) can be used as the scalar field in the MC algorithm, at a resolution unavailable to tomography. The resulting isosurfaces will envelope volumes of seismic clustering and contour aseismic zones, whose discussion is always part of tomographic interpretations. The application of the MC algorithm to locations recorded across decades offers a unique method to define background (tectonic or gravitational) or repeated (likely magmatic) processes acting inside the volcano quantitatively.
To support interpretation of volcanic processes, any algorithm designed to interpret volcano dynamics must be implemented in an interactive visualization environment able to localize geological, geographical and geophysical data and models. Such an environment (VolGIS) has been developed to enable users to: 1) control visualization parameters in real-time; 2) locate the MC isosurfaces geographically, with precision sufficient to compare them with geophysical and geological data; 3) perform queries such as measure size and extension of the imaged structures (Guardo and De Siena, 2017). The integration of VolGIS and the MC algorithm is aimed at refining interpretations of volcano seismicity considering both imaged structures and dynamics modeled from geophysical signals. Once applied to seismic locations spanning years, it provides a tool to mitigate several limitations in our ability to interpret volcano dynamics, including: 1) the possibility of accounting for uncertainties in seismic locations when interpreting them with geophysical models; 2) a quantitative definition of “seismic clustering” and aseismicity in a geolocalized environment developed explicitly for the interpretation of seismic tomographic maps; 3) a seismic model of the volcano unrelated to specific volcanic unrest and representative of decadal-scale volcano dynamics.
2 Data and Methods
In the present application, the MC algorithm uses as data the earthquakes nucleated between the years 2000 and 2016 at Mt. Etna, in the framework of the VolGIS. The first ten years of data are described and analyzed by Alparone et al. (2015). We added six years of location data (from 2010 to 2016), which were provided by the Gruppo Analisi Dati Sismici (2017). These earthquakes are located in an area that spans between 14.707 and 15.295°E and from 37.509 to 37.900°N, in a depth range from −3 to 10 km b.s.l. We selected the “Date,” “Latitude,” “Longitude,” “Depth,” “Magnitude,” “RMS,” “ERH” and “ERZ” from the event location file. The last two fields, ERH and ERZ, indicate the horizontal and vertical uncertainties in localization (in kilometres), respectively.
2.1 Geographical Information System Setup
After setting the data-frame coordinate system, both a DEM of Etna (Bisson et al., 2016) and all the seismic events were loaded to the GIS-Workspace. Without any selection dependent on location uncertainties, both the top view (at different scales, i.e., 1:75,000, 1:125,000) (Figures 1A,B) and W-E cross-section view (Figure 1C) of the earthquake spatial distribution highlight a volume of low-to-zero seismicity for the selected period. The methods proposed allow to assess if this anomaly is an effect of graphic visualization or a feature related to the volcano dynamics. VolGIS incorporates the Marching Cubes algorithm (MC) and analyses the earthquake distribution in order to create a quantitative 3D model of the high-seismicity volumes. Geo-localized tomographic maps and models of deformation are then included in the GIS for interpretation.
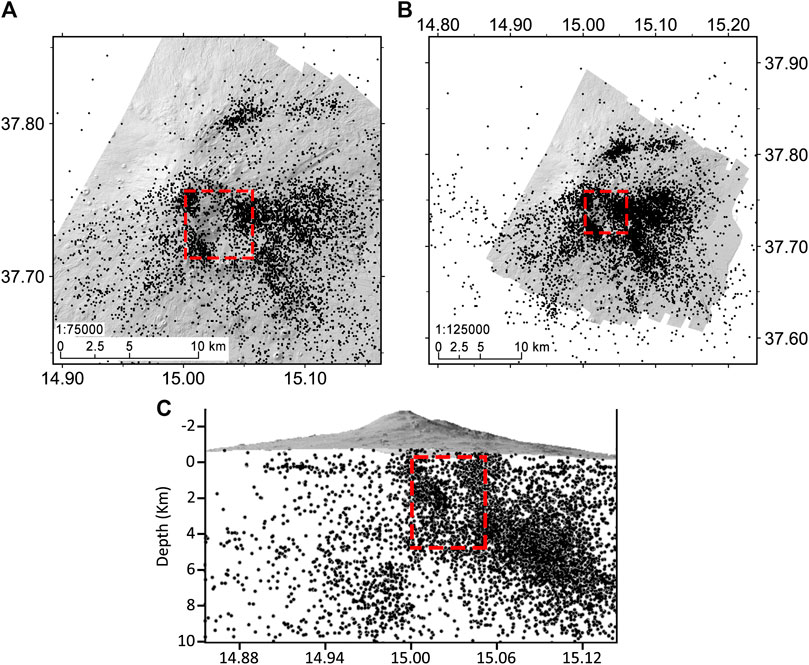
FIGURE 1. Earthquakes distribution at 1:75,000 (A) and 1:125,000 (B). (C) Earthquakes distribution from a W-E view. The red dashed rectangles outline the area of low-to-zero seismicity.
2.2 Marching Cubes
The MC samples a point cloud set by taking eight vertices simultaneously from a provided spatial grid, marking a cube. For each cube, the algorithm computes 28 = 256 possible polygons configurations values that, due to symmetries, are reduced to 15 possible polygons configurations (Supplementary Figure 1A). The MC then queries a list of pre-calculated geometries to pick the combination of polygons that best represents the isosurface passing through the cube, given a predefined grid spacing and density isovalue set by VolGIS. Once the user inputs these parameters, the software applies the algorithm and generates the isosurface according to the spherical spreading law:
Our point cloud-set is the dataset of earthquake locations. After defining a grid, the contribution of each earthquake location (j) in the cloud to the vertices (i) of the grid is thus computed using the inverse square of the distance dependency
For a given dataset, the isovalue establishes what percentage of earthquake locations near to each vertex is required for the vertex to be inside the surface. The i-th vertex is included if
3 Results
The MC algorithm solves a forward problem. It is thus necessary to test different datasets in order to assess the robustness of the imaged structures. The MC was applied to three different datasets (Figure 2; Supplementary Figure 2, 3), created according to three different horizontal and vertical uncertainties (ERH and ERZ). These applications test the robustness of the reconstructed structures, providing a control on visualization based on modeled uncertainties. We also test the stability of structure locations and shapes applying a bootstrap test.
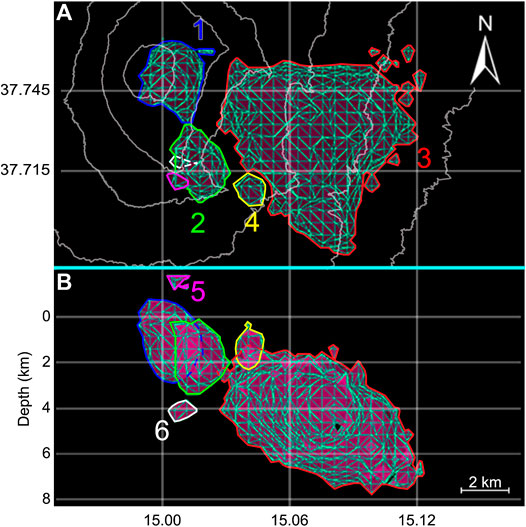
FIGURE 2. Isosurfaces obtained in the second analysis. (A) Top view. (B) W-E cross section. The clusters C1 to C6 are outlined in blue, green, red, yellow, magenta and white, respectively.
3.1 Dataset 1: 6,907 Earthquakes
The first dataset comprises 6,907 earthquakes with a root-mean-squared (RMS) average value of 0.135. We took into consideration that the average ERH and ERZ are equal to 548 and 712 m, respectively. By dividing the entire area (51,779,297 m for each side) by the ERZ (712 m), we obtained the maximum amount of cells that can be included in the analysis (72.7). The software rounded down (72) to respect the ERH-ERZ constrain. Then the area was separated into 72 cells, obtaining a value equal to 719,15 m per each cell-side.
The MC algorithm produced three isosurfaces, or clusters, that envelope the high seismicity volumes and constrain a volume of low (almost absent) seismicity (Supplementary Figure 2A):
• The first two clusters, located beneath the summit craters (C1) and south to it (C2), have a vertical extent of 2.79 km (from 0.24 km above sea level to 2.56 km below it) and 3.6 km (from 0.56 to 4.16 km b.s.l.), respectively.
• The third cluster (C3) is located under the eastern sector of the volcano. It has an approximated thickness of 5 km, dipping eastward from its shallow point at 1.4–7.39 km b.s.l. (Supplementary Figure 3B).
• The algorithm allows the imaging of a fourth cluster, located between the second and third one. However, its dimension is smaller than the earthquake vertical uncertainty, so it is not interpreted in this first analysis.
3.2 Dataset 2: 2,824 Earthquakes
Here, we set the grid spacing to 505.45 m, since the used events have both ERH and ERZ equal or less than 500 m. In this case the total earthquakes and the average RMS are equal to 2,824 and 0.149, respectively. The results show the same three clusters obtained using the first dataset, together with three smaller ones of measurable dimensions (Figure 2A). The clusters obtained with this dataset have a smaller extension compared to those obtained using Dataset 1, but the variations are within the dataset uncertainty. Both shape and position of the clusters remain the same. This result is due to the lower uncertainties in source location.
• The cluster C1 has a vertical extent of 3.28 km (from 550 m a.s.l. to 2.73 km b.s.l.). The second cluster (C2) extends for 3.05 km, spanning from 0.12 to 3.17 km b.s.l.
• Cluster C3 keeps both the same dimensions and position of the previous analysis.
• Located between C2 and C3, cluster C4 is now measurable, with a focal point at about 1.19 km b.s.l. and a vertical extent of 1.67 km.
• Two additional clusters are located above (C5) and below (C6) the second one (C2). They have both an average vertical extent of about 1 km and they range from 1.89 to 0.71 km a.s.l. and from 3.52 to 4.52 km b.s.l., respectively (Figure 2B).
3.3 Dataset 3: 1,937 Earthquakes
In the third and last analysis we selected earthquakes with both ERH and ERZ equal to or less than 400 m, for a total of 1,937 events. The RMS average value is again 0.149 and the grid spacing is set to 402.73 m. The clusters imaged at this resolution are five in total (Supplementary Figure 3A) - with C6 (defined in the previous analysis - Figure 2) having dimensions smaller than the uncertainties. In this case, one of the clusters (C1) has a vertical extent higher than in the previous cases (3.72 km compared to 3.28 km for Dataset 2). This variation is higher than the uncertainty and changes the cluster shape. The other four clusters keep their average thickness and position, but their shape changes due to the limited number of earthquakes taken into account (Supplementary Figure 3B).
3.4 Robustness of the Isosurfaces Relative to the Amount of Data
Dataset 2 (ERH and ERZ ≤ 500 m) shows the highest numbers of clusters and will be used for both the bootstrap test, which is independent of the underlying spatial distribution of the data, and further discussions. The isosurfaces are defined robust in the sense that they are visually continuous as the data change in value (Lopes and Brodlie, 2003). We subtracted 10% (2,542 earthquakes), 20% (2,259) and 40% (1,694) from Dataset 2 randomly and the procedure was then repeated 10 times for each percentage value. The MC algorithm reconstructs isosurfaces almost identical to those generated using the original dataset (Supplementary Figure 4,5), confirming that Dataset 2 provides a robust spatial distribution of isosurfaces with reductions up to 40%.
4 Discussions
The MC algorithm applied to the seismicity of Mt. Etna reveals three-dimensional high-resolution seismically-dense structures, which visually and spatially constrain a volume with low seismicity (VLS). A comparison of the retrieved structures with studies related to the 2000–2016 activity of the volcano (Bonaccorso et al., 2002; Bonforte et al., 2008; Currenti et al., 2008; Alparone et al., 2012; Bonforte et al., 2013; Carbone et al., 2014; Bruno et al., 2017): 1) shows that the VLS is enclosed in the high-velocity body (HVB) depicted by previous tomographic models; 2) allows to characterize the VLS as a portion of the feeding system; and 3) images the persistent seismicity associated to the sliding of the combination of gravitational and magmatic forces affecting the deeper eastern flank, closest to the feeding system.
4.1 Spatial Relation with Seismic and Deformation Models
The comparison between both the tomographic maps and geodetic models with the seismic clusters allows to define a preliminary seismic zonation map of the volcano without separating the seismicity in different time periods. It is hence possible to characterize the clusters as produced by either gravitational or magmatic processes, such as dikes’ intrusion.
The HVB is generally interpreted as a single solidified intrusive body (Hirn et al., 1991; Villaseñor et al., 1998; De Gori et al., 1999; Laigle et al., 2000; Aloisi et al., 2002; Patanè et al., 2002; Patanè et al., 2003; Patanè et al., 2006; Díaz-Moreno et al., 2018; Giampiccolo et al., 2020). Imaged as a high-velocity volume (Alparone et al., 2012), the most obvious explanation is that this represents the buried, cooled signature of older magmatic activities. Regardless, the location of the MC clusters relative to the HVB reveals that:
• between 1 and 2 km b.s.l., C2 and C4 are included in the HVB (Alparone et al., 2012) (Vp > 6 km/s - from cyan to purple), while C3 only contours its eastern edge (Supplementary Figure 6A,B).
• cluster C1, located between 37.737° and 37.765° latitude North and from 14.995° to 15.015° longitude East, is also inside the HVB between 2 and 3 km b.s.l. (Supplementary Figure 6B,C).
• At 3 km b.s.l. the HVB comprises the VLS as well as all the clusters except for C3 (Supplementary Figure 6C).
The HVB thus consistently comprises all clusters and the VLS except for C3 (red contour). The VLS is thus a smaller-scale feature inside the high-velocity pattern that separates the main western clusters C1 and C2 from C3, under the eastern part of the volcano. The obvious questions are if the clusters are caused by different dynamics (magmatic, tectonic and gravitational) and if the VLS is part of the feeding systems of the volcano.
We also compare clusters C1 and C2 with the location of the dike and crack models obtained from geodetic and GPS analyses performed between 2000 and 2016 (Figure 3).
• The locations and main orientations of clusters C1 and C2 match the crack projection modeled by Bonaccorso et al. (2002) relative to the lateral eruption of July 2001 (Figure 3A). The source of ground deformation modeled in this study lies 1.5 km SW and at the same depth of the VLS.
• The deflation source related to the July 2004–July 2005 period (Bonforte et al., 2008) is modeled just 1 km west of the VLS, matching the location of cluster C2. The source linked to an inflation stage (July 2005–June 2006) is instead vertically located on the western side of C1. These are averaged sources because they are related to inhomogeneous deformative stages of the volcanic edifice. The inversion of both GPS and satellite data provided two dike models related to the May 6–13 and May–July 2008 eruptions, respectively (Bonforte et al., 2013). Both models are located less than 1 km west of the VLS - the first below cluster C1, the second on top of it (Figure 3B).
• The model proposed by Bruno et al. (2017), relative to the May 2015-September 2016 period, is located in the first cluster, in a range that spans between 2 and 6 km b.s.l., about 2 km west of the VLS (Figure 3C).
• The deformation sources modeled using continuous GPS data (Cannata et al., 2018) are related to several eruptive events. They highlight a more complex ground deformation patterns then those obtained by measurements performed during a specific eruptive event (e.g., compare the deformation sources from (Bonforte et al., 2008) (Figure 3B) and (Palano et al., 2017) (Figure 3D), for the period July 2004–July 2005). However all these ground deformations are primarily located inside or around cluster C1 (Figure 3D).
• Clusters C1 and C2 are adjacent to the fracture-weakness-zone (FWZ) modeled by Carbone et al. (2014). This zone, located just 1.6 km SW from the VLS, is interpreted as a deeper pressure source filled with highly-pressurized gases (Figure 3E).
• The surface dike projection modeled by Pezzo et al. (2020) comprises most of C1, C2 and most of the VLS (Figure 3F).
• The spatial relation between these models and the clusters west of the VLS (C1 and C2) shows that the corresponding seismicity is produced by transient magmatic activity, marking the well known “South-rift” (Acocella and Neri, 2003; Pezzo et al., 2020). The weak zone modeled by Pezzo et al. (2020), considered as the superficial evidence of a deeper dike intrusion, is the only deformation anomaly crossing the VLS consistently.
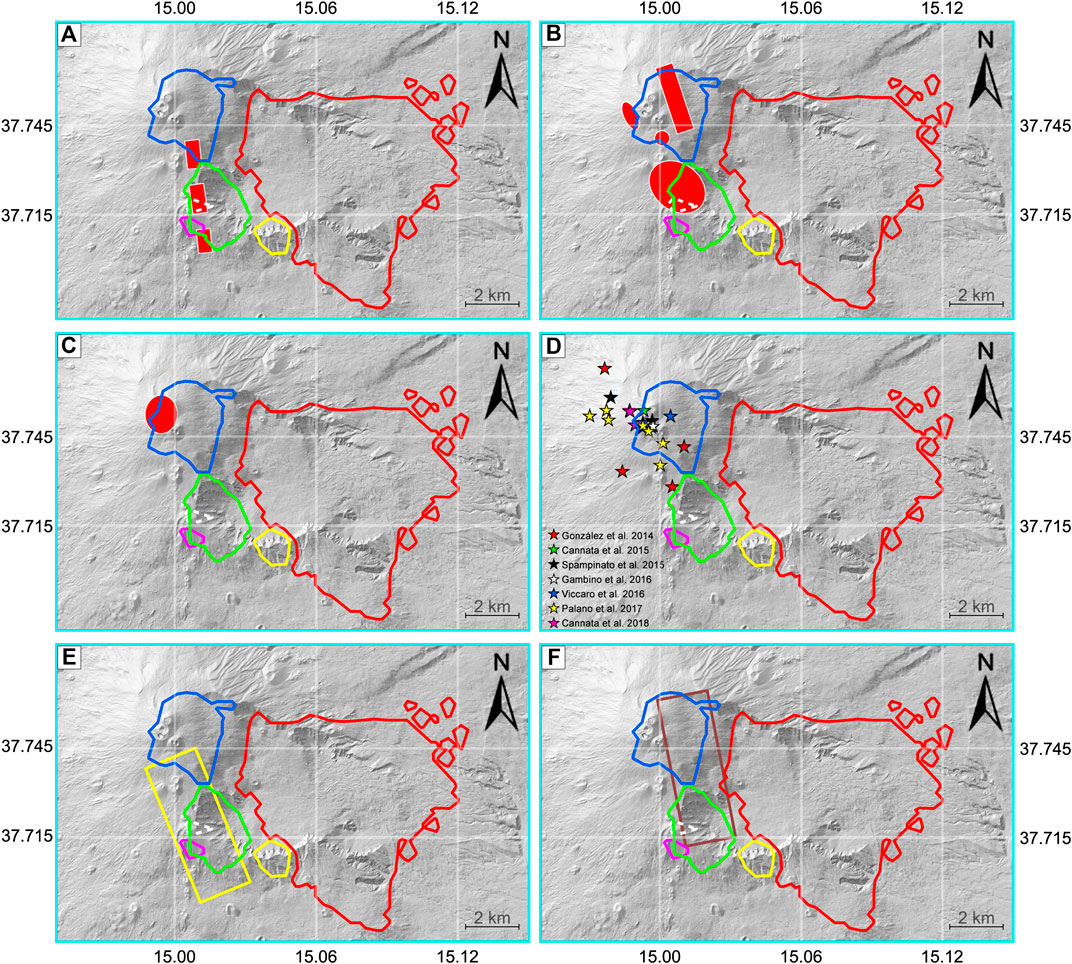
FIGURE 3. Comparison between the clusters and previous deformation models. (A) The crack projection (red rectangles) modeled by Bonaccorso et al. (2002). (B) The average ground deformation sources by Bonforte et al. (2008) (red ellipses); dike models from the second and third inversion (red rectangle and circle, respectively) obtained by Bonforte et al. (2013). (C) The source of deformation model by Bruno et al. (2017). (D) The deformation sources modeled by González and Palano (2014): (red stars), (Cannata et al., 2015) (green stars), (Spampinato et al., 2015) (black stars), (Gambino et al., 2016) (white stars), (Viccaro et al., 2016) (blue stars), (Palano et al., 2017) (yellow stars) and (Cannata et al., 2018) (magenta stars). (E) The fracture-weakness-zone (FWZ) (yellow rectangle) modeled by Carbone et al. (2014). (E) The surface dike projection (brown rectangle) modeled by Pezzo et al. (2020).
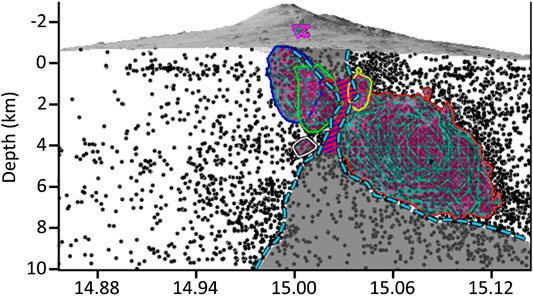
FIGURE 4. W-E cross-section highlighting (in gray) the area with low-seismicity above and below the VLS (in dashed blue-red).
4.2 The Volume with Low Seismicity as Portion of the Feeding System
The VLS is in an extensional regime between the eastern and western flanks of the volcano (Barberi et al., 2000; Alparone et al., 2011; Carbone et al., 2014; Murray et al., 2018). A comparison between the VLS and different Coulomb stress distribution models (Currenti et al., 2008) (Supplementary Figure 7) shows that the VLS falls inside a wide volume, extending to a depth of 6–7 km b.s.l., characterized by positive Coulomb stress changes (values equal and higher than 0.8 MPa). Here failure on a fault is favored (Cocco and Rice, 2002). If the VLS falls in a fragile HVB, why doesn’t it show seismicity?
In active volcanoes earthquake-free zones are typically interpreted as the result of magma storage (Decker, 1984; Scandone and Malone, 1985; Parfitt and Wilson, 2008). At Mt. Etna such a seismic gap was previously recognized and considered as a magma supply in the shallow HVB (Chiarabba et al., 2000). If the origin of the HVB are cooled magmatic rocks they can thus pass from a brittle fracture behavior to a plastic deformation one after dikes’ intrusion (Parisio et al., 2019). Such a dike intrusion has been modeled for the 2018 eruption (Aloisi et al., 2020; Pezzo et al., 2020) inside the VLS. Rocks near these dikes intrusions can deform in a ductile manner (aseismically) while the cooler rocks far from the dike will fail in brittle mode (Parisio et al., 2019). This justifies the drastic seismicity decrease in the VLS, making it aseismic even if in a fragile environment [1.3% of the total earthquakes nucleated between 2000 and 2016, i.e., 89 earthquakes over 6,907 (Supplementary Figure 8)]. The VLS maintains its size and location, between depths of 1.9 and 3.6 km b.s.l. (minimum), across the considered time period (2000–2016). These results support the interpretation of the VLS as a portion of the feeding system of the volcano (Scandone and Malone, 1985; Murru et al., 1999; Puglisi et al., 2001).
4.3 Cluster East of theVolume with Low Seismicity: Seismicity Underlying Flank Instability
Cluster C3, located east of the VLS is oriented W-E and has a thickness of 5 km and a length of about 7.4 km (Figure 5). The top surface of C3 matches the element known in literature as “décollement” or detaching plane (Puglisi et al., 2001; Tibaldi and Groppelli, 2002; Bonforte and Puglisi, 2003; Lundgren et al., 2003, Lundgren et al., 2004; Walter et al., 2005; Bonforte and Puglisi, 2006; Puglisi et al., 2008; Aloisi et al., 2011; Palano, 2016). This plane is located at about 3 km depth, dipping from 1.4 km b.s.l. to almost 4 km b.s.l., from top to bottom, respectively. It is in overall agreement with previous models (Acocella and Neri, 2003; Bonforte and Puglisi, 2003; Bonforte and Puglisi, 2006; Puglisi et al., 2008; Azzaro et al., 2013) (Figure 5) despite being obtained with seismic locations distribution instead of deformation data. It is thus possible to consider the top of the 3D surface of this cluster as the boundary zone between rocks with different mechanical properties (Chiarabba et al., 2000; Laigle et al., 2000; Alparone et al., 2011; Palano, 2016), on which the superficial mass of the volcano flank slides due to gravitational instability (Puglisi et al., 2001; Tibaldi and Groppelli, 2002; Bonforte and Puglisi, 2003; Lundgren et al., 2003, Lundgren et al., 2004; Walter et al., 2005; Apuani et al., 2013) (Figure 6). On the other hand the bottom surface of cluster C3 dips from 4 to 7.39 km b.s.l. This surface fits with a magma intrusion-induced slip surface hypothesized by previous studies (Borgia et al., 1992, Borgia et al., 2000; Tibaldi and Groppelli, 2002; Acocella et al., 2003; Lundgren et al., 2004; Neri et al., 2004; Walter et al., 2005; Apuani et al., 2013).
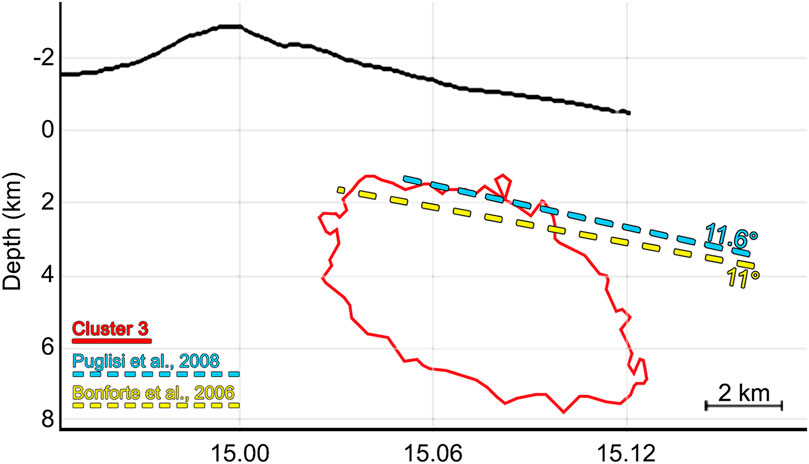
FIGURE 5. A W-E cross-section view of Cluster C3 (red outline). The previously modeled detachment planes are represented in yellow (Bonforte and Puglisi, 2006) and light blue (Puglisi et al., 2008).
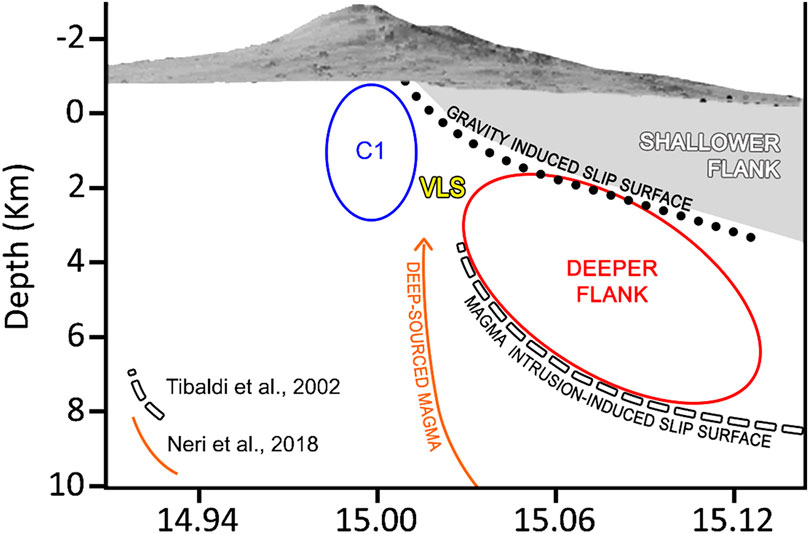
FIGURE 6. A W-E conceptual model explaining seismicity and sliding of the eastern flank of Mt. Etna.
There is a general agreement that the wider eastern flank, especially the portion in the coastal area, is sliding primarily due to gravitational forces (Urlaub et al., 2018). However it is unlikely that a 5 km-thick seismic structure (C3) is produced by gravitational collapse only. If our interpretation of the VLS is correct, a portion of the western seismicity inside C3, with volume equivalent to C1 and C2, could be equally caused by dikes’ intrusions. It is thus possible to explain the seismicity across the eastern flank using a simple conceptual model of two flanks: a shallower and a deeper one (Tibaldi and Groppelli, 2002) (Figure 6). The shallower one, above the cluster C3, is mostly affected by gravitational collapse and is sliding along the C3 top surface. The deeper flank is constrained by cluster C3 and slides along its bottom surface. The corresponding seismicity is due to a combination of gravitational and magmatic forces, most likely from an intermediate storage zone like that modeled by Aloisi et al. (2020) between 4 and 7 km under the central cone. The VLS represents the shallowest evidence of magmatic intrusions (Neri et al., 2018; Aloisi et al., 2020) contributing to the sliding of the deeper eastern flank.
In our interpretation C3 thus represents the first 3D seismic image of the deeper portion of the eastern flank, in contact with the feeding systems and sliding due to both magmatic and gravitational forces. The seismicity inside the cluster has already been associated with magmatic or hydrothermal activity during the 2018 unrest (Giampiccolo et al., 2020): we prove that this seismicity is a consistent feature before this event, likely related to gravitational sliding (at the top of the cluster) and repeated magmatic intrusions. The existence of a ductile VLS where dikes can intrude thus better agrees with a reciprocal feedback between: 1) gravitational collapse encouraging the uprizing of magma and 2) dikes’ intrusions favoring sliding in the deeper part of this portion of the eastern flank (Tibaldi and Groppelli, 2002; Acocella et al., 2003; Bonforte and Puglisi, 2003; Aloisi et al., 2011; Apuani et al., 2013; Bruno et al., 2017).
Previous authors have underlined that “eruptions do not trigger catastrophic flank collapses” analyzing displacement of aseismic shallow faults related to the flank kinematics (Urlaub et al., 2018). Our results show that deep magmatic activity produces persistent (at least decadal-long) seismic signatures that strongly differ from those at surface. Deeper magmatic activity or flank eruption (Alparone et al., 2020) are thus a likely trigger of shallower sliding and, consequently, catastrophic collapse of the shallower portion of the flank. For a complete understanding of how catastrophic this pattern would be, it is necessary to consider the relation between local tectonic and eruptive events (Bonforte et al., 2019; De Novellis et al., 2019; Aloisi et al., 2020; Pezzo et al., 2020), i.e., conducting a time dependent analysis.
5 Conclusions
The earthquakes nucleated between 2000 and 2016 at Mt. Etna have been used as data in the Marching Cube algorithm, a 3D modeling and visualization analysis. The MC has been framed in an experimental GIS (VolGIS), which allows the users to obtain a three-dimensional seismic image in a few seconds and with a high quality graphics output. The system offers unique support in the imaging of relatively small-sized volumes within tomographic and deformation models resolved over kilometres. The framework allows to establish benchmark seismic zonation-mapping at volcanoes including uncertainties from seismic locations. It is specifically designed for volcanoes that have been mapped with seismic tomography and where extensive seismic networks and high-rate seismicity are available. These are today standards at many volcanoes worldwide, like Kilauea, La Réunion and those of the Canary Island, all characterized by high-rate seismicity and flank instability.
The results at Etna constrain a volume of low (almost-absent) seismicity, persistent across a 16 years period. We interpret this volume as a portion of the feeding system of the volcano embedded in a high velocity body. In this interpretation, the VLS represents the zone of transition between seismicity caused only by transient dike-related activity (west of the VLS) and seismicity caused by mixed magmatic and gravitational components. The model provides the first 3D seismic evidence of the different dynamics affecting the deeper and shallower portion of flank closest to the feeding systems, with important implications on the estimation of the volumes affected by sliding and the forces causing it. Only time-dependent analyses will provide exact spatial correlations of the VLS with source deformation models, insight into the temporal instability of the eastern flank and whether the VLS is a stationary feature or can be reconstructed only after a major eruption of the volcano.
Data Availability Statement
The used software (VolGIS) provides graphic outputs that coincide with those shown in the article and in the Supplementary Material. The earthquake location data can be requested to the INGV-Osservatorio Etneo (Gruppo Analisi Dati Sismici, 2017).
Author Contributions
RG designed the software and directed its development, built the 3D models, generated the maps and wrote the first draft text. LS guided the overarching research direction and advised on the geophysics and volcanology. CD coordinated the technical work on the software. All authors contributed to revising the text.
Funding
RG acknowledges the financial support of the Consejo Nacional de Investigaciones Científicas y Técnicas (CONICET) Argentina. CD acknowledges the financial support of the project “Pi UNRN 40B-634” entitled “Desarrollo, Integración e Implementación de Herramienta de Visualización y Análisis 3D y 4D (convocatoria trianual 2017).”
Conflict of Interest
The authors declare that the research was conducted in the absence of any commercial or financial relationships that could be construed as a potential conflict of interest.
Acknowledgments
This work was made possible by the outstanding efforts of the staff at the INGV-Osservatorio Etneo. We are particularly grateful to A. Ursino, S. Alparone, and G. Currenti, who provided us the seismic dataset and helped us to correctly interpret the variations of Coulomb stress at Etna. We thank Jurgen Neuberg for suggesting the comparison with the Coulomb stress and Guido Ventura for the insightful discussions on the volcanological significance of our results. We also thank the computer scientists of the LVCC for the support in the software development and A. Colubri for suggesting the application of the Marching Cube algorithm.
Supplementary Material
The Supplementary Material for this article can be found online at: https://www.frontiersin.org/articles/10.3389/feart.2020.589925/full#supplementary-material
References
Acocella, V., Behncke, B., Neri, M., and D’Amico, S. (2003). Link between major flank slip and 2002–2003 eruption at Mt. Etna (Italy). Geophys. Res. Lett. 30, 2286. doi:10.1029/2003gl018642.
Acocella, V., and Neri, M. (2003). What makes flank eruptions? The 2001 Etna eruption and its possible triggering mechanisms. Bull. Volcanol. 65, 517–529. doi:10.1007/s00445-003-0280-3. CrossRef Full Text
Aloisi, M., Bonaccorso, A., Cannavò, F., Currenti, G., and Gambino, S. (2020). The 24 December 2018 eruptive intrusion at etna volcano as revealed by multidisciplinary continuous deformaion networks (CGPS, borehole strainmeters and tiltmeters). J. Geophys. Res. Solid Earth 125, e2019JB019117. doi:10.1029/2019jb019117. CrossRef Full Text
Aloisi, M., Cocina, O., Neri, G., Orecchio, B., and Privitera, E. (2002). Seismic tomography of the crust underneath the etna volcano, Sicily. Phys. Earth Planet. Inter. 134, 139–155. doi:10.1016/s0031-9201(02)00153-x. CrossRef Full Text
Aloisi, M., Mattia, M., Monaco, C., and Pulvirenti, F. (2011). Magma, faults, and gravitational loading at Mount Etna: the 2002–2003 eruptive period. J. Geophys. Res. Solid Earth 116, B05203. doi:10.1029/2010jb007909. CrossRef Full Text
Alparone, S., Barberi, G., Bonforte, A., Maiolino, V., and Ursino, A. (2011). Evidence of multiple strain fields beneath the eastern flank of Mt. Etna volcano (Sicily, Italy) deduced from seismic and geodetic data during 2003-2004. Bull. Volcanol. 73, 869–885. doi:10.1007/s00445-011-0456-1. CrossRef Full Text
Alparone, S., Barberi, G., Cocina, O., Giampiccolo, E., Musumeci, C., and Patanè, D. (2012). Intrusive mechanism of the 2008-2009 Mt. Etna eruption: constraints by tomographic images and stress tensor analysis. J. Volcanol. Geoth. Res. 229-230, 50–63. doi:10.1016/j.jvolgeores.2012.04.001. CrossRef Full Text
Alparone, S., Barberi, G., Giampiccolo, E., Maiolino, V., Mostaccio, A., Musumeci, C., et al. (2020). Seismological constraints on the 2018 Mt. Etna (Italy) flank eruption and implications for the flank dynamics of the volcano. Terra Nova 32, 334–344. doi:10.1111/ter.12463
Alparone, S., Maiolino, V., Mostaccio, A., Scaltrito, A., Ursino, A., Barberi, G., et al. (2015). Instrumental seismic catalogue of Mt. Etna earthquakes (Sicily, Italy): ten years (2000-2010) of instrumental recordings. Ann. Geophys. 58, 0435. 10.4401/ag-6591
Apuani, T., Corazzato, C., Merri, A., and Tibaldi, A. (2013). Understanding Etna flank instability through numerical models. J. Volcanol. Geoth. Res. 251, 112–126. doi:10.1016/j.jvolgeores.2012.06.015.
Azzaro, R., Bonforte, A., Branca, S., and Guglielmino, F. (2013). Geometry and kinematics of the fault systems controlling the unstable flank of Etna volcano (Sicily). J. Volcanol. Geoth. Res. 251, 5–15. doi:10.1016/j.jvolgeores.2012.10.001. CrossRef Full Text
Barberi, G., Cocina, O., Neri, G., Privitera, E., and Spampinato, S. (2000). Volcanological inferences from seismic-strain tensor computations at Mt. Etna Volcano, Sicily. Bull. Volcanol. 62, 318–330. doi:10.1007/s004450000101. CrossRef Full Text
Bisson, M., Spinetti, C., Neri, M., and Bonforte, A. (2016). Mt. Etna volcano high-resolution topography: airborne LiDAR modelling validated by GPS data. Int. J. Digital Earth 9, 710–732. doi:10.1080/17538947.2015.1119208. CrossRef Full Text
Bonaccorso, A., Aloisi, M., and Mattia, M. (2002). Dike emplacement forerunning the Etna July 2001 eruption modeled through continuous tilt and GPS data. Geophys. Res. Lett. 29, 1624. doi:10.1029/2001gl014397. CrossRef Full Text
Bonforte, A., Bonaccorso, A., Guglielmino, F., Palano, M., and Puglisi, G. (2008). Feeding system and magma storage beneath Mt. Etna as revealed by recent inflation/deflation cycles. J. Geophys. Res. Solid Earth 113, B05406. doi:10.1029/2007jb005334. CrossRef Full Text
Bonforte, A., Guglielmino, F., and Puglisi, G. (2013). Interaction between magma intrusion and flank dynamics at Mt. Etna in 2008, imaged by integrated dense GPS and DInSAR data. G-cubed 14, 2818–2835. doi:10.1002/ggge.20190. CrossRef Full Text
Bonforte, A., Guglielmino, F., and Puglisi, G. (2019). Large dyke intrusion and small eruption: the December 24, 2018 Mt. Etna eruption imaged by Sentinel‐1 data. Terra Nova 31, 405–412doi: 10.1111/ter.12403. CrossRef Full Text
Bonforte, A., and Puglisi, G. (2003). Magma uprising and flank dynamics on Mount Etna volcano, studied using GPS data (1994–1995). J. Geophys. Res. Solid Earth 108, 2153. doi:10.1029/2002jb001845. CrossRef Full Text
Bonforte, A., and Puglisi, G. (2006). Dynamics of the eastern flank of Mt. Etna volcano (Italy) investigated by a dense GPS network. J. Volcanol. Geoth. Res. 153, 357–369. doi:10.1016/j.jvolgeores.2005.12.005. CrossRef Full Text
Borgia, A., Delaney, P. T., and Denlinger, R. P. (2000). Spreading volcanoes. Annu. Rev. Earth Planet Sci. 28, 539–570. doi:10.1146/annurev.earth.28.1.539. CrossRef Full Text
Borgia, A., Ferrari, L., and Pasquarè, G. (1992). Importance of gravitational spreading in the tectonic and volcanic evolution of Mount Etna. Nature 357, 231–235. doi:10.1038/357231a0. CrossRef Full Text
Bruno, V., Mattia, M., Montgomery-Brown, E., Rossi, M., and Scandura, D. (2017). Inflation leading to a slow slip event and volcanic unrest at Mount Etna in 2016: insights from CGPS data. Geophys. Res. Lett. 44, 141–149. doi:10.1002/2017gl075744. CrossRef Full Text
Cannata, A., Spedalieri, G., Behncke, B., Cannavó, F., Di Grazia, G., Gambino, S., et al. (2015). Pressurization and depressurization phases inside the plumbing system of Mount Etna volcano: evidence from a multiparametric approach. J. Geophys. Res. Solid Earth 120 (9), 5965–5982.CrossRef Full Text
Cannata, A., Di Grazia, G., Giuffrida, M., Gresta, S., Palano, M., Sciotto, M., et al. (2018). Space-time evolution of magma storage and transfer at Mt. Etna volcano (Italy): the 2015–2016 reawakening of Voragine crater. Geochem. Geophys. Geosyst. 19, 471–495. doi:10.1002/2017gc007296. CrossRef Full Text
Carbone, D., Gibert, D., Marteau, J., Diament, M., Zuccarello, L., and Galichet, E. (2014). An experiment of muon radiography at Mt Etna (Italy). Geophys. J. Int. 196, 633–643. doi:10.1093/gji/ggt403. CrossRef Full Text
Cardaci, C., Coviello, M., Lombardo, G., Patané, G., and Scarpa, R. (1993). Seismic tomography of Etna volcano. J. Volcanol. Geoth. Res. 56, 357–368. doi:10.1016/0377-0273(93)90002-9. CrossRef Full Text
Chiarabba, C., Amato, A., Boschi, E., and Barberi, F. (2000). Recent seismicity and tomographic modeling of the Mount Etna plumbing system. J. Geophys. Res. 105, 10923–10938. doi:10.1029/1999jb900427. CrossRef Full Text
Chiarabba, C., De Gori, P., and Patane, D. (2004). The Mt. Etna plumbing system: the contribution of seismic tomography. Mt. Etna: Volcano Laboratory.
Cline, H. E., Dumoulin, C. L., Hart, H. R., Lorensen, W. E., and Ludke, S. (1987). 3D reconstruction of the brain from magnetic resonance images using a connectivity algorithm. Magn. Reson. Imag. 5, 345–352. doi:10.1016/0730-725x(87)90124-x. CrossRef Full Text | Pubmed
Cocco, M., and Rice, J. R. (2002). Pore pressure and poroelasticity effects in Coulomb stress analysis of earthquake interactions. J. Geophys. Res. Solid Earth 107, ESE–2. doi:10.1029/2000jb000138. CrossRef Full Text
Currenti, G., Del Negro, C., Ganci, G., and Williams, C. A. (2008). Static stress changes induced by the magmatic intrusions during the 2002-2003 Etna eruption. J. Geophys. Res.: Solid Earth 113, B10206. doi:10.1029/2007jb005301. CrossRef Full Text
Díaz-Moreno, A., Barberi, G., Cocina, O., Koulakov, I., Scarfì, L., Zuccarello, L., et al. (2018). New insights on Mt. Etna’s crust and relationship with the regional tectonic framework from joint active and passive P-wave seismic tomography. Surv. Geophys. 39, 57–97. doi:10.1007/s10712-017-9425-3. CrossRef Full Text | Pubmed
De Gori, P., Chiarabba, C., and Patanè, D. (2005). Qp structure of mount etna: constraints for the physics of the plumbing system. J. Geophys. Res. 110, B05303. doi:10.1029/2003JB002875. CrossRef Full Text
De Luca, G., Filippi, L., Patanè, G., Scarpa, R., and Vinciguerra, S. (1997). Three-dimensional velocity structure and seismicity of Mt. Etna volcano, Italy. J. Volcanol. Geotherm. Res. 79, 123–138. doi:10.1016/s0377-0273(97)00026-7. CrossRef Full Text
De Novellis, V., Atzori, S., De Luca, C., Manzo, M., Valerio, E., Bonano, M., et al. (2019). DInSAR analysis and analytical modeling of mount etna displacements: the december 2018 volcano‐tectonic crisis. Geophys. Res. Lett. 46, 5817–5827. doi:10.1029/2019gl082467. CrossRef Full Text
De Siena, L., Chiodini, G., Vilardo, G., Del Pezzo, E., Castellano, M., Colombelli, S., et al. (2017). Source and dynamics of a volcanic caldera unrest: Campi Flegrei, 1983–84. Sci. Rep. 7, 8099. doi:10.1038/s41598-017-08192-7. CrossRef Full Text Pubmed
Decker, R. W. (1984). Dynamics of Hawaiian volcanoes: an overview. US Geological Survey Professional Paper 2, 997.
Giampiccolo, E., Cocina, O., De Gori, P., and Chiarabba, C. (2020). Dyke intrusion and stress-induced collapse of volcano flanks: the example of the 2018 event at mt. etna (sicily, Italy). Sci. Rep. 10, 6373. doi:10.1038/s41598-020-63371-3. CrossRef Full Text Pubmed
Gambino, S., Cannata, A., Cannavó, F., La Spina, A., Palano, M., Sciotto, M., et al. (2016). The unusual 28 December 2014 dike‐fed paroxysm at Mount Etna: timing and mechanism from a multidisciplinary perspective. J. Geophys. Res. Solid Earth 121(3), 2037–2053. CrossRef Full Text Pubmed
González, P. J., and Palano, M. (2014). Mt. Etna 2001 eruption: new insights into the magmatic feeding system and the mechanical response of the western flank from a detailed geodetic dataset. J. Volcanol. Geotherm. Res. 274, 108–121. CrossRef Full Text Pubmed
Gruppo Analisi Dati Sismici, G. (2017). Catalogo dei terremoti della Sicilia Orientale-Calabria Meridionale (1999–2017). Catania, Italy: INGV. Available at: http://sismoweb.ct.ingv.it/maps/eq_maps/sicily/index.php (Accessed December 12, 2017).
Guardo, R., and De Siena, L. (2017). Integrating ambient noise with GIS for a new perspective on volcano imaging and monitoring: the case study of Mt. Etna. J. Volcanol. Geoth. Res. 347, 397–407. doi:10.1016/j.jvolgeores.2017.10.007. CrossRef Full Text
Gudmundsson, A. (1983). Form and dimensions of dykes in eastern Iceland. Tectonophysics 95, 295–307. doi:10.1016/0040-1951(83)90074-4. CrossRef Full Text
Hirn, A., Nercessian, A., Sapin, M., Ferrucci, F., and Wittlinger, G. (1991). Seismic heterogeneity of Mt Etna: structure and activity. Geophys. J. Int. 105, 139–153. doi:10.1111/j.1365-246x.1991.tb03450.x. CrossRef Full Text
Huang, H.-H., Lin, F.-C., Schmandt, B., Farrell, J., Smith, R. B., and Tsai, V. C. (2015). The Yellowstone magmatic system from the mantle plume to the upper crust. Science 348, 773–776. doi:10.1126/science.aaa5648. CrossRef Full Text | Pubmed
Jaxybulatov, K., Shapiro, N. M., Koulakov, I., Mordret, A., Landès, M., and Sens-Schönfelder, C. (2014). A large magmatic sill complex beneath the Toba caldera. Science 346, 617–619. doi:10.1126/science.1258582. CrossRef Full Text | Pubmed
Julian, B., Prisk, A., Foulger, G., and Evans, J. (1993). “Three dimensional images of geothermal systems: local earthquake P-wave velocity tomography at the Hengill and Krafla geothermal areas, Iceland, and the Geysers, California,” in Proceedings of the 1993 annual meeting on utilities and geothermal: an emerging partnership, Burlingame, CA, Vol. 17, 113–121.
Koulakov, I. (2013). Studying deep sources of volcanism using multiscale seismic tomography. J. Volcanol. Geotherm. Res. 257, 205–226. doi:10.1016/j.jvolgeores.2013.03.012
Laigle, M., Hirn, A., Sapin, M., Lépine, J.-C., Diaz, J., Gallart, J., et al. (2000). Mount Etna dense array local earthquakePandStomography and implications for volcanic plumbing. J. Geophys. Res. 105, 21633–21646. doi:10.1029/2000jb900190. CrossRef Full Text
Lopes, A., and Brodlie, K. (2003). Improving the robustness and accuracy of the marching cubes algorithm for isosurfacing. IEEE Trans. Visual. Comput. Graph. 9, 16–29. doi:10.1109/tvcg.2003.1175094. CrossRef Full Text
Lorensen, W. E., and Cline, H. E. (1987). Marching cubes: a high resolution 3D surface construction algorithm. SIGGRAPH Comput. Graph. 21, 163–169. doi:10.1145/37402.37422. CrossRef Full Text
Lundgren, P., Berardino, P., Coltelli, M., Fornaro, G., Lanari, R., Puglisi, G., et al. (2003). Coupled magma chamber inflation and sector collapse slip observed with synthetic aperture radar interferometry on Mt. Etna volcano. J. Geophys. Res.: Solid Earth 108, 2247. doi:10.1029/2001jb000657. CrossRef Full Text
Lundgren, P., Casu, F., Manzo, M., Pepe, A., Berardino, P., Sansosti, E., et al. (2004). Gravity and magma induced spreading of Mount Etna volcano revealed by satellite radar interferometry. Geophys. Res. Lett. 31, L04602. doi:10.1029/2003gl018736. CrossRef Full Text
Ma, C., and Rokne, J. (2004). “3D seismic volume visualization,” in Integrated image and graphics technologies. (Boston, MA Springer), 241–262.
Masala, G. L., Golosio, B., and Oliva, P. (2013). An improved marching cube algorithm for 3D data segmentation. Comput. Phys. Commun. 184, 777–782. doi:10.1016/j.cpc.2012.09.030. CrossRef Full Text
Mattia, M., Bruno, V., Caltabiano, T., Cannata, A., Cannavò, F., D'Alessandro, W., et al. (2015). A comprehensive interpretative model of slow slip events on Mt. Etna’s eastern flank. Geochem. Geophys. Geosyst. 16, 635–658. doi:10.1002/2014gc005585. CrossRef Full Text
Murray, J. B., de Vries, B. v. W., Pitty, A., Sargent, P., and Wooller, L. (2018). Gravitational sliding of the Mt. Etna massif along a sloping basement. Bull. Volcanol. 80, 40. doi:10.1007/s00445-018-1209-1. CrossRef Full Text Pubmed
Murru, M., Montuori, C., Wyss, M., and Privitera, E. (1999). The locations of magma chambers at Mt. Etna, Italy, mapped by b-values. Geophys. Res. Lett. 26, 2553–2556. doi:10.1029/1999gl900568. CrossRef Full Text
Neri, M., Acocella, V., and Behncke, B. (2004). The role of the Pernicana fault system in the spreading of Mt. Etna (Italy) during the 2002–2003 eruption. Bull. Volcanol. 66, 417–430. doi:10.1007/s00445-003-0322-x. CrossRef Full Text
Neri, M., Rivalta, E., Maccaferri, F., Acocella, V., and Cirrincione, R. (2018). Etnean and Hyblean volcanism shifted away from the Malta Escarpment by crustal stresses. Earth Planet Sci. Lett. 486, 15–22. doi:10.1016/j.epsl.2018.01.006. CrossRef Full Text
Newman, T. S., and Yi, H. (2006). A survey of the marching cubes algorithm. Comput. Graph. 30, 854–879. doi:10.1016/j.cag.2006.07.021. CrossRef Full Text
Palano, M. (2016). Episodic slow slip events and seaward flank motion at Mt. Etna volcano (Italy). J. Volcanol. Geotherm. Res. 324, 8–14. doi:10.1016/j.jvolgeores.2016.05.010. CrossRef Full Text
Palano, M., Viccaro, M., Zuccarello, F., and Gresta, S. (2017). Magma transport and storage at Mt. Etna (Italy): a review of geodetic and petrological data for the 2002–03, 2004 and 2006 eruptions. J. Volcanol. Geotherm. Res. 347, 149–164. doi:10.1016/j.jvolgeores.2017.09.009. CrossRef Full Text
Parfitt, L., and Wilson, L. (2008). Fundamentals of physical volcanology. Oxford, United Kingdom: Blackwell Publishing.
Parisio, F., Vinciguerra, S., Kolditz, O., and Nagel, T. (2019). The brittle-ductile transition in active volcanoes. Sci. Rep. 9, 143. doi:10.1038/s41598-018-36505-x. CrossRef Full Text Pubmed
Patanè, D., Barberi, G., Cocina, O., De Gori, P., and Chiarabba, C. (2006). Time-resolved seismic tomography detects magma intrusions at Mount Etna. Science 313, 821–823. doi:10.1126/science.1127724. CrossRef Full Text Pubmed
Patanè, D., Chiarabba, C., Cocina, O., Gori, P. D., Moretti, M., and Boschi, E. (2002). Solid Earth-135. Tomographic images and 3D earthquake locations of the seismic swarm preceding the 2001 Mt. Etna eruption: evidence for a dyke intrusion. Geophys. Res. Lett. 29. doi:10.1029/2001gl014391. CrossRef Full Text
Patanè, D., De Gori, P., Chiarabba, C., and Bonaccorso, A. (2003). Magma ascent and the pressurization of Mount Etna’s volcanic system. Science 299, 2061–2063. doi:10.1126/science.1080653. CrossRef Full Text Pubmed
Pezzo, G., Palano, M., Tolomei, C., De Gori, P., Calcaterra, S., Gambino, P., et al. (2020). Flank sliding: a valve and a sentinel for paroxysmal eruptions and magma ascent at Mount Etna, Italy. Geology 48. doi:10.1130/g47656.1. CrossRef Full Text
Puglisi, G., Bonforte, A., Ferretti, A., Guglielmino, F., Palano, M., and Prati, C. (2008). Dynamics of Mount Etna before, during, and after the July–August 2001 eruption inferred from GPS and differential synthetic aperture radar interferometry data. J. Geophys. Res. Solid Earth 113, B06405. doi:10.1029/2006jb004811. CrossRef Full Text
Puglisi, G., Bonforte, A., and Maugeri, S. R. (2001). Ground deformation patterns on Mount Etna, 1992 to 1994, inferred from GPS data. Bull. Volcanol. 62, 371–384. doi:10.1007/s004450000112. CrossRef Full Text
Rasà, R., Azzaro, R., and Leonardi, O. (1996). Aseismic creep on faults and flank instability at Mount Etna volcano, Sicily. Geol. Soc. London Special Public. 110, 179–192. doi:10.1144/gsl.sp.1996.110.01.14. CrossRef Full Text
Rawlinson, N., and Spakman, W. (2016). On the use of sensitivity tests in seismic tomography. Geophys. J. Int. 205, 1221–1243. doi:10.1093/gji/ggw084. CrossRef Full Text
Scandone, R., and Malone, S. D. (1985). Magma supply, magma discharge and readjustment of the feeding system of Mount St. Helens during 1980. J. Volcanol. Geoth. Res. 23, 239–262. doi:10.1016/0377-0273(85)90036-8. CrossRef Full Text
Schuler, J., Greenfield, T., White, R. S., Roecker, S. W., Brandsdóttir, B., Stock, J. M., et al. (2015). Seismic imaging of the shallow crust beneath the Krafla central volcano, NE Iceland. J. Geophys. Res. Solid Earth 120, 7156–7173. doi:10.1002/2015jb012350. CrossRef Full Text
Sharp, A. D. L., Davis, P. M., and Gray, F. (1980). A low velocity zone beneath Mount Etna and magma storage. Nature 287, 587–591. doi:10.1038/287587a0. CrossRef Full Text
Spampinato, L., Sciotto, M., Cannata, A., Cannavó, F., La Spina, A., Palano, M., et al. (2015). Multiparametric study of the February–April 2013 paroxysmal phase of Mt. Etna New South‐East crater. Geochem. Geophys. Geosyst. 16 (6), 1932–1949.
Subramanian, K. R., and Fussell, D. S. (1990). “Applying space subdivision techniques to volume rendering,” in Proceedings of the 1st conference on Visualization’90, San Francisco, CA, October 23–26, 1990 (IEEE Computer Society Press), 150–159.
Tibaldi, A. (2015). Structure of volcano plumbing systems: a review of multi-parametric effects. J. Volcanol. Geoth. Res. 298, 85–135. doi:10.1016/j.jvolgeores.2015.03.023. CrossRef Full Text
Tibaldi, A., and Groppelli, G. (2002). Volcano-tectonic activity along structures of the unstable NE flank of Mt. Etna (Italy) and their possible origin. J. Volcanol. Geoth. Res. 115, 277–302. doi:10.1016/s0377-0273(01)00305-5. CrossRef Full Text
Urlaub, M., Petersen, F., Gross, F., Bonforte, A., Puglisi, G., Guglielmino, F., et al. (2018). Gravitational collapse of Mount Etna’s southeastern flank. Sci. Adv. 4, eaat9700. doi:10.1126/sciadv.aat9700. CrossRef Full Text Pubmed
Viccaro, M., Zuccarello, F., Cannata, A., Palano, M., and Gresta, S. (2016). How a complex basaltic volcanic system works: constraints from integrating seismic, geodetic, and petrological data at Mount Etna volcano during the July–August 2014 eruption. J. Geophys. Res. Solid Earth 121 (8), 5659–5678.
Villaseñor, A., Benz, H. M., Filippi, L., De Luca, G., Scarpa, R., Patanè, G., et al. (1998). Three-dimensional P-wave velocity structure of Mt. Etna, Italy. Geophys. Res. Lett. 25, 1975–1978. doi:10.1029/98gl01240. CrossRef Full Text
Walter, T. R., Acocella, V., Neri, M., and Amelung, F. (2005). Feedback processes between magmatic events and flank movement at Mount Etna (Italy) during the 2002–2003 eruption. J. Geophys. Res. Solid Earth 110, B10205. doi:10.1029/2005jb003688. CrossRef Full Text
Keywords: feeding system, sliding flank, seismic imaging, Marching Cubes, GIS-based system
Citation: Guardo R, De Siena L and Dreidemie C (2020) Mt. Etna Feeding System and Sliding Flank: A New 3D Image From Earthquakes Distribution in a Customisable GIS. Front. Earth Sci. 8:589925. doi:10.3389/feart.2020.589925
Received: 31 July 2020; Accepted: 24 September 2020;
Published: 28 October 2020.
Edited by:
Yosuke Aoki, The University of Tokyo, JapanReviewed by:
Alessandro Tibaldi, University of Milano-Bicocca, ItalyMimmo Palano, Istituto Nazionale di Geofisica e Vulcanologia, Italy
Copyright © 2020 Guardo, De Siena and Dreidemie. This is an open-access article distributed under the terms of the Creative Commons Attribution License (CC BY). The use, distribution or reproduction in other forums is permitted, provided the original author(s) and the copyright owner(s) are credited and that the original publication in this journal is cited, in accordance with accepted academic practice. No use, distribution or reproduction is permitted which does not comply with these terms.
*Correspondence: L. De Siena, bGRlc2llbmFAdW5pLW1haW56LmRl
This article was submitted to Volcanology, a section of the journal Frontiers in Earth Science