Crowdsourced Water Level Monitoring in Kenya’s Sondu-Miriu Basin—Who Is “The Crowd”?
 Björn Weeser1,2
  Jan Gräf1
  Naomi K. Njue1,3,4 Paolo Cerutti3
  Mariana C. Rufino3,5
  Lutz Breuer1,2
  Suzanne R. Jacobs1,2*
- 1Institute for Landscape Ecology and Resources Management (ILR), Justus Liebig University Giessen, Giessen, Germany
- 2Centre for International Development and Environmental Research (ZEU), Justus Liebig University Giessen, Giessen, Germany
- 3Centre for International Forestry Research (CIFOR), Nairobi, Kenya
- 4Department of Agroforestry and Rural Development, University of Kabianga, Kericho, Kenya
- 5Lancaster Environment Centre, Lancaster University, Lancaster, United Kingdom
Citizen science is gaining popularity as a way to engage people to participate in environmental projects. In addition to potential challenges regarding data quality and the choice of variables, a key factor in the success of participatory monitoring projects is the active participation of volunteers, the “citizen scientists.” To learn more about the motivation of citizen scientists to participate and their socio-economic background, a telephone survey was implemented with participants of a citizen science water level monitoring program in the Sondu-Miriu basin, western Kenya. We analyzed the data using descriptive statistics and random forest models to elucidate the characteristics of the participant population, underlying motivations, and the challenges and opportunities to develop recommendations for sustainable community-based water monitoring programs. As citizen scientists who engaged long-term were 30–49 years old, had primary or secondary school education and passed by the monitoring station frequently, targeting sensitization activities at people with such background could increase participation in community-based water monitoring. Sensitization meetings were key in engaging long-term volunteers, but participants indicated that continued feedback through education and communication of the project findings is required to keep volunteers motivated. The use of cellphone credit to submit data was identified as challenge for participation, highlighting the need for data submission methods that do not incur costs for the participants. Greater volunteer support could also be achieved by active involvement of the members of Water Resource Users Associations, since membership increased the likelihood of continuous engagement in water monitoring under the participants. Furthermore, many participants indicated that their motivation was to help water management and conservation, as most people rely directly on rivers for their water supply. Providing a platform to contribute to better water resources management could therefore result in direct benefits (e.g., improved water supply) for the participants, and thus an incentive to participate actively.
Introduction
Currently, two billion people live in an environment where recurrent water stress is expected, hindering sustainability and limiting social and economic development (United Nations, 2018). An increasing water demand from the growing human population will further exacerbate water stress, particularly in certain parts of sub-Saharan Africa (Le Blanc and Perez, 2008). To meet this growing water demand and to allocate water equitably, especially in the context of climate change, improvement of water management practices is crucial. To develop such plans and practices, comprehensive and expensive monitoring approaches, as well as sound data, are needed. However, studies show that the amount of water resource monitoring networks is actually declining worldwide (Vörösmarty et al., 2001; Ruhi et al., 2018). Low-income countries, where improved water management is particularly urgent, often lack the necessary infrastructure and financial capacities. Despite the increased availability of low-cost sensors, remote locations, vandalism, and limited capacity building impede the use of advanced technical devices. Remote sensing approaches have become increasingly available but are still not operational for small catchments. Yet, appropriate monitoring and management of small headwater catchments is crucial to ensure water supply to local communities and downstream regions.
As conventional monitoring approaches are not always adequate or feasible to implement in low-income countries due to the high costs associated with the installation, personnel and maintenance, new ways of data collection need to be explored. Such methods should not rely on major investments, specialized equipment, and highly trained personnel, so that monitoring schemes can be widely implemented with limited financial resources. In recent years, citizen science has increasingly been used for hydrological data collection (Njue et al., 2019). Participation of members of the local community in environmental monitoring offers the possibility to strengthen local stakeholder cooperation, while the data collected by the community members supports evidence-based management decisions (Overdevest et al., 2004; Domroese and Johnson 2017). Additionally, community members can provide valuable local knowledge to support the development of management plans (Whitelaw et al., 2003; Nare et al., 2006). Numerous studies have shown the successful integration of citizens into, for example, water level monitoring (Lowry and Fienen, 2013; Weeser et al., 2018; Lowry et al., 2019; Seibert et al., 2019), precipitation measurements (Reges et al., 2016; Davids et al., 2019) and water quality assessments (Toivanen et al., 2013; Breuer et al., 2015). Furthermore, Weeser et al. (2019) demonstrated that data collected by citizens (crowdsourcing) were valuable for hydrological modeling. Supported by technological developments and the growing use of smartphones, there is an increasing number of environmental variables that can be monitored by citizen scientists (Newman et al., 2012). Citizen science approaches have the additional advantage that they can easily be scaled and, therefore, generally have a better spatial coverage than conventional measurement approaches.
Citizen science has been identified as a highly promising tool for monitoring the sustainable development goals (Quinlivan et al., 2020) and for sustainable development in low-income countries (Pocock et al., 2019). However, the success of any citizen science project depends on the willingness of volunteers to invest their time and knowledge (Parrish et al., 2018). Therefore, knowing what motivates and challenges people’s participation can help to design a successful citizen science project (Shirk et al., 2012). Furthermore, characterizing the socio-economic background of highly motivated participants is important to target the right people (Etter, 2020). Although few studies have made an attempt at analyzing the motivation and methods of engagement of citizen scientists (e.g., Aoki et al., 2017; Rutten et al., 2017; Phillips et al., 2019; Golumbic et al., 2020), most of these studies have focused on western countries, where the majority of the citizen science-based hydrological monitoring programs have been implemented (Njue et al., 2019). Because these findings might not apply to low-income countries due to socio-economic and cultural differences (Hacker et al., 2017), we conducted a telephone survey to explore the motivation, challenges and socio-economic background of participants in a citizen science water level monitoring project in the Sondu-Miriu basin, western Kenya. In this case study, we aimed to identify socio-economic characteristics of the participants with sustained long-term engagement in crowdsourced water monitoring that could be used in future programs. The study looked specifically at motivations, challenges, and opportunities to improve the engagement of the local community in water monitoring to support sustainable water management in regions where hydrological monitoring is difficult.
Material and Methods
Study Area and Project Background
The Sondu-Miriu basin (3,450 km2) in western Kenya is one of the many river basins contributing water to Lake Victoria and the river Nile. Its headwaters lie in the Mau Forest Complex. With more than 40,000 ha, this is East Africa’s largest remaining tropical montane forest and an important “water tower,” providing numerous water-related ecosystem services, such as water storage and supply, groundwater recharge, flood mitigation and micro-climate regulation (Benn and Bindra, 2011). Large-scale conversion of forest to agricultural land, particularly smallholder agriculture, and forest degradation have supposedly led to changes in water quality and flow (e.g.; Mango et al., 2011; Defersha and Melesse 2012; Jacobs et al., 2017; Jacobs et al., 2018). The Sondu-Miriu basin reaches from 1,400 m a.s.l. at the outlet to 2,900 m a.s.l. on the Mau Escarpment. Whereas the upper part of the basin receives 1,900 mm rainfall per year, the lower part is a lot drier (1,300 mm y−1), leading to an imbalanced distribution of water resources. As a result, water availability for the residents and hydropower production in the lower part of the basin strongly depends on rainfall and water abstraction in the upper part. At the same time, the lower part of the basin is prone to flooding caused by heavy rainfall in the headwater area (Ombogo, 2016). In addition to the challenging climate variability within the basin, sustainable water management is further hampered by the lack of data of sufficient quality and spatiotemporal resolution.
To improve the data availability and coverage in the Sondu-Miriu basin, a citizen science water level monitoring project was implemented in 2016. Together with the local Water Resources Authority, 14 suitable locations for water level monitoring were selected and staff gauges were installed (Figure 1). At each location, a sign with pictures and simple written instructions in English and Swahili on how to read the gauge and send the data was installed. Hence, the sign allowed passers-by and interested citizens without prior knowledge of the project or experience with the use of a water level gauge to participate. These citizens submitted data by sending a simple text message (SMS) containing the water level and a station code to a local phone number, provided on the sign. Messages were processed by a server infrastructure based on a Raspberry Pi 2 Model B developed specifically for the project (full details available in Weeser et al. 2018) The participant received a response message, thanking the sender for its contribution and repeating the value and site. The sending time, message and sender number were stored in the server.
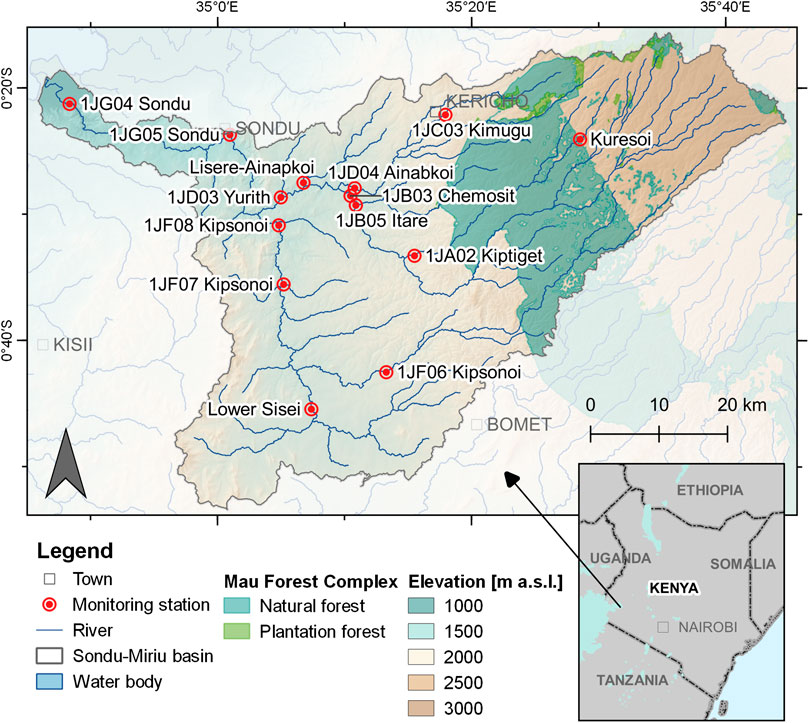
FIGURE 1. Map of the Sondu-Miriu basin in western Kenya, indicating the citizen science water level monitoring stations. Coordinates are displayed in WGS 1984.
At the start of the project, sensitization meetings were conducted with the help of local administration or chairperson of the Water Resource Users Associations (WRUAs), depending on their presence near the station. The establishment of WRUAs was enabled by the Kenyan Water Act (Republic of Kenya, 2002) to support the implementation of water management at the grass root level (Omonge et al., 2020). They are considered important to reduce water allocation conflicts (Mutiga et al., 2010) and enhance the users’ involvement and participation in setting goals and implementation of water management through the development of subcatchment management plans (Omonge et al., 2020). Through these subcatchment management plans, the WRUAs are supposed to promote sustainable and equitable water use, to safeguard water supply to fulfill ecological demands and basic human needs and to improve water quality and quantity through catchment conservation measures (Richards and Syallow, 2018). Therefore, the WRUAs were considered as an essential stakeholder in the project and a good entry point to reach community members with an interest in environmental conservation and management. During the sensitization meetings, participants were informed about the importance of environmental monitoring and purpose of the project. Participants were also trained on how to read the water level gauge and how to send data to the SMS server.
Telephone Survey
To obtain information about the background and motivation of the participating citizen scientists, standardized telephone interviews were conducted in the first week of July 2017. We decided to use a telephone survey, since the telephone numbers of all citizen scientists were available from the SMS server. To overcome potential language barriers, a team of interns of the Water Resources Authority office in Kericho was engaged as enumerators, being fluent in Swahili and English, as well as one of the local languages (Luo or Kalenjin). The enumerators received training and conducted test calls.
All telephone numbers from which at least one message was sent between the start of the citizen science water monitoring project in April 2016 and the 30th of June 2017 were extracted from the SMS server. The telephone members of project staff and employees of the Water Resources Authority were excluded, as well as numbers sending messages for commercial and other non-project related purposes. Each telephone number was called up to three times at different times and days until contact was established. If these attempts were unsuccessful, the person was informed via text message about the survey and asked to arrange a suitable time if interested to participate in the survey. All participants were informed about the objective of the study and were explicitly asked to give consent for the storage, use and publication of the answers provided. No monetary incentive was offered for participation and each interview took about 10 min.
The survey consisted of open and pre-coded questions and was structured in two blocks (Supplementary Appendix S1). The first block consisted of questions to assess the motivation, possible obstacles, and background information. These were structured as four open questions regarding the motivation (e.g., “Why have you decided to participate?”) and possible obstacles (e.g., “Did you face any challenges?”) and five pre-coded questions covering background information (like what kind of phone the participant uses and distance to the gauge). In the second block, three open and two pre-coded questions were asked to obtain socio-economic background information. Some pre-coded questions provided the possibility to give an open answer if the participant did not find an appropriate answer within the given possibilities. The answers of the participants were recorded on printed, standardized survey sheets.
Data Analysis
The survey was digitized by entering all answers in Microsoft Excel. Answers from open questions were coded using the manifest message method (Weisberg et al., 1996), whereby obvious themes, messages and points were extracted from the answers and coded accordingly. For these questions, it was possible to have more than one answer per respondent. A dataset with only valid cases (i.e. survey respondents) was analyzed using R studio Version 2.1.1335.
Engagement
The degree of engagement of citizen scientists was assessed using two measures. Firstly, participants were classified according to the number of valid measurements sent to the SMS server between April 2016 and June 2017. A measurement was considered valid when the site and water level reading could be identified from the message, either by an algorithm implemented on the SMS server itself (Weeser et al., 2018) or through manual interpretation. After inspecting the dataset distribution, participants with 0 or 1, 2 to 9, or 10 or more valid measurements were classified as low, medium, and high level of engagement, respectively.
As a second measure of engagement, telephone numbers from which water level measurements were submitted between the first of July 2017 and the 31st of December 2018 were extracted from the SMS database. If a participant continued to submit measurements after completion of the telephone survey, the participant was classified as a long-term participant. In contrast, participants who only submitted data before the survey was conducted were classified as short-term participants.
Random Forest
We used the random forest algorithm (Breiman, 2001) to classify respondents as having a low, medium or high level of engagement and whether they were short-term or long-term engaged, based on several explanatory variables. The latter included source of information about the project, frequency of passing the station, distance to station, type of phone, age class, level of education and WRUA membership.
For the two indicators of engagement (level and duration), we ran the randomForest function from the R package “randomForest” (Breiman et al., 2018), creating 5,000 decision trees using sampling with replacement and testing 2 variables at each node. The function calculated the out-of-bag (OOB) error rate, which we used as indicator for model accuracy. The importance of each explanatory variable was assessed with the mean decrease in Gini index by exclusion of the variable, as calculated by the randomForest function. The order of the explanatory variables based on decreasing Gini index value represents the relative importance of each variable to classify the dependent variable. Only cases without missing data were included in the analysis (n = 76; 88% of dataset). The algorithm was run 10,000 times, following a Monte Carlo approach, whereby the median values for OOB and the importance of the explanatory variables over all runs was calculated, together with the minimum and maximum values as a measure of uncertainty.
Results
Engagement of Project Participants
Out of 155 phone numbers submitting a message (referred to as participants) between April 2016 and June 2017, 87 took part in the telephone survey (referred to as respondents), resulting in a response rate of 56%. Six respondents did not submit a valid measurement. For three of these, the site from which they sent the message could be identified. The remaining three respondents were classified to site “Unknown,” together with other participants sending only invalid measurements without being able to identify the corresponding site (n = 14; Figure 2A).
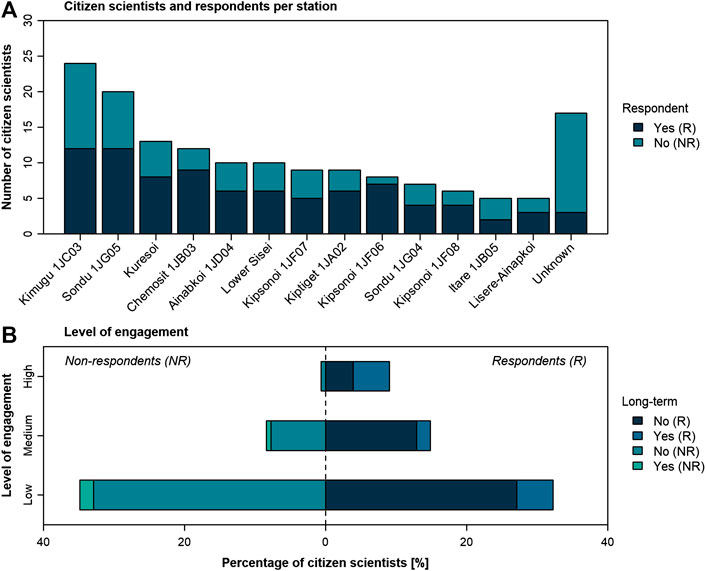
FIGURE 2. Number of citizen scientists (n = 155), classified as survey respondent (R) or non-respondent (NR) of the survey, (A) per site and (B) by level of engagement in the crowdsourced water monitoring project in the Sondu-Miriu basin, Kenya between April 2016 and June 2017. Overall engagement was assessed by total number of valid measurements until June 2017 (Low = 0–1, Medium = 2–9, High = 10 or more). Long-term engagement was assessed based on the contribution of additional measurements after June 2017.
Among all participants, 67% sent 0 to 1 valid message and were therefore classified as showing a low level of engagement (Figure 2B). Nevertheless, 11 of these participants contributed additional measurements after June 2017, suggesting a long-term commitment to the project. In total, 83% of the citizen scientists showing long-term commitment (n = 23) participated in the survey. The response rate was highest under participants with a high level of engagement (93%, n = 14), followed by respondents with a medium (64%, n = 23) and low level of engagement (48%, n = 50).
Characterization of Participants
Only 5 women participated in the survey compared to 78 men (4 respondents did not provide an answer), which seems representative based on female participation in sensitization meetings at the start of the project. During the sensitization meetings a briefing about the project and a short training was conducted with interested citizens and, where available, the WRUA members. The majority of the respondents were under 50 years old (90%, n = 76), with 34 of the respondents being 20–29 years old (Supplementary Appendix S2). Three respondents stated that they did not have any formal education, whereas the remaining participants were fairly equally distributed among primary, secondary and higher (e.g., vocational training, college or university degree) education.
The sign at the monitoring sites and sensitization meetings were the most effective methods to reach participants, with 69 respondents (79%) identifying these as their source of information. Eight out of 14 highly engaged respondents (57%) were informed through the sensitization meetings, whereas the majority of the respondents with a low level of engagement (60%) read the sign near the gauge (Figure 3A). Other sources of information mentioned by the respondents included the Water Conservation Forum (n = 1) and the project staff during installation of the gauges (n = 1). Although only 6 of the respondents indicated to have been informed about the project through the Water Resources Users Association, 20 respondents stated they were members of the local WRUA. Of the non-members, 26 were aware of the WRUA, 28 had not heard about WRUAs before and 13 did not answer the question whether they had heard about the WRUA.
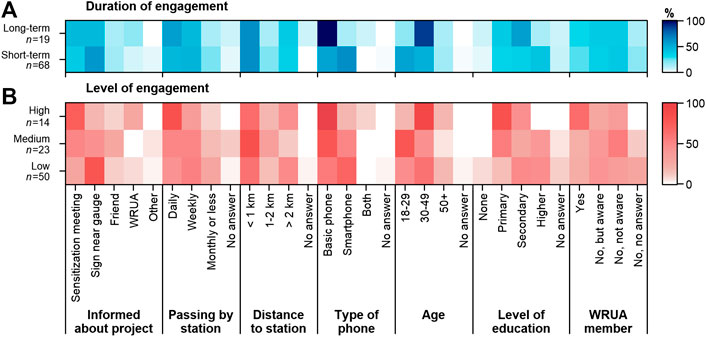
FIGURE 3. Characterization of the participants of the citizen science water monitoring project in the Sondu-Miriu basin, Kenya, according to different engagement classes, expressed as percentage of respondents within each class. The duration of engagement is based on whether the respondent continued sending data after June 2017. The level of engagement is based on the number of valid measurements contributed between April 2016 and June 2017 (Low = 0–1, Medium = 2–9, High = 10 or more). n = number of respondents within each engagement class; WRUA = Water Resource Users Association.
The observation of the water level (“amount of water” in the survey) was perceived most frequently as purpose of the water monitoring project by the respondents (n = 46; Figure 4A). This was followed by monitoring for management and conservation purposes (n = 27). Other perceived purposes included monitoring floods, rainfall patterns and the weather (n = 4), to determine water quality (n = 2), to warn people for disasters (n = 1) and to know about climate change (n = 1).
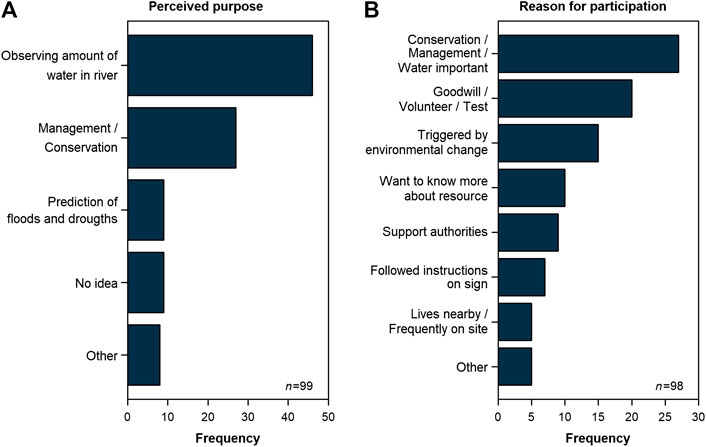
FIGURE 4. Respondents’ answers on (A) the perceived purpose of the water monitoring project and (B) their reason to participate as citizen scientist. n = number of responses.
When asked about their motivation for participation, the importance of water as a resource and the desire to assist in conservation and management of the resource was mentioned most frequently (n = 27), followed by the willingness to volunteer or curiosity to test the system (n = 20; Figure 4B). Fifteen respondents mentioned that they participated because they were triggered by the changes observed in the environment and water supply patterns over the years. Other reasons for participation included the expectation to be paid (n = 2), to assist in monitoring the environment (n = 1), a general concern about the environment (n = 1) and because the respondent previously worked with project partner German Corporation for International Cooperation (GIZ) (n = 1).
Roughly half of the respondents (n = 46) estimated they lived within 1 km distance of the closest monitoring station, while 26 indicated they lived more than 2 km away. Those living closest passed by the site relatively more often, with daily visits by 24 respondents living <1 km from station, compared to 3 living 1–2 km away and 8 respondents living more than 2 km away. Normal cellphones without comprehensive mobile computing functionality (n = 47, 55%) were more often used to participate in the water monitoring project than smartphones. This was especially common among the older (≥30 years old) respondents (n = 33 for basic phone, n = 17 for smartphone).
Based on the survey information, the highest level of engagement was found for people who were 30–49 years old, with a primary school education (Figure 3B). Highly engaged participants were also characterized by passing by the station on a daily basis, living with 1 km of the station and being a WRUA member. These highly engaged participants mainly learnt about the project through the sensitization meetings. Similar socio-economic background characterized respondents with a long-term engagement, although WRUA membership was less important for this group than for highly engaged participants and most respondents had secondary school education (Figure 3A). A high level of engagement did not result in long-term commitment, with 8 out of 14 highly engaged respondents also showing long-term engagement. Conversely, neither did a low level of engagement preclude long-term commitment: 8 out of 50 respondents with a low level of engagement continued sending data after June 2017.
Challenges and Opportunities
In total, 54 respondents (62%) indicated that they experienced no challenges when participating in the project. Nevertheless, 25 of these respondents said they stopped participating. Of the 33 respondents (38%) that did experience challenges, 16 respondents indicated they stopped participating. Difficult access and lack of cellphone credit (each n = 10) were mentioned most frequently (Figure 5A). The state of the gauge (either damaged or because the water level was below or above the gauge; n = 6) and difficulty with making an accurate reading due to turbulence (n = 5) were also mentioned as challenges to sending data. Only one respondent indicated that further training was necessary.
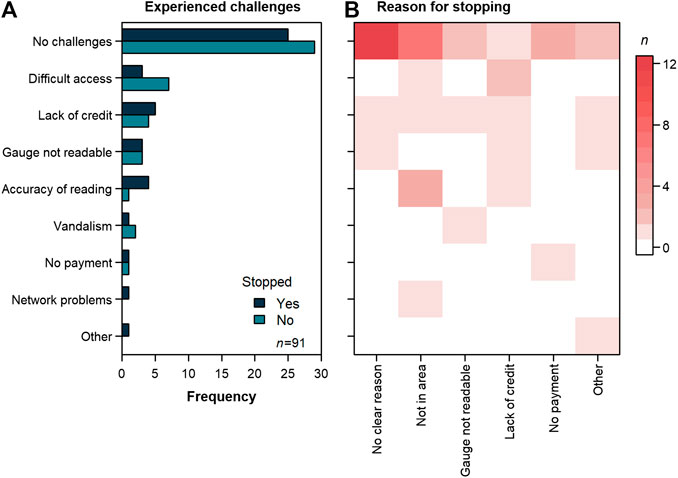
FIGURE 5. Respondents’ answers regarding (A) type of challenges experienced, classified by whether the respondent indicated to have stopped participating, and (B) reason stated for stopping participation, grouped by challenge. n = number of responses.
Eleven out of 25 respondents that stopped despite not experiencing challenges indicated to have no clear reason for stopping (Figure 5B). Absence from the area, due to, for example, living far from the station or temporary migration for education purposes, was another common reason (n = 12). Other responses included a lack of communication about the project (n = 2), loss of the phone or phone number (n = 2) and having given the responsibility to another person (n = 1). Challenges did not necessarily translate in a reason to stop participation. Note, for example, that out of 5 respondents mentioning lack of cellphone credit as challenge, only one respondent gave this as reason for stopping. In general, experiencing challenges to participate was not a determinant to stop participating (χ2 = 0.012, p = 0.913).
The majority of the respondents indicated that more training, education and sensitization meetings were required to encourage more people to participate (n = 58). Increased advertisement through, for example signs and social media was mentioned 12 times, whereas three respondents mentioned to encourage participation through word of mouth (e.g., community leaders, friends). Paying the participants was mentioned by 18 respondents. In addition, one respondent suggested to use a toll-free number, such that volunteers would not spend their own cellphone credit on sending data. Two respondents mentioned feedback to the community as a way of keeping volunteers engaged, as well as activities by project leads to maintain motivation after the start of the project (n = 3). Better targeting of communities (those living next to the river) was mentioned once, as was better maintenance of the gauge.
Explanatory Variables
The random forest models had a moderate explanatory power for both duration and level of engagement. The model for the level of engagement had a median out-of-bag error rate of 46.1% (range: 42.1–50.0%). This was caused by high error rates for the classes “Medium engagement” and “High engagement” (OOB error rate >70%). Investigation of the mean decrease in Gini index showed that the variable “Phone type” was not as important as the other variables. A second run without this variable yielded a lower OOB error rate (median: 40.3%, range: 37.7–45.5%) (Figure 6A). Especially the accuracy for the class “High engagement” improved (median: 57.1%, range: 57.1–64.3%). Respondents in the category “Low engagement” were best predicted, with an OOB error rate of 20.9% (16.3–25.6%), but “Medium engagement” still had a high OOB error rate (70.0%; 65.0–85.0%). The algorithm performed better for the duration of engagement, with an OOB error rate of 26.3% (25.0–30.3%). However, long-term engagement had an OOB error rate of 93.8% (81.3–93.8%), while the OBB error rate for short-term engagement was only 8.3% (6.7–13.3%).
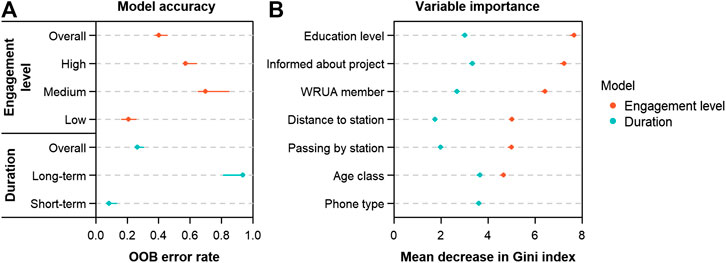
FIGURE 6. Performance of the random forest models to predict the level and duration of engagement of the participants in the citizen science water monitoring project: (A) model accuracy based on out-of-bag (OOB) error rate and (B) relative importance of the included variables in each model. The circles indicate the median value, the segments indicate the range of values across 10,000 runs.
Based on the mean decrease in Gini index, where a higher decrease indicate a higher variable importance, the highest level of education was the most important variable determining the level of engagement, followed by the source of information about the project and WRUA membership (Figure 6B). Participants with a high level of engagement were characterized by primary education, WRUA membership and participation in the sensitization meeting. The frequency of passing by a monitoring station, the distance to the station and the age class of the participant were less important. Regarding the duration of the engagement, age class, phone type and source of information were the most important variables, whereby participants aged 30 to 49 with a basic phone, who were informed through the sensitization meeting or the sign near the gauge were more likely to participate long-term. As for level of engagement, frequency of passing by the station as well as distance to station were the least important to determine the duration of engagement.
Discussion
Who Participated in Water Monitoring?
The first aim of this study was to characterize the participants who are likely to be engaged with the project in the long-term. Identification of target groups for citizen science projects could increase the likelihood of success of a project (Parrish et al., 2018; Füchslin et al., 2019). The majority of the respondents in our study was between 30 and 50 years old. This group also had the largest number of long-term or highly engaged participants. This evidence differs from the findings of Füchslin et al. (2019), who found that older people (aged 50 and above) showed a higher willingness to participate in citizen science projects than younger people in Switzerland. However, those who showed more willingness to participate often had more free time (e.g., retirement or part-time work) or had a higher proximity and trust in science (Füchslin et al., 2019). These characteristics are unlikely to apply to the participants in the Kenyan citizen science project, due to the rural setting where many people are dedicated to lifelong full-time farming activities, and many have relatively low education level (e.g., only 25 out 87 respondents reported having received education beyond secondary school).
Younger people (<30 years old) were found to participate less (low or medium engagement level) or short-term, as observed in other studies (e.g. Alender 2016; Beza and Assen 2016; Etter 2020). Nevertheless, age class was a poor predictor for the level of engagement, as demonstrated by the low variable importance (decrease in Gini index) in the random forest model (Figure 6B). A similar distribution of participants among age classes for the three levels of engagement (Figure 3B) makes it difficult to use this variable to assess the likelihood of an individual to be highly engaged. On the other hand, there was a clear distinction in age distribution between those who were long-term and short-term engaged, with the majority of the long-term engaged respondents in the 30–49 years age class and most of the short-term engaged respondents under 30 years.
Due to the high gender imbalance among respondents (78 men, 5 women), we could not properly assess the effect of gender on participation rate. There is no clear trend on whether men or women are more likely to participate in citizen science projects (Phillips et al., 2019), and Füchslin et al. (2019) found that gender was not important in determining the likelihood of people to participate in a citizen science project. However, the dominance of male respondents in our telephone survey could reflect the gender ratio across all participants in our project. Although a study in the neighboring Nyando basin indicated that women were the most important collectors of water in 77% of the households (Onyango et al., 2007) and are thus more likely to visit monitoring stations frequently, their participation might be limited by a generally lower education level (Republic of Kenya, 2019). Furthermore, in certain parts of the Sondu-Miriu basin phone ownership for women is still lower than that for men (Republic of Kenya, 2019), which aligns with the overall gender gap in phone ownership in low-income countries (Rowntree et al., 2019). Furthermore, despite attempts by the Kenyan government to increase participation of women in water management by limiting the representation of men to two-thirds in any government arrangement including the Water Resource Users Associations (WRUAs), ensuring equal participation of men and women in barazas (community meetings organized by the area chief) and other events is still challenging (Ifejika Speranza and Bikketi, 2018). Therefore, women could be less informed about projects such as our water level monitoring. The high importance of the variable “Source of information about the project” for both level and duration of engagement and the majority of the highly motivated respondents having been informed through sensitization meetings, indicates that targeted communication could be an important entry point to sustain participation.
The highest completed level of education was also found to be an important characteristic to determine the level and duration of engagement. Unlike citizen science projects in India (Johnson et al., 2014) and the United States (Domroese and Johnson, 2017), where the majority of the participants completed education beyond secondary school, respondents with a higher level of education in our study showed less long-term engagement and sent fewer data. A medium to high level of engagement was mainly found under respondents that had only completed primary school, whereas those educated up to secondary school level were more likely to be a long-term participant. As there are few job opportunities in rural areas in Africa, people with higher education diplomas likely move to towns and cities (Ginsburg et al., 2016), and are thus unable to contribute frequently or long-term to a citizen science project in their rural home.
Finally, distance to the station did not determine the level and duration of engagement of the citizen scientists as those living closest to the monitoring stations made up the highest number of respondents in each engagement class. Furthermore, distance to site and frequency of passing by both had a low importance (low decrease in the Gini index) in the random forest model for both indicators of engagement. Nevertheless, the majority of the respondents who were highly or long-term engaged visited the station on a daily basis, suggesting that targeting those people who live closest to the station could help to ensure a good pool of volunteers.
Why do Citizens Participate?
Knowing the socio-economic characteristic of highly motivated citizen scientists is not sufficient for successful engagement of community members in research or data collection. Adapting the rationale of a project to what motivates potential participants could ensure long-term participation. Following the framework of Batson et al. (2002) to classify motivations for community engagement, the majority of the respondents in our survey indicated altruistic and collectivistic motivations. The respondents hoped to contribute to water management and conservation from the viewpoint that water is an important resource for all and a concern triggered by changes in the environment (e.g. changing rainfall patterns).
Although citizen involvement in such projects is often seen as form of community empowerment (Aoki et al., 2017), none of the respondents indicated that they expected to actively participate in water management. Poor knowledge and information sharing on how communities can contribute to local water management, as enforced through the establishment of WRUAs could contribute to the lack of motivation to take action. For example, one third of the participants indicated not to be aware of the existence of WRUAs and thus of their roles and responsibilities. In addition, when asked what the purpose of sending water level data was, less than half of the respondents indicated purposes such as informing water management, conservation and flood prediction. Improved awareness about the relevance of monitoring the water and increased involvement of WRUAs in this process could help to increase the motivation to participate, as it will be clearer what the overall benefit of this collective action is.
Concern about the amount or quality of the water, as well as environmental changes over time seemed to have triggered the majority of participants to take part. This concern about the environment and altruistic behavior of participants was also found in nature conservation and water monitoring projects (Johnson et al., 2014; Alender, 2016; Phillips et al., 2019). In the context of our project, this could also be considered self-interest, because the participant could eventually also benefit from improved water management leading to better access to clean water. Unlike other studies, where an interest to contribute to science was found to be an important motivation for participation (e.g. Füchslin et al., 2019; Vries et al., 2019), none of the respondents mentioned this. Also, motivations related to principlism, i.e. the upholding of some moral principle (Batson et al., 2002), were not mentioned. Etter (2020) found that such motivations were more relevant in a nature monitoring project than in a water level measurement project, highlighting that the subject and type of citizen science project also plays a role in the motivation of people to participate.
Fewer respondents mentioned self-interest motivations such as wanting to learn more about the water resources. Etter (2020) argues that learning is not as relevant in water monitoring projects, as there is less to learn from simply submitting water level data compared to, for example, identification of plants and animals. Furthermore, Aoki et al. (2017) found that participation out of concern for their own environment, which applies to the majority of the participants in our study, was a more important motivation in an air pollution project in the United States than the wish to learn about the environment. Nevertheless, people might expect to learn something from participating and the failure to fulfill this expectation might lead to low and short-term engagement of citizen scientists.
Why Do Participants Withdraw?
Although the citizen science water monitoring project in the Sondu-Miriu basin managed to engage 155 people, only few of these participants were very active and kept on sending data for multiple years. Having a smaller group of very active contributors is not unusual in such projects (e.g. Domroese and Johnson 2017; Etter, 2020), but tackling the challenges encountered by those who stop participating could boost the feasibility of sustainable citizen science-based data collection. Although citizens are able to participate and collect relevant data, they are not always motivated. Aoki et al. (2017) indicate that experiencing personal consequences from the environmental problem that is addressed by the project is more likely to motivate people than a more general environmental concern. Also intrinsic motivation, such as having an interest in the topic or willingness to learn, and the fulfilment of that expectation are very important for long-term commitment (Deci and Ryan, 2000). Nevertheless, in our study, none of the motivations indicated by the respondents were characteristic for high or long-term engagement.
Awareness raising seemed to be important for long-term engagement of the participants in our project, as well as elsewhere (Hobbs and White 2012). The majority of the highly motivated and long-term engaged respondents in our study indicated they heard about the project through organized sensitization meetings. Although word of mouth is seen as an effective means to reach a wider audience (Johnson et al., 2014), only few respondents who were informed about the project by friends kept engaged for a long time. The same applied to those who were informed through the instructional sign at the station, with 75% of this group of respondents sending only one message. Although the sign indicated that submitting water level information could help the community (“Support your community and take care of your water!”), the relevance was probably not clear enough to motivate people to continue sending data (Pocock et al., 2019). This suggests that simply knowing about the project and perhaps contributing a few messages without regular feedback is not sufficient to motivate volunteers long-term. A review by Vries et al. (2019) came to the conclusion that participants value accessibility of their collected data, communication of project findings, and acknowledgment in publications and that this feedback can enhance the motivation of the participants. More than half of the respondents recommended more sensitization meetings even though no in-kind or monetary contribution was offered for participation. Additionally, they mentioned project feedback to participants and other project-related activities to encourage participation, which is a clear indication that active and continued communication with the volunteers is essential for a long-term project.
The relative simplicity of the measurement did not seem to form a barrier for long-term participation (Aoki et al., 2017). Although illiteracy could hinder participation, only one respondent indicated that further training was required. However, numerous respondents mentioned that readability of the gauge, vandalism and accuracy of the reading due to turbulence hindered participation (n = 14) and three respondents mentioned these as reasons for stopping to participate. These respondents mainly fell in the low level of engagement class, suggesting that improved gauge maintenance could remove a barrier for long-term participation. On the other hand, 7 out of 20 medium or highly engaged respondents that experienced challenges mentioned lack of cellphone credit, although only three of these stopped participating for different reasons. The use of a toll-free number to submit measurements could address this challenge, as participants would not have to spend their own cellphone credit. At 1 KES (∼0.01 USD) per message, this might be a barrier for participation by people from socio-economic deprived groups (Hobbs and White 2012).
A common reason for limited engagement of citizen scientist is a mismatch between data collection and the expectations that citizens have (Aoki et al., 2017; Etter, 2020). Two respondents mentioned the expectation to be paid as a reason to participate, whereas four medium and highly engaged respondents indicated they stopped participating because they did not get paid. Furthermore, 18 respondents indicated that the project would be more successful if the volunteers would get paid, which goes against the principles of citizen science, whereby citizens voluntarily (i.e. without in-kind or monetary reward) participate in scientific activities. In addition to the expectation to be paid, participants might have gotten discouraged by the lack of other direct benefits. Those who hoped the project would lead to changes in the short-term, did not experience any change in water quality or supply as a consequence of improved management since the start of the project. Again, targeted and relevant communication could play a role here, as numerous studies found that citizen scientists appreciated communication of project findings more than receiving appreciation or recognition for their contribution (Alender 2016; Vries et al., 2019; Golumbic et al., 2020). Regular feedback through meetings or social media could keep participants updated about the impact of their contributions and help them to see why continuing sending data is important. This is supported by the feedback by some respondents who indicated that more motivation from authorities could help to increase participation in the citizen science project. WRUAs could play a big role in this, as they are most likely better embedded in local communities than high level authorities or international project staff. Also accessibility to the collected data is a good way to keep citizen scientists engaged (Vries et al., 2019). However, this is challenging in a setting whereby only few people have access to internet and in the absence of a suitable infrastructure (e.g. WRUA offices where data could be accessed). Nevertheless, a user-friendly platform to share data and inform participants could enhance the success of a citizen science project (Golumbic et al., 2020). Also showing appreciation through “Thank you” messages, as implemented in our project, could help citizen scientists to stay committed (Lowry et al., 2019; Vries et al., 2019).
Recommendations
Previous studies have shown that water level monitoring of sufficient spatial and temporal resolution can be achieved through citizen involvement, also in rural areas and low-income countries (Weeser et al., 2018; Weeser et al., 2019). In our study, we show that there are highly and long-term engaged citizens that are willing to participate, but there are still challenges to overcome. Long-term water level monitoring through citizen involvement does not necessarily require a few highly engaged citizens. A larger number of short-term participants or people with a low level of engagement could also make a valuable contribution. This is facilitated by the simplicity of the data collection method used in the project in the Sondu-Miriu basin and the fact that nothing but a simple mobile phone is required, especially since smartphone ownership in East Africa is still limited (Pocock et al., 2019). A toll-free number or reimbursement of cellphone credit used to submit data could lower the barrier for participation even further, and at the same time address some of the challenges mentioned by the respondents.
Based on the results of this study, sensitization meetings are a powerful means to reach out to the community and engage motivated volunteers. These meetings should be aimed at community members that frequently visit the site and are unlikely to move away for jobs or education. Those who depend on the river as source of water for domestic use or other activities (e.g. watering livestock) are also more likely to be concerned about their resource and have a higher incentive to participate. Specific targeting of WRUA members as existing community of people with an interest in water management is useful as well, as the project could address their needs (Golumbic et al., 2020). In general, active involvement of WRUAs in engaging volunteers and communicating results back to their members could increase the number of highly engaged volunteers. This requires recognition by the local and national water management authorities, who are there to support the WRUAs, as the establishment of WRUAs and development of subcatchment management plans is still in its infancy in many parts of Kenya. Embedding low-cost participatory approaches in water management practices can also empower the WRUAs, as it would give them a means to collect and access data which can help in the development of their subcatchment management plans. This would add a clear aim and benefit to all community members who depend on the local water resources, increase the awareness of the relevance of monitoring and thus motivate people to participate.
Data Availability Statement
The original contributions presented in the study are included in the article/Supplementary Material, further inquiries can be directed to the corresponding author.
Author Contributions
BW, JG, LB, and MR designed the study. NN, JG, and PC developed the survey. JG carried out and digitized the survey. BW and SJ analyzed the data and drafted the manuscript. PC, MR, and LB reviewed and edited the manuscript.
Funding
The program was funded by the Deutsche Gesellschaft für Internationale Zusammenarbeit GIZ, and the German Federal Ministry for Economic Cooperation and Development (Grants 81195001 “Low Cost methods for monitoring water quality to inform upscaling of sustainable water management in forested landscapes in Kenya” and 81206682 “The Water Towers of East Africa: policies and practices for enhancing cobenefits from joint forest and water conservation”). We also thank the German Academic Exchange Service (DAAD) and the National Research Fund (NRF), Kenya for the scholarship award for Naomi Njue and the German Science Foundation DFG (BR2238/23-1) for co-funding this research. This work is a contribution to the CGIAR program on Forest, Trees and Agroforestry led by the Center for International Forestry Research (CIFOR).
Conflict of Interest
The authors declare that the research was conducted in the absence of any commercial or financial relationships that could be construed as a potential conflict of interest.
Acknowledgments
We would like to express our thanks to the Water Resource Users Associations and citizens of the Sondu-Miriu basin who participated in our program and to the team of interns at the Water Resources Authority (WRA) office in Kericho for carrying out the telephone survey. We highly appreciate the support of Anne-Marie Ran and Zacchaeus Kemboi (GIZ) as well as the officers of WRA in the implementation of the program.
Supplementary Material
The Supplementary Material for this article can be found online at: https://www.frontiersin.org/articles/10.3389/feart.2020.602422/full#supplementary-material.
References
Alender, B. (2016). Understanding volunteer motivations to participate in citizen science projects: a deeper look at water quality monitoring. J. Sci. Commun. 15 (3), A04. doi:10.22323/2.15030204
Aoki, P., Woodruff, A., Yellapragada, B., and Willett, W. (2017). “Environmental protection and agency: motivations, capacity, and goals in participatory sensing,” in Proceedings of the 2017 CHI Conference on Human Factors in Computing Systems, Denver, CO, May 2017, Association for Computing Machinery, 3138–3150.
Batson, C. D., Ahmad, N., and Tsang, J.-A. (2002). Four motives for community involvement. Journal of Social Issues 58 (3):429–445. doi:10.1111/1540-4560.00269
Benn, J., and Bindra, S. (2011). UNEP annual report 2010 a year in review. Nairobi, Kenya: United Nations Environment Programme (UNEP).
Beza, S. A., and Assen, M. A. (2016). Soil carbon and nitrogen changes under a long period of sugarcane monoculture in the semi-arid East African Rift Valley, Ethiopia. J. Arid Environ. 132, 34–41. doi:10.1016/j.jaridenv.2016.04.005
Breuer, L., Hiery, N., Kraft, P., Bach, M., Aubert, A. H., and Frede, H. G. (2015). HydroCrowd: a citizen science snapshot to assess the spatial control of nitrogen solutes in surface waters. Sci. Rep. 5, 16503. doi:10.1038/srep16503
Davids, J. C., Devkota, N., Pandey, A., Prajapati, R., Ertis, B. A., Rutten, M. M., et al. (2019). Soda bottle science—citizen science monsoon precipitation monitoring in Nepal. Front. Earth Sci. 7. doi:10.3389/feart.2019.00046
Deci, E. L., and Ryan, R. M. (2000). The “what” and “why” of goal pursuits: human needs and the self-determination of behavior. Psychol. Inq. 11 (4), 227–268. doi:10.1207/S15327965PLI1104_01
Defersha, M. B., and Melesse, A. M. (2012). Field-scale investigation of the effect of land use on sediment yield and runoff using runoff plot data and models in the Mara River basin, Kenya. CATENA 89, 54–64. doi:10.1016/j.catena.2011.07.010
Domroese, M. C., and Johnson, E. A. (2017). Why watch bees? Motivations of citizen science volunteers in the Great Pollinator Project. Biol. Conserv. 208:40–47. doi:10.1016/j.biocon.2016.08.020
Etter, S. (2020). CrowdWater: motivations of citizen scientists, the accuracy and the potential of crowd-based data for hydrological model calibration. Dissertation, Zürich, Switzerland: Universität Zürich.
Füchslin, T., Schäfer, M. S., and Metag, J. (2019). Who wants to be a citizen scientist? Identifying the potential of citizen science and target segments in Switzerland. Publ. Understand. Sci. 28 (6), 652–668. doi:10.1177/0963662519852020
Ginsburg, C., Bocquier, P., Béguy, D., Afolabi, S., Derra, K., Augusto, O., et al. (2016). Human capital on the move: education as a determinant of internal migration in selected INDEPTH surveillance populations in Africa. Demogr. Res. 34 (30), 845–884. doi:10.4054/DemRes.2016.34.30
Golumbic, Y. N., Baram-Tsabari, A., and Koichu, B. (2020). Engagement and communication features of scientifically successful citizen science projects. Environ. Commun. 14 (4), 465–480. doi:10.1080/17524032.2019.1687101
Hacker, E., Picken, A., and Lewis, S. (2017). “Perceptions of volunteering and their effect on sustainable development and poverty alleviation in Mozambique, Nepal and Kenya,” in Perspectives on volunteering: voices from the south. J. Butcher, and C. J. Einolf, Eds. Cham, Switzerland: Springer International Publishing, 53–73.
Hobbs, S. J., and White, P. C. L. (2012). Motivations and barriers in relation to community participation in biodiversity recording. J. Nat. Conserv. 20 (6), 364–373. doi:10.1016/j.jnc.2012.08.002
Ifejika Speranza, C., and Bikketi, E. (2018). “Engaging with gender in water governance and practice in Kenya,” in Water security across the gender divide. C. Fröhlich, G. Gioli, R. Cremades, and H. Myrttinen, Eds. Cham, Switzerland: Springer International Publishing, 125–150.
Jacobs, S. R., Breuer, L., Butterbach-Bahl, K., Pelster, D. E., and Rufino, M. C. (2017). Land use affects total dissolved nitrogen and nitrate concentrations in tropical montane streams in Kenya. Sci. Total Environ. 603-604, 519–532. doi:10.1016/j.scitotenv.2017.06.100
Jacobs, S. R., Timbe, E., Weeser, B., Rufino, M. C., Butterbach-Bahl, K., and Breuer, L. (2018). Assessment of hydrological pathways in East African montane catchments under different land use. Hydrol. Earth Syst. Sci. 22 (9), 4981–5000. doi:10.5194/hess-22-4981-2018
Johnson, M. F., Hannah, C., Acton, L., Popovici, R., Karanth, K. K., and Weinthal, E. (2014). Network environmentalism: citizen scientists as agents for environmental advocacy. Global Environ. Change 29, 235–245. doi:10.1016/j.gloenvcha.2014.10.006
Le Blanc, D., and Perez, R. (2008). The relationship between rainfall and human density and its implications for future water stress in Sub-Saharan Africa. Ecol. Econ. 66 (2), 319–336. doi:10.1016/j.ecolecon.2007.09.009
Lowry, C. S., and Fienen, M. N. (2013). CrowdHydrology: crowdsourcing hydrologic data and engaging citizen scientists. Ground Water 51 (1), 151–156. doi:10.1111/j.1745-6584.2012.00956.x
Lowry, C. S., Fienen, M. N., Hall, D. M., and Stepenuck, K. F. (2019). Growing pains of crowdsourced stream stage monitoring using mobile phones: the development of CrowdHydrology. Front. Earth Sci. 7, 36. doi:10.3389/feart.2019.00128
Mango, L. M., Melesse, A. M., McClain, M. E., Gann, D., and Setegn, S. G. (2011). Land use and climate change impacts on the hydrology of the upper Mara River Basin, Kenya: results of a modeling study to support better resource management. Hydrol. Earth Syst. Sci. 15, 2245–2258. doi:10.5194/hess-15-2245-2011
Mutiga, J. K., Mavengano, S. T., Zhongbo, S., Woldai, T., and Becht, R. (2010). Water allocation as a planning tool to minimise water use conflicts in the upper ewaso Ng’iro North basin, Kenya. Water Resour. Manag. 24 (14), 3939–3959. doi:10.1007/s11269-010-9641-9
Nare, L., Love, D., and Hoko, Z. (2006). Involvement of stakeholders in the water quality monitoring and surveillance system: the case of Mzingwane Catchment, Zimbabwe. Phys. Chem. Earth, Parts A/B/C 31 (15), 707–712. doi:10.1016/j.pce.2006.08.037
Newman, G., Wiggins, A., Crall, A., Graham, E., Newman, S., and Crowston, K. (2012). The future of citizen science: emerging technologies and shifting paradigms. Front. Ecol. Environ. 10 (6), 298–304. doi:10.1890/110294
Njue, N., Kroese, J. S., Gräf, J., Jacobs, S. R., Weeser, B., Breuer, L., et al. (2019). Citizen science in hydrological monitoring and ecosystem services management: state of the art and future prospects. Sci. Total Environ. 639. 133531. doi:10.1016/j.scitotenv.2019.07.337
Ombogo, L. (2016). Rainfall Trends and flooding in the Sondu miriu river basin. Master Thesis, Nairobi, Kenya. University of Nairobi.
Omonge, P., Herrnegger, M., Gathuru, G., Fürst, J., and Olang, L. (2020). Impact of development and management options on water resources of the upper Mara River Basin of Kenya. Water Environ. J 34 (4), 644–655. doi:10.1111/wej.12554
Onyango, L., Swallow, B., Roy, J., and Meinzen-Dick, R. (2007). “Coping with history and hydrology: how Kenya’s settlement and land tenure patterns shape contemporary water rights and gender relations in water,” in Community-based water law and water resource management reform in developing countries. B. Koppen, M. Giordano, and J. Butterworth, Eds. Oxfordshire, United Kingdom. Centre for Agriculture and Biosciences International, 173–195.
Overdevest, C., Orr, C., and Stepenuck, K. F. (2004). Volunteer stream monitoring and local participation in natural resource issues. Res. in Hum. Ecol. 11 (2), 177–185.
Parrish, J. K., Burgess, H., Weltzin, J. F., Fortson, L., Wiggins, A., and Simmons, B. (2018). Exposing the science in citizen science: fitness to purpose and intentional design. Integr. Comp. Biol. 58 (1), 150–160. doi:10.1093/icb/icy032
Phillips, T. B., Ballard, H. L., Lewenstein, B. V., and Bonney, R. (2019). Engagement in science through citizen science: moving beyond data collection. Sci. Educ. 103 (3), 665–690. doi:10.1002/sce.21501
Pocock, M. J. O., Roy, H. E., August, T., Kuria, A., Barasa, F., Bett, J., et al. (2019). Developing the global potential of citizen science: assessing opportunities that benefit people, society and the environment in East Africa. J. Appl. Ecol. 56 (2), 274–281. doi:10.1111/1365-2664.13279
Quinlivan, L., Chapman, D. V., and Sullivan, T. (2020). Applying citizen science to monitor for the sustainable development goal indicator 6.3.2: a review. Environ. Monit. Assess. 192 (4), 218. doi:10.1007/s10661-020-8193-6
Reges, H. W., Doesken, N., Turner, J., Newman, N., Bergantino, A., and Schwalbe, Z. (2016). CoCoRaHS: the evolution and accomplishments of a volunteer rain gauge network. Bull. Amer. Meteor. 9, 10. doi:10.1175/BAMS-D-14-00213.1
Republic of Kenya (2019). “Kenya population and housing census,” in Distribution of Population by Socio-Economic Characteristics. Nairobi, Kenya: Kenya National Bureau of Statistics, 4.
Richards, N., and Syallow, D. (2018). Water resources users Associations in the mara basin, Kenya: pitfalls and opportunities for community based natural resources management. Front. Environ. Sci. 6, 138. doi:10.3389/fenvs.2018.00138
Rowntree, O., Bahia, K., Croxson, H., Delaporte, A., Meyer, M., Shanahan, M., et al. (2019). GSMA connected women—the mobile gender gap report 2019, London, UK: GSMA.
Ruhi, A., Messager, M. L., and Olden, J. D. (2018). Tracking the pulse of the Earth’s fresh waters. Nat. Sustain. 1 (4), 198–203. doi:10.1038/s41893-018-0047-7
Rutten, M. M., Minkman, E., and van der Sanden, M. (2017). How to get and keep citizens involved in mobile crowd sensing for water management? A review of key success factors and motivational aspects. Wiley Interdiscip. Rev.: Water 4(4):e1218. doi:10.1002/wat2.1218
Seibert, J., Strobl, B., Etter, S., Hummer, P., and van Meerveld, H. J. I. (2019). Virtual staff gauges for crowd-based stream level observations. Front. Earth Sci. 7, 18. doi:10.3389/feart.2019.00070
Shirk, J. L., Ballard, H. L., Wilderman, C. C., Phillips, T. B., Wiggins, A., Jordan, R., et al. (2012). Public participation in scientific research: a framework for deliberate design. Ecol. Soc. 17 (2), 29. doi:10.5751/ES-04705-170229
Toivanen, T., Koponen, S., Kotovirta, V., Molinier, M., and Chengyuan, P. (2013). Water quality analysis using an inexpensive device and a mobile phone. Environ. Syst. Res. 2 (1), 9. doi:10.1186/2193-2697-2-9
United Nations (2018). SDG 6 synthesis report 2018 on water and sanitation, New York, NY: United Nations.
Vörösmarty, C., Askew, A., Grabs, W., Barry, R. G., Birkett, C., Doll, P., et al. (2001). Global water data: a newly endangered species. Eos Trans. AGU. 82 (5), 54. doi:10.1029/01EO00031
Vries, M. de., Land-Zandstra, A., and Smeets, I. (2019). Citizen scientists’ preferences for communication of scientific output: a literature review. Citiz. Sci. Theory Pract. 4 (1), 2. doi:10.5334/cstp.136
Weeser, B., Stenfert Kroese, J., Jacobs, S. R., Njue, N., Kemboi, Z., Ran, A., et al. (2018). Citizen science pioneers in Kenya - a crowdsourced approach for hydrological monitoring. Sci. Total Environ. 631-632, 1590–1599. doi:10.1016/j.scitotenv.2018.03.130
Weeser, B., Jacobs, S. R., Kraft, P., Rufino, M. C., and Breuer, L. (2019). Rainfall‐Runoff modeling using crowdsourced water level data. Water Resour. Res. 55 (12), 10856–10871. doi:10.1029/2019WR025248
Weisberg, H., Krosnick, J. A., and Bowen, B. D. (1996). An introduction to survey research, polling, and data analysis. Thousand Oaks, CA: SAGE Publications, Inc.
Keywords: citizen science, community-based monitoring, crowdsourcing, telephone survey, water level, Africa, motivation
Citation: Weeser B, Gräf J, Njue NK, Cerutti P, Rufino MC, Breuer L and Jacobs SR (2021) Crowdsourced Water Level Monitoring in Kenya’s Sondu-Miriu Basin—Who Is “The Crowd”?. Front. Earth Sci. 8:602422. doi: 10.3389/feart.2020.602422
Received: 03 September 2020; Accepted: 14 December 2020;
Published: 21 January 2021.
Edited by:
Nils Moosdorf, Leibniz Centre for Tropical Marine Research (LG), GermanyCopyright © 2021 Weeser, Gräf , Njue, Cerutti, Rufino, Breuer and Jacobs. This is an open-access article distributed under the terms of the Creative Commons Attribution License (CC BY). The use, distribution or reproduction in other forums is permitted, provided the original author(s) and the copyright owner(s) are credited and that the original publication in this journal is cited, in accordance with accepted academic practice. No use, distribution or reproduction is permitted which does not comply with these terms.
*Correspondence: Suzanne R. Jacobs, suzanne.r.jacobs@zeu.uni-giessen.de