The Ins and Outs of Water in Olivine-Hosted Melt Inclusions: Hygrometer vs. Speedometer
 Anna Barth
 Terry Plank
- Lamont Doherty Earth Observatory (LDEO), Palisades, NY, United States
The amount of water dissolved in magmas at depth beneath volcanoes is fundamental to a wide range of magmatic and eruptive processes due to water’s dominant control on magma generation, viscosity, and buoyancy. Since magmas degas most of their initial water content upon ascent and eruption, the primary record of magmatic water evolution exists within melt inclusions trapped inside crystals, especially olivine. However, the discovery of rapid H+ diffusion through olivine has called into question the fidelity of the melt inclusion water record. How compromised is the vast existing and growing dataset of melt inclusion water contents? What are the circumstances favorable for recording primary or pre-eruptive water concentration? Even if inclusions are compromised, diffusive water loss can be exploited to constrain magma decompression rates, a critical parameter that affects conduit processes. Here, we outline the current understanding of factors controlling water loss: the olivine/melt partition coefficient, the diffusive transport of water through olivine, the distance between inclusion and crystal rim, the melt inclusion size, and the exterior magma’s water evolution. We combine these parameters into a regime diagram that can be used to guide when melt inclusions may be used as hygrometers and when they are better suited to act as magma speedometers. We develop diagnostic tools to recognize where and when water loss has occurred in a magma’s ascent history, and we outline quantitative tools that may be used to restore the primary and/or pre-eruptive water content. The intent of this paper is to guide researchers in the interpretation of existing melt inclusion data, and to aid in the design of new studies that maximize the valuable information that melt inclusions may convey on the evolution of water in magmas prior to eruption.
Introduction
Like many problems in the earth sciences, the study of magmatic systems is concerned with processes occurring at depth, hidden from direct observation. Melt inclusions (MIs) are one of petrologists’ most powerful tools to see into these hidden processes. These pockets of melt are preserved within the pressure vessel of their host crystal, which shields them from modification during magma ascent. The exciting promise of melt inclusions is that they might tell us about the magma composition and formation processes at depth (Danyushevsky et al., 2002; Schiano, 2003; Portnyagin et al., 2007; Kent, 2008; Rose-Koga et al., 2021; Wallace et al., 2021).
One of the key parameters of a magma that researchers in a wide range of earth science fields would like to constrain is its water concentration: water plays a major role in the genesis of subduction zone magmas through its effect in lowering the solidus (Asimow and Langmuir, 2003; Grove et al., 2006; Hirschmann, 2006; Kelley et al., 2010). Water also affects the crystallization of different mineral phases, thereby controlling a magma’s chemical and physical evolution (Sisson and Grove, 1993a; Blundy and Cashman, 2001). Due to the strong pressure dependence of H2O solubility, as magma ascends to the surface H2O-rich bubbles form, which accelerate the magma and may ultimately cause explosive volcanic eruptions (Wilson and Head, 1981; Parfitt et al., 1995; Gonnermann and Manga, 2007).
To petrologists’ dismay, crystals are leaky pressure vessels and allow water to diffuse out of melt inclusions (as H+) on timescales relevant to volcanic eruptions. Some crystals are better at preventing this water loss than others (e.g., plagioclase – Johnson and Rossman, 2013), but this paper will focus on olivine, which has been widely used on account of its relative abundance and early onset of crystallization in most mafic systems, as well as its transparency and euhedral form in many eruption products (Wallace et al., 2021). Measurements of H+ diffusion through olivine have shown that MIs can fully reequilibrate with the host magma on the timescale of hours (Portnyagin et al., 2008; Gaetani et al., 2012; Lloyd et al., 2013). Water loss is therefore a very real possibility for many melt inclusions.
Water loss from melt inclusions is not inevitable, however, and depends on several factors, which will be outlined in this paper. If constraints can be placed on these factors, it is possible to ascertain whether water loss has occurred. This is not always possible, for example, when using data from past studies which don’t report critical parameters such as MI size. In this case, caution should be taken and it may not be possible to determine if the melt inclusions have remained faithful recorders of initial magmatic water.
However, the view in this paper is that going forward, if care is taken during sample preparation and analysis, melt inclusions have the potential to tell us an even richer magmatic history than previously thought. Not only is it possible under many circumstances to determine the initial water content of the magma, but in addition, we can learn about processes such as CO2-flushing, shallow stalling of magma prior to eruptions, and even the decompression rate of magma during explosive eruptions. This paper will outline how to read melt inclusion water concentrations, to recognize these different processes, and ultimately to unlock the clues to this richer magmatic history.
Parameters That Affect Water Loss/Gain From/To Melt Inclusions
As magma ascends and depressurizes on its way to the surface, the solubility of water in the melt decreases (Figure 1A). This causes the melt to exsolve bubbles, and the water dissolved in the melt to diffuse to these bubbles. Crystals within the magma strive to maintain equilibrium, and water (dissolved in the crystal lattice as H+) diffuses out of the crystals, into the host magma, and ultimately into vapor bubbles (Figures 1B,C). Melt inclusions are somewhat shielded from the degassing magma by their host crystals, but as we shall see, H+ diffusion through olivine is rapid. Whether or not a melt inclusion retains its original water content depends on several factors, but simply put, it is a race between the magma decompression rate and the H+ diffusion rate.
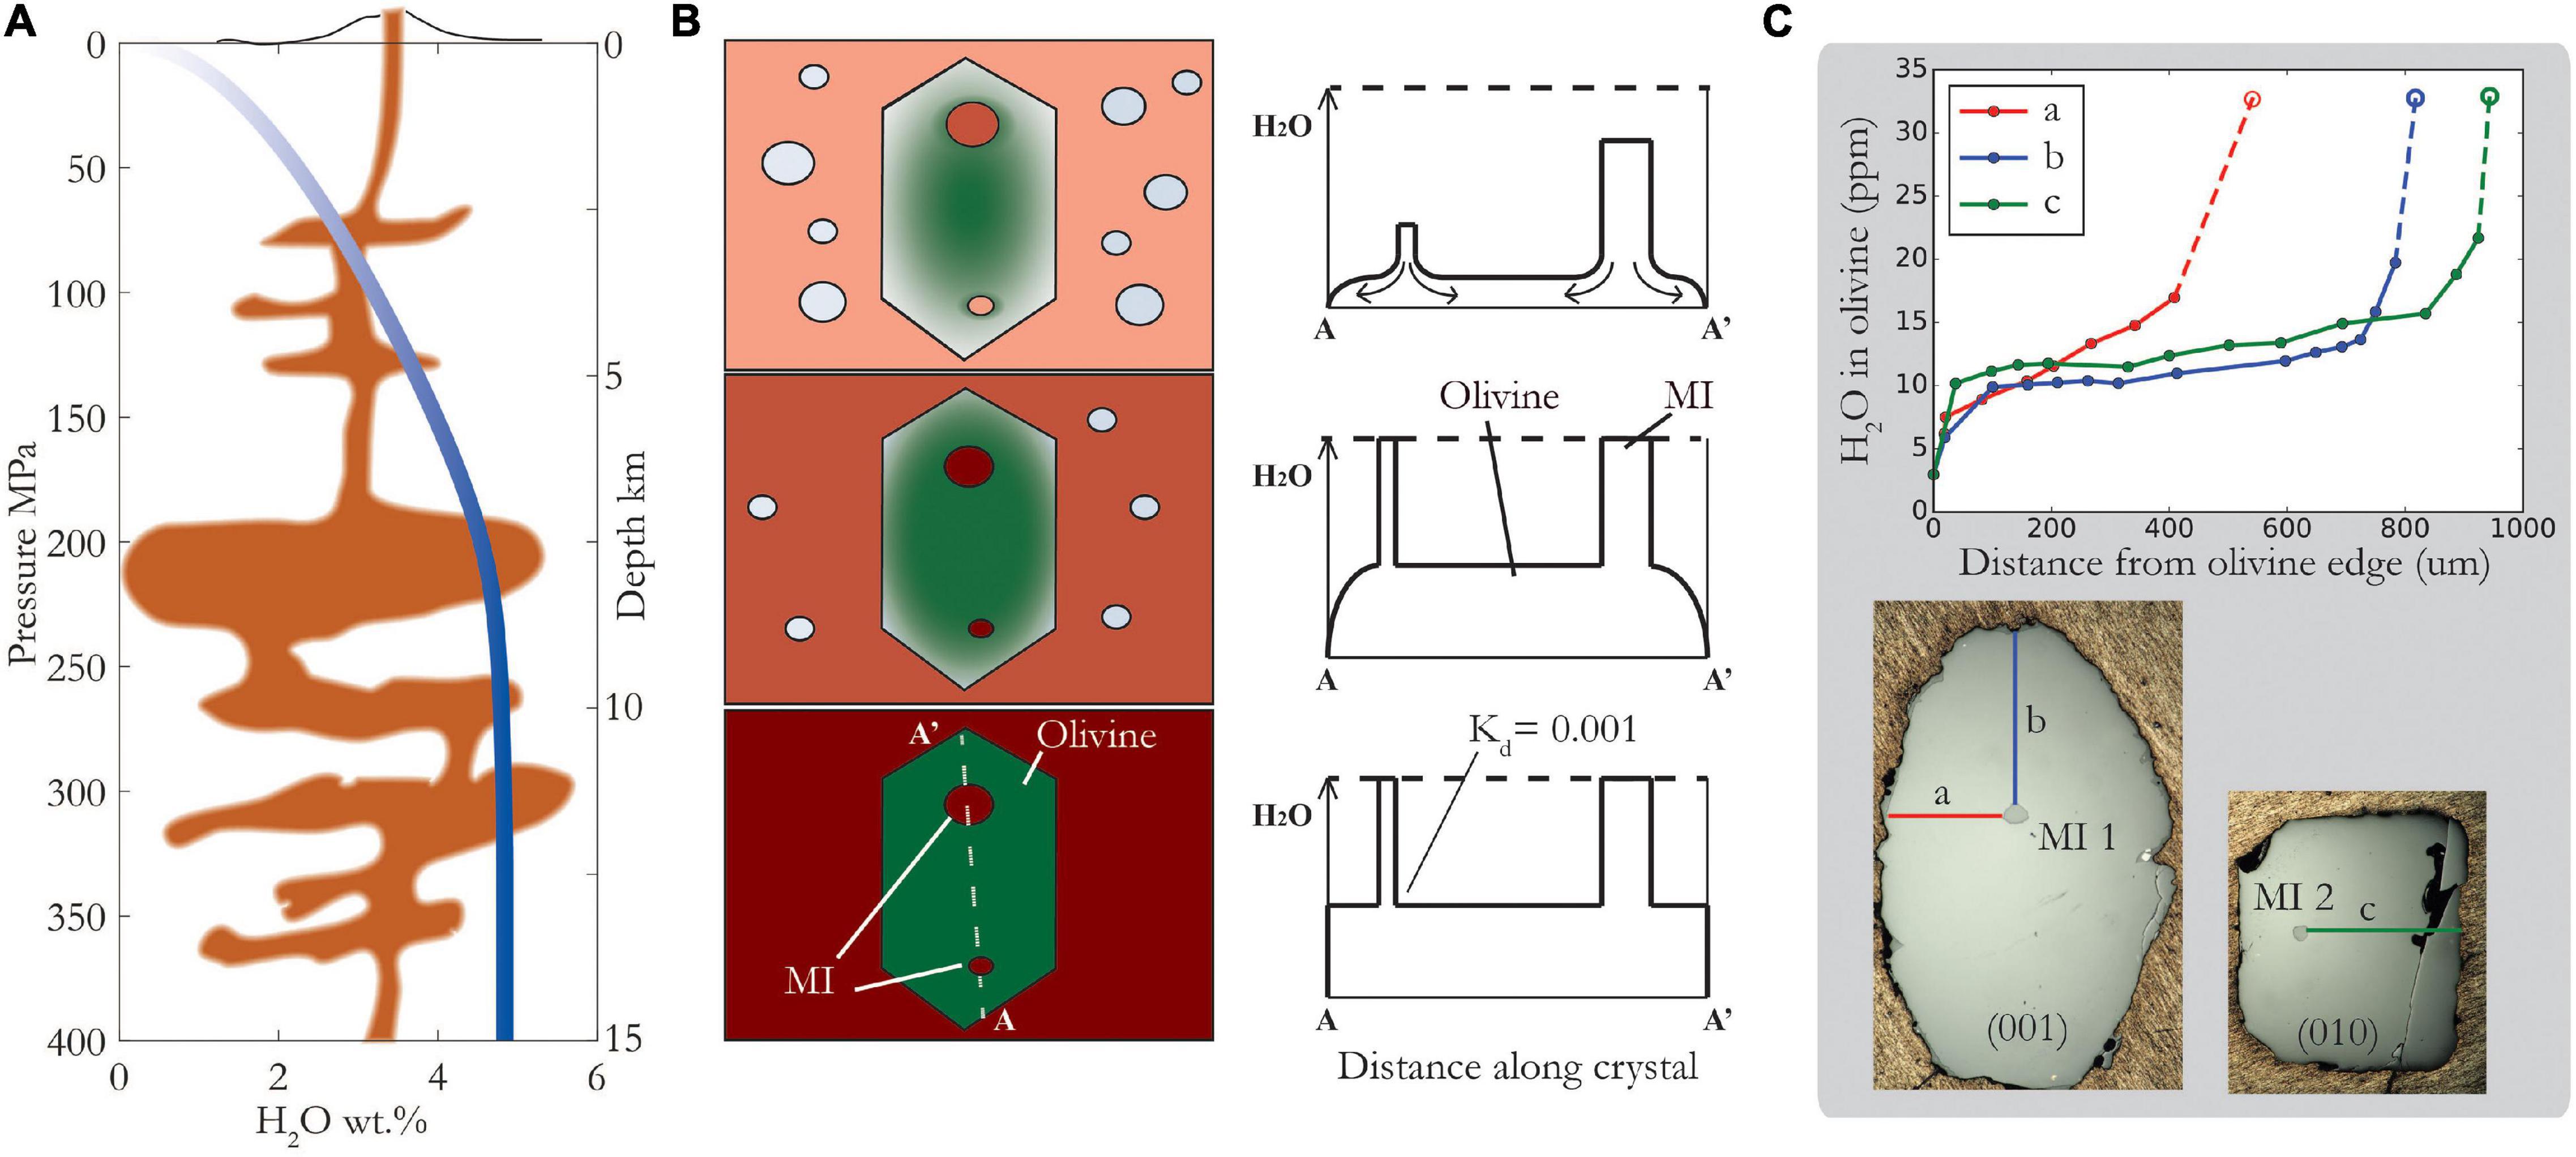
Figure 1. Schematic showing magma ascent, degassing and re-equilibration of melt inclusions (MIs). (A) Closed system degassing of H2O from Witham et al. (2012) SolEx model for Cerro Negro basaltic composition with 4.75 wt% initial H2O. Depth shown for illustrative purposes, assuming density of 2.7 g/cm3 (B) Schematic showing how diffusion profiles progress from the outside to the inside of the crystal during ascent, eventually reaching MIs and causing them to lose H2O. Smaller MIs will lose water faster than larger MIs. Partition coefficient, Kd, is ratio of H2O in olivine relative to melt. (C) Diffusion profiles measured by SIMS in olivine along each of its crystallographic directions – see reflected light photos below of same crystal, polished along different sections, containing two different MIs-1 and -2 with similar H2O concentrations, 3.26 and 3.29 wt%, respectively. Right photo shows only half the olivine crystal – the left edge is a fracture. Dashed lines and open symbols illustrate the calculated H+ concentration in equilibrium with measured MI concentration assuming a partition coefficient of 0.001. Note that a profile is different to b and c profiles, consistent with strong anisotropy of diffusivity: Da > 10x Db, Dc (see text for details).
Sometimes magma ascent is a straight shot to the surface (e.g., Ruprecht and Plank, 2013) but more often it is a complex series of ascent, stalling, and mixing events. Under these conditions, how do we define water loss? Is water loss with respect to the primary mantle-derived magma water concentration or to that at the last depth of equilibration? The answer depends on the question we’re trying to answer. If we’re interested in the processes of magma formation, or the fluxes of water on a global, arc or volcano scale, we care about how much water has been lost compared to the primary magma. In this case, it is important to look past any shallow stalling event which may have reset MIs to a new equilibrium water concentration. If, on the other hand, we’re interested in modeling magma decompression rate during eruptions, the relevant initial water concentration relates to wherever the magma last equilibrated, which may be at a shallow depth, and at lower water concentration than the primary or parental magma. Note that we focus our discussion on water loss, as magma ascent will inevitably drive melt inclusions to lose water. However, melt inclusions may also gain water during mixing, entrainment and/or storage (Kamenetsky et al., 1998; Portnyagin et al., 2008; Koleszar et al., 2009; Neave et al., 2017) and the underlying processes governing re-equilibration (whether water loss or gain) are broadly the same.
In what follows, we summarize the key parameters and considerations in the estimation of initial magmatic water concentrations and in modeling melt inclusion water loss for decompression rate information.
Partition Coefficient of H2O Between Olivine and Melt
We begin our discussion zooming into the melt inclusion-olivine interface – the first part of water’s journey from a melt inclusion into the host magma. In melt, water is dissolved as H2O and OH–, whereas in the olivine lattice, water exists as H+ bonded to structural oxygen in point defects. There are a few dominant defects in natural olivine. The titanium clinohumite defect, [Ti], involves a Si vacancy charge balanced by two H+ and a Ti4+ on a metal (octahedral) site (Berry et al., 2005). In the Mg defect, [Mg], a metal vacancy is charge balanced by two H+, while in the trivalent defect, [Triv], the metal vacancy is charge balanced by a single H+ and a trivalent cation on a neighboring metal site (Berry et al., 2007). These defects may be observed using Fourier Transform Infrared Spectroscopy (FTIR), in which the wavelength of absorbed IR radiation is indicative of the local arrangement of ions around an O-H bond. To move from the melt inclusion through the olivine and into the host magma requires reactions at the interfaces between olivine and melt. Different reactions have been put forward to describe the exchange of H+ between melt inclusion and olivine host (Danyushevsky et al., 2002; Gaetani et al., 2012; Portnyagin et al., 2019). Mackwell (2012) raises the question of whether H+ is being incorporated into preexisting defects within the olivine lattice, or whether water loss from melt inclusions is coupled with the crystallization of defect-rich olivine on the melt inclusion walls. Portnyagin et al. (2019) show evidence that melt inclusion water loss is correlated with a decreasing Si content in the melt inclusion which supports an important role for the latter.
The partition coefficient, Kd, is defined as the concentration of H2O in the olivine divided by the concentration in the melt and is an important parameter controlling water loss from melt inclusions. Indeed, Newcombe et al., 2020a concluded that it was responsible for most of the uncertainty in their modeled decompression rates. Constraints on the partition coefficient from the literature fall into two broad categories: measurements of natural melt inclusions and adjacent olivines (Le Voyer et al., 2014; Newcombe et al., 2020a), and measurements from olivine-melt equilibrium experiments (Koga et al., 2003; Aubaud et al., 2004; Hauri et al., 2006; Portnyagin et al., 2008; Tenner et al., 2009; Adam et al., 2016). The former yields lower values of Kd, which may be partly related to the fact that it represents a system in disequilibrium, i.e., there is a gradient of H2O concentration in the olivine leading away from the melt inclusion. Since the measurement in the olivine is taken at a finite distance from the melt inclusion interface, the H2O concentration in the olivine at the MI interface is underestimated. Another factor to consider in comparing the two types of constraints is that, with the exception of Portnyagin et al. (2008), the experiments are conducted at higher pressure than volcanic systems (Figure 2), and in theory, the partition coefficient should increase with pressure (Asimow et al., 2004; Hirschmann et al., 2009). While there is much scatter within and between different studies, this trend does appear to hold broadly (Figure 2). Two exceptions are the experiments at 200 MPa on olivine-hosted MIs (Portnyagin et al., 2008) and the experiments on Fe-free forsterite (Grant et al., 2007). While it is unclear what causes the disparity in the results from Portnyagin et al. (2008), it is likely that the use of pure, Ti- and Fe-free forsterite in the experiments of Grant et al. (2007) lowers the availability of defect sites for H+ incorporation in olivine, thereby decreasing the partition coefficient. This demonstrates that the partition coefficient is a function of the defect structure of the olivine, as well as temperature and pressure, and so likely varies to some extent between different samples. It is important to note that, with the exception of Newcombe et al. (2020a), these studies are all based on olivine calibrations from Bell et al. (2003), which are affected by the presence of micro fluid inclusions within two out of the three olivines used in the Bell et al. (2003) study (Mosenfelder et al., 2011). Furthermore, a different H2O-in-olivine calibration from Withers et al. (2012) gives significantly lower olivine H2O concentrations, and using this calibration rather than that from Bell et al. (2003) would lower the estimates of partition coefficient by 37%. Within these uncertainties, the upper bound of the natural ol-melt pair measurements from Newcombe et al. (2020a) (0.001 – Figure 2) is a reasonable estimate of the partition coefficient for volcanic systems, but note that this a relatively uncertain parameter and further low pressure experiments, and a reanalysis of existing data, would by highly useful.
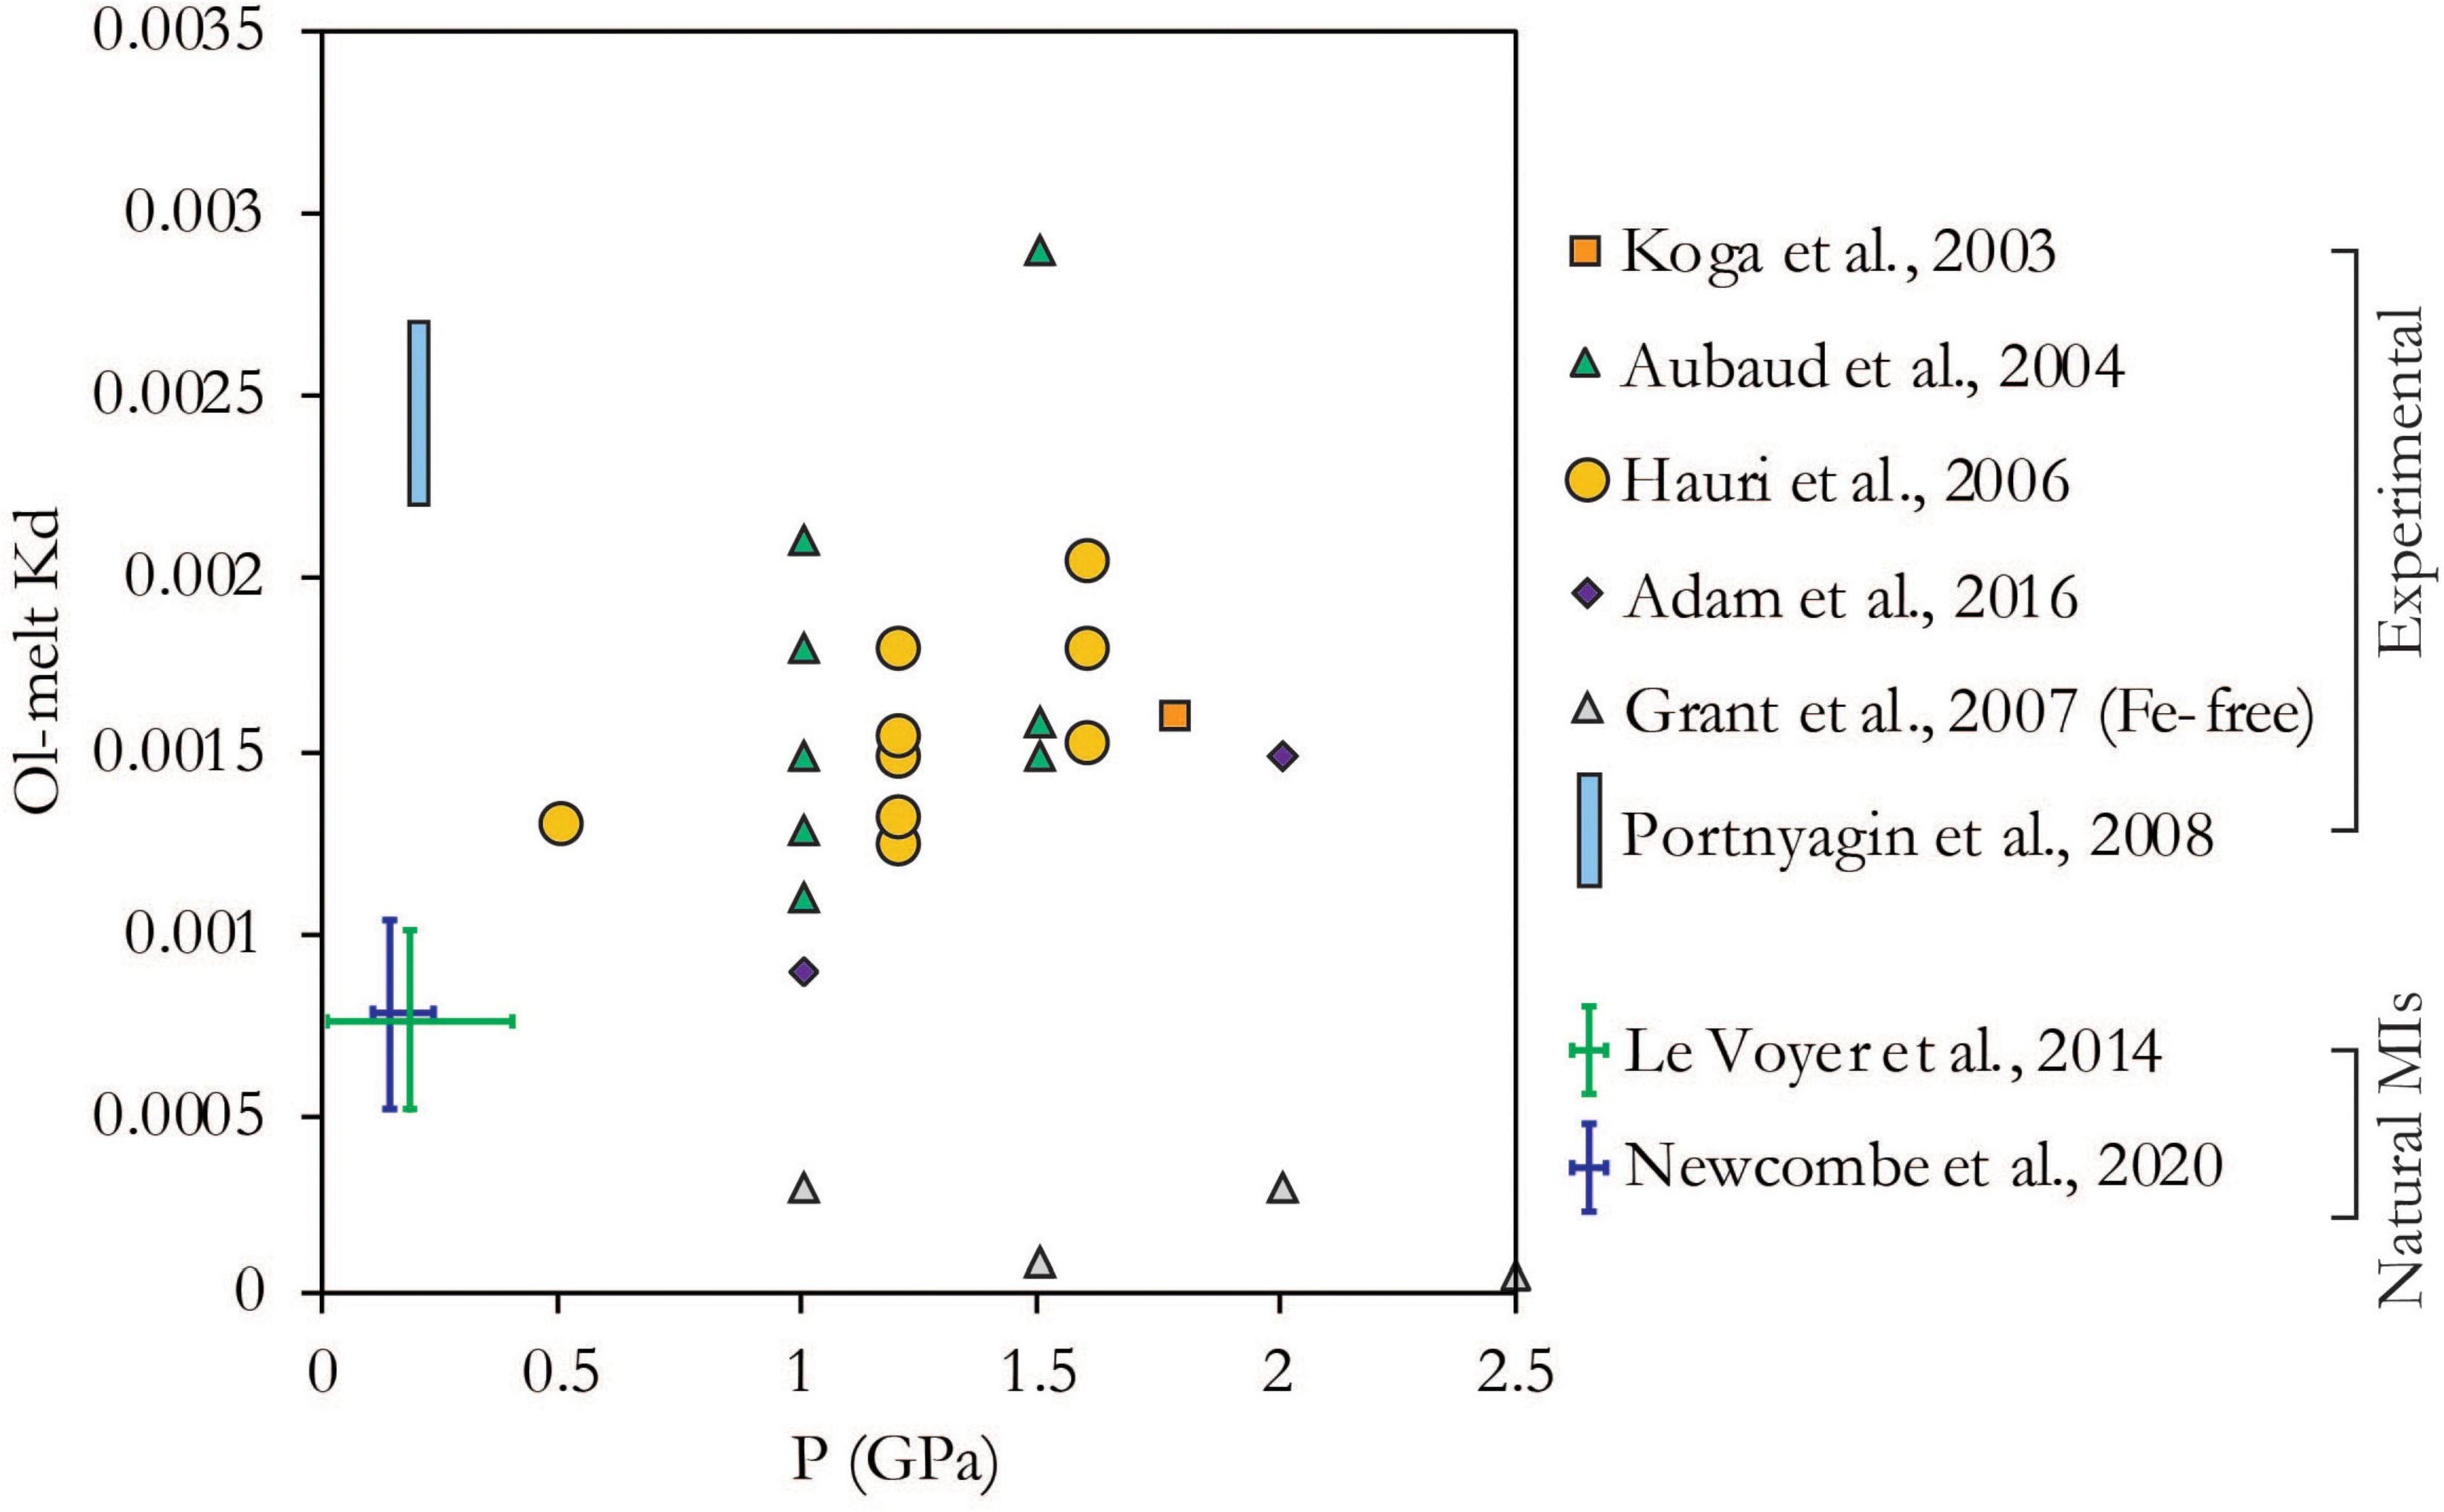
Figure 2. H olivine/melt partition coefficient (Kd) from experimental studies <3 GPa and measurements on natural MI-olivine pairs. Error bars for pressure of natural MIs shows full range of reported MI entrapment depths (Le Voyer et al., 2014: Sommata cinder cone, Vulcano = 0.1–0.2 GPa, Jorullo cinder cone = 0.01–0.4 GPa; Newcombe et al., 2020a 1959 Kilauea Iki = 0.11 GPa, Fuego = 0.25 GPa, Seguam = 0.15 MPa). Error bars for Kd of natural MIs shows ±1 sigma of measured values. Note that all studies apart from Newcombe et al., 2020a use a calibration for H2O in olivine from Bell et al. (2003); using the calibration from Withers et al. (2012) would decrease the partition coefficient by 37%.
Diffusivity of H2O in Olivine
The diffusivity of H+ in olivine (hereafter referred to as D) is a measure of how quickly H+ can migrate through the olivine lattice in response to a chemical gradient, and has a first order effect on the rate of melt inclusion water loss. The mechanism of H+ diffusion in olivine has implications for the rate of diffusion, since a range of different mechanisms have been observed and each mechanism operates at a different speed. Experiments have produced a six order of magnitude range of measurements (Figure 3), from 10–9.7 m2/s during hydration of San Carlos olivine at 1,000°C (Mackwell and Kohlstedt, 1990) to 10–15.7 m2/s for dehydration via Si vacancies in synthetic forsterite at the same temperature (Padrón-Navarta et al., 2014).
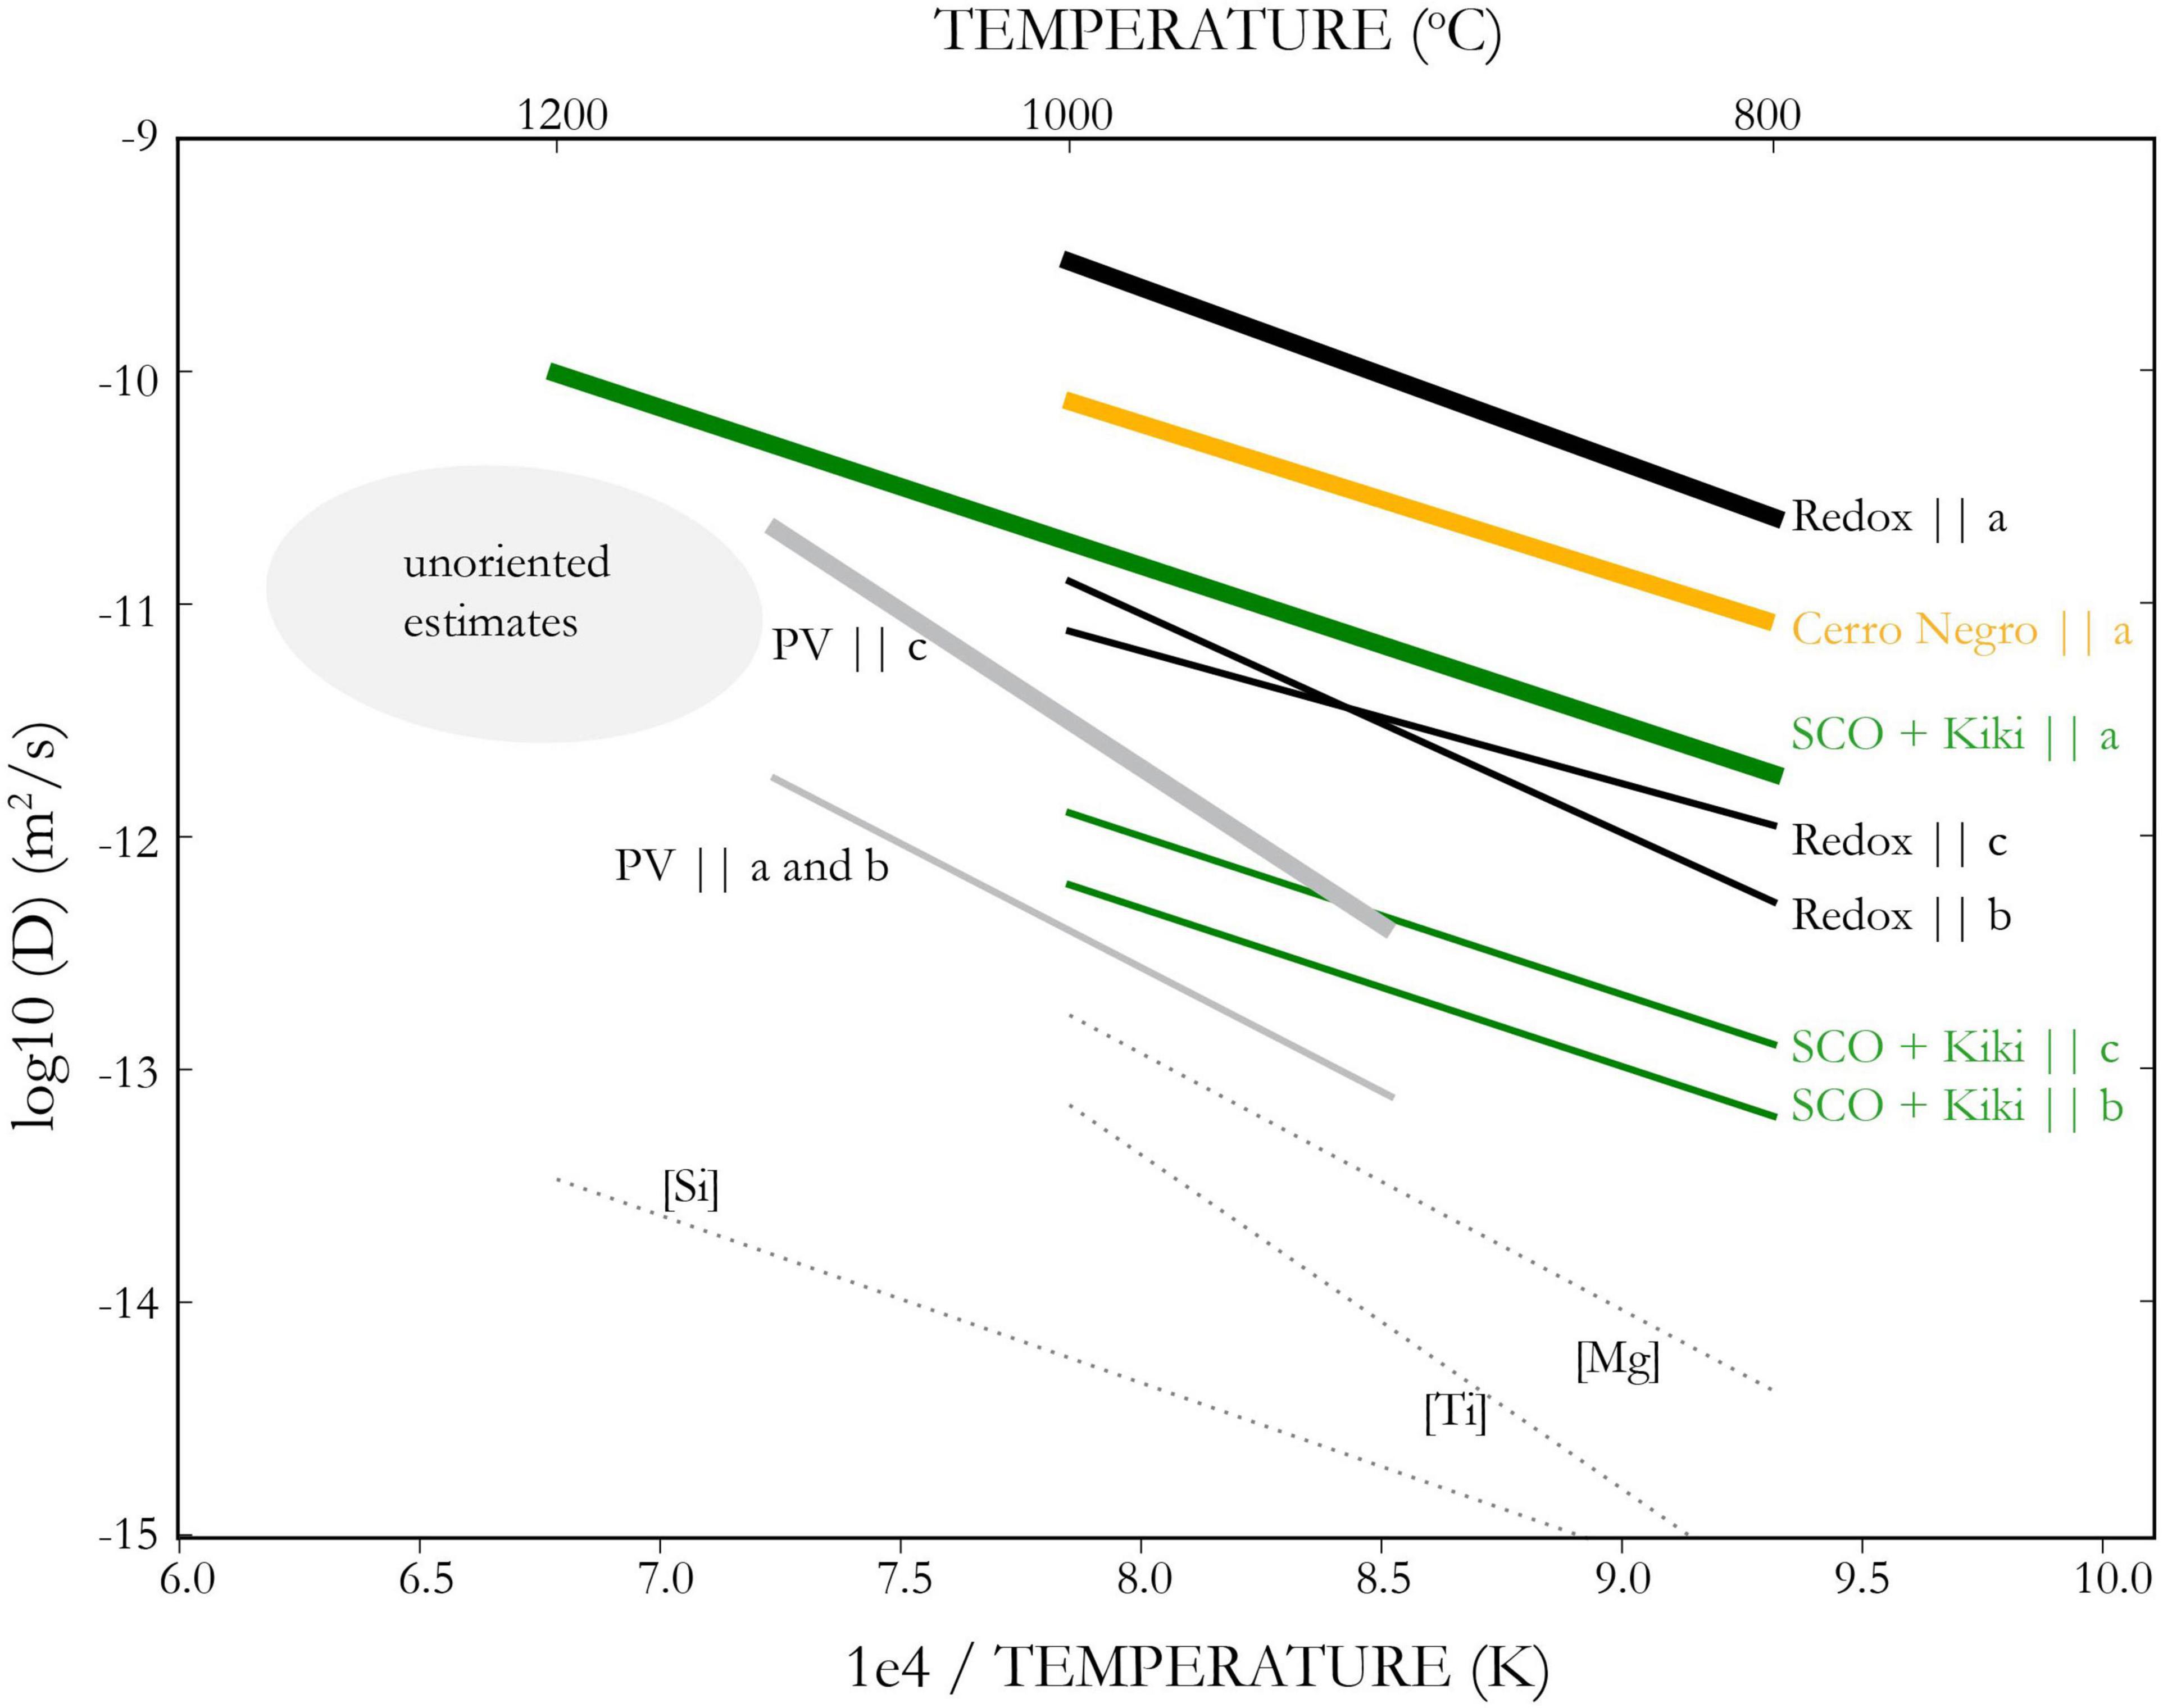
Figure 3. Arrhenius relations for H+ diffusion in olivine. Bold lines show rate for fastest crystallographic direction. Black lines proton-polaron (redox) rate, gray lines show proton-vacancy rate during hydration of San Carlos olivine (Kohlstedt and Mackwell, 1998). Peak-specific measurements from dehydration of synthetic forsterite in dotted lines, Padrón-Navarta et al. (2014). Green lines show measurements on San Carlos and Kilauea Iki olivine (Ferriss et al., 2018), yellow lines show rate for low forsterite (∼Fo80) from Cerro Negro (Barth et al., 2019). Estimates for bulk H+ diffusivity in unoriented MI-bearing olivines shown by gray ellipse (Portnyagin et al., 2008; Chen et al., 2011; Gaetani et al., 2012; Mironov et al., 2015). This figure illustrates both the strong anisotropy of H+ diffusion in olivine and the strong compositional dependence. For the quantitative consideration of MI dehydration in natural, oriented olivines, the relevant Arrhenius relations are for SCO+Kiki (for Fo85-90 olivine) and Cerro Negro (for Fo75-85 olivine) parallel to a.
Experiments on natural San Carlos olivine (Kohlstedt and Mackwell, 1998; Demouchy and Mackwell, 2006) have revealed two primary diffusion mechanisms. The faster mechanism involves a flux of H+ charge-balanced by a flux of electrons from Fe2+ to Fe3+. The electron holes associated with Fe3+are called polarons, and so this diffusion mechanism is often referred to as the proton-polaron mechanism. The second, slower mechanism involves the diffusion of metal vacancies along with their associated H+ and is called the proton-vacancy mechanism. Just like Mg-Fe diffusion, this mechanism is fast along the c direction, [001], whereas proton-polaron is fast along a, [100].
The slowest H+ diffusivities in the literature come from experiments on synthetic forsterite (Padrón-Navarta et al., 2014). These experiments show that each defect hosting H+ diffuses at a different rate, with D[Mg] > D[Ti] > D[Si] (Figure 3). Experiments on Fe-bearing olivine, however, have shown that these defects all have similar apparent diffusivity, which is much faster than measured in synthetic forsterite (Ferriss et al., 2018). Without Fe, synthetic forsterite has no ions available to host redox changes and accommodate the proton-polaron mechanism, and so H+ diffusion must occur by diffusion of the defects themselves. In Fe-bearing olivine, the proton-polaron mechanism becomes activated.
This has led to a new way of thinking about H+ diffusion that involves the fast proton-polaron diffusion mechanism plus a reaction step to move the H+ into the different defect sites (Ferriss et al., 2018; Jollands et al., 2019). The availability of the different defect sites will limit the reaction rate, which can change over time, leading to speed-up or slow-down in apparent diffusivity as observed experimentally (Ferriss et al., 2018). If the reaction is the rate-limiting step, it can cause apparent diffusivities to be slower than proton-polaron rate, while maintaining anisotropic fast diffusion along a (Ferriss et al., 2018; Barth et al., 2019).
Dehydration experiments on lower forsterite olivines (Fo ∼80; Barth et al., 2019) found faster diffusivities than the higher forsterite San Carlos and Kilauea olivines in Ferriss et al. (2018), which suggests that higher Fe contents lead to faster apparent diffusivities. It seems likely therefore, that the relevant diffusivity for natural olivine phenocrysts lies somewhere between the proton-polaron rate and the rate measured for high forsterite olivines in Ferriss et al. (2018). For Fo ∼ 75–85, the diffusivity from Barth et al. (2019) may be most appropriate; for Fo ∼ 85–95 the diffusivity from Ferriss et al. (2018) may be more accurate (see Table 1). Future work should help to constrain the relationship between crystal chemistry (including trace elements such as Ti) and H+ diffusivity.
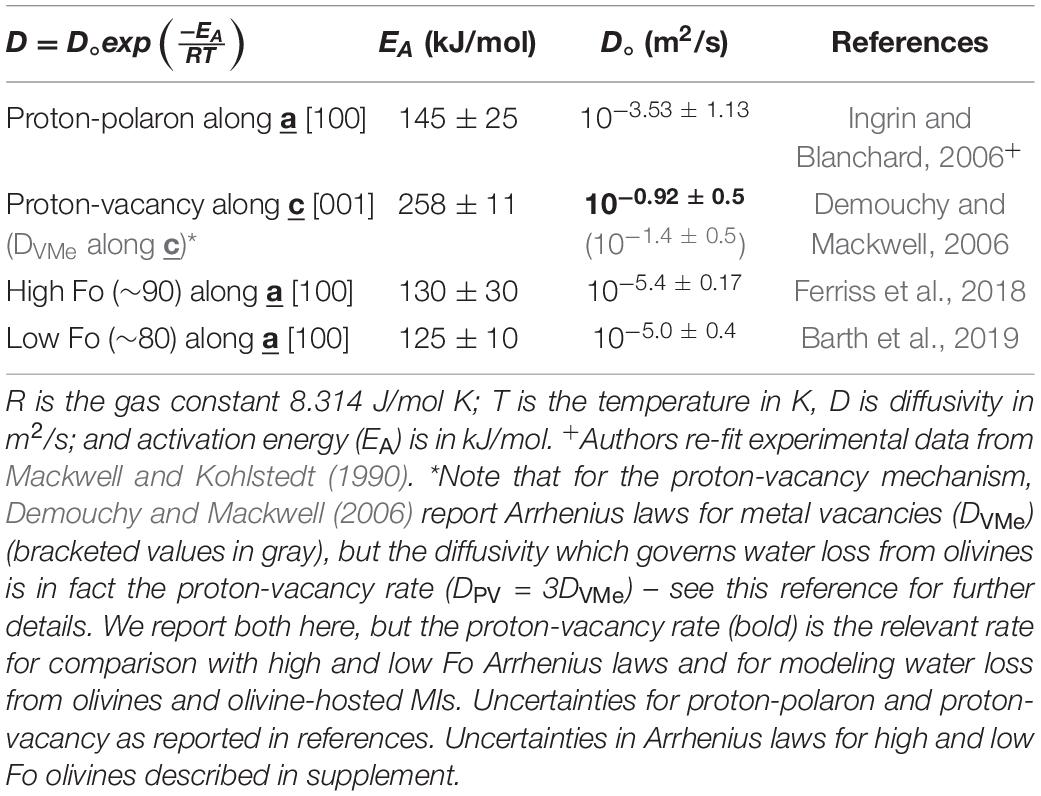
Table 1. Arrhenius relationships along the fast diffusion direction for different diffusion mechanisms and olivine forsterite (Fo) content.
As implied by the Arrhenius relationships (Table 1), diffusivity depends strongly on temperature. There are several thermometers that constrain the entrapment temperature of a melt inclusion which use the temperature-dependence of Mg partitioning between olivine and melt (Roeder and Emslie, 1970; Ford et al., 1983; Beattie, 1993; Sugawara, 2000; Chen and Zhang, 2008; Putirka, 2008). One complication of estimating magma temperature in this way is that it depends strongly on the water concentration of the magma. The effect is nonlinear and decreases with increasing water concentration: for approximately every wt% of water in the magma, the temperature estimate decreases by 15°C for high H2O concentrations (>4 wt%) or as much as 40°C for low H2O concentrations (∼1–2 wt%) (Médard and Grove, 2008). Therefore, the initial, pre-dehydrated melt inclusion water concentration must be restored before diffusivity can be accurately calculated. Alternatively, some thermometers (e.g., Al-in-olivine – Wan et al., 2008) are thought to be independent of H2O (Coogan et al., 2014).
Another factor to consider is the evolution of magma temperature during ascent. For eruptions that are triggered by fresh input of volatiles and/or magma, there are likely to be significant temperature changes associated with this mixing event (e.g., Ruprecht and Bachmann, 2010). Even without a pre-eruption mixing event, temperature may vary due to bubble expansion and crystallization during ascent. Some studies focusing on silicic eruption have found evidence for magma warming during ascent in the conduit, driven by the heat of crystallization (Blundy et al., 2006; Portnyagin et al., 2014; Humphreys et al., 2016), while others have reported limited temperature change during crystallization (Plechova et al., 2011). A novel technique presented in Newcombe et al. (2014) uses profiles of Mg zonation within melt inclusions to measure temperature evolution for mafic magmas. When applied to natural melt inclusions, this thermometer shows that magmas at Fuego and Seguam undergo relatively little change in temperature during ascent (less than 10°C; Newcombe et al., 2020b). This is attributed to a balance of cooling from adiabatic expansion of volatiles and heating from degassing-driven crystallization. Therefore, unless there is good evidence for temperature change during ascent, an isothermal model is appropriate for most hydrous arc magmas.
Distance to Crystal Rim
When the H2O concentration of the host magma is lower than in the melt inclusion, a diffusion front progresses from the outside of the olivine into the interior over time (Figure 1B). The length of the resulting diffusion profile increases over time according to the relation . Therefore, the distance between the melt inclusion and the olivine-host magma boundary has a fundamental impact on the amount of water loss from the melt inclusion; the diffusion front will reach melt inclusions close to the olivine edge first and so these melt inclusions will lose water faster than those in the olivine interior.
As discussed above, H+ diffusion in olivine is highly anisotropic, with Da > 10 x Db, Dc. Under these conditions, modeling work (Barth et al., 2019) has shown that a 1D diffusion model oriented along the fast diffusion direction (a) is more appropriate approximation than an isotropic, spherical diffusion model (Thoraval and Demouchy, 2014; Newcombe et al., 2020a). Therefore, it is in fact the distance between the melt inclusion and olivine edge along a, [100], that is most important for melt inclusion water loss.
Melt Inclusion Size
It has been known for more than two decades that melt inclusion size strongly affects the time for re-equilibration (Qin et al., 1992; Cottrell et al., 2002; Chen et al., 2013). The reason for this is two-fold: the larger the melt inclusion, the greater the total amount of H2O to be exchanged and the lower the surface area to volume ratio, providing a smaller interface for H2O in the melt to be incorporated into the olivine. These two factors combine to mean that H2O concentration drops more slowly in larger melt inclusions than in smaller ones. As will be discussed later, if there is a relationship between MI size and water loss, this trend can be modeled to determine magma decompression rate (Chen et al., 2013; Lloyd et al., 2013; Barth et al., 2019). Measuring melt inclusion size is therefore important for determining if diffusive water loss has occurred, and all studies that report MI water concentration should also report MI size.
Estimates of MI size in the literature are typically based on the assumption of a 3D ellipsoid shape. The calculation relies on visual constraints for the length, y, and width, x, and an assumption about the MI depth, z. This assumption is often that z = y or that z = ½(x+y). Recently, Mironov et al. (2020) examined the accuracy of these assumptions by measuring the third dimension with two different optical methods. In the first, they used a microscope micrometer and calculated the distance between focusing on the top and bottom of the MI. For the second, they rotated and remounted the sample 90° and polished down this orthogonal direction to measure the MI depth. These two 3D methods yield relatively similar results (±∼10%), while there were differences up to ∼45% between 3D and 2D methods. On average, the assumption that z = y (i.e., the shorter of the two other dimensions) agreed more closely with the 3D estimates than the assumption that z = ½(x+y).
Exterior H2O Evolution
In melt inclusion diffusion models, the boundary condition, that is, the H2O concentration at the boundary between the olivine and the host magma (the olivine rim), has a strong modulating effect on the reequilibration of H2O in melt inclusions. The first model of H2O reequilibration between a melt inclusion and host magma used a fixed boundary condition (Qin et al., 1992). This pivotal work gave first-order insights into the controls on water loss from melt inclusions, namely melt inclusion size, distance to the olivine rim, partition coefficient and diffusivity. If a magma stalls shallowly at a single pressure, a fixed boundary condition may be appropriate. However, for the more general case of magma decompression during ascent, water will decrease with time along the outer boundary of the olivine, which has been incorporated into more recent numerical models (Chen et al., 2013; Lloyd et al., 2013; Barth et al., 2019).
In constructing a boundary condition, we can use thermodynamic models to predict the relationship between pressure and H2O concentration. The assumption of melt-vapor equilibrium is likely valid for the case of H2O, while it may not be for more slowly diffusing CO2 and S (Gonnermann and Manga, 2005; Pichavant et al., 2013). There are different equilibrium degassing paths that the magma can take, depending on whether the exsolved gas phase remains coupled to the magma (closed system) or buoyantly rises faster than the surrounding melt (open system). In closed system degassing, the presence of an excess exsolved gas phase causes H2O to leave the melt earlier than it would if no gas phase were present (Figure 4).
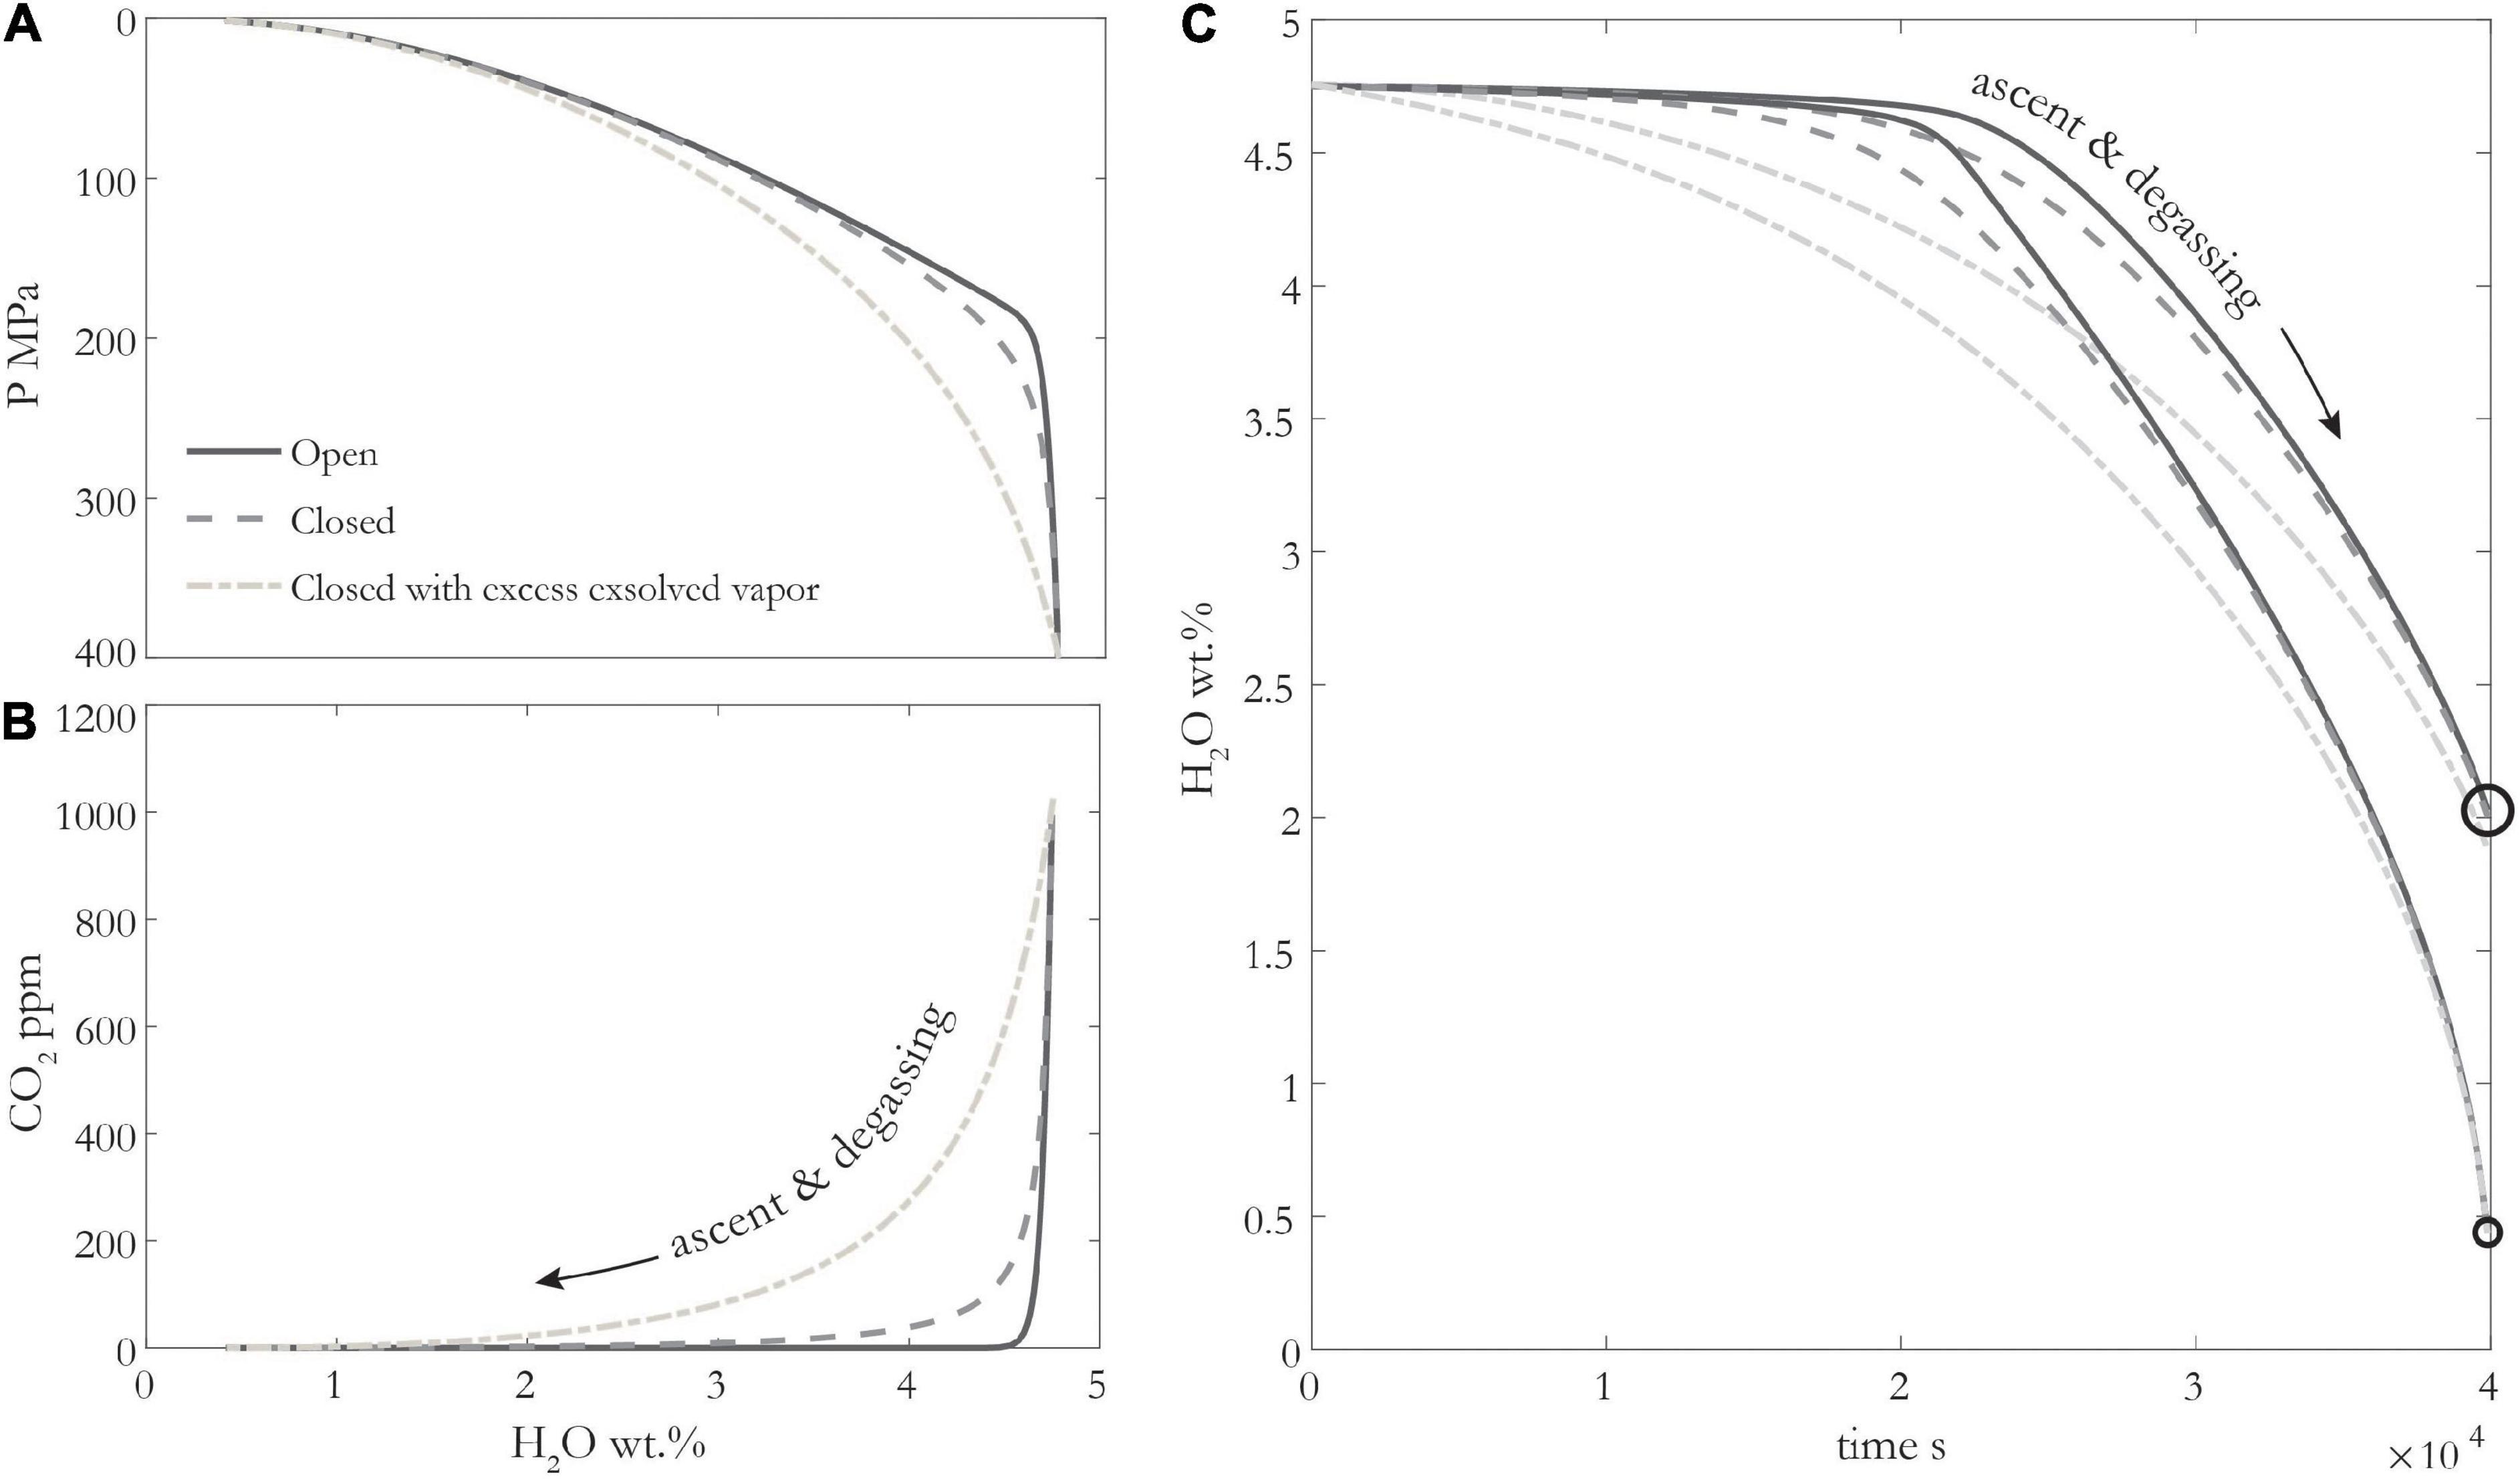
Figure 4. (A,B) Different decompression degassing models for basaltic magma using SolEx (Witham et al., 2012), with 4.75 wt% H2O, 1000 ppm CO2 initially, at 1100°C and NNO + 1.8. Pale dashed line shows degassing with 6 vol% exsolved fluid at start of simulation. (C) H2O-loss from melt inclusions (MIs) over time for different decompression degassing paths in panel (A) and two different MI radii: 1 μm (small circle) and 10 μm (large circle). Decompression rate is 0.01 MPa/s, b/a is 10, D is 1.7e-10 m2/s, Kd is 0.001.
Several melt inclusions studies have tried to decipher which type of degassing is occurring, but this is a difficult task given the typical scatter in MI volatile data which can arise in part due to CO2 sequestration in MI shrinkage bubbles and diffusive H2O loss. Combining measurements of gas geochemistry with melt inclusion data can help. To a first order, if the volcano is emitting gas without erupting magma, it must be an open system. Beyond this, ratios of different gas species, H2O/SO2, CO2/SO2, can be diagnostic of the degassing path (Werner et al., 2020). In theory, different degassing paths could be incorporated into different boundary conditions, however, in practice, we find that MI H2O-loss is relatively insensitive to open vs. closed system degassing (Figure 4 and Supplementary Figure 4).
Discussion
Regime Diagram – Hygrometer vs Speedometer
The extent to which melt inclusions lose their water due to diffusion through the host crystal during ascent is controlled by the rate of H+ diffusion out of melt inclusions, which depends on the parameters discussed above, versus the rate of magma decompression. Qin et al. (1992) presented an analytical solution to the relationship between these parameters and the extent of reequilibration. However, this is not possible for the case of a changing boundary condition, for example, the decrease in H2O in the exterior melt as a function of pressure (Chen et al., 2013; Barth et al., 2019). Therefore, we have developed a parameterization of results from the 1D numerical diffusion model presented in Barth et al. (2019) using a generalized logistic function (Supplement). The percentage water loss can be related to the MI radius, a (m); distance between MI and olivine rim along a, b (m); partition coefficient, Kd; diffusivity of H+ through olivine, D (m2/s); and decompression rate, dP/dt (MPa/s), through the curve in Figure 5, defined by:
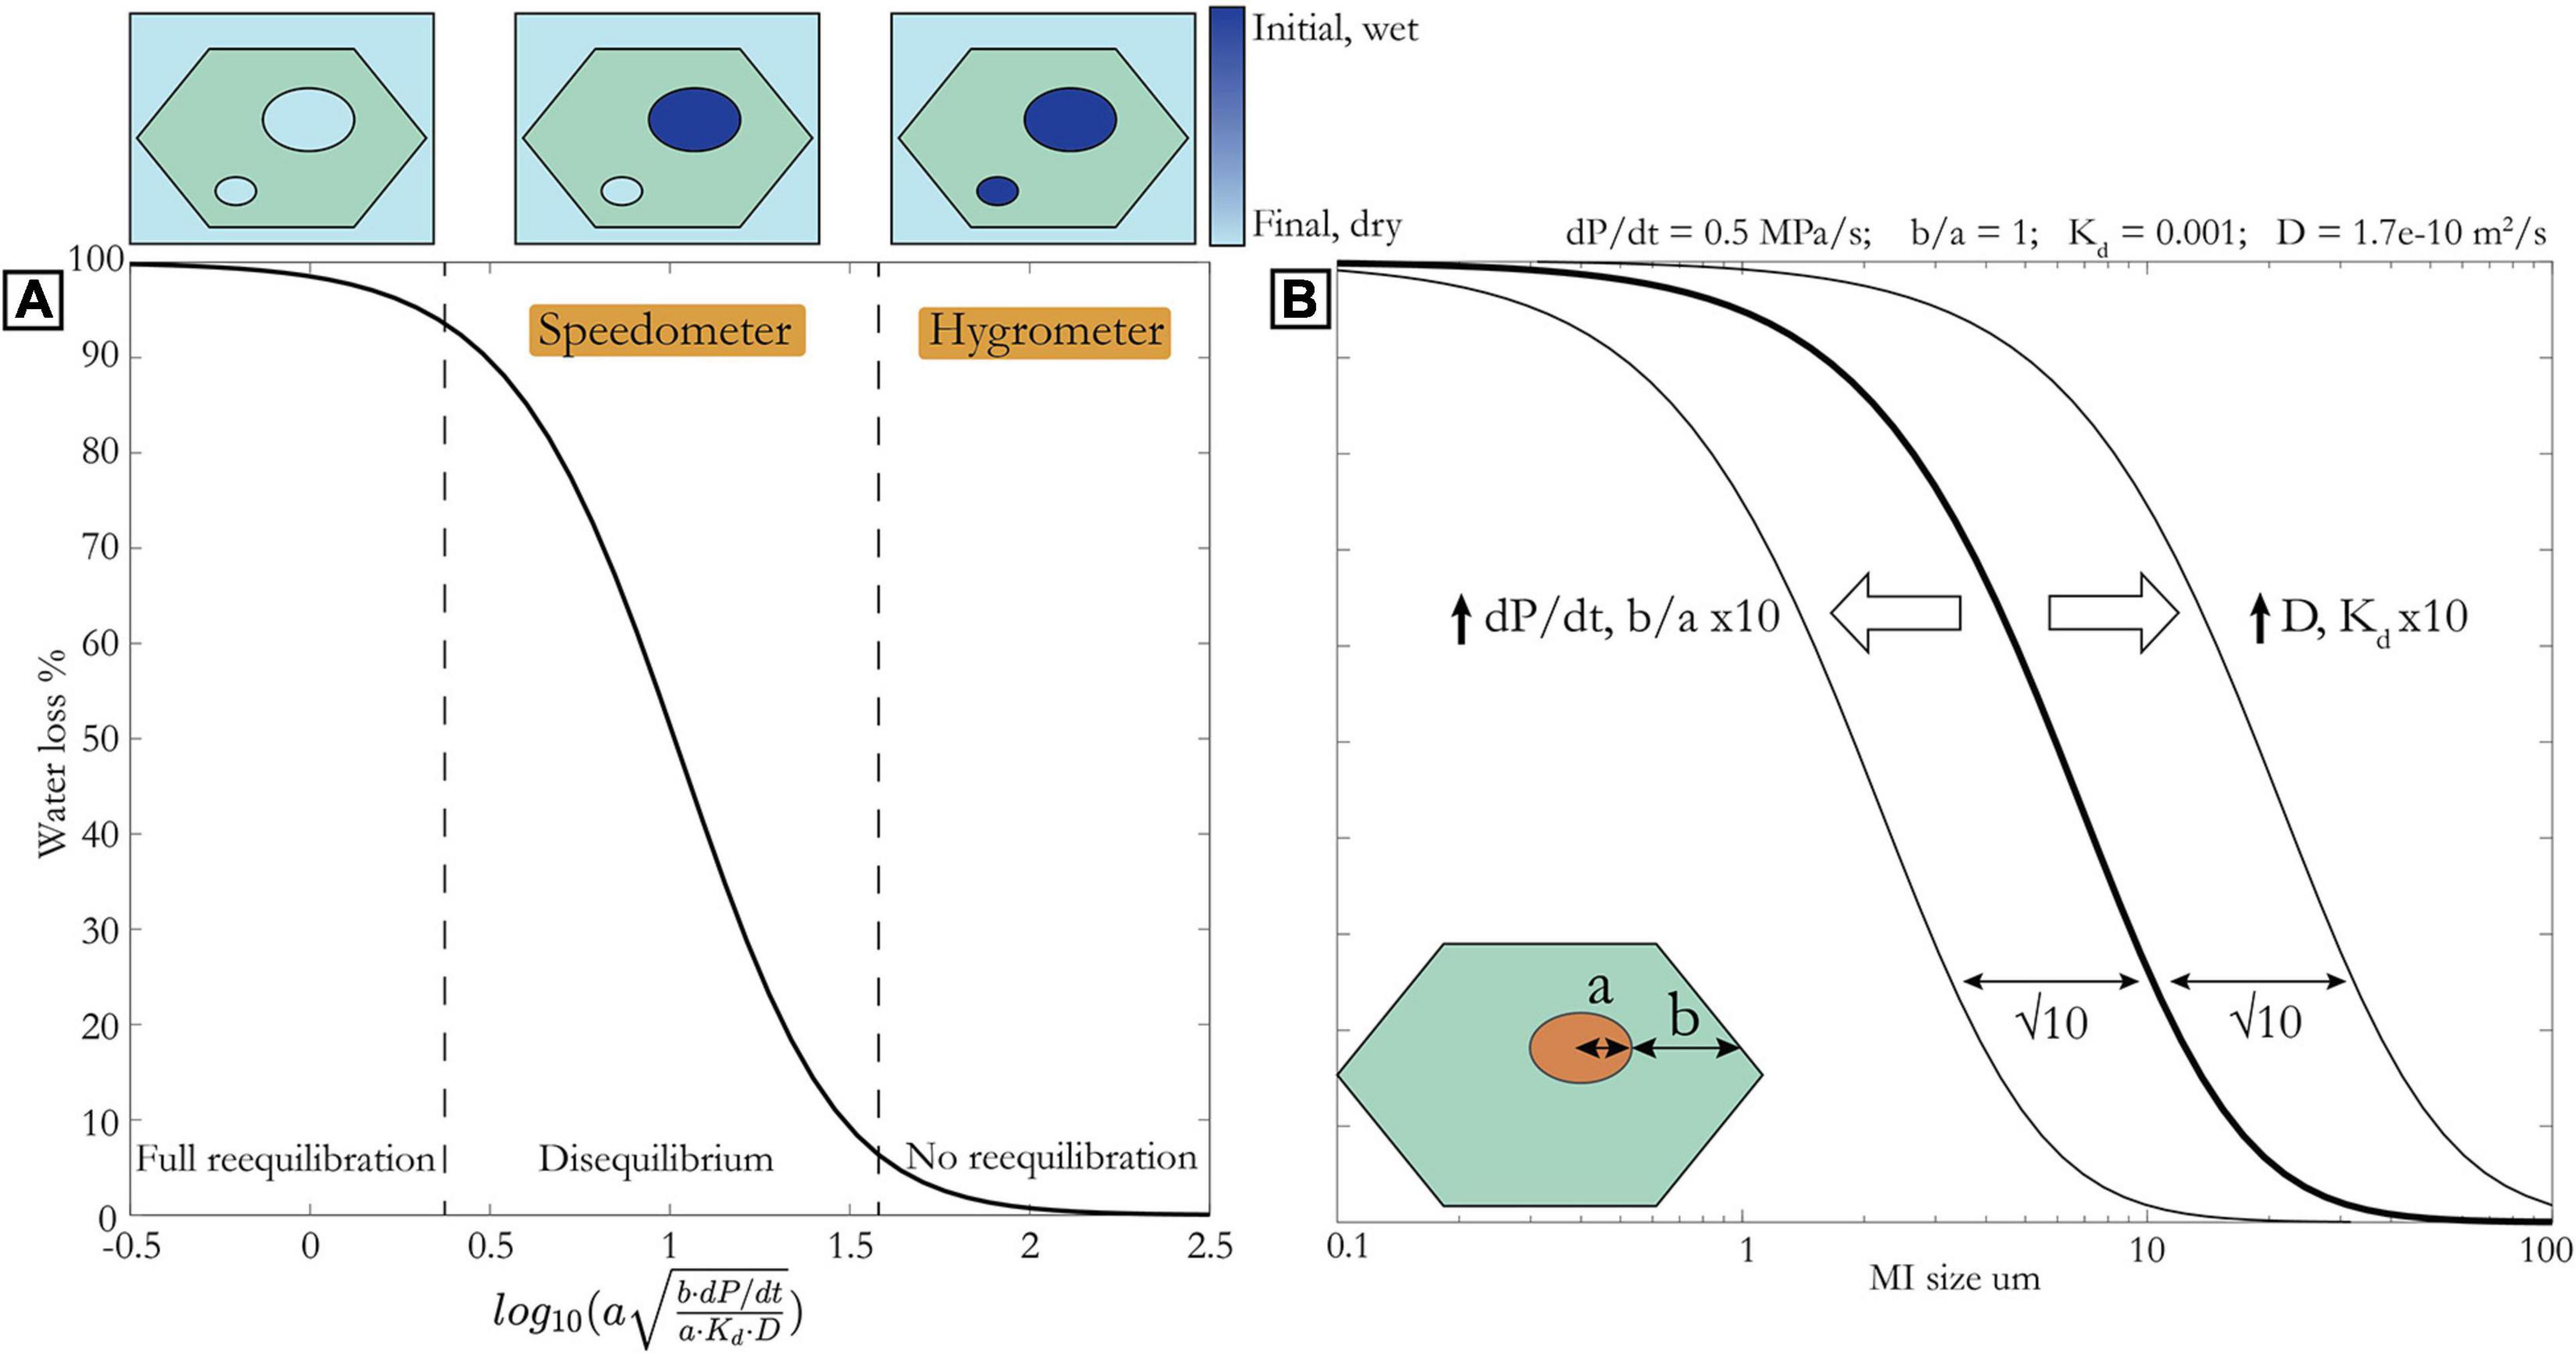
Figure 5. (A) % Water loss against x (see Eq. 2) for boundary condition of open system degassing modeled using SolEx (Witham et al., 2012) for initial volatile concentrations of 1,000 ppm CO2, 4.75 wt% H2O. Initial pressure is 400 MPa. Upper left portion indicates ∼ complete water loss (MIs are in equilibrium with groundmass). Central portion indicates water loss dependent on MI size and distance to olivine rim (MIs are in disequilibrium) – this regime is best suited for speedometry. Lower right portion indicates minimal water loss (MIs are still in equilibrium with initial wet magma) – this regime is best suited for hygrometry. Panel (B) same as panel (A) but with × axis as MI radius and all other parameters fixed as indicated above. Arrows and thin curves show effect of changing these parameters. Inset schematic of olivine and melt inclusion illustrates parameters a and b.
where
We note that open vs closed system degassing makes very little difference to the curve (Supplementary Figure 4).
Figure 5A can be thought of as a regime diagram. On the lower right branch, at large a, b, and dP/dt, the diffusion front through olivine crystals has not yet reached the MIs, which therefore remain in equilibrium with the initial wet host magma from which they were entrapped. In this case, we can use the H2O concentration in the MIs to infer that in the host magma at the last depth of equilibration (see next section). In other words, their fidelity as a hygrometer remains intact. If water loss from MIs plots on the central limb, this implies that the MI-olivine system is in disequilibrium and we can exploit this to determine magma decompression rate (Chen et al., 2013; Lloyd et al., 2013; Barth et al., 2019). These inclusions are most useful as speedometers. On the upper left branch, MIs have lost nearly all of their initial water and are in equilibrium with the degassed host magma. These melt inclusions have lost all information about their initial water and the rate of ascent.
There are two primary ways to use the relationship in Figure 5 and Eqs. 1 and 2. If the amount of water loss is known (see later discussion for methods of estimating initial water), it is possible to calculate the magma decompression rate, as long as water loss is not 0 or 100% (i.e., MIs must lie on central limb). Alternatively, if decompression rate is known it is possible to determine the likelihood of water loss, and use this to guide the selection of MI sizes, depending on whether the intent is hygrometry, speedometry, or both. Independent estimates of approximate decompression rate can be made using the relationship between mass eruption rate (and magnitude, VEI, intensity) and decompression rate that is emerging from recent studies (Figure 6; Ferguson et al., 2016; Barth et al., 2019; Moussallam et al., 2019). This trend provides an estimate of decompression rate based on the magnitude of an eruption. For example, a magnitude 4 eruption is likely to have a decompression rate on the order of ∼ 0.5 MPa/s, in which case MIs greater than ∼10 μm should preserve their pre-eruptive water concentrations for an a/b ratio 1/10 and temperature of 1,100°C [yielding a diffusivity of 1.7e-10 m2/s using the Arrhenius relationship from Barth et al. (2019)]. A magnitude 0-1 eruption on the other hand may involve slower magma decompression (∼ 0.01 MPa/s), in which case only MIs greater than ∼70 μm would preserve initial water, all else being equal. Note that these calculations assume that diffusion ceases as soon as the olivine is erupted. This is a good assumption for lapilli or ash, but lava flows and even volcanic bombs can stay hot and allow water loss to continue far longer (Lloyd et al., 2013). Any melt inclusion H2O measurements from bombs or lava should be treated with concern for water loss.
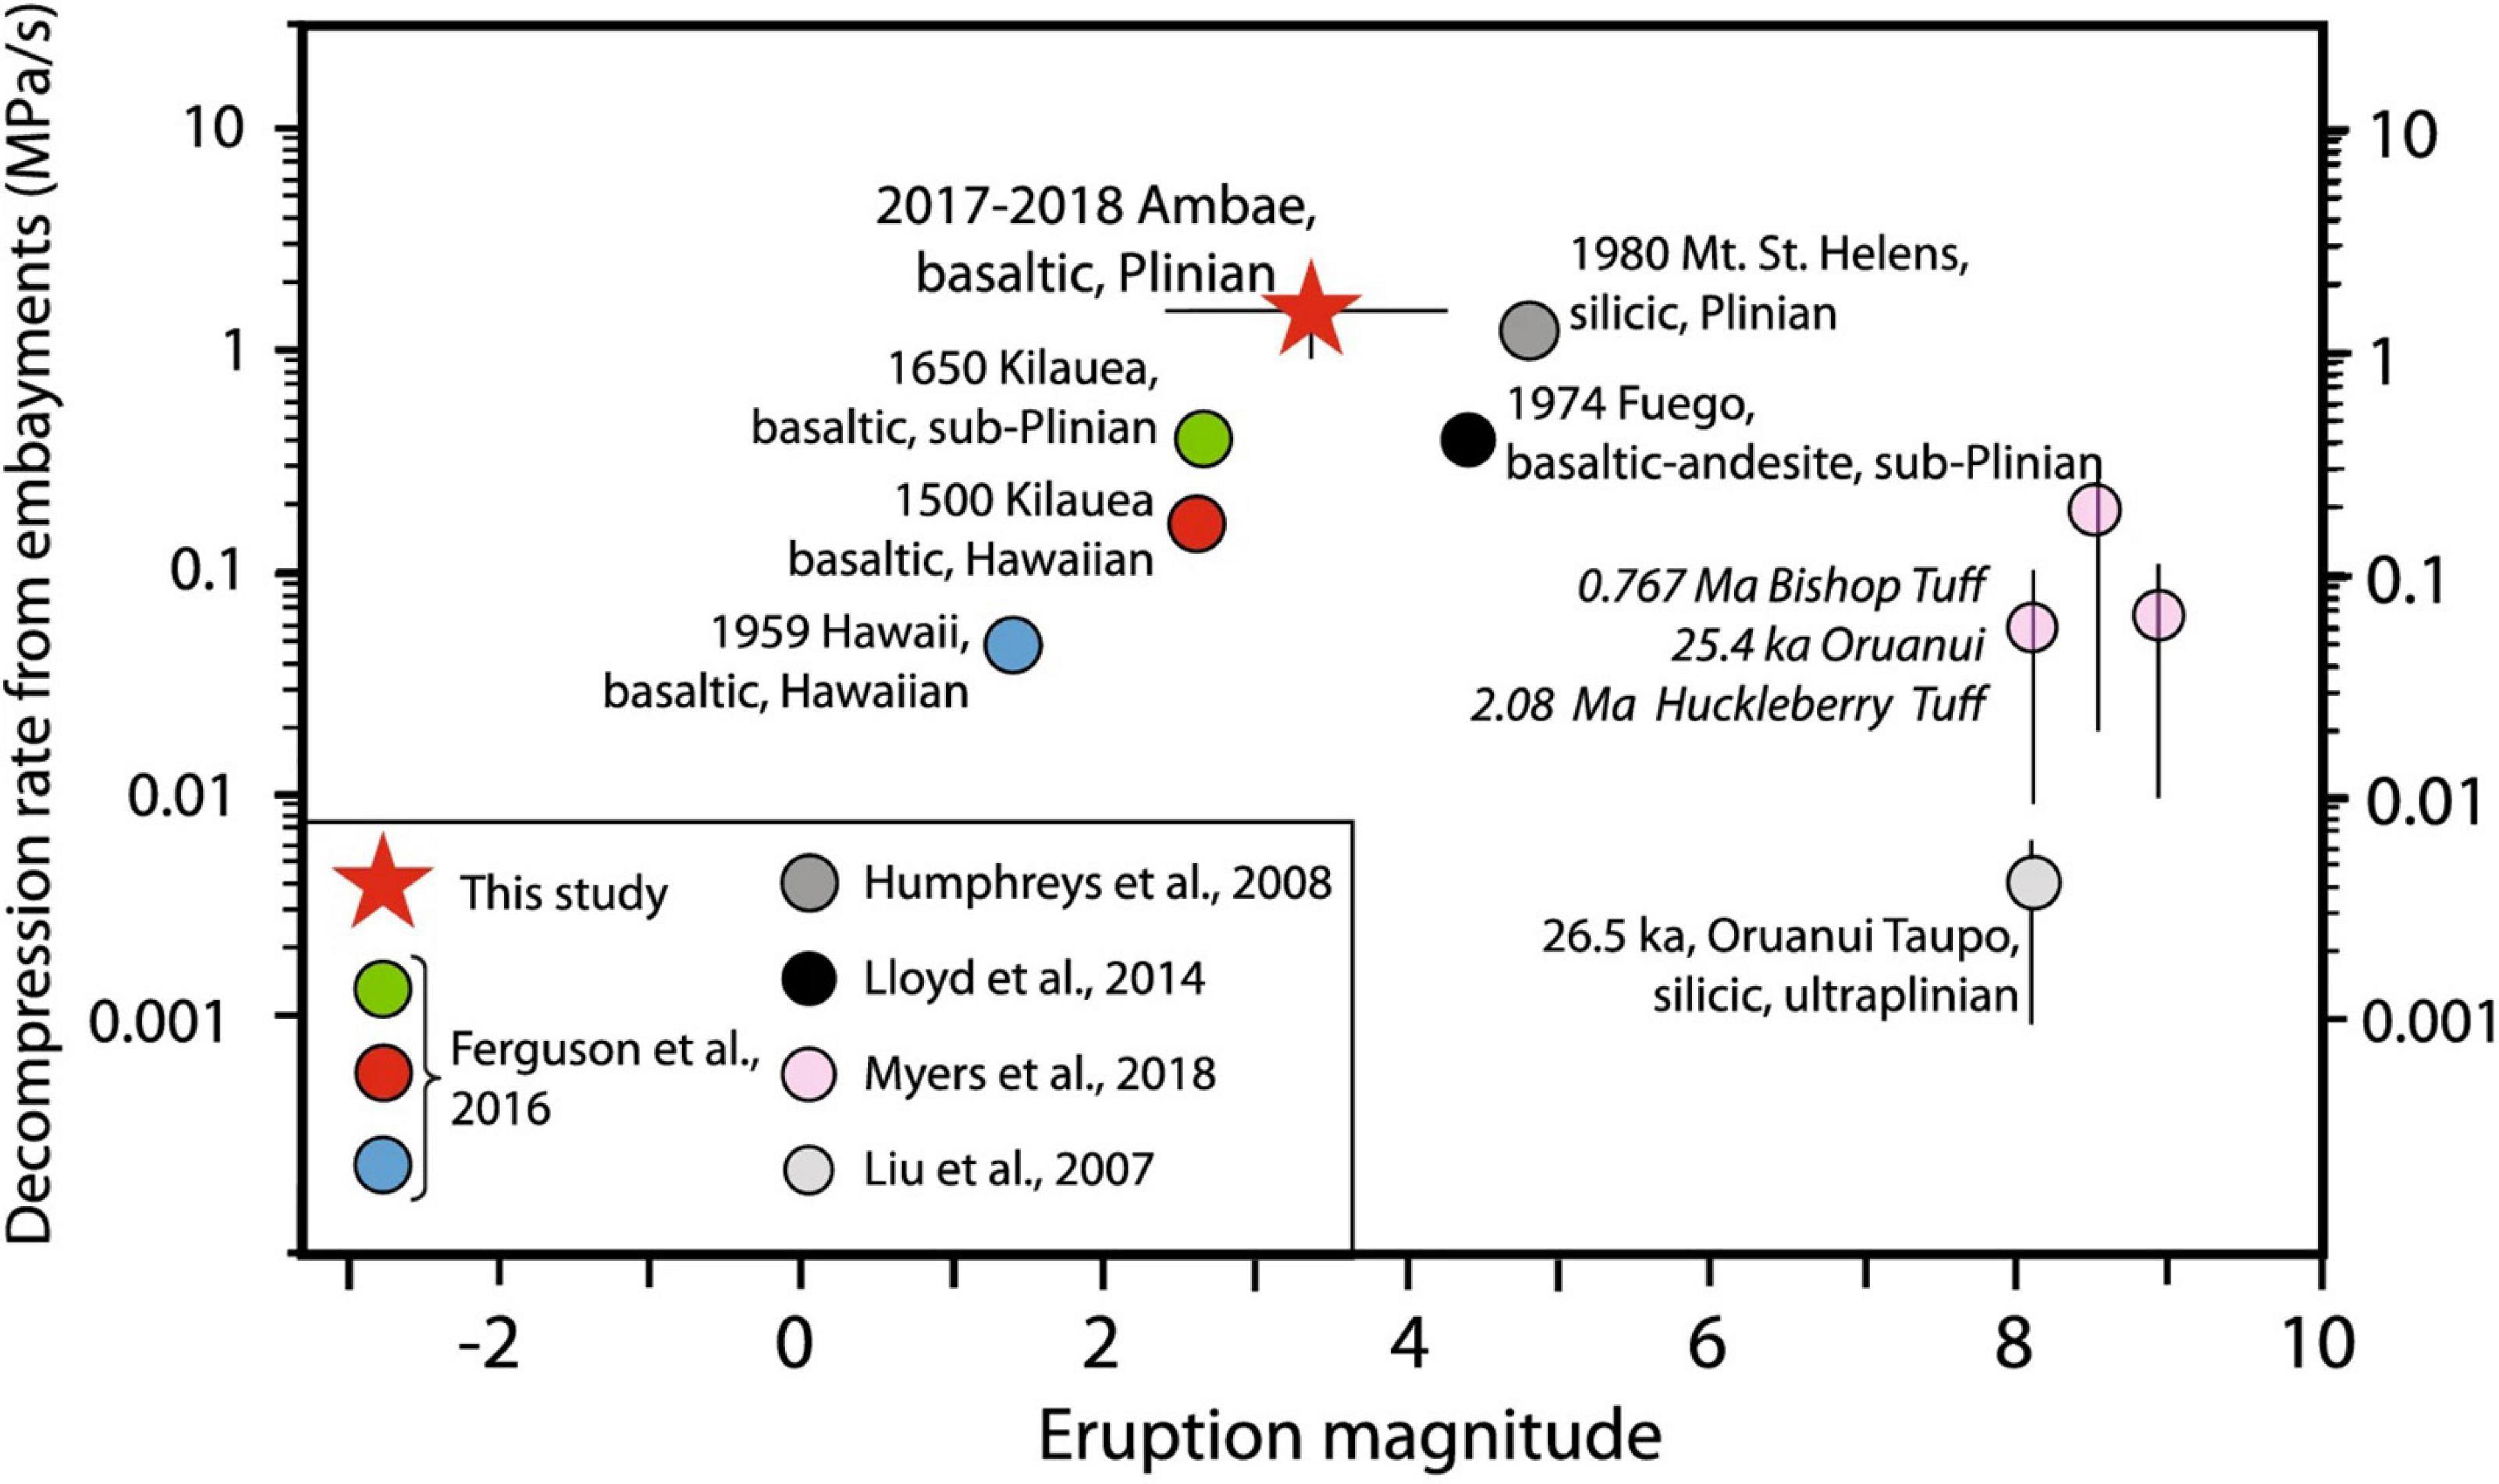
Figure 6. From Moussallam et al. (2019), their Figure 13. Compilation of decompression rate estimates using the embayment volatile diffusion method and comparison with eruption magnitude. For basaltic eruptions a trend of increasing decompression rate (i.e., ascent rate) with increasing eruption magnitude can be observed, although this does not extend to more silicic compositions. This trend can be used to approximately estimate decompression rate from eruption magnitude in order to assess water loss (see text for further details). Reprinted by permission from Springer Nature Customer Service Centre GmbH: Springer. Contributions to Mineralogy and Petrology. Moussallam et al. Fast ascent rate during the 2017–2018 Plinian eruption of Ambae (Aoba) volcano: a petrological investigation, copyright 2019.
H2O as a Hygrometer
If there is no relationship between water loss and MI size or distance to the rim, this implies that the MI-ol system is in equilibrium with either the degassed, final exterior melt or the hydrous, initial exterior melt. Either way, such melt inclusions cannot be used to model decompression rate (although it may still be possible to put a bound on the timescales). If the MI H2O concentration is low and comparable to the groundmass, then conditions reflect the top left limb of the regime diagram where MIs retain no information as to their initial H2O concentrations. This situation might arise if olivines are brought up slowly enough that diffusion is able to keep pace with decompression. Alternatively, the magma may ascend quickly but then stay hot for long periods of time, for example in a lava flow or lava lake.
If, on the other hand, MI H2O concentration is significantly higher than that in the groundmass, the olivine must have ascended sufficiently rapidly that diffusion did not progress far enough to affect the MI. In this case (the lower right, “hydrometer” portion of regime diagram), the H2O may record the depth of MI entrapment or magma stalling, CO2 flushing, or even the primary mantle-derived H2O concentration. Other volatile and trace elements can be used to infer which of these scenarios might have occurred, as discussed below.
Interpreting MI H2O Concentration
In this section, we reference Figure 7 to recognize where, when and how water loss has occurred in a magma’s ascent history. Here we focus on scenarios of water loss during ascent, which are anticipated for water-rich arc melts, and do not consider processes which would cause MIs to gain H2O (H2O gain has been demonstrated for low-water oceanic magmas or ultra-depeleted arc magmas – Kamenetsky et al., 1998; Portnyagin et al., 2008; Koleszar et al., 2009). Another caveat is that we do not consider processes of magma mixing, which could introduce chemical gradients and thus lead to water loss/gain from melt inclusions (e.g., Pistone et al., 2017; Ruth et al., 2018). Finally, it is important to note that while some amount of water loss will occur at pressures greater than water saturation due to partitioning of H2O into a CO2-rich vapor phase (Holloway, 1976), most water loss occurs at pressures below water saturation (wavy line in Figure 7). Thus, MI H2O concentration can be used to infer MI entrapment depth for depths shallower than H2O saturation; for depths greater than this a good understanding of the CO2 degassing path is necessary to determine depth. Below we describe the scenario for each of the panels (A–E) in Figure 7, and which diagnostic tools may be used to identify each scenario.
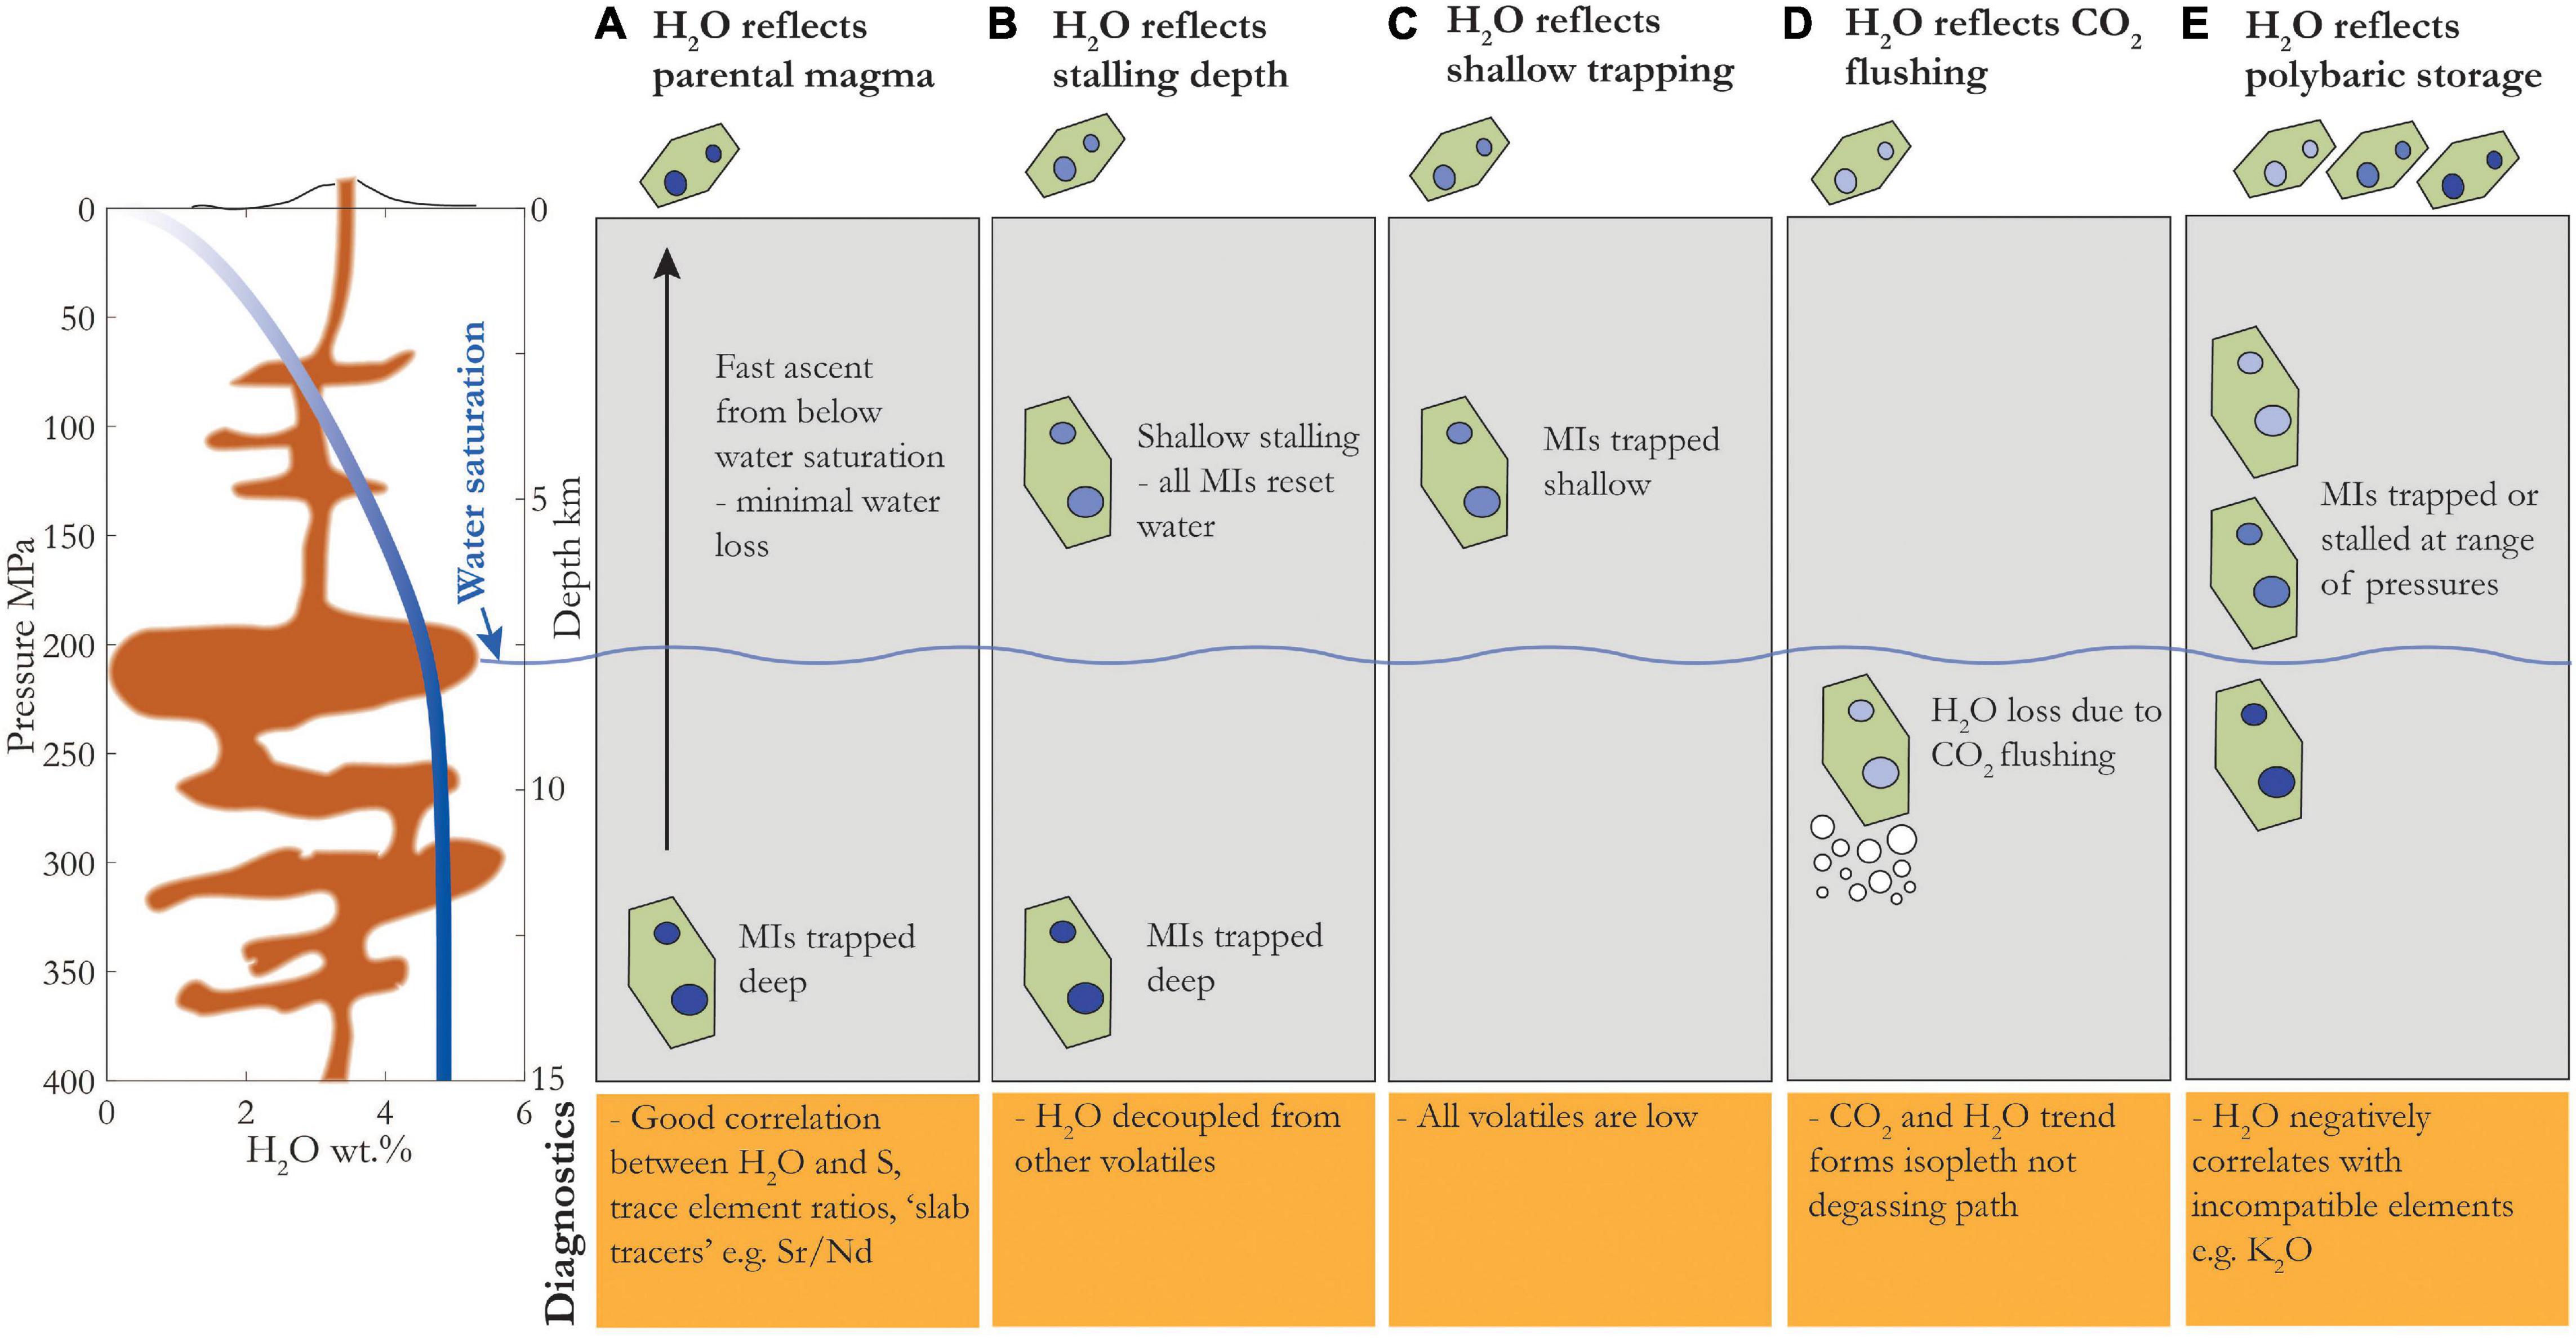
Figure 7. Schematic showing different processes affecting MI H2O concentrations – labels correspond to text headings above. Left: Water solubility as a function of pressure from SolEx for Cerro Negro basaltic composition with 4.75 wt% initial H2O. Depth shown for illustrative purposes, assuming density of 2.7 g/cm3. Water saturation depth shown as wavy blue line (∼200 MPa for 4.75 wt% H2O). Note that for simplicity, we have used the water saturation pressure as the critical pressure below which water loss becomes significant but some water loss will occur deeper than this if the magma is saturated in a vapor phase, particularly for CO2-rich magmas. Below in orange: key diagnostics to infer different magmatic processes. Crystals above gray boxes indicate erupted product. MI color tint reflects H2O concentrations, with lighter tints having lower concentrations.
(A) H2O Reflects Primary Magma
The magma has ascended so quickly from below the depth of water saturation that there is not enough time for the diffusion front within the olivines to reach the melt inclusions. If MI H2O concentrations or ratios of H2O to similarly incompatible elements correlate with those of other trace elements (Sadofsky et al., 2008; Plank et al., 2013; Walowski et al., 2015), and have high CO2 and S concentrations, it is possible that measured MI H2O concentrations reflect primary melt compositions.
(B) H2O Reflects Stalling Depth
The magma stalled at a depth shallower than water saturation and remained long enough for all MIs to reset to the lower ambient H2O concentration. This would result in the decoupling of H2O from other volatiles – CO2, S, and Cl cannot diffuse rapidly through olivines, so they may show higher concentrations and correlate with each other, while H2O has decreased from primary values and is roughly constant. The early degassing of CO2 compared to other volatiles as well as its tendency to partition into MI vapor bubbles may lead to its decoupling from other volatiles. Observations of a correlation between S and Cl that is decoupled from H2O would suggest that H2O concentration reflects a stalling depth.
(C) All Volatiles Reflect Shallow Entrapment
If all volatiles are low, it is likely that the MIs were trapped at a shallow depth. Most basaltic magmas initially contain >1,000 ppm S and >100’s ppm CO2 (Wallace, 2005), and since neither volatile diffuses rapidly through olivine, measured concentrations significantly lower than the above limits would indicate shallow entrapment of MI. Several thermodynamic models can be used to estimate pressures of entrapment from equilibrium between H2O, CO2, and S (e.g., VolatileCalc, Newman and Lowenstern, 2002; SolEx, Witham et al., 2012; MagmaSat, Ghiorso and Gualda, 2015).
(D) CO2 and H2O Reflect CO2 Flushing
In addition to decompression, another way to cause magma dehydration is to introduce CO2 vapor into the system. The presence of a vapor phase with low activity of H2O causes H2O to exsolve from the magma at greater depths than it would otherwise (Anderson et al., 1989; Blundy et al., 2010). If the event introducing CO2 vapor (e.g., ascent of gases and/or magma from depth) also causes a crystallization event, MIs entrapped at that time would lie on a vapor isopleth, rather than a degassing path (e.g., Caricchi et al., 2018). However, if CO2 flushing occurred after MIs had already been entrapped, the only effect would be to drive water loss from the melt inclusions, and would therefore be difficult to distinguish from a shallow stalling event.
(E) H2O Reflects Polybaric Storage
The scenarios above involve magma storage at a single depth. If, instead, melt inclusions are trapped at a range of depths shallower than water saturation, H2O should correlate positively with other degassing volatiles (CO2, S, Cl) and negatively with incompatible trace elements (e.g., Wallace and Anderson, 1998; Lloyd et al., 2013; Barth et al., 2019). This is because as magma ascends and degasses H2O, the liquidus is raised which induces crystallization, in turn causing an increase in the concentration of incompatible elements. If the melt inclusions were all entrapped at depth greater than that of water saturation, and then were stalled in a vertically extensive plumbing system shallower than that of water saturation, the H2O would re-equilibrate to a range of values and so decouple from the other volatiles and incompatible elements.
How to Estimate Pre-dehydration H2O Contents
As we have just seen, the ascent of magma toward the surface provides many opportunities for melt inclusion water loss. For studies that are focused on magma formation and the fluxes of water on a global, arc or volcano scale, it is necessary to see past any shallow dehydration events to estimate the primary magma H2O content. On the other hand, if the goal of a study is to use observations of MI water loss to constrain magma decompression rate, the relevant water concentration is that at the last depth of equilibration, and the relevant water loss is the diffusive loss that occurred during the final episode of ascent.
There is a long history of developing proxies to determine pre-eruptive magmatic water concentrations. Because of the large effect of water on the stability of different mineral phases, observations of phenocryst assemblages are often used to infer magmatic water concentration. This has included phase equilibria experiments that have been used to develop hygrometers based on the appearance of plagioclase on the cotectic (Parman et al., 2011), the albite exchange between plagioclase-melt (Sisson and Grove, 1993b; Waters and Lange, 2015), the Mg# of amphibole (Krawczynski et al., 2012), and the silica activity of melts (Carmichael, 2002). Because of the relatively late appearance of plagioclase on the cotectic, methods relying on plagioclase will likely give a view biased to shallow depths and underestimate primary magmatic water concentration. Although amphibole crystallizes deeper in the crust, it is not a common phenocryst phase in primitive arc basalts. Phase equilibria experiments are a good way to estimate primary magmatic water but are time-intensive and not feasible to perform for every sample.
Melt inclusions are an attractive alternative, and as one of the earliest crystallizing phases, olivine is an ideal crystal host for targeting primary and pre-eruptive magmatic water concentrations, and consequently the amount of diffusive water loss. Below, we outline several approaches for estimating the pre-dehydration H2O contents.
Maximum H2O in a Suite of MIs
The most straightforward approach is to assume that the highest water concentration within a population of melt inclusions is representative of the initial parental magma. The assumption of a single value for initial H2O is a good approximation if the region of magma storage is restricted in its depth. Along the Aleutian arc, Rasmussen et al. (2018) found good agreement between the maximum H2O concentration in a MI suite and geophysically-constrained magma storage regions (from seismic or geodetic observations). However, many volcanic storage systems are thought to be vertically extensive and melt inclusions are likely entrapped at different depths, with different initial H2O concentrations (e.g., Roggensack, 2001; Ruth et al., 2016). The assumption of a common initial H2O concentration can be tested using the D/H isotopic ratios of a suite of MIs (Walowski et al., 2015). It has been demonstrated experimentally that diffusive water loss increases the D/H ratio of the melt inclusion (Hauri, 2002; Gaetani et al., 2012). Therefore, a suite of MIs with a common initial H2O concentration and H isotopic composition but variable degrees of diffusive reequilibration would be expected to show a negative correlation between H2O and D/H, as found in samples from the Cascades by Walowski et al. (2015).
Coupled Systematics of Incompatible Elements and H2O Along Liquid Line of Descent
During ascent, magma degassing raises the liquidus temperature, inducing crystallization (Médard and Grove, 2008; Danyushevsky and Plechov, 2011; Lloyd et al., 2013). This has the effect of simultaneously raising the concentration of incompatible elements and lowering H2O in the melt (Figure 8). To account for differences in initial entrapped H2O concentrations, we can use the coupled systematics of incompatible elements, such as K2O and H2O (Wallace and Anderson, 1998; Lloyd et al., 2013; Myers et al., 2019). The deepest (parental) magma composition – that is the highest H2O and lowest K2O – must be known, and then the trend of degassing-driven crystallization may be thermodynamically modeled using MELTS (Ghiorso and Gualda, 2015) or Petrolog (Danyushevsky and Plechov, 2011). The initial H2O concentration for each melt inclusion is calculated using the measured K2O concentrations and correcting back to this trend (green arrow, Figure 8). Both this and the last method are unable to restore water to higher values than the maximum observed. That is, if all melt inclusions have lost water, these approaches are not helpful for determining the primary or parental magma, only the pre-eruptive magma relevant for modeling decompression rate.
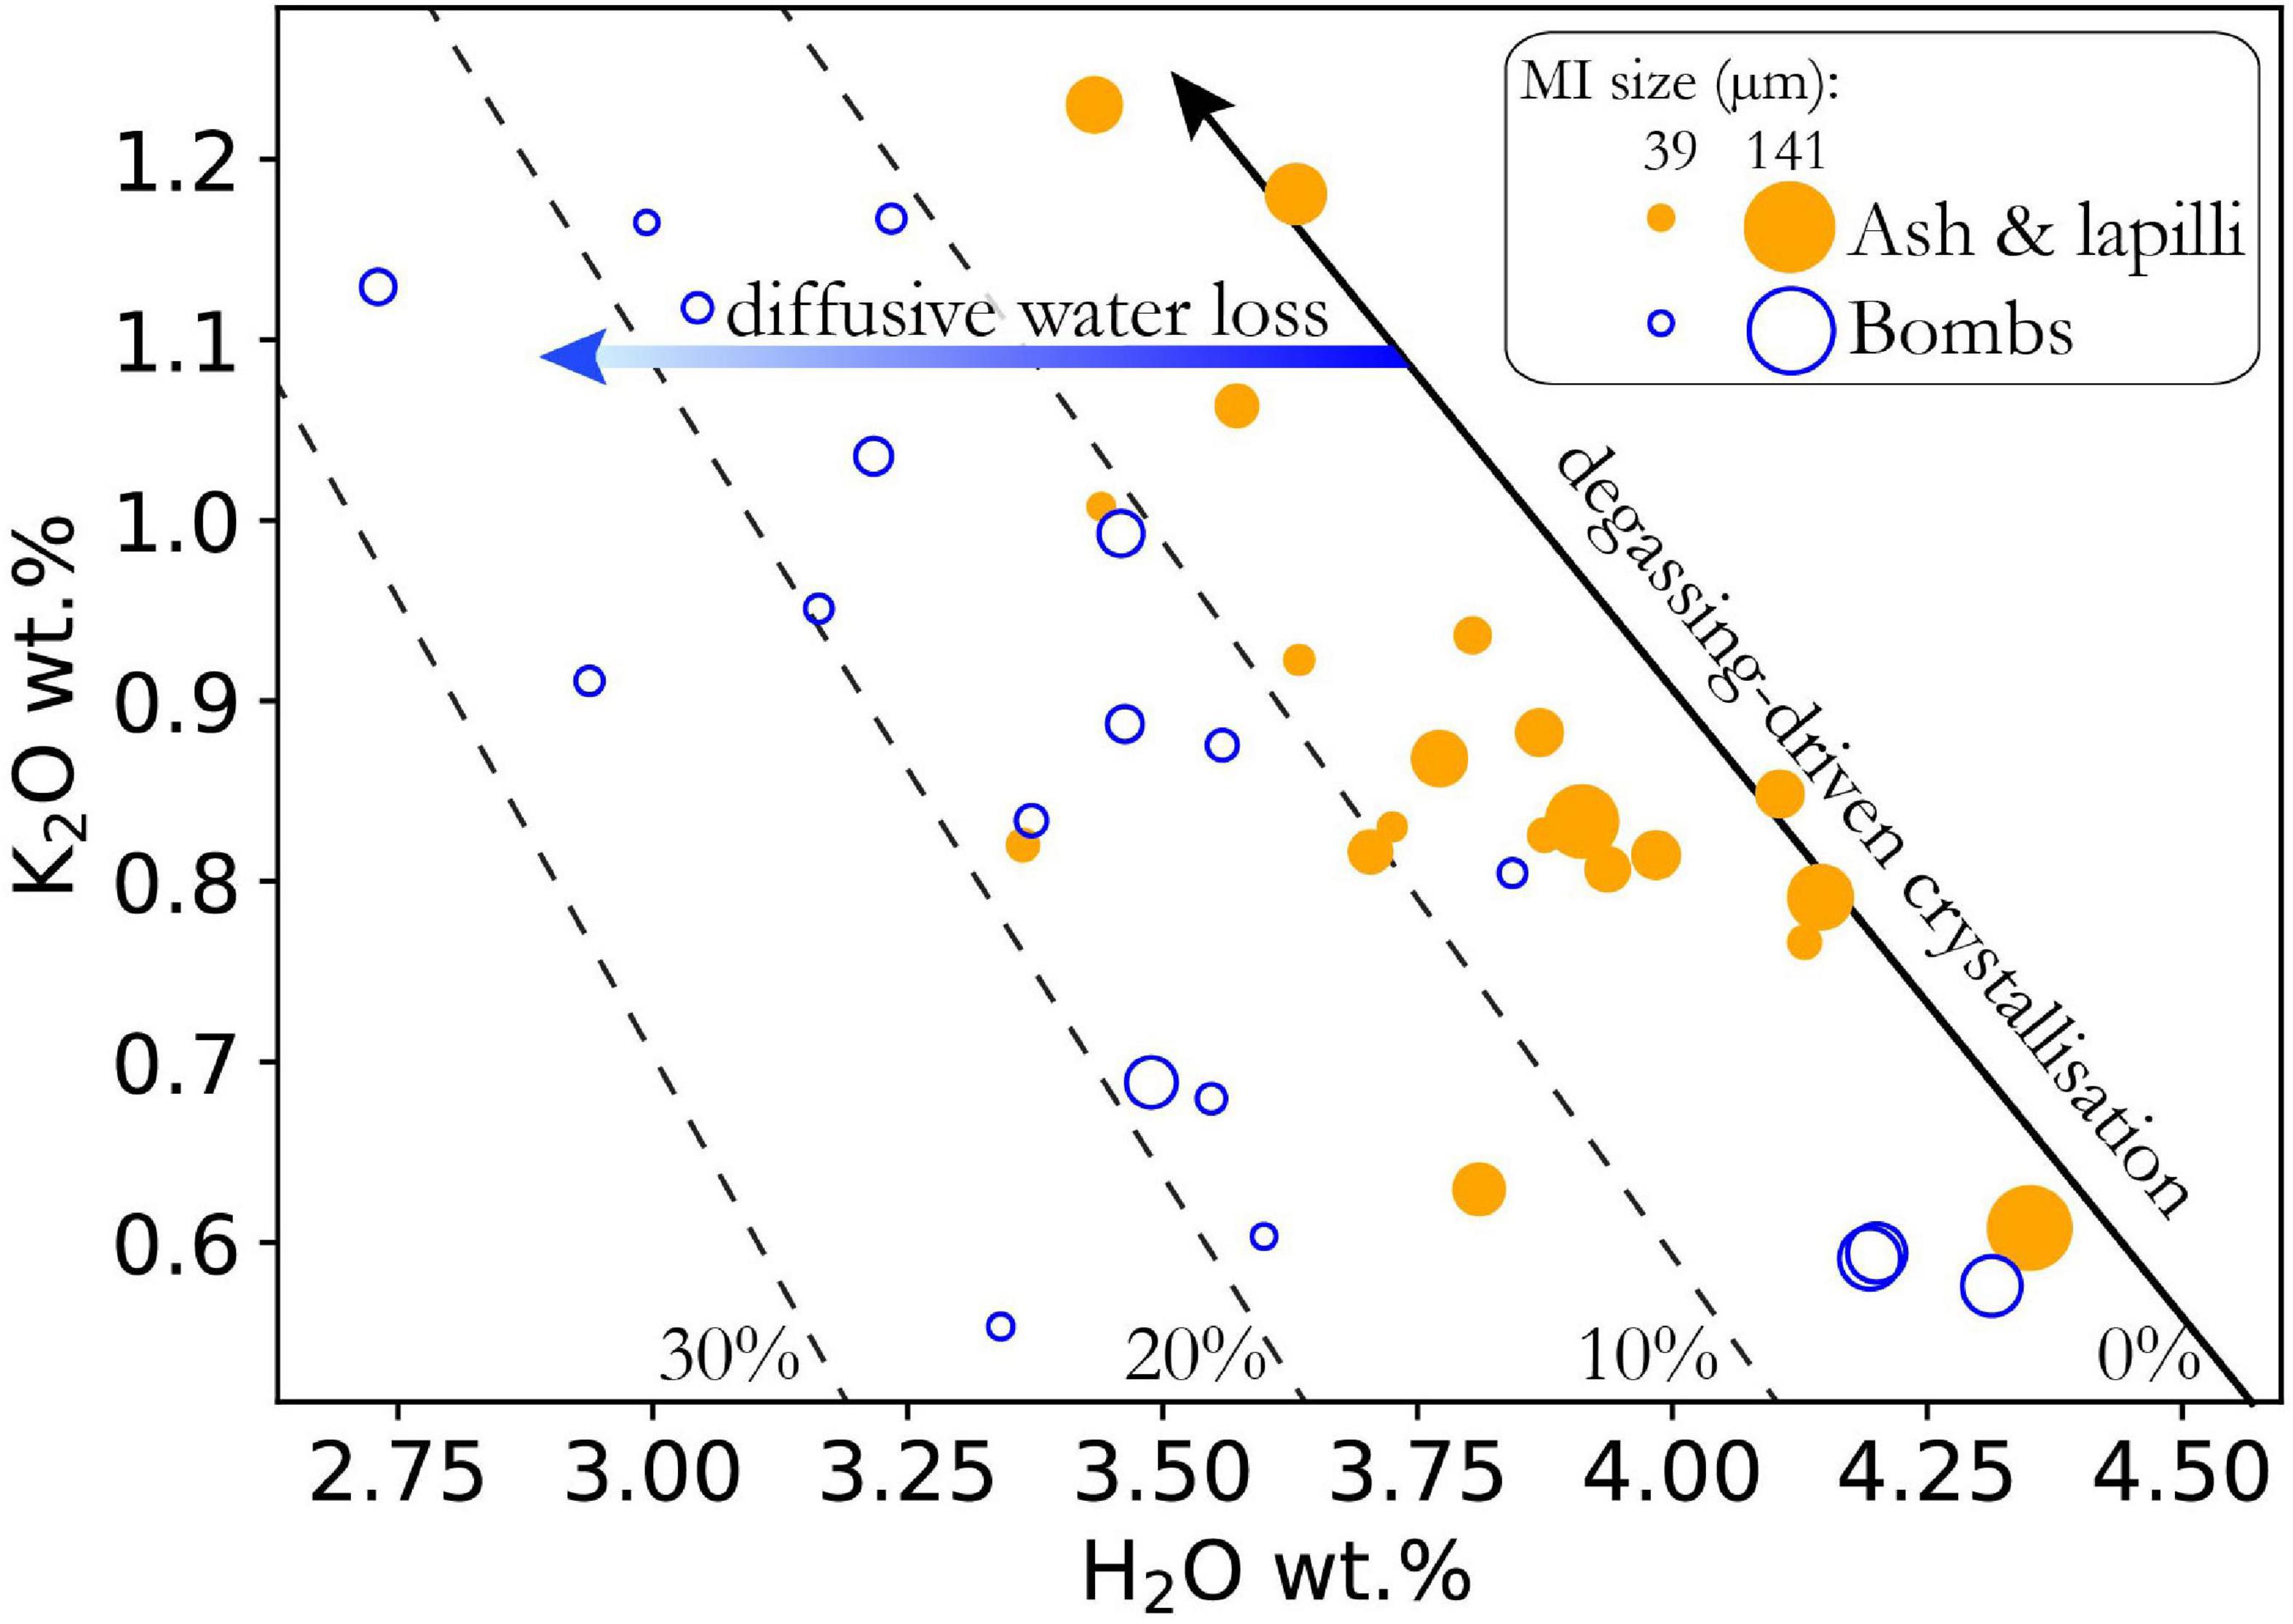
Figure 8. K2O versus H2O for 1974 eruption of Fuego volcano, Guatemala (modified from Lloyd et al., 2013). Degassing-induced crystallization moves melt composition upward along the black arrow, modeled with Petrolog3 (Danyushevsky and Plechov, 2011) for starting composition of 0.5 wt% K2O, 4.45 wt% H2O, Pi = 2.5 kbar, Pf = 1.1 kbar, and decompressing at 30 bars/°C. Measured MI H2O is corrected back to this black line along blue arrow using measured K2O to infer pre-entrapment H2O content. Dashed lines show amount of re-equilibration [diffusive water loss/(initial water-final water)]. Marker size scaled to MI radius (see key). Radius calculated as the average of x,y,z, assuming z = y (see earlier discussion on melt inclusion size).
Coupled SiO2-H2O Loss From MIs
A method that holds promise for restoring melt inclusions to primary water concentrations is to use the relationship between SiO2 and H2O that may develop during MI hydration or dehydration. Portnyagin et al. (2019) show that experimentally hydrated and dehydrated MIs undergo associated SiO2 gain and loss, respectively (Figure 9A). Geochemical data from natural melt inclusions at Cerro Negro (Barth et al., 2019) support this; MIs with greater inferred water loss are offset to lower SiO2 (Figure 9B). This implies that H2O is incorporated along with silica into olivine on the walls of melt inclusion, creating hydrated, metal-poor defect olivine. To calculate the amount of water loss, the initial SiO2 of the melt inclusion and H2O/SiO2 of the reaction must be known. Portnyagin et al. (2019) find that a H2O/SiO2 ratio of between ∼1.5 to 2 fits their observed H2O-SiO2 trends. They use the whole rock composition as an estimate of initial MI SiO2 concentration and calculate ∼2 wt% and ∼5 wt% water loss in MIs from tephra and lava, respectively, at Klyuchevskoy volcano. This is a valuable method to estimate H2O if all melt inclusions have lost H2O. However, there are difficulties in applying this method to natural samples since the use of whole rock composition as the initial MI composition requires that the magma has remained a closed system from the time of melt inclusion entrapment to the time of eruption (i.e., no magma mixing or addition or loss of crystals). Furthermore, if MIs were entrapped with a range of initial SiO2 contents, a fractionation model may be needed to constrain the initial liquid line of descent. Given these considerations, this method may be most useful for primitive melts, since limited crystallization of olivine and pyroxene does not cause large variations in the SiO2 concentration of the melt.
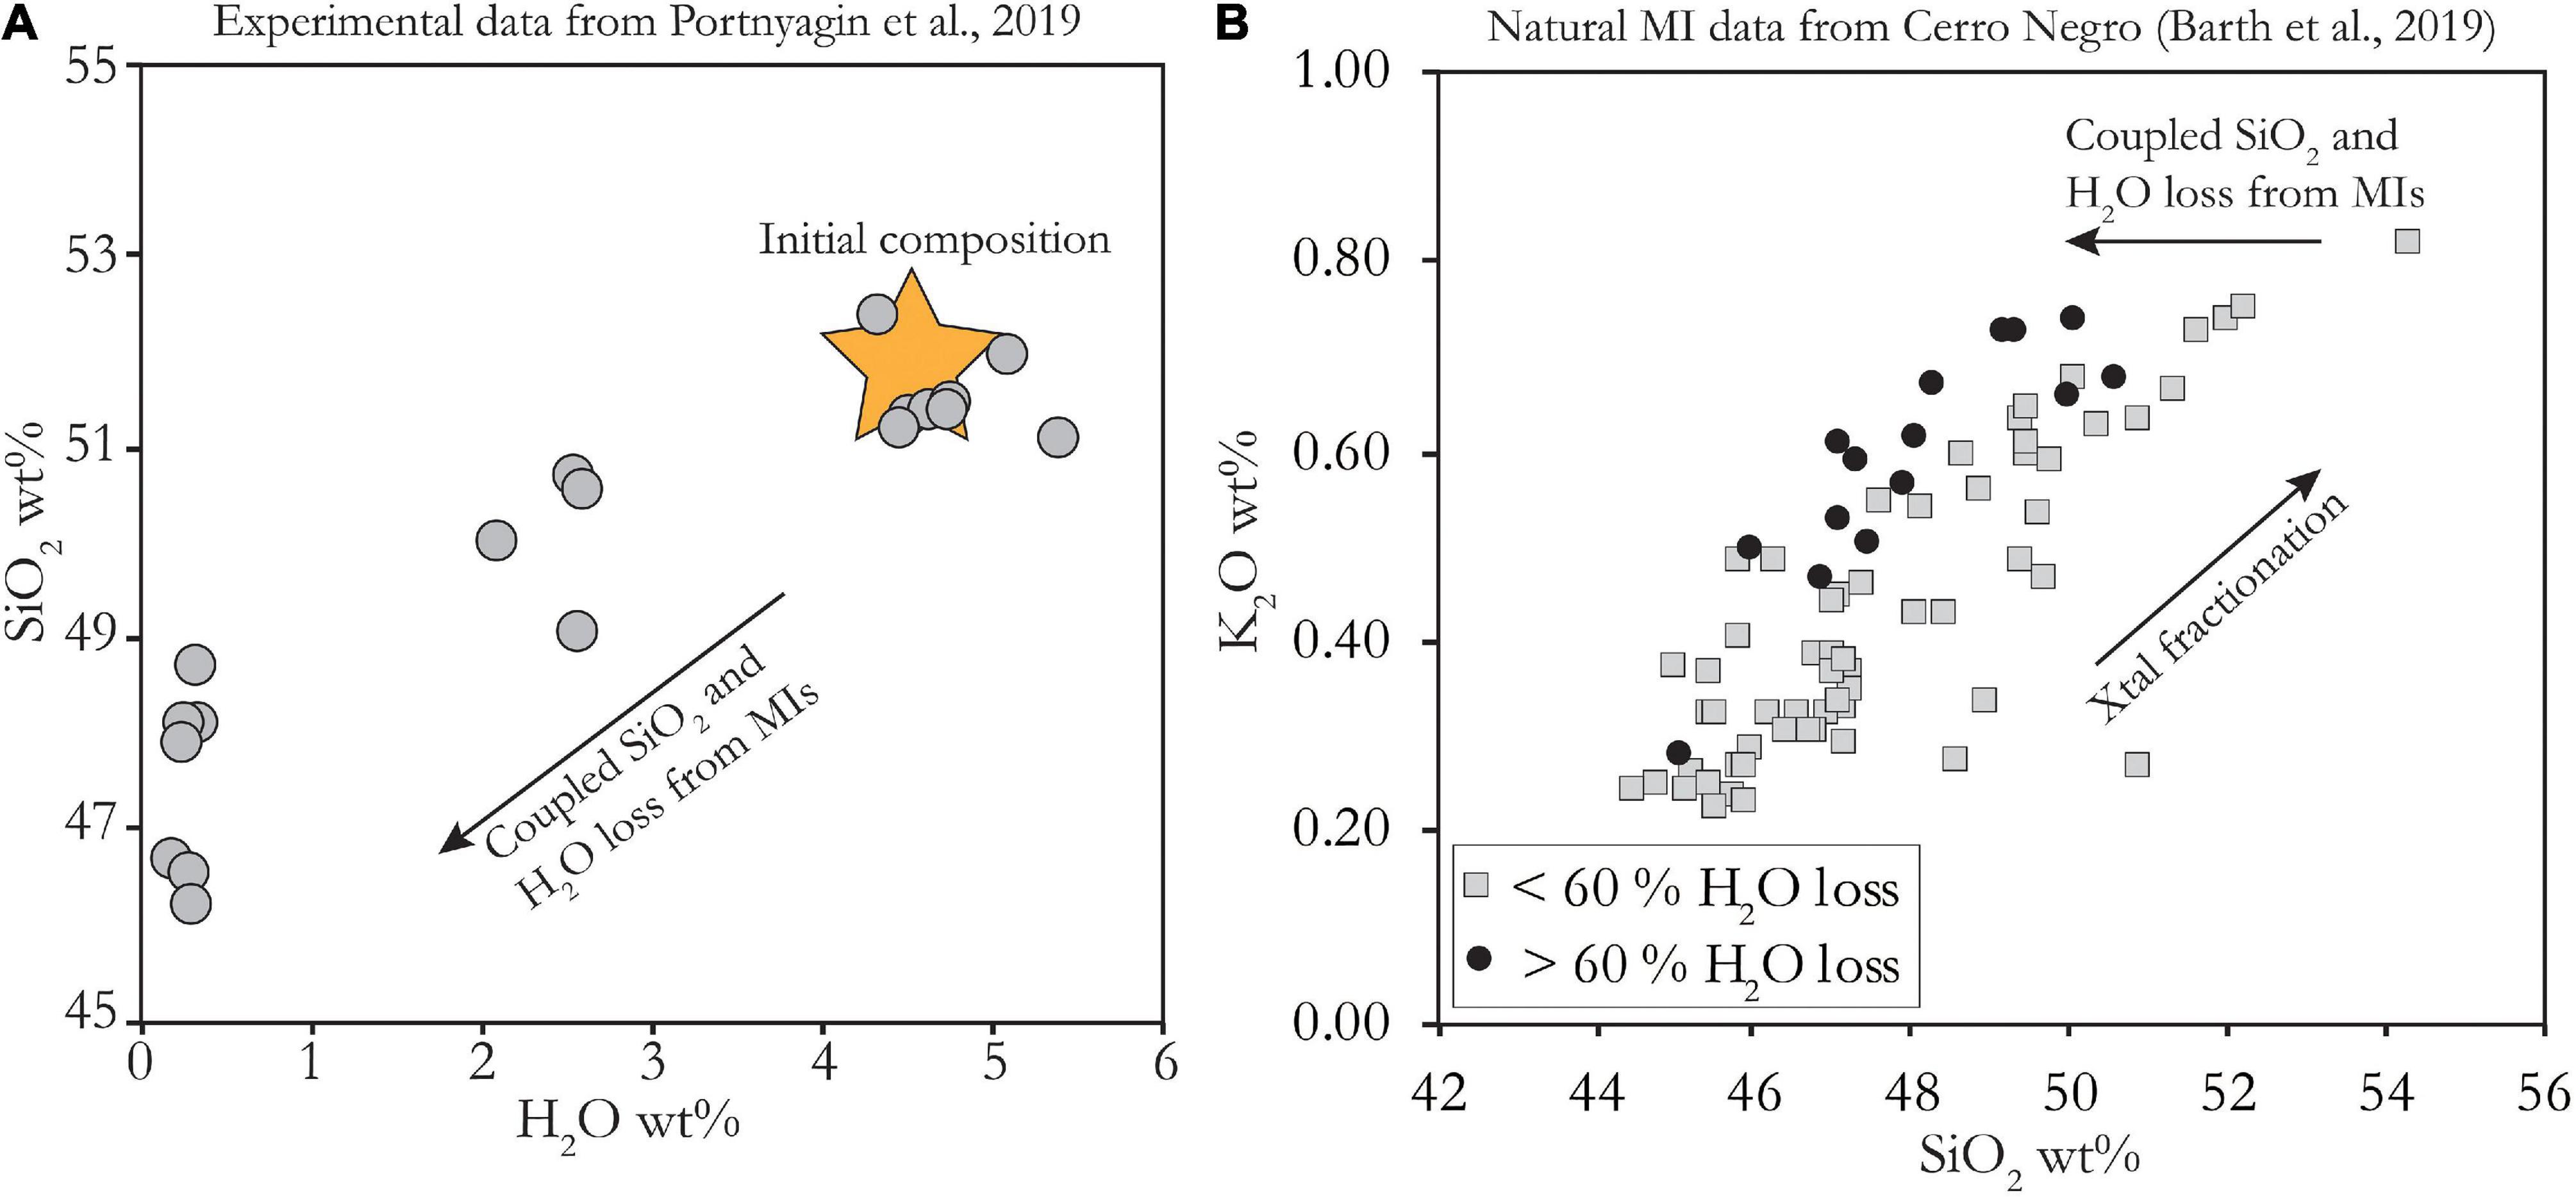
Figure 9. (A) Experimental data from Portnyagin et al. (2019), showing coupled H2O-SiO2 loss from MIs. Yellow star shows inferred initial composition based on high-Mg Klyuchevskoy basalts and H2O of fully rehydrated MIs. SiO2 normalized to 100% on anhydrous basis to compare between MIs and whole rock. (B) natural data on MIs from Cerro Negro volcano, Nicaragua (Barth et al., 2019). Broad trend of increasing K2O with SiO2 is driven by crystal fractionation. MIs for which large amounts of diffusive water loss were calculated (as in Figure 8) are offset to lower SiO2 than those with less calculated water loss. Concentrations are as measured (uncorrected for PEC, not normalized to 100% anhydrous) but these corrections do not affect systematics.
Comparison of Water-Independent and Water-Dependent Thermometry
A final independent method for calculating primary magmatic H2O concentration is through comparison of H2O-dependent and H2O-independent thermometers, as first proposed by Sobolev et al. (2016) and later applied by Portnyagin et al. (2019) and Tobelko et al. (2019). H2O-dependent thermometers [e.g., Mg partitioning between olivine and melt – Ford et al. (1983)] will give higher temperatures than H2O-independent thermometers [e.g., Al-in-olivine – Wan et al. (2008); Sc/Y in melt and olivine – Mallmann and O’Neill (2013)] and the magnitude of this temperature offset can be used to determine water concentration using a parameterization of the effect of H2O on liquidus depression (Médard and Grove, 2008). This method may not be the most precise way to estimate H2O due to thermometer calibration uncertainties, and becomes less precise with increasing H2O concentration due to the nonlinear effect of H2O on liquidus temperature depressions. However, for H2O concentrations below ∼ 5 wt% it provides a useful independent method and was found to show good agreement with results from the coupled SiO2-H2O loss method (Portnyagin et al., 2019).
H2O as a Speedometer: Calculating Magma Decompression Rate
Magma decompression rate is a key parameter governing the dynamics of eruptions (Gonnermann and Manga, 2013; Cassidy et al., 2018). It affects the nucleation and growth of bubbles and crystals, the ability of bubbles to segregate from the melt, the temperature evolution of the magma, and the magma rheology (which then itself affects the magma decompression rate). Since these processes are affected by the decompression rate, they can be exploited as tools to constrain the decompression rate. These tools fall broadly into two categories: those that are based on the textures of bubbles and crystals in erupted clasts, and others that are based on diffusion of volatiles. As discussed above, if an estimate of decompression rate can be made, it is possible to determine the likely amount of water loss for melt inclusions of different sizes and distance to the crystal edge. This can help to inform melt inclusion selection so as to capture the speedometry and/or hygrometry regions of the regime diagram (Figure 5). Below, we outline a number of ways to determine the magma decompression rate independently of MI water loss, before revisiting the MI water loss method as portrayed in the regime diagram section.
Higher rates of magma decompression lead to higher bubble and microlite number densities, and this effect has been parameterized in Toramaru (2006), Toramaru et al. (2008). Other aspects of crystal textures, such as the size distribution and shapes can also be used to constrain the decompression rate (Szramek et al., 2006; Castro and Dingwell, 2009; Brugger and Hammer, 2010).
Volatile diffusion has been exploited in several ways to provide decompression rate estimates. Diffusion profiles along melt embayments (melt inclusions that were never sealed and maintain communication with the magma) can be modeled to determine decompression rate (Anderson, 1991; Liu et al., 2007; Humphreys et al., 2008; Lloyd et al., 2014; Ferguson et al., 2016). The advantage of this technique is that the different volatile species (e.g., H2O, CO2, S) have different depth-solubility relationships and different diffusivities, which means that they can provide a constraint on the entire decompression path, not just the average decompression rate above water saturation (e.g., Lloyd et al., 2014; Newcombe et al., 2020a). However, embayments are typically rare compared to melt inclusions and can have complex 3D shapes, which may affect modeled decompression rates (deGraffenried and Shea, 2019).
An alternative is to model diffusion profiles within the olivines themselves, either from the rim of the crystal (Newcombe et al., 2020a) or leading away from melt inclusions (Le Voyer et al., 2014). The strength of this approach lies in the abundance of olivine in most basaltic-intermediate magmas. However, since olivine is a nominally anhydrous mineral and can only incorporate several tens of ppm H2O, these studies rely on rigorous cleaning procedures to reduce the background and the use of secondary ion mass spectrometry (SIMS), which is expensive and time-consuming. Alternatively, relatively thick wafers (>100 μm) of olivine can be measured using FTIR (e.g., Demouchy et al., 2006), although this approach encounters difficulties with 3D diffusion effects (termed the ‘whole block effect’ in Ferriss et al., 2015).
On the other hand, measurements of H2O in melt inclusions are often a byproduct of these other studies, and so have the potential to provide a large number of decompression rate estimates for relatively little cost/time. If the amount of water loss (estimated using one of the methods described above) has a relationship with MI size and distance to olivine rim as shown in Figure 5, the MIs can be modeled to determine magma decompression rate. There are two primary modeling approaches for determining the decompression rate. First, a single best-fit curve as shown in Figure 5 could be calculated for a single decompression rate for the entire suite of MIs of varying size. Alternatively, each MI or set of MIs within an olivine could be modeled individually to find the best-fit decompression rate, and the result would be a range of decompression rates (Chen et al., 2013; Barth et al., 2019). The advantage of the latter approach is that the distribution of decompression rates could provide insight into variability of ascent rate due to both lateral velocity gradients in the conduit and unsteadiness in eruption dynamics over time (Sable et al., 2006; Barth et al., 2019).
Summary and Recommendations
Although melt inclusions can have complex ascent histories, they often record systematic variations that give confidence in their fidelity under certain scenarios, and reveal their utility as speedometers in others. We have outlined relevant parameters that control water loss (e.g., partitioning, diffusivity), and made recommendations for which values to use (Table 1 and Figures 2, 3). We have developed a regime diagram (Figure 5) that illustrates when a MI can act as a hygrometer or speedometer. We have outlined several scenarios of MI ascent and how they can be identified using diagnostic tools (Figure 7). We have reviewed methods for restoring initial water concentrations in MIs, and for using them to obtain decompression rate. If care is taken throughout the stages of study, from sample collection and preparation through interpretations, there is enormous promise in the rich information contained within the melt inclusion water record.
Despite this promise, however, the MI literature is largely full of water data that are difficult to interpret with the schema we have developed here. Without this assessment, many published water concentration data in MI are of limited use in understanding magmatic and volcanic processes. The unfortunate circumstance is that the vast majority of published MI studies do not report MI size, distance to crystal rim, crystal orientation, photographs, eruptive characteristics of the deposit and/or clast sizes. Without this information, it can be difficult to determine where a given melt inclusion lies within the water-loss regime diagram.
In addition to best practices in identified in Rose-Koga et al. (2021) for general MI studies, we recommend all MI studies that address water specifically are designed with the following recommendations:
(a) Adequate understanding of the volcanic deposit studied, its mass discharge rate, VEI and/or eruptive column height.
(b) Description of the clast size or cooling history of deposit. Ash and lapilli clast sizes (<2 cm) are ideal to prevent post-eruptive water loss.
(c) Selecting MI host crystals that are euhedral and can be oriented by eye, or if not, can be analyzed by EBSD to determine the fast H+ diffusion a direction.
(d) Measuring the distance from the MI to crystal rim along the a [100] direction. Either, crystals must be mounted such that the a direction is preserved within the polished plane or the distance between MI and olivine edge along a must be determined optically before final polishing.
(e) Recording MI sizes, including any assumptions about 3D geometry, and providing photographs of MIs and their hosts.
(f) Providing an accurate estimate of magma ascent temperature, which strongly controls diffusivity.
(g) Evaluating diagnostic petrological tools (e.g. relationships between H2O and incompatible elements, liquid lines of descent, other volatile species and potential SiO2 loss) to infer ascent history, H2O fidelity and/or speedometry.
Future Work
This section highlights some of the key remaining questions regarding MI fidelity and speedometry.
(a) Rate of Water Loss through Olivine. One of the largest uncertainties in modeling water loss from melt inclusions remains the diffusivity of H+ through olivine. Despite major advances in recent years, several questions remain. First, the exact nature of the relationship between diffusivity and olivine chemistry (primarily forsterite, but other trace elements may play a role; Tollan et al., 2018; Jollands et al., 2019) needs to be quantified. In particular, dehydration experiments on natural olivines with forsterite below 80 are lacking, as are measurements on the combined effect of varying concentrations of Fe, H2O and trace elements on the diffusivity.
Secondly, questions remain as to the extent of anisotropy in water loss through olivine. While experiments have consistently shown more than an order of magnitude faster diffusion along a than c crystallographic directions (Ferriss et al., 2018; Barth et al., 2019), this is not always seen in profiles from natural samples (Newcombe et al., 2020a). This raises the question of whether the dehydration experiments are accurately capturing the processes occurring in natural systems. Dehydration experiments of olivines or olivine-hosted melt inclusions are typically done in a 1 atm. furnace with no buffering melt, which may favor different defects and reactions compared to the natural dehydration of olivines ascending toward the surface in a degassing melt. While hydration experiments are often performed at higher pressures with a melt surrounding the olivines, diffusivities relating to hydration should be applied with caution to dehydration processes, as discussed in depth by Ferriss et al. (2018).
Finally, while it is a good first order approximation in the modeling of water loss from MIs, the apparent bulk diffusivity of H+ in olivine misses a lot of richness in the mechanisms of the diffusion and reactions (bulk refers to the total H+ flux, summed across all defects). Jollands et al. (2019) showed that while bulk H2O concentration profiles in natural dehydrated olivines can be described by simple diffusion, when H2O is resolved into separate FTIR peak-specific defects, the profiles show complex shapes that are not consistent with a simple diffusion-out mechanism. Instead, they can be modeled by a combination of reaction between defect sites and fast proton-polaron diffusion out of the crystal. Ferriss et al. (2018) observed that the apparent diffusivity of some defects increased up to a steady state over time, while others decreased with time, which they attributed to changing availability of defect sites for inter-defect reactions. Therefore, the use of a constant diffusivity may not be valid, depending on the crystal chemistry and availability and distribution of defect sites.
(b) Incorporation Mechanisms of Water in Olivine. Another outstanding issue relates to the reaction at the melt-olivine interface (both in the melt inclusion and host magma). Different reactions have been put forward (Danyushevsky et al., 2002; Gaetani et al., 2012; Portnyagin et al., 2019) and there is the possibility that different reactions dominate under different conditions and crystal chemistries. This has implications for estimating initial melt inclusion water concentrations using the SiO2-H2O method (see discussion above, Portnyagin et al., 2019), as well as the partition coefficient which is a key parameter in the modeling of MI water loss.
(c) Non-Linear Decompression Rates. So far, most models of MI re-equilibration assume either a step function or constant decompression rate as the boundary condition. A step function is a good approximation under certain specific circumstances (e.g., instantaneous surface unloading during a landslide, a mixing event juxtaposing hydrous olivines with a dry magma) but is invalid for the case of decompression during magma ascent. The assumption of constant decompression rate is a good first order approximation for determining average decompression rate and making broad comparisons between eruptions. However, magma decompression is likely to be highly nonlinear with large acceleration in the final stages of ascent due to the formation and growth of bubbles, as well as increased frictional pressure loss at the conduit walls due to water loss and consequent viscosity rise (Gonnermann and Manga, 2007). Using the parameterisation from Su and Huber (2017), Barth et al. (2019) examined the effect of acceleration on melt inclusion water loss and found that models which assume constant decompression rate significantly underestimate the total ascent time compared to those which consider acceleration. This is because the amount of water loss is greater at shallower depths and to compensate for spending a lower proportion of time at shallower depths, accelerating magma must have a longer total ascent time. Future models that consider non-linear decompression, and perhaps couple the diffusion model with a physical conduit model, would improve our ability to infer information about conduit processes from natural samples.
Author Contributions
AB designed the article, wrote the manuscript, and created figures. TP designed the article and edited the manuscript. Both authors contributed to the article and approved the submitted version.
Funding
This work was funded by the NSF awards EAR-1524542 and EAR-1731784.
Conflict of Interest
The authors declare that the research was conducted in the absence of any commercial or financial relationships that could be construed as a potential conflict of interest.
Acknowledgments
We are grateful to Henry Towbin and Michael Jollands for animated discussions on H diffusion in olivine. We thank Philipp Ruprecht and Paul Wallace for their insightful feedback on the manuscript. Finally, we appreciate the thoughtful reviews by Maxim Pornyagin and Michael Rowe, which greatly improved the manuscript, and the careful editorial handling by RAC.
Supplementary Material
The Supplementary Material for this article can be found online at: https://www.frontiersin.org/articles/10.3389/feart.2021.614004/full#supplementary-material
References
Adam, J., Turner, M., Hauri, E. H., and Turner, S. (2016). Crystal/melt partitioning of water and other volatiles during the near-solidus melting of mantle peridotite: comparisons with non-volatile incompatible elements and implications for the generation of intraplate magmatism. Am. Mineral. 101, 876–888. doi: 10.2138/am-2016-5437
Anderson, A. T. Jr., Newman, S., Williams, S. N., Druitt, T. H., Skirius, C., and Stolper, E. (1989). H2O, CO2, CI, and gas in Plinian and ash-flow Bishop rhyolite. Geology 17, 221–225. doi: 10.1130/0091-7613(1989)017<0221:hoccag>2.3.co;2
Anderson, A. T. (1991). Hourglass inclusions: theory and application to the Bishop Rhyolitic Tuff. Am. Mineral. 76, 530–547.
Asimow, P. D., Dixon, J. E., and Langmuir, C. H. (2004). A hydrous melting and fractionation model for mid-ocean ridge basalts: application to the Mid-Atlantic Ridge near the Azores. Geochem. Geophys. Geosyst. 5:Q01E16.
Asimow, P. D., and Langmuir, C. H. (2003). The importance of water to oceanic mantle melting regimes. Nature 421, 815–820. doi: 10.1038/nature01429
Aubaud, C., Hauri, E. H., and Hirschmann, M. M. (2004). Hydrogen partition coefficients between nominally anhydrous minerals and basaltic melts. Geophys. Res. Lett. 31:L20611.
Barth, A., Newcombe, M., Plank, T., Gonnermann, H., Hajimirza, S., Soto, G. J., et al. (2019). Magma decompression rate correlates with explosivity at basaltic volcanoes—Constraints from water diffusion in olivine. J. Volcanol. Geother. Res. 387:106664. doi: 10.1016/j.jvolgeores.2019.106664
Beattie, P. (1993). Olivine-melt and orthopyroxene-melt equilibria. Contrib. Mineral. Petrol. 115, 103–111. doi: 10.1007/bf00712982
Bell, D. R., Rossman, G. R., Maldener, J., Endisch, D., and Rauch, F. (2003). Hydroxide in olivine: a quantitative determination of the absolute amount and calibration of the IR spectrum. J. Geophys. Res. Solid Earth 108:2105.
Berry, A. J., Hermann, J., O’Neill, H. S. C., and Foran, G. J. (2005). Fingerprinting the water site in mantle olivine. Geology 33, 869–872. doi: 10.1130/G21759.1
Berry, A. J., O’Neill, H. S. C., Hermann, J., and Scott, D. R. (2007). The infrared signature of water associated with trivalent cations in olivine. Earth Planet. Sci. Lett. 261, 134–142. doi: 10.1016/j.epsl.2007.06.021
Blundy, J., and Cashman, K. (2001). Ascent-driven crystallisation of dacite magmas at Mount St Helens, 1980–1986. Contrib. Mineral. Petrol. 140, 631–650. doi: 10.1007/s004100000219
Blundy, J., Cashman, K., and Humphreys, M. (2006). Magma heating by decompression-driven crystallization beneath andesite volcanoes. Nature 443, 76–80. doi: 10.1038/nature05100
Blundy, J., Cashman, K. V., Rust, A., and Witham, F. (2010). A case for CO2-rich arc magmas. Earth Planet. Sci. Lett. 290, 289–301. doi: 10.1016/j.epsl.2009.12.013
Brugger, C. R., and Hammer, J. E. (2010). Crystal size distribution analysis of plagioclase in experimentally decompressed hydrous rhyodacite magma. Earth Planet. Sci. Lett. 300, 246–254. doi: 10.1016/j.epsl.2010.09.046
Caricchi, L., Sheldrake, T. E., and Blundy, J. (2018). Modulation of magmatic processes by CO2 flushing. Earth. Planet. Sci. Lett. 491, 160–171. doi: 10.1016/j.epsl.2018.03.042
Carmichael, I. S. E. (2002). The andesite aqueduct: perspectives on the evolution of intermediate magmatism in west-central (105-99°W) Mexico. Contrib. Mineral. Petrol. 143, 641–663. doi: 10.1007/s00410-002-0370-9
Cassidy, M., Manga, M., Cashman, K., and Bachmann, O. (2018). Controls on explosive-effusive volcanic eruption styles. Nat. Commun. 9:2839. doi: 10.1038/s41467-018-05293-3
Castro, J. M., and Dingwell, D. B. (2009). Rapid ascent of rhyolitic magma at Chaitén volcano, Chile. Nature 461, 780–783. doi: 10.1038/nature08458
Chen, Y., Provost, A., Schiano, P., and Cluzel, N. (2011). The rate of water loss from olivine-hosted melt inclusions. Contrib. Mineral Petrol. 162, 625–636. doi: 10.1007/s00410-011-0616-5
Chen, Y., Provost, A., Schiano, P., and Cluzel, N. (2013). Magma ascent rate and initial water concentration inferred from diffusive water loss from olivine-hosted melt inclusions. Contrib. Mineral. Petrol. 165, 525–541. doi: 10.1007/s00410-012-0821-x
Chen, Y., and Zhang, Y. (2008). Olivine dissolution in basaltic melt. Geochim. Cosmochim. Acta 72, 4756–4777. doi: 10.1016/j.gca.2008.07.014
Coogan, L. A., Saunders, A. D., and Wilson, R. N. (2014). Aluminum-in-olivine thermometry of primitive basalts: evidence of an anomalously hot mantle source for large igneous provinces. Chem. Geol. 368, 1–10. doi: 10.1016/j.chemgeo.2014.01.004
Cottrell, E., Spiegelman, M., and Langmuir, C. H. (2002). Consequences of diffusive reequilibration for the interpretation of melt inclusions. Geochem. Geophys. Geosyst. 3, 1–26. doi: 10.1029/2001GC000205
Danyushevsky, L. V., McNeill, A. W., and Sobolev, A. V. (2002). Experimental and petrological studies of melt inclusions in phenocrysts from mantle-derived magmas: an overview of techniques, advantages and complications. Chem. Geol. 183, 5–24. doi: 10.1016/s0009-2541(01)00369-2
Danyushevsky, L. V., and Plechov, P. (2011). Petrolog3: integrated software for modeling crystallization processes. Geochem. Geophys. Geosyst. 12, 1–32. doi: 10.1029/2011GC003516
deGraffenried, R., and Shea, T. (2019). “How robust are our assumptions in using crystal-hosted melt embayments to estimate magma ascent rate?,” in Proceddings of the AGU 2019 Fall Meeting, San Francisco, CA.
Demouchy, S., Jacobsen, S. D., Gaillard, F., and Stem, C. R. (2006). Rapid magma ascent recorded by water diffusion profiles in mantle olivine. Geology 34, 429–432. doi: 10.1130/G22386.1
Demouchy, S., and Mackwell, S. (2006). Mechanisms of hydrogen incorporation and diffusion in iron-bearing olivine. Phys. Chem. Minerals 33, 347–355. doi: 10.1007/s00269-006-0081-2
Ferguson, D. J., Gonnermann, H. M., Ruprecht, P., Plank, T., Hauri, E. H., Houghton, B. F., et al. (2016). Magma decompression rates during explosive eruptions of Kîlauea volcano, Hawaii, recorded by melt embayments. Bull. Volcanol. 78:71. doi: 10.1007/s00445-016-1064-x
Ferriss, E., Plank, T., Newcombe, M., Walker, D., and Hauri, E. (2018). Rates of dehydration of olivines from San Carlos and Kilauea Iki. Geochim. Cosmochim. Acta 242, 165–190. doi: 10.1016/j.gca.2018.08.050
Ferriss, E., Plank, T., Walker, D., and Nettles, M. (2015). The whole-block approach to measuring hydrogen diffusivity in nominally anhydrous minerals. Am. Mineral. 100, 837–851. doi: 10.2138/am-2015-4947
Ford, C. E., Russell, D. G., Craven, J. A., and Fisk, M. R. (1983). Olivine-liquid equilibria: temperature, pressure and composition dependence of the crystal/liquid cation partition coefficients for Mg, Fe2+, Ca and Mn. J. Petrol. 24, 256–266. doi: 10.1093/petrology/24.3.256
Gaetani, G. A., O’Leary, J. A., Shimizu, N., Bucholz, C. E., and Newville, M. (2012). Rapid reequilibration of H 2O and oxygen fugacity in olivine-hosted melt inclusions. Geology 40, 915–918. doi: 10.1130/G32992.1
Ghiorso, M. S., and Gualda, G. A. R. (2015). An H 2 O–CO 2 mixed fluid saturation model compatible with rhyolite-MELTS. Contrib. Mineral. Petrol. 169, 1–30.
Gonnermann, H. M., and Manga, M. (2005). Nonequilibrium magma degassing: Results from modeling of the ca. 1340 A.D. eruption of Mono Craters, California. Earth Planet. Sci. Lett. 238, 1–16. doi: 10.1016/j.epsl.2005.07.021
Gonnermann, H. M., and Manga, M. (2007). The fluid mechanics inside a volcano. Ann. Rev. Fluid Mech. 39, 321–356. doi: 10.1146/annurev.fluid.39.050905.110207
Gonnermann, H. M., and Manga, M. (2013). “Dynamics of magma ascent in the volcanic conduit: modeling volcanic processes,” in The Physics and Mathematics of Volcanism, eds S. A. Fagents, T. K. P. Gregg, and R. M. Lopes (Cambridge: Cambridge University Press), 55–84. doi: 10.1017/CBO9781139021562.004
Grant, K. J., Kohn, S. C., and Brooker, R. A. (2007). The partitioning of water between olivine, orthopyroxene and melt synthesised in the system albite–forsterite–H2O. Earth Planet. Sci. Lett. 260, 227–241. doi: 10.1016/j.epsl.2007.05.032
Grove, T. L., Chatterjee, N., Parman, S. W., and Médard, E. (2006). The influence of H2O on mantle wedge melting. Earth Planet. Sci. Lett. 249, 74–89. doi: 10.1016/j.epsl.2006.06.043
Hauri, E. (2002). SIMS analysis of volatiles in silicate glasses, 2: isotopes and abundances in Hawaiian melt inclusions. Chem. Geol. 183, 115–141. doi: 10.1016/S0009-2541(01)00374-6
Hauri, E. H., Gaetani, G. A., and Green, T. H. (2006). Partitioning of water during melting of the Earth’s upper mantle at H2O-undersaturated conditions. Earth Planet. Sci. Lett. 248, 715–734. doi: 10.1016/J.EPSL.2006.06.014
Hirschmann, M. M. (2006). Water, melting, and the deep Earth H2O cycle. Annu. Rev. Earth Planet. Sci. 34, 629–653. doi: 10.1146/annurev.earth.34.031405.125211
Hirschmann, M. M., Tenner, T., Aubaud, C., and Withers, A. C. (2009). Dehydration melting of nominally anhydrous mantle: the primacy of partitioning. Phys. Earth Planet. Interiors 176, 54–68. doi: 10.1016/j.pepi.2009.04.001
Holloway, J. R. (1976). Fluids in the evolution of granitic magmas: consequences of finite CO2 solubility. Geol. Soc. Am. Bull. 87, 1513–1518. doi: 10.1130/0016-7606(1976)87<1513:fiteog>2.0.co;2
Humphreys, M. C. S., Edmonds, M., and Klöcking, M. S. (2016). The validity of plagioclase-melt geothermometry for degassing-driven magma crystallization. Am. Mineral. 101, 769–779. doi: 10.2138/am-2016-5314
Humphreys, M. C. S., Menand, T., Blundy, J. D., and Klimm, K. (2008). Magma ascent rates in explosive eruptions: constraints from H 2O diffusion in melt inclusions. Earth Planet. Sci. Lett. 270, 25–40. doi: 10.1016/j.epsl.2008.02.041
Ingrin, J., and Blanchard, M. (2006). Diffusion of hydrogen in minerals. Rev. Mineral. Geochem. 62, 291–320. doi: 10.2138/rmg.2006.62.13
Johnson, E. A., and Rossman, G. R. (2013). The diffusion behavior of hydrogen in plagioclase feldspar at 800–1000 °C: implications for re-equilibration of hydroxyl in volcanic phenocrysts. Am. Mineral. 98, 1779–1787. doi: 10.2138/am.2013.4521
Jollands, M. C., Kempf, E., Hermann, J., and Müntener, O. (2019). Coupled inter-site reaction and diffusion: rapid dehydrogenation of silicon vacancies in natural olivine. Geochim. Cosmochim. Acta 262, 220–242. doi: 10.1016/j.gca.2019.07.025
Kamenetsky, V. S., Eggins, S. M., Crawford, A. J., Green, D. H., Gasparon, M., and Falloon, T. J. (1998). Calcic melt inclusions in primitive olivine at 43° N MAR: evidence for melt–rock reaction/melting involving clinopyroxene-rich lithologies during MORB generation. Earth Planet. Sci. Lett. 160, 115–132. doi: 10.1016/s0012-821x(98)00090-9
Kelley, K. A., Plank, T., Newman, S., Stolper, E. M., Grove, T. L., Parman, S., et al. (2010). Mantle melting as a function of water content beneath the Mariana Arc. J. Petrol. 51, 1711–1738. doi: 10.1093/petrology/egq036
Kent, A. J. R. (2008). Melt inclusions in basaltic and related volcanic rocks. Rev. Mineral. Geochem. 69, 273–331. doi: 10.2138/rmg.2008.69.8
Koga, K., Hauri, E., Hirschmann, M., and Bell, D. (2003). Hydrogen concentration analyses using SIMS and FTIR: comparison and calibration for nominally anhydrous minerals. Geochem. Geophys. Geosyst. 4:1019.
Kohlstedt, D. L., and Mackwell, S. J. (1998). Diffusion of hydrogen and intrinsic point defects in olivine. Z. Phys. Chem. 207, 147–162. doi: 10.1524/zpch.1998.207.Part_1_2.147
Koleszar, A. M., Saal, A. E., Hauri, E. H., Nagle, A. N., Liang, Y., and Kurz, M. D. (2009). The volatile contents of the Galapagos plume; evidence for H2O and F open system behavior in melt inclusions. Earth Planet. Sci. Lett. 287, 442–452. doi: 10.1016/j.epsl.2009.08.029
Krawczynski, M. J., Grove, T. L., and Behrens, H. (2012). Amphibole stability in primitive arc magmas: effects of temperature, H 2O content, and oxygen fugacity. Contrib. Mineral. Petrol. 164, 317–339. doi: 10.1007/s00410-012-0740-x
Le Voyer, M., Asimow, P. D., Mosenfelder, J. L., Guan, Y., Wallace, P., Schiano, P., et al. (2014). Zonation of H2O and F concentrations around melt inclusions in olivines. J. Petrol. 55, 685–707. doi: 10.1093/petrology/egu003
Liu, Y., Anderson, A. T., and Wilson, C. J. N. (2007). Melt pockets in phenocrysts and decompression rates of silicic magmas before fragmentation. J. Geophys. Res. Solid Earth 112:B06204.
Lloyd, A. S., Plank, T., Ruprecht, P., Hauri, E. H., and Rose, W. (2013). Volatile loss from melt inclusions in pyroclasts of differing sizes. Contrib. Mineral. Petrol. 165, 129–153. doi: 10.1007/s00410-012-0800-2
Lloyd, A. S., Ruprecht, P., Hauri, E. H., Rose, W., Gonnermann, H. M., and Plank, T. (2014). NanoSIMS results from olivine-hosted melt embayments: Magma ascent rate during explosive basaltic eruptions. J. Volcanol. Geotherm. Res. 283, 1–18. doi: 10.1016/j.jvolgeores.2014.06.002
Mackwell, S. (2012). Melt inclusions in olivine: reliable witnesses to Earth’s interior? Geology 40, 959–960. doi: 10.1130/focus102012.1
Mackwell, S. J., and Kohlstedt, D. L. (1990). Diffusion of hydrogen in olivine: implications for water in the mantle. J. Geophys. Res. Solid Earth 95, 5079–5088. doi: 10.1029/jb095ib04p05079
Mallmann, G., and O’Neill, H. S. C. (2013). Calibration of an empirical thermometer and oxybarometer based on the partitioning of Sc, Y and V between olivine and silicate melt. J. Petrol. 54, 933–949. doi: 10.1093/petrology/egt001
Médard, E., and Grove, T. L. (2008). The effect of H 2 O on the olivine liquidus of basaltic melts: experiments and thermodynamic models. Contrib. Mineral. Petrol. 155, 417–432. doi: 10.1007/s00410-007-0250-4
Mironov, N., Tobelko, D. P., Smirnov, S. Z., Portnyagin, M. V., and Krasheninnikov, S. P. (2020). Estimation of CO2 content in the gas phase of melt inclusions using Raman spectroscopy: Case study of inclusions in olivine from the Karymsky volcano (Kamchatka). Russ. Geol. Geophys. 51, 600–610. doi: 10.15372/rgg2019169
Mironov, N., Portnyagin, M., Botcharnikov, R., Gurenko, A., and Hoernle, K., and Holtz, F. (2015). Quantification of the CO2 budget and H2O-CO2 systematics in subduction-zone magmas through the experimental hydration of melt inclusions in olivine at high H2O pressure. Earth Planet Sci. Lett. 425, 1–11. doi: 10.1016/j.epsl.2015.05.043
Mosenfelder, J. L., Le Voyer, M., Rossman, G. R., Guan, Y., Bell, D. R., Asimow, P. D., et al. (2011). Analysis of hydrogen in olivine by SIMS: evaluation of standards and protocol. Am. Mineral. 96, 1725–1741. doi: 10.2138/am.2011.3810
Moussallam, Y., Rose-Koga, E. F., Koga, K. T., Médard, E., Bani, P., Devidal, J.-L., et al. (2019). Fast ascent rate during the 2017–2018 Plinian eruption of Ambae (Aoba) volcano: a petrological investigation. Contrib. Mineral. Petrol. 174:90. doi: 10.1007/s00410-019-1625-z
Myers, M. L., Wallace, P. J., and Wilson, C. J. N. (2019). Inferring magma ascent timescales and reconstructing conduit processes in explosive rhyolitic eruptions using diffusive losses of hydrogen from melt inclusions. J. Volcanol. Geotherm. Res. 369, 95–112. doi: 10.1016/j.jvolgeores.2018.11.009
Neave, D. A., Hartley, M. E., Maclennan, J., Edmonds, M., and Thordarson, T. (2017). Volatile and light lithophile elements in high-anorthite plagioclase-hosted melt inclusions from Iceland. Geochim. Cosmochim. Acta 205, 100–118. doi: 10.1016/j.gca.2017.02.009
Newcombe, M. E., Fabbrizio, A., Zhang, Y., Ma, C., Le Voyer, M., Guan, Y., et al. (2014). Chemical zonation in olivine-hosted melt inclusions. Contrib. Mineral. Petrol. 168:1030. doi: 10.1007/s00410-014-1030-6
Newcombe, M. E., Plank, T., Barth, A., Asimow, P., and Hauri, E. (2020a). Water-in-olivine magma ascent chronometry: every crystal is a clock. J. Volcanol. Geotherm. Res. 398:106872. doi: 10.1016/j.jvolgeores.2020.106872
Newcombe, M. E., Plank, T. A., Zhang, Y., Holycross, M., Barth, A., Lloyd, A. S., et al. (2020b). Magma pressure-temperature-time paths during mafic explosive eruptions. Front. Earth Sci. 8:531911. doi: 10.3389/feart.2020.531911
Newman, S., and Lowenstern, J. B. (2002). Volatile Calc: a silicate melt – H2O – CO2 solution model written in visual basic for excel. Comput. Geosci. 28, 597–604. doi: 10.1016/S0098-3004(01)00081-4
Padrón-Navarta, J. A., Hermann, J., and O’Neill, H. S. C. (2014). Site-specific hydrogen diffusion rates in forsterite. Earth Planet. Sci. Lett. 392, 100–112. doi: 10.1016/j.epsl.2014.01.055
Parfitt, E. A., Wilson, L., and Neal, C. A. (1995). Factors influencing the height of Hawaiian lava fountains: implications for the use of fountain height as an indicator of magma gas content. Bull. Volcanol. 57, 440–450. doi: 10.1007/BF00300988
Parman, S. W., Grove, T. L., Kelley, K. A., and Plank, T. (2011). Along-arc variations in the pre-eruptive H2O contents of mariana arc magmas inferred from fractionation paths. J. Petrol. 52, 257–278. doi: 10.1093/petrology/egq079
Pichavant, M., Di Carlo, I., Rotolo, S. G., Scaillet, B., Burgisser, A., Le Gall, N., et al. (2013). Generation of CO2-rich melts during basalt magma ascent and degassing. Contrib. Mineral. Petrol. 166, 545–561. doi: 10.1007/s00410-013-0890-5
Pistone, M., Blundy, J., and Brooker, R. A. (2017). Water transfer during magma mixing events: Insights into crystal mush rejuvenation and melt extraction processes. Am. Mineral. 102, 766–776. doi: 10.2138/am-2017-5793
Plank, T., Kelley, K. A., Zimmer, M. M., Hauri, E. H., and Wallace, P. J. (2013). Why do mafic arc magmas contain∼ 4 wt% water on average? Earth Planet. Sci. Lett. 364, 168–179. doi: 10.1016/j.epsl.2012.11.044
Plechova, A. A., Portnyagin, M. V., and Bazanova, L. I. (2011). The origin and evolution of the parental magmas of frontal volcanoes in Kamchatka: evidence from magmatic inclusions in olivine from Zhupanovsky volcano. Geochem. Int. 49, 743–767. doi: 10.1134/S0016702911080064
Portnyagin, M., Almeev, R., Matveev, S., and Holtz, F. (2008). Experimental evidence for rapid water exchange between melt inclusions in olivine and host magma. Earth Planet. Sci. Lett. 272, 541–552. doi: 10.1016/j.epsl.2008.05.020
Portnyagin, M., Hoernle, K., Plechov, P., Mironov, N., and Khubunaya, S. (2007). Constraints on mantle melting and composition and nature of slab components in volcanic arcs from volatiles (H2O, S, Cl, F) and trace elements in melt inclusions from the Kamchatka Arc. Earth Planet. Sci. Lett. 255, 53–69. doi: 10.1016/j.epsl.2006.12.005
Portnyagin, M., Mironov, N., Botcharnikov, R., Gurenko, A., Almeev, R. R., Luft, C., et al. (2019). Dehydration of melt inclusions in olivine and implications for the origin of silica-undersaturated island-arc melts. Earth Planet. Sci. Lett. 517, 95–105. doi: 10.1016/j.epsl.2019.04.021
Portnyagin, M. V., Hoernle, K., and Mironov, N. L. (2014). Contrasting compositional trends of rocks and olivine-hosted melt inclusions from Cerro Negro volcano (Central America): implications for decompression-driven fractionation of hydrous magmas. Int. J. Earth Sci. 103, 1963–1982. doi: 10.1007/s00531-012-0810-3
Putirka, K. D. (2008). Thermometers and barometers for volcanic systems. Rev. Mineral. Geochem. 69, 61–120. doi: 10.1515/9781501508486-004
Qin, Z., Lu, F., and Anderson, A. T. (1992). Diffusive reequilibration of melt and fluid inclusions. Am. Mineral. 77, 565–576.
Rasmussen, D. J., Plank, T. A., Roman, D. C., and Zimmer, M. M. (2018). “Magmatic water content controls magma storage depth,” in Proceedings of the American Geophysical Union, Fall Meeting 2018 (San Francisco, CA).
Roeder, P. L., and Emslie, R. F. (1970). Olivine-liquid equilibrium. Contrib. Mineral. Petrol. 29, 275–289. doi: 10.1007/bf00371276
Roggensack, K. (2001). Unraveling the 1974 eruption of Fuego volcano (Guatemala) with small crystals and their young melt inclusions. Geology 29, 911–914. doi: 10.1130/0091-7613(2001)029<0911:uteofv>2.0.co;2
Rose-Koga, E., Bouvier, A.-S., Gaetani, G., Wallace, P. J., Allison, C. M., Andrys, J. A., et al. (2021). Silicate melt inclusions in the new millennium: a review of recommended practices for preparation, analysis, and data presentation. Chem. Geol. 570:120145.
Ruprecht, P., and Bachmann, O. (2010). Pre-eruptive reheating during magma mixing at Quizapu volcano and the implications for the explosiveness of silicic arc volcanoes. Geology 38, 919–922. doi: 10.1130/g31110.1
Ruprecht, P., and Plank, T. (2013)., Feeding andesitic eruptions with a high-speed connection from the mantle. Nature 500, 68–72. doi: 10.1038/nature12342
Ruth, D. C. S., Costa, F., Bouvet de Maisonneuve, C., Franco, L., Cortés, J. A., and Calder, E. S. (2018). Crystal and melt inclusion timescales reveal the evolution of magma migration before eruption. Nat. Commun. 9:2657. doi: 10.1038/s41467-018-05086-8
Ruth, D. C. S., Cottrell, E., Cortés, J. A., Kelley, K. A., and Calder, E. S. (2016). From passive degassing to violent Strombolian eruption: the case of the 2008 eruption of Llaima volcano. Chile. J. Petrol. 57, 1833–1864.
Sable, J. E., Houghton, B. F., Del Carlo, P., and Coltelli, M. (2006). Changing conditions of magma ascent and fragmentation during the Etna 122 BC basaltic Plinian eruption: evidence from clast microtextures. J. Volcanol. Geotherm. Res. 158, 333–354. doi: 10.1016/J.JVOLGEORES.2006.07.006
Sadofsky, S. J., Portnyagin, M., Hoernle, K., and van den Bogaard, P. (2008). Subduction cycling of volatiles and trace elements through the Central American volcanic arc: evidence from melt inclusions. Contrib. Mineral. Petrol. 155, 433–456. doi: 10.1007/s00410-007-0251-3
Schiano, P. (2003). Primitive mantle magmas recorded as silicate melt inclusions in igneous minerals. Earth Sci. Rev. 63, 121–144. doi: 10.1016/s0012-8252(03)00034-5
Sisson, T. W., and Grove, T. L. (1993b). Temperatures and H2O contents of low-MgO high-alumina basalts. Contrib. Mineral. Petrol. 113, 167–184. doi: 10.1007/BF00283226
Sisson, T. W., and Grove, T. L. (1993a). Experimental investigations of the role of H 2 O in calc-alkaline differentiation and subduction zone magmatism. Contrib. Mineral. Petrol. 113, 143–166. doi: 10.1007/bf00283225
Sobolev, A. V., Asafov, E. V., Gurenko, A. A., Arndt, N. T., Batanova, V. G., Portnyagin, M. V., et al. (2016). Komatiites reveal a hydrous Archaean deep-mantle reservoir. Nature 531, 628–632. doi: 10.1038/nature17152
Su, Y., and Huber, C. (2017). The effect of nonlinear decompression history on H2O/CO2 vesiculation in rhyolitic magmas. J. Geophys. Res. Solid Earth 122, 2712–2723. doi: 10.1002/2016JB013812
Sugawara, T. (2000). Empirical relationships between temperature, pressure, and MgO content in olivine and pyroxene saturated liquid. J. Geophys. Res. Solid Earth 105, 8457–8472. doi: 10.1029/2000jb900010
Szramek, L., Gardner, J. E., and Larsen, J. (2006). Degassing and microlite crystallization of basaltic andesite magma erupting at Arenal Volcano, Costa Rica. J. Volcanol. Geotherm. Res. 157, 182–201. doi: 10.1016/j.jvolgeores.2006.03.039
Tenner, T. J., Hirschmann, M. M., Withers, A. C., and Hervig, R. L. (2009). Hydrogen partitioning between nominally anhydrous upper mantle minerals and melt between 3 and 5 GPa and applications to hydrous peridotite partial melting. Chem. Geol. 262, 42–56. doi: 10.1016/j.chemgeo.2008.12.006
Thoraval, C., and Demouchy, S. (2014). Numerical models of ionic diffusion in one and three dimensions: application to dehydration of mantle olivine. Phys. Chem. Minerals 41, 709–723. doi: 10.1007/s00269-014-0685-x
Tobelko, D. P., Portnyagin, M. V., Krasheninnikov, S. P., Grib, E. N., and Plechov, P. Y. (2019). Compositions and formation conditions of primitive magmas of the Karymsky volcanic center, Kamchatka: evidence from melt inclusions and trace-element thermobarometry. Petrology 27, 243–264.
Tollan, P. M. E., O’Neill, H. S. C., and Hermann, J. (2018). The role of trace elements in controlling H incorporation in San Carlos olivine. Contrib. Mineral. Petrol. 173:89.
Toramaru, A. (2006). BND (bubble number density) decompression rate meter for explosive volcanic eruptions. J. Volcanol. Geothermal Res. 154, 303–316. doi: 10.1016/j.jvolgeores.2006.03.027
Toramaru, A., Noguchi, S., and Oyoshihara, S., Tsune, A. (2008). MND (microlite number density) water exsolution rate meter. J. Volcanol. Geothermal Res. 175, 156–167. doi: 10.1016/j.jvolgeores.2008.03.035
Wallace, P. J. (2005). Volatiles in subduction zone magmas: concentrations and fluxes based on melt inclusion and volcanic gas data. J. Volcanol. Geotherm. Res. 140, 217–240.
Wallace, P. J., and Anderson, A. T. (1998). Effects of eruption and lava drainback on the H2O contents of basaltic magmas at Kilauea Volcano. Bull. Volcanol. 59, 327–344. doi: 10.1007/s004450050195
Wallace, P. J., Plank, T., Bodnar, R. J., Gaetani, G. A., and Shea, T. (2021). Olivine-hosted melt inclusions: a microscopic perspective on a complex magmatic world. Ann. Rev. Earth Planet. Sci. 49. [preprint].
Walowski, K. J., Wallace, P. J., Hauri, E. H., Wada, I., and Clynne, M. A. (2015). Slab melting beneath the Cascade Arc driven by dehydration of altered oceanic peridotite. Nat. Geosci. 8, 404–408.
Wan, Z., Coogan, L. A., and Canil, D. (2008). Experimental calibration of aluminum partitioning between olivine and spinel as a geothermometer. Am. Mineral. 93, 1142–1147.
Waters, L. E., and Lange, R. A. (2015). An updated calibration of the plagioclase-liquid hygrometer-thermometer applicable to basalts through rhyolites. Am. Mineral. 100, 2172–2184. doi: 10.2138/am-2015-5232
Werner, C., Rasmussen, D. J., Plank, T., Kelly, P. J., Kern, C., Lopez, T., et al. (2020). Linking subsurface to surface using gas emission and melt inclusion data at Mount Cleveland volcano, Alaska. Geochem. Geophys. Geosyst. 21, e2019GC008882.
Wilson, L., and Head, J. W. (1981). Ascent and eruption of basaltic magma on the earth and moon. J. Geophys. Res. 86, 2971–3001. doi: 10.1029/JB086iB04p02971
Witham, F., Blundy, J., Kohn, S. C., Lesne, P., Dixon, J., Churakov, S. V., et al. (2012). SolEx: a model for mixed COHSCl-volatile solubilities and exsolved gas compositions in basalt. Comput. Geosci. 45, 87–97. doi: 10.1016/j.cageo.2011.09.021
Keywords: melt inclusion, water, diffusion, hygrometer, magma decompression rates, olivine
Citation: Barth A and Plank T (2021) The Ins and Outs of Water in Olivine-Hosted Melt Inclusions: Hygrometer vs. Speedometer. Front. Earth Sci. 9:614004. doi: 10.3389/feart.2021.614004
Received: 04 October 2020; Accepted: 21 April 2021;
Published: 08 June 2021.
Edited by:
Rosa Anna Corsaro, National Institute of Geophysics and Volcanology, Section of Catania, ItalyReviewed by:
Maxim Portnyagin, GEOMAR Helmholtz Center for Ocean Research Kiel, GermanyMichael Rowe, The University of Auckland, New Zealand
Copyright © 2021 Barth and Plank. This is an open-access article distributed under the terms of the Creative Commons Attribution License (CC BY). The use, distribution or reproduction in other forums is permitted, provided the original author(s) and the copyright owner(s) are credited and that the original publication in this journal is cited, in accordance with accepted academic practice. No use, distribution or reproduction is permitted which does not comply with these terms.
*Correspondence: Anna Barth, barthac@gmail.com