The Influence of Particle Concentration on the Formation of Settling-Driven Gravitational Instabilities at the Base of Volcanic Clouds
 Allan Fries1*
  Jonathan Lemus1,2
  Paul A. Jarvis1
  Amanda B. Clarke3,4
  Jeremy C. Phillips5
  Irene Manzella6
  Costanza Bonadonna1
- 1Department of Earth Sciences, University of Geneva, Geneva, Switzerland
- 2Department of Computer Science, University of Geneva, Geneva, Switzerland
- 3School of Earth and Space Exploration, Arizona State University, Tempe, AZ, United States
- 4Istituto Nazionale di Geofisica e Vulcanologia, Sezione di Pisa, Pisa, Italy
- 5School of Earth Sciences, University of Bristol, Bristol, United Kingdom
- 6School of Geography, Earth and Environmental Sciences, University of Plymouth, Plymouth, United Kingdom
Settling-driven gravitational instabilities observed at the base of volcanic ash clouds have the potential to play a substantial role in volcanic ash sedimentation. They originate from a narrow, gravitationally unstable region called a Particle Boundary Layer (PBL) that forms at the lower cloud-atmosphere interface and generates downward-moving ash fingers that enhance the ash sedimentation rate. We use scaled laboratory experiments in combination with particle imaging and Planar Laser Induced Fluorescence (PLIF) techniques to investigate the effect of particle concentration on PBL and finger formation. Results show that, as particles settle across an initial density interface and are incorporated within the dense underlying fluid, the PBL grows below the interface as a narrow region of small excess density. This detaches upon reaching a critical thickness, that scales with
Introduction
Many studies have highlighted that sedimentation from buoyant particle-laden currents (e.g., river plumes or volcanic ash clouds) is affected by collective settling mechanisms such as particle aggregation (Nicholas and Walling, 1996; Zimmermann-Timm, 2002; Costa et al., 2010; Durant and Brown, 2016) and settling-driven gravitational instabilities (Hoyal et al., 1999b; Parsons et al., 2001; Carazzo and Jellinek, 2012; Manzella et al., 2015). Both processes promote the scavenging of fine particles by increasing their fall velocities with respect to their individual settling rates. In particular, they can explain the fine-ash depletion observed in large volcanic clouds far from the source (Hoyal et al., 1999b; Carazzo and Jellinek, 2013; Durant, 2015; Gouhier et al., 2019). Many studies have already shown how particle aggregation can play a substantial role in enhancing fine ash sedimentation through the formation of clusters which might descend faster and closer to the vent than individual fine ash particles (Brown et al., 2012; Bagheri et al., 2016; Folch et al., 2016). However, less attention has been paid to settling-driven gravitational instabilities that can develop at the base of volcanic clouds and result in the formation of downward moving plumes, called ash fingers, within which fine ash particles fall faster than they do individually. Tephra dispersal and sedimentation can affect communities at multiple spatial and temporal scales (Jenkins et al., 2015; Bonadonna et al., 2021) including disruption to aviation (Guffanti et al., 2009; Prata and Tupper, 2009; Lechner et al., 2017), impact to public health (Horwell and Baxter, 2006; Gudmundsson, 2011) and damage to both residential buildings and critical infrastructures (Spence et al., 2005; Wilson et al., 2012). Therefore, understanding the processes controlling tephra sedimentation, including settling-driven gravitational instabilities, is fundamental for developing more efficient ash dispersal models and better managing the associated risk (Scollo et al., 2008; Folch, 2012; Durant, 2015).
Settling-driven gravitational instabilities develop at the base of particle suspensions from density differences generated by particles settling across the interface and their incorporation into the underlying fluid (Figures 1A,B). The configuration is an initially stable density stratification with a buoyant particle suspension (e.g., volcanic ash cloud) emplaced above a slightly denser fluid (e.g., atmosphere). The region immediately below the density interface becomes denser than the underlying layer when particles settle through it, forming a heavy, interfacial Particle Boundary Layer (PBL) (Burns and Meiburg, 2012; Burns and Meiburg, 2015; Yu et al., 2013; Davarpanah Jazi and Wells, 2020). Once the system is unstable, the PBL detaches and particle-laden bulbous plumes (called fingers) sink and protrude into the lower layer (Hoyal et al., 1999b). These fingers descend rapidly, driving particle sedimentation at faster velocities and rates than individual particle settling. In this paper, we refer to this finger-producing mechanism as settling-driven gravitational instabilities, where fingers are identified as the downward moving particle-laden plumes. We define the PBL as the heavy particle-laden layer formed below the initial density interface by the inclusion of particles in the dense underlying fluid.
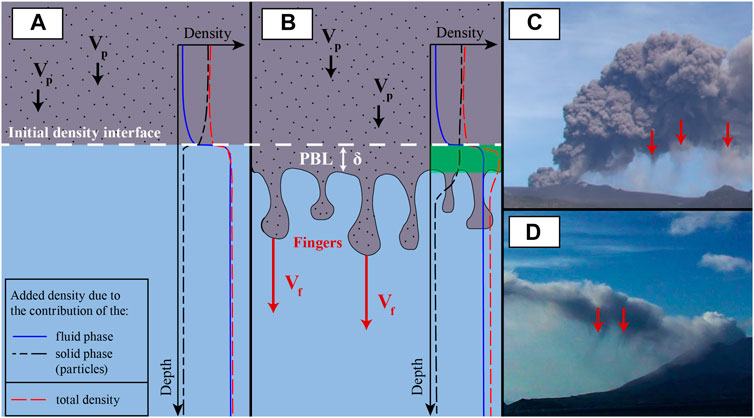
FIGURE 1. Schematic representation of the mechanism by which settling-driven gravitational instabilities arise. (A) The particle suspension (gray) initially overlies particle-free fluid (blue) and the density profile is stable. (B) Particles settle at their individual fall velocity (
Settling-driven gravitational instabilities can affect the sedimentation from buoyant flows that are associated with various natural systems including river (hypopycnal) plumes (Hoyal et al., 1999b; Maxworthy, 1999; Parsons et al., 2001; Henniger and Kleiser, 2012; Davarpanah Jazi and Wells, 2016; Sutherland et al., 2018; Davarpanah Jazi and Wells, 2020), magma chambers (Marsh, 1988), vertical tephra transport in oceans (Carey, 1997; Manville and Wilson, 2004; Jacobs et al., 2013; Jacobs et al., 2015) and volcanic clouds (Carazzo and Jellinek, 2012; Manzella et al., 2015; Scollo et al., 2017). Hence, several authors from different fields have investigated these instabilities through a combination of experiments, theoretical analyses and numerical simulations (Hoyal et al., 1999b; Cardoso and Zarrebini, 2001; Burns and Meiburg, 2012; Burns and Meiburg, 2015; Carazzo and Jellinek, 2012; Jacobs et al., 2013; Yu et al., 2013, 2014; Chou and Shao, 2016; Scollo et al., 2017). Whilst the instability mechanism here resembles the classical Rayleigh-Taylor instability which occurs when a dense fluid overlies a lighter one (Sharp, 1984; Linden and Redondo, 1991) the characteristics and dynamics differ in critical ways. A key difference is that this instability originates from the settling of particles out of the upper layer, forming a narrow region of excess density (the PBL). The interface between the upper layer and the PBL is gravitationally stable, which means that, unlike in classical Rayleigh-Taylor problems, the upper layer does not undergo overturning. Simultaneously, there is competition between the rate at which the PBL forms due to particle settling and the rate at which it is destroyed by gravitational instability within the lower layer. The finite-amplitude characteristics of the instability are therefore different.
In addition to particle settling, double diffusion, where two density-altering fluid properties diffuse at different rates, can also lead to the formation of an unstable interfacial region and associated fingers (Green, 1987; Chen, 1997; Hoyal et al., 1999a; Carazzo and Jellinek, 2013). A comparison between the diffusive and particle-settling fluxes allows differentiation between the two mechanisms (Green, 1987; Hoyal et al., 1999a; Carazzo and Jellinek, 2013); settling-driven gravitational instabilities can occur if the settling flux is greater than the diffusive flux. Both mechanisms are likely to coexist and to affect the sedimentation from volcanic clouds because of thermal diffusion and particle settling (Carazzo and Jellinek, 2013). However, in this paper, we focus on settling-driven gravitational instabilities which are more suitable for describing finger formation during the spreading of an ash cloud at neutral buoyancy, once it is thermally equilibrated with the atmosphere (Manzella et al., 2015; Scollo et al., 2017). As we will show in Experimental configuration, the particle flux into the PBL in our experiments is predominantly controlled by particle settling rather than double diffusion and we therefore only address gravitational instabilities arising because of particle settling across the interface.
Hoyal et al. (1999b) showed that the criterion for convection to start at the base of particle suspensions and for fingers to develop depends on the ratio between driving gravitational forces and resisting viscous forces as represented by the Grashof number
where
Another condition for the development of fingers due to settling-driven gravitational instabilities is that the particle-fluid mixture behaves as a continuum (Hoyal et al., 1999b). The particle and fluid motions can then be coupled through terms in their respective momentum equations (Harlow and Amsden, 1975; Valentine and Wohletz, 1989; Burgisser et al., 2005). In dilute mixtures, such as fingers, the degree of coupling can be assessed by calculating the Stokes and Sedimentation dimensionless numbers that quantify the relative strength of the forces the fluid and particles exert on each other (Crowe et al., 2011). For fingers to form, the coupling must be sufficiently strong for the finger velocity to be greater than the particle velocity. Carazzo and Jellinek (2012) showed that this last condition is met in numerous volcanic ash clouds, and effectively reduces to a dependence on particle size, with fine ash particles (diameter d < 100 μm) promoting finger formation. In a series of aqueous analogue experiments with both glass beads and natural ash, Scollo et al. (2017) found that particle concentration and size exerted a major control on the instability and that no fingers formed for particle diameters greater than approximately 125 µm. Larger particles instead settled individually, sufficiently decoupled from the fluid phase. Finally, their experiments revealed that the ash composition did not significantly change finger dynamics, suggesting that, for a given ash size distribution, fingers can form underneath plumes regardless of the magma composition.
Ash fingers associated with settling-driven gravitational instabilities have been observed in various volcanic eruptions, e.g., Mount Redoubt, USA, 1990 (Hobbs et al., 1991); Ruapehu, New Zealand, 1996 (Bonadonna et al., 2005); Soufrière Hills, Montserrat, 1997 (Bonadonna et al., 2002); Eyjafjallajökull, Iceland, 2010 (Bonadonna et al., 2011; Manzella et al., 2015; Figure 1C); Etna, Italy, 2013 (Andronico et al., 2015; Scollo et al., 2017); and Sakurajima, Japan, 2019 (Figure 1D). Their association with different eruptive styles suggests that settling-driven gravitational instabilities are a common, widespread phenomenon.
Despite these observations, quantitative field descriptions of ash fingers remain rare. During the 2010 Eyjafjallajökull eruption, Manzella et al. (2015) found the average downward finger velocity to be about 1 m s−1, which is greater than the calculated settling velocities of individual ash particles finer than 100 µm (
While previous studies have built the theoretical framework to assess the conditions necessary for the formation of settling-driven gravitational instabilities and focused mainly on the effect of the particle size, which is of primary importance, we only have limited insights into the effect of the particle concentration on the formation of settling-driven gravitational instabilities. We present new experiments, performed over a wide range of initial conditions, to investigate the velocity and size of fingers at different particle concentrations and compare our results with existing models on settling-driven gravitational instabilities (Hoyal et al., 1999b; Carazzo and Jellinek, 2012; Manzella et al., 2015). Additionally, we explore the potential of particle suspensions to develop fingers by introducing a new dimensionless number relating the suspension and characteristic PBL thicknesses. Despite significant progress in theoretical (Burns and Meiburg, 2012) and numerical (Burns and Meiburg, 2015) studies of the formation of settling-driven gravitational instabilities, uncertainties remain regarding the density configuration associated with the triggering of the instabilities. Although the presence of a heavy PBL below the particle suspension is widely accepted, the composition of the fluid phase and the particle concentration in this region remain poorly-described, despite their importance for the bulk density of the suspension and the dynamics of the resulting fingers. We have used Planar Laser Induced Fluorescence (PLIF; Koochesfahani, 1984; Crimaldi, 2008) to measure the spatial and temporal evolution of the fluid phase density, specifically focusing on the PBL and fingers. Whilst previous experiments have focused on the particle concentration and velocity fields, our PLIF measurements allow for a complete characterisation of the density configuration associated with the triggering of the instability. Once developed, settling-driven gravitational instabilities are thought to significantly increase the sedimentation rate below particle suspensions. We quantify the particle mass flux in the experiments at different particle concentrations. Experimental findings are finally discussed in relation to the sedimentation of fine ash from volcanic ash clouds.
Methods
Experimental Configuration
The experiments are performed in an experimental water tank 30.1 × 30.1 × 50.0 cm3 that is divided into two layers by a horizontal barrier (Manzella et al., 2015; Scollo et al., 2017; Figure 2;
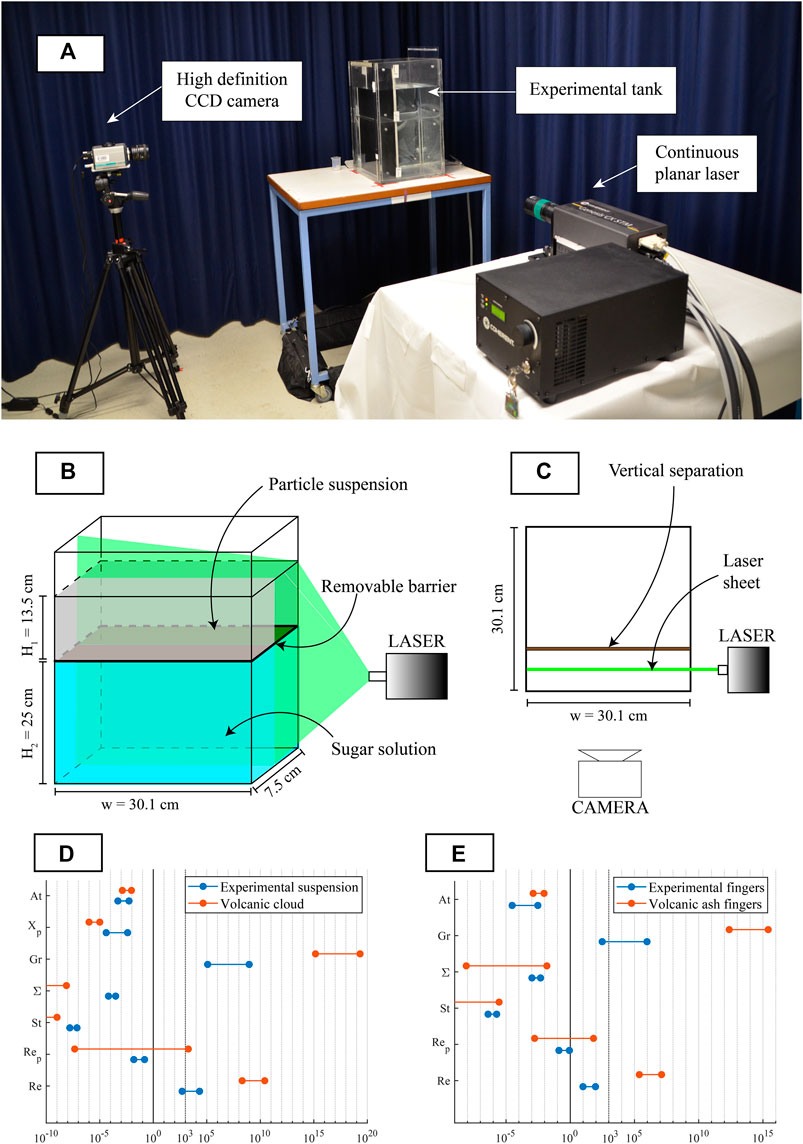
FIGURE 2. (A) Experimental apparatus (B) Schematic of the tank configuration before barrier removal. The upper layer has a thickness
The particles are spherical glass beads, which are suitable for modeling the behaviour of natural ash (Manzella et al., 2015; Scollo et al., 2017). They have a median diameter
Particles are kept in suspension by continuously mixing the upper layer top to bottom for 20–25 s with an agitator composed of a 23 × 7 cm2 millimetric mesh, that is large enough to mix the entire upper layer and produce homogeneous and repeatable mixing. Mixing is stopped 5 s before the experiment begins. The separation between the two layers is then removed manually by sliding the barrier out of its slot in 0.9–1.3 s. A major challenge of this experimental configuration is that mixing is generated across the density interface when removing the barrier and is clearly visible in the first 10 s of the experiments, affecting the early development of settling-driven gravitational instabilities. The perturbation is particularly strong near the back wall of the tank, so we reduced the length of the tank to 7.5 cm with rigid vertical separators to attenuate the effect of the vorticity (Manzella et al., 2015; Scollo et al., 2017). After barrier removal, particles start settling into the lower partition of the tank (see Supplementary Video S1). A continuous Nd:YAG planar laser (Genesis CX-SLM by Coherent) with a wavelength of 532 nm illuminates the experiments from the side of the tank and a sCMOS camera (HiSense Zyla by Dantec Dynamics), with 16 bit color depth, is used to capture images of the experiments at 10 Hz with image dimensions of 1,500 × 2,100 pixels, resulting in a resolution of 55 px mm−1. We find that the sugar concentration is sufficiently small that it has negligible effect on the light intensity received by the camera.
Gravitational instabilities in our setup can theoretically develop through two different mechanisms, double diffusion and particle settling (Hoyal et al., 1999a; Hoyal et al., 1999b; Burns and Meiburg, 2012). Double diffusive effects arise when two density-altering fluid properties (i.e., sugar and particles in the lower and the upper layers, respectively) diffuse at differential rates. The faster diffusion of one component relative to the other can lead to a local increase of the bulk density at the interface that triggers gravitational instabilities. The rate at which the bulk density increases in double-diffusive systems is therefore controlled by the diffusion of the fastest diffusing component. Conversely, settling-driven gravitational instabilities are generated by particles settling across the interface, causing the upper part of the lower layer (i.e., the PBL) to become heavier than the fluid below. Gravitational instabilities produced by particle settling are therefore controlled by both the vertical velocity of the particles and the initial particle concentration of the upper layer. We determine the mechanism that provokes the formation of instabilities in our experiments by calculating the ratio of the double diffusive and settling fluxes,
Replacing the fluxes by their expressions
Scaling of Experiments
Our experiments are dedicated to correctly reproducing the processes affecting ash sedimentation beneath volcanic clouds in a small, simplified configuration. The difference in complexity and scale between the natural phenomenon and small-scale experiments raises the problem of the applicability of the analogue experimental results. To address this, we perform a scaling analysis (Burgisser and Bergantz, 2002; Burgisser et al., 2005; Carazzo and Jellinek, 2012; Kavanagh et al., 2018; Roche and Carazzo, 2019). Dimensionless numbers relevant to our problem are calculated for volcanic ash clouds and compared with particle suspensions (Figure 2D). We also compare the dynamical regimes of natural ash and experimental fingers based on dimensionless numbers (Figure 2E). The values of the parameters associated with volcanic clouds and fingers are obtained from the literature (Table 1; Burgisser et al., 2005; Carazzo and Jellinek, 2012; Manzella et al., 2015).
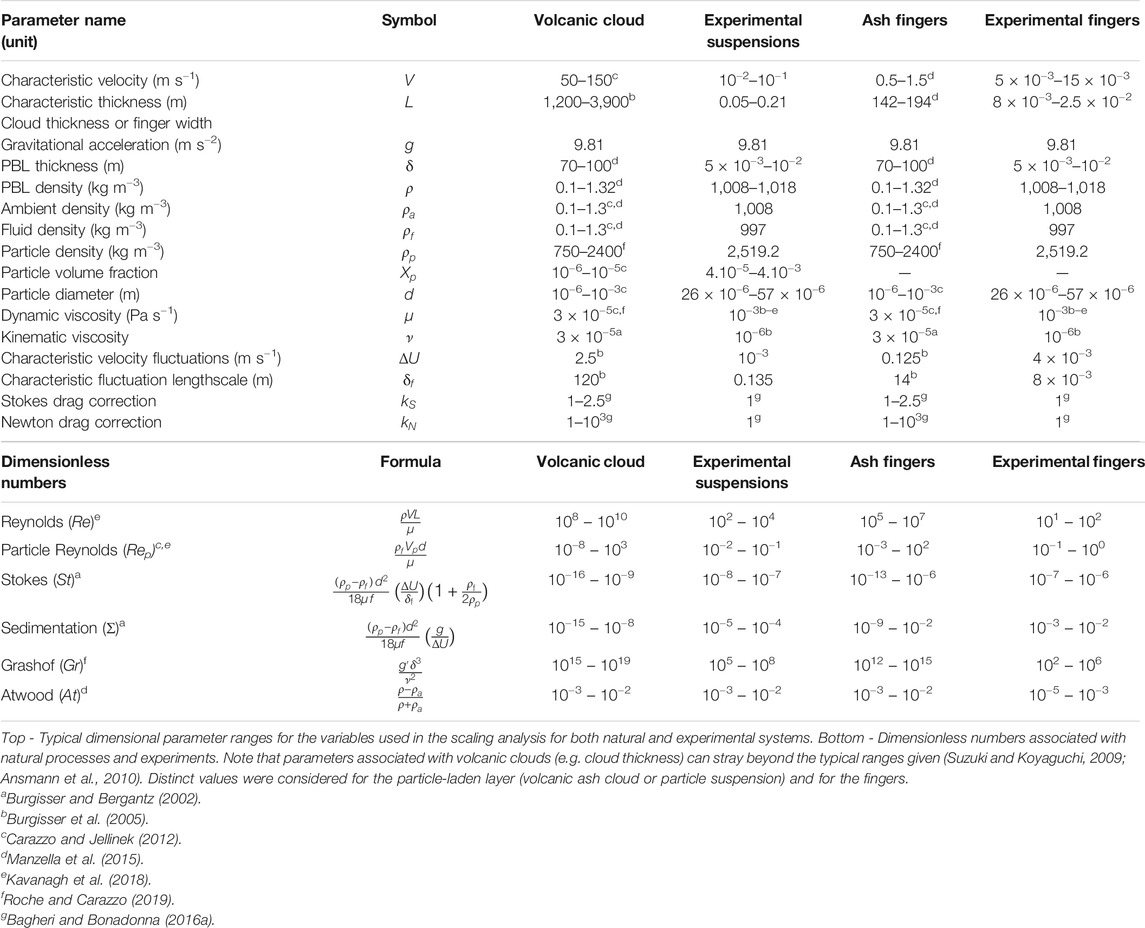
TABLE 1. Top - Typical dimensional parameter ranges for the variables used in the scaling analysis for both natural and experimental systems.
The Reynolds number
In situations involving particle settling in fluids, the particle Reynolds number
At subcritical
For multiphase flows involving particles, the Stokes
and
with
Previous studies have invoked a convective mechanism for finger formation whose initiation depends on the Grashof number
For scaling the density ratio between the particle-laden layer and the underlying fluid, we calculate the Atwood number
For settling-driven gravitational instabilities, the natural and experimental ranges of
Imaging Techniques
In order to independently obtain both the particle concentration
Particle Imaging
We developed a calibration that links the particle concentration
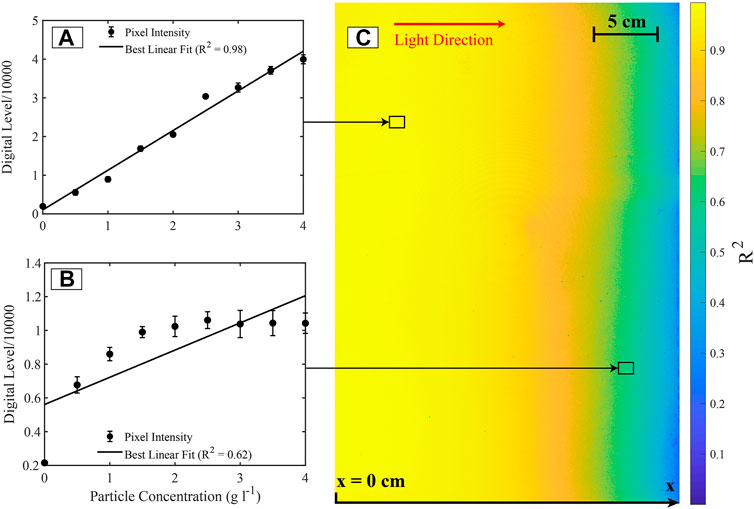
FIGURE 3. Calibration of the particle concentration for a laser power of 0.50 W. (A) Example of a linear relationship between particle concentration and the light intensity in one pixel. In this example, the coefficient of determination R2 suggests a very good linear fit. (B) Example of a pixel with a low-quality linear regression. Vertical error bars in panels A and C represent the standard deviation of the averaged pixel digital level over 10 s. (C) Map of R2 inside the tank. R2 diminishes as a function of x (distance from the wall closest to the laser).
Fluid Phase Imaging
Understanding the behavior of the fluid phase associated with the occurrence of settling-driven gravitational instabilities is crucial to improving our general comprehension of the mechanisms driving the instability. In particular, it is important to quantify the contribution of the fluid phase on the generation of an unstable density profile associated with settling-driven gravitational instabilities. For this purpose, we applied the PLIF technique to a series of separate experiments. The PLIF approach yields quantitative, non-intrusive, measurements of fluid concentrations at high resolution (Koochesfahani, 1984; Crimaldi, 2008). It involves using a dye that generates fluorescence with an intensity linearly proportional to its concentration
During our PLIF experiments, the upper layer is doped with Rhodamine 6G (R6G), a fluorescent dye with an absorption peak at 530 nm (Zehentbauer et al., 2014), close to the laser wavelength (532 nm), for a maximum absorption efficiency. The emission spectrum of R6G ranges from 510 to 710 nm with a peak at 560–580 nm, depending on the solvent (Zehentbauer et al., 2014). We isolate the R6G fluorescence from other light sources with a smaller wavelength (i.e., primary laser emission, particle scattering) by equipping the camera with a high-pass filter at 570 nm. This procedure allows us to image the R6G distribution only, as a proxy for the concentration of the upper fluid phase.
We perform a calibration in order to relate the local R6G dye concentration
in which
where
However, changing the particle concentration modifies the spatial intensity distribution because the particles have an attenuation effect on
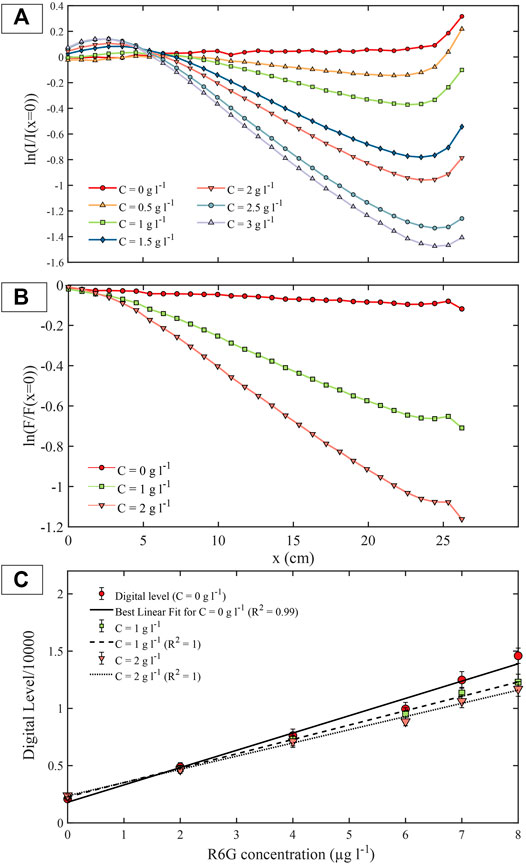
FIGURE 4. (A) Profile of light intensity
We conduct PLIF calibrations varying the particle and R6G concentration whilst keeping a constant laser power of 1.15 W. The water tank is filled with a uniform dye concentration ranging from 0 to 8 μg l−1 for three particle concentrations: 0, 1, and 2 g l−1. Calibration images are averaged over 10 s in order to erase short temporal variations in fluorescence intensity. For each pixel, we fit the digital level and the R6G concentration to Eq. 8 to determine
Experimental Conditions
We performed two types of experiments, with different objectives. Type A experiments are each repeated at least three times with the aim of separately characterising the fingers at different particle concentrations, and the density of the fluid phase (Table 2). In the first subset of type A experiments (A1–A10), we image the particles and vary the particle concentration from 1 to 10 g l−1. In the second subset of type A experiments (A11–12), we repeat the same experiments but instead measure fluid phase properties using the PLIF technique, only with particle concentrations of 1 and 2 g l−1. Type A experiments have a constant upper layer thickness of 13.5 cm and are imaged for 90 to 120 s after barrier removal.
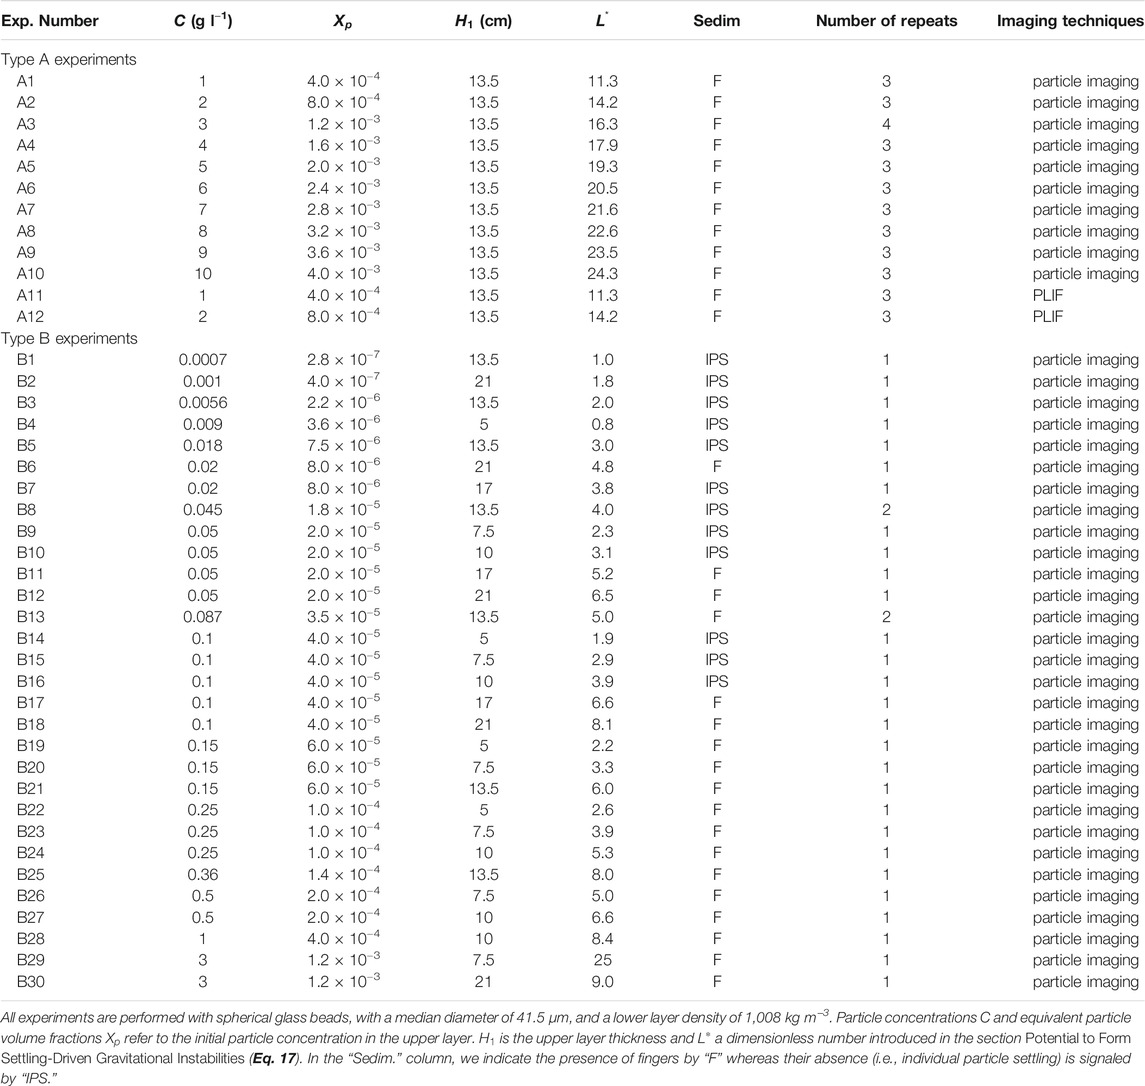
TABLE 2. List of experiments.
In type B experiments, we explore the conditions that favor the formation of settling-driven gravitational instabilities by varying both the upper layer thickness (from 5 to 21 cm) and the particle concentration (from 7
Analytical Procedure
For PLIF experiments (A11–12), we calculate the local concentration of upper fluid
where
with
For the PBL of density
Whilst PLIF experiments used to infer the fluid phase density involve only small particle concentrations of 1 and 2 g l−1, we additionally calculate the bulk density in experiments involving higher particle concentrations by estimating the fluid phase density from
Type A particle-imaging experiments (A1–10) are processed in order to quantify the effect of particle concentration on the dynamic and geometric properties of fingers. The finger velocity is obtained by manually tracking the front position (i.e., lowest position of the interface between the finger and the lower layer fluid) over time. We measure the PBL thickness throughout experiments using both visual observations and particle concentration profiles. At the lower boundary of the PBL there is an abrupt change in particle concentration that corresponds to the transition from the particle suspension to the particle-free lower layer. We therefore define the PBL base as the position where the vertical gradient of the particle concentration reaches its minimum value. Results show that the position of the lower PBL boundary (and therefore the PBL thickness) reaches a constant height after 10 to 20 s (Supplementary Figure S5), when the initial effect of barrier removal disappears. The PBL thickness is finally defined as the vertical separation between the initial density interface, represented by the barrier, and the lower PBL boundary (Figure 5). When fingers develop, they form distinct particle-rich columns that descend into the lower layer and are characterised by bright regions in the experiments. Along a horizontal transect crossed by fingers, the light intensity profile has a peak at each finger location (Supplementary Figure S6). We therefore determine the number of fingers by counting the most prominent peaks along a transect located 4 cm under the upper layer, where fingers are clearly developed. This counting procedure is sensitive to detection parameters such as the vertical position of the transect or threshold values for peak prominence, width, and separation. Therefore, in order to obtain repeatable results comparable to other studies, these parameters have been selected to reproduce manual finger detection (Scollo et al., 2017) within ±1 finger. In contrast to previous methods, this allows us to quantify the temporal evolution of the number of fingers throughout the experiment duration. We assess the finger spacing
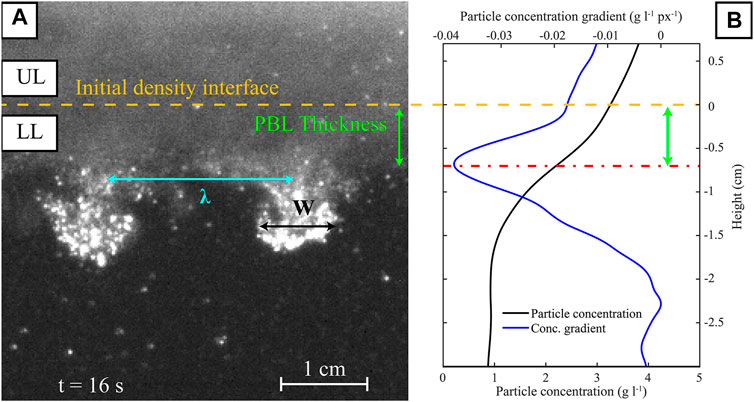
FIGURE 5. (A) Visualization of fingers’ geometrical properties for experiment A5 (5 g l−1) 16 s after removing the barrier. The yellow dashed line is located at the position of the initial density interface and separates the Upper Layer (UL) and the Lower Layer (LL). Green, black and blue arrows indicate the PBL thickness and finger width (
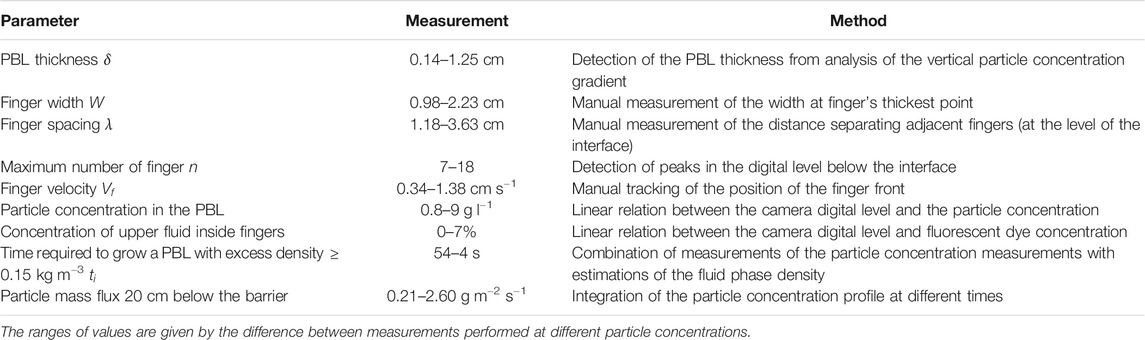
TABLE 3. Summary of the measurements performed in type A experiments.
Type B experiments are exclusively used to determine the presence or absence of fingers over a wider range of initial conditions than type A experiments. The presence of fingers is determined by visual identification of i) downward-moving particle-laden plumes, with columnar or bulbous shapes, that form at the initial density interface and inside which particles move faster than individually and ii) the tendency of fingers to initiate and maintain layer-scale convection in the lower partition of the tank (Hoyal et al., 1999b). We do not measure the evolution of particle concentration in type B experiments, for which the calibration presented in Particle Imaging. does not apply because of the low initial particle concentrations employed.
Results
Evolution of Particle Concentration and Mixture Density With Time: The Formation of the PBL
Particles are initially contained in the upper part of the tank and they start sedimenting through the initial density interface after barrier removal. Subsequently, the average particle concentration decreases over time in the upper layer whilst it increases in the lower layer. In all experiments, we observe that the particle concentration in the PBL does not exceed that of the upper layer. Horizontally averaging the particle concentration at each time, we obtain particle concentration profiles for experiments A1–10. Particle concentration profiles are then combined with fluid phase density profiles (Eq. 10) to approximate the bulk mixture density profile (Eq. 11).
Figure 6A shows the evolution of bulk mixture density with time for experiment A8 (8 g l−1; Table 2), chosen as an example since the relatively high particle concentration leads to a pronounced unstable density profile. Just after barrier removal (
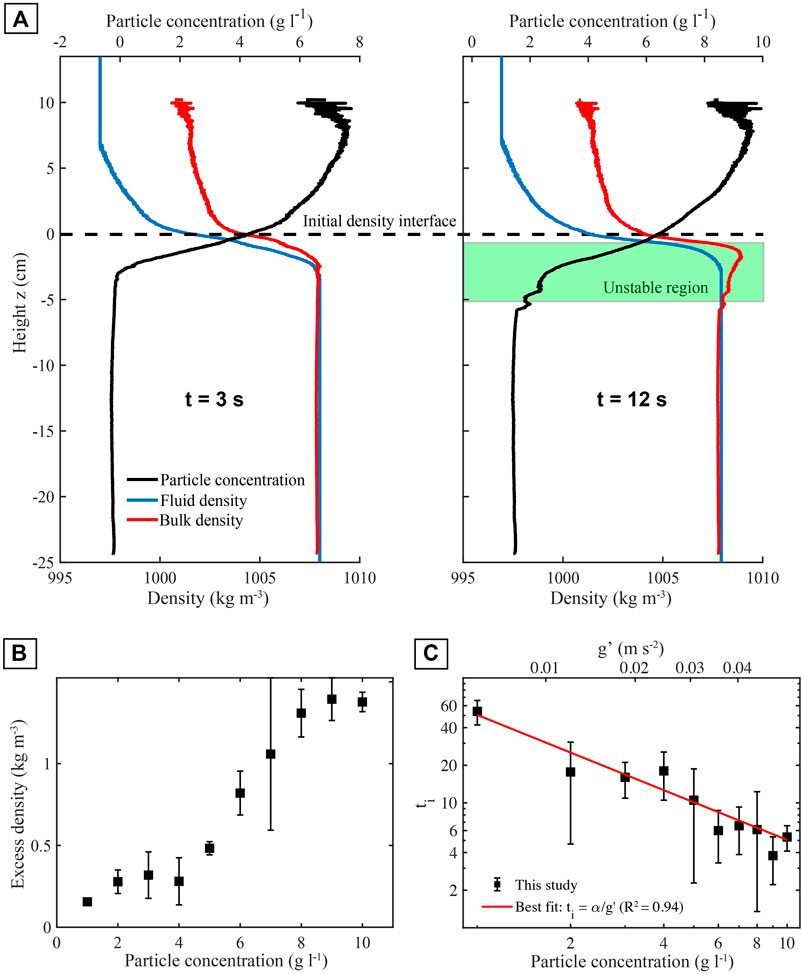
FIGURE 6. (A) Horizontally-averaged density and particle concentration profiles for experiment A8 (initial particle concentration is 8 g l−1; Table 2), with the fluid phase density in blue, the particle concentration in black (axis above) and the bulk mixture density in red. The initial barrier position is represented by the dashed lines. Initially, at
An initial increase in density in the region immediately below the initial interface is observed in all experiments. Figure 6B shows the maximum excess density (i.e., difference between the density of the unstable region and that of the lower layer) vs. initial upper layer particle concentration, for experiments A1–A10 (Table 2). The maximum excess density gradually increases from 0.15 kg m−3 for a particle concentration of 1 g l−1 to 1.4 g m−3 for a particle concentration of 10 g l−1.
The perturbation to the system caused by the barrier removal at the experiment onset prevents us identifying the timescale of growth of the PBL thickness, which is expected to be
Fluid Mixing Driven by Gravitational Instabilities and Entrainment Within Fingers
Unlike particles, the upper layer fluid phase is not significantly entrained inside the lower layer after barrier removal and fluid mixing between the upper and the lower layer is limited in proportion and vertical extent (Figure 7). However, we notice the development of a thin 2–3 cm mixing zone below the interface with intermediate concentrations of upper fluid (10–60%). This zone is affected by disturbances created by the initial barrier removal. Below this zone, the spatial distribution of the concentration of upper fluid shows that only small amounts of upper fluid are entrained within fingers. This entrained fluid appears as thin leaks of upper fluid [similar to those observed by Parsons et al. (2001)] with concentrations of upper fluid up to 6–7% (Figure 7B). Once entrained downward, portions of the upper layer are seen to buoyantly rise back up once fingers reach the bottom of the tank (Supplementary Videos S4, S5). On average, the concentration of upper fluid in the lower layer increases with time but remains low (<3%) (Figure 7C). There is an initially rapid increase at the start of the experiment due to the removal of the barrier. This is then followed by small oscillations that are linked with the thickening and retraction of the PBL at the location where fingers are formed. This thickening induces a perturbation of the lower density interface that results in an increase of the average concentration of upper fluid. The PBL later retracts to its initial position after detachment of the fingers, resulting in a decrease in the average concentration of upper fluid.
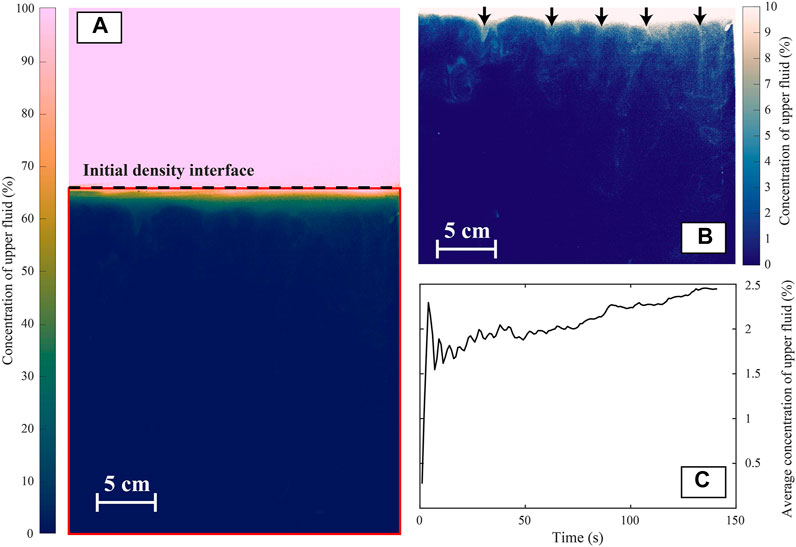
FIGURE 7. (A) Spatial distribution of upper fluid concentration 30 s after barrier removal in experiment A11 (1 g l−1). The black dashed line indicates the position of the initial density interface and the red rectangle the portion of the experiment considered to be the lower layer. (B) Concentration of upper fluid in the lower partition of the tank with an adjusted colormap to highlight regions of upper fluid entrainment within fingers. Black arrows show the location of leaks. (C) Average concentration of upper fluid in the lower layer. Oscillations in the signal at the beginning of the experiment are initially due to the removal of the barrier and then PBL detachment (see Supplementary Video S4). The uncertainty on the measurement is estimated to be 17%.
Effect of Particle Concentration on Finger Velocity, Number and Temporal Evolution
The average finger velocity increases with particle concentration (Figure 8), from 0.35 cm s−1 at
where
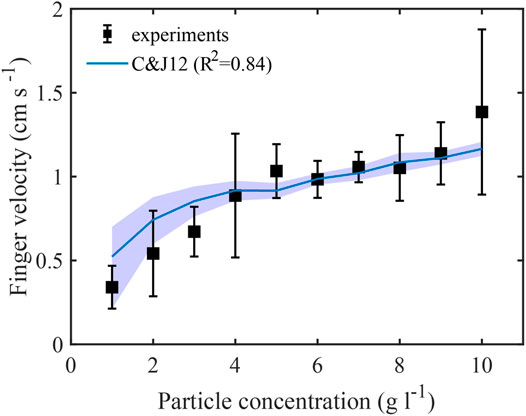
FIGURE 8. Finger velocity as a function of initial particle concentration. The blue line corresponds to the finger velocity calculated using Eq 13; Hoyal et al., 1999b; Carazzo and Jellinek 2012) in combination with Eq. 12 to obtain the reduced gravity of the PBL. The blue region corresponds to finger velocities calculated with upper fluid concentrations ranging from 0 (upper limit) to 7% (lower limit). Vertical error bars correspond to the standard deviation of the finger velocity measured in different experiments.
The evolution of the maximum number of fingers per unit width as a function of both particle concentration and time has been investigated (Figure 9). The number of fingers increases with particle concentration, with 0.25 fingers per cm formed on average at
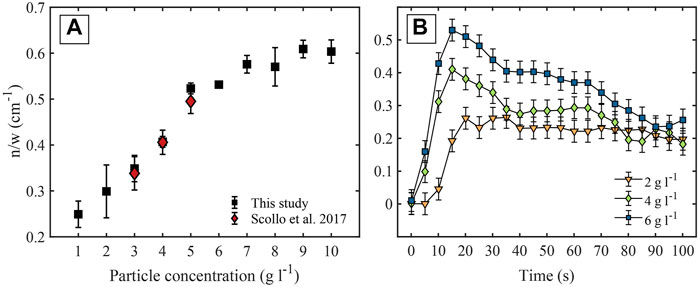
FIGURE 9. (A) Variation in the number of fingers per unit length (
Finger Length Scales in Experiments: PBL Thickness, Finger Width and Finger Spacing
As expected for such settling-driven gravitational instabilities (Hoyal et al., 1999b; Carazzo and Jellinek, 2012), all characteristic length scales, which we measure 10 to 20 s after removing the barrier, are related to each other by a proportionality coefficient. We find finger width and spacing to scale as approximately two and three times the thickness of the PBL, respectively (
Finger width and spacing should, therefore, scale similarly. Taking
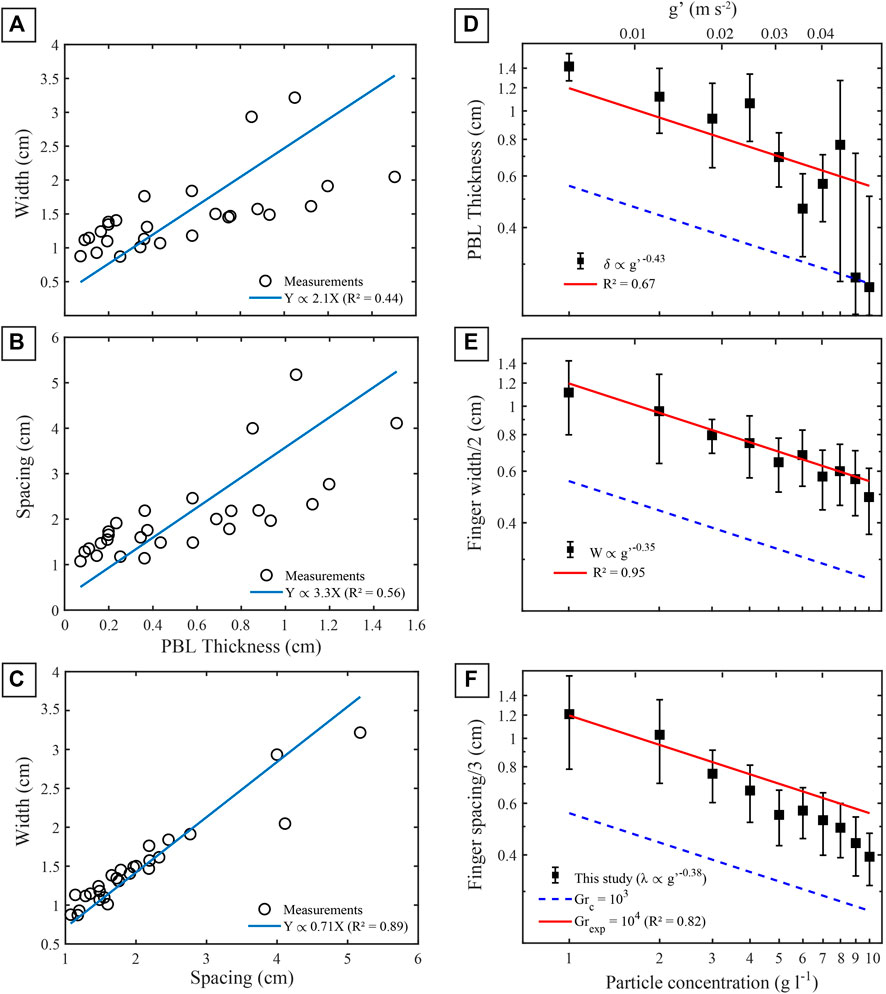
FIGURE 10. Comparison between fingers characteristic lengths for individual experiments. (A) Width (W) as a function of PBL thickness (δ). (B) Spacing (λ) against PBL thickness (C) Width against spacing. The blue lines show the proportionality relationships inferred between characteristic lengths: W = 2.1δ; λ = 3.3δ; W = 0.71λ. (D–F) Log-log plot of the characteristic length scales of the instabilities, measured 10 to 20 s after the beginning of the experiment, including (D) PBL thickness
Temporal Evolution of the Particle Mass Flux
The particle mass flux through a horizontal plane at depth
with
Predicting the evolution of the particle mass flux in the presence of fingers is complex because a complete description requires: i) information on the 3D evolution of the finger velocity and size with time and depth, ii) a good knowledge of the duration necessary to produce fingers, and iii) a description of the particle distribution and velocity field inside fingers. It is nonetheless possible to assess the time at which the particle mass flux is expected to increase (i.e., the time at which first particles reach a depth
Figure 11A shows the temporal evolution of
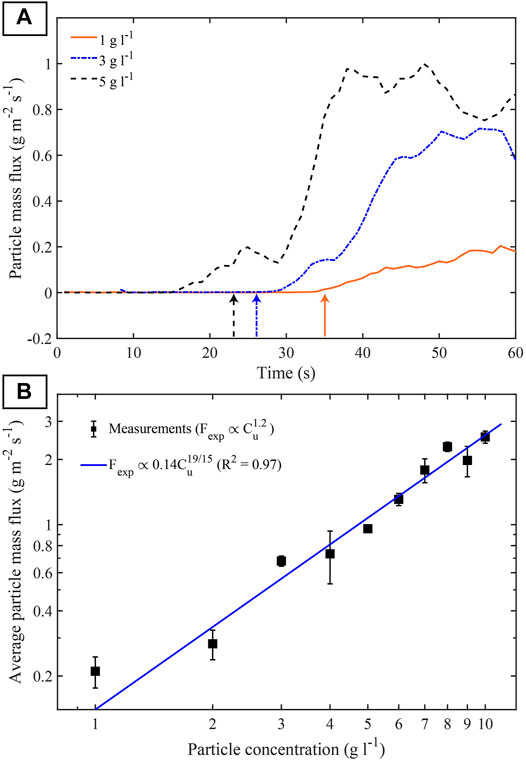
FIGURE 11. (A) Particle mass flux
Potential to Form Settling-Driven Gravitational Instabilities
The tendency for settling-driven gravitational instabilities to develop below particle suspensions and to generate fingers has previously been shown to depend on the particle size. Carazzo and Jellinek (2012) compared the instability growth rate with the terminal fall velocity of individual particles and showed that fine ash promotes finger formation, whereas Scollo et al. (2017) experimentally demonstrated that coarse particle (>125 µm) settled individually in water. When particles are sufficiently small, settling-driven gravitational instabilities can form below a particle-laden layer if the time scale of particle delivery to the PBL, given by
Combining Eqs. 12, 14, 16,
Figure 12 shows a regime diagram for experimental fingers as a function of upper layer thickness and initial particle concentration. Whilst fingers are observed in all the experiments performed at
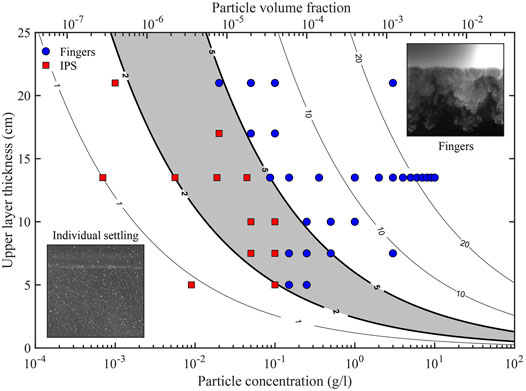
FIGURE 12. – Contours of
Discussion
Summary of the Experimental Results and Comparison With Previous Studies
The combination of PLIF and particle imaging techniques in separate reproducible experiments provides an approximation of the bulk mixture density evolution with time. We report the formation of an unstable region in all type A experiments, which is more pronounced for high particle concentrations (Figure 6). From experimental observations of the evolution of the particle concentration and of the fluid and bulk mixture density, we summarise the mechanism leading to the onset of settling-driven gravitational instabilities as:
1. The initial density configuration is gravitationally stable, with a light particle-laden layer emplaced above a denser layer;
2. Particles settle across the interface from the upper layer and are incorporated in the dense lower layer fluid;
3. A thin region containing both particles and dense lower layer fluid grows below the original interface. This PBL becomes heavier than the underlying fluid because of the effect of added particles on the density of the lower layer fluid;
4. Settling-driven gravitational instabilities can occur when the thickness and density of the PBL increases causing its
This mechanism is consistent with theoretical scenarios describing the formation and the destabilisation of a dense particle-laden layer due to particle settling as illustrated in Figure 1 (i.e., the growing of the “nose region”; Burns and Meiburg, 2012; Burns and Meiburg, 2015; Yu et al., 2013; Davarpanah Jazi and Wells, 2020). It is worth mentioning that such a formation mechanism does not require the particle concentration inside the PBL to be greater than the initial particle concentration in the upper layer. The increase in bulk density inside the PBL is due to particles settling across the interface into the upper part of the dense lower layer that therefore becomes heavier than the fluid below. This is in agreement with our experiments where we do not observe an increase of the particle concentration inside the PBL within the uncertainty of our measurements (Figure 6; Table 3). The fact that we do not observe an increase of the particle concentration across the interface is due to the lower layer being at most 1% denser than the upper layer. Thus, in contrast with configurations involving large density differences (Carey, 1997; Manville and Wilson, 2004), particles are not significantly slowed at the interface by this density contrast and do not accumulate. Similarly, the density gradient created at the base of the upper layer (Figure 6A) because of barrier removal only causes negligible variations in the particle settling velocity and does not result in an increase of the particle concentration as reported by Blanchette and Bush (2005) for configurations with significant settling velocity variations.
Furthermore, our experiments suggest that fingers do not inject significant amounts of upper layer fluid into the lower layer and have an average concentration of upper fluid < 3% (Figure 7). This observation indicates that settling-driven gravitational instabilities only weakly affect the transport of fluid phases from the upper to the lower layer, although we observe discrete fluid leaks with concentration of upper fluid up to 7% injected through fingers propagating from the base of the upper layer (Table 3). The small upper fluid concentrations inside fingers suggest that their density, and hence their velocity, depends only weakly on the upper layer fluid density and is mainly controlled by the density of the lower layer fluid and the particle concentration inside fingers.
As in previous studies, we find that, along with particle size, particle concentration exerts a primary control on particle sedimentation and the formation of fingers (Del Bello et al., 2017; Scollo et al., 2017). Our results are in very good agreement with previous measurements of the number of fingers (Figure 9; Scollo et al., 2017) and with theoretical estimates of the finger velocity (Figure 8) and characteristic lengths (Figure 10; Hoyal et al., 1999b; Carazzo and Jellinek, 2012). This increases the confidence in these theoretical formulations of finger geometry and speed on an extended particle concentration range. However, we underline that the scaling relationships of Eqs. 13, 14 are not complete solutions describing the complex flow mechanisms taking place in settling-driven gravitational instabilities. They are based on simplifying assumptions regarding the choice of a single length scale characterising finger dynamics. Moreover, they do not account for the complex particle-fluid and particle-particle interactions happening inside fingers and can therefore give only first order estimates of the size and velocity of both experimental and natural fingers.
We find that the critical thickness determined with
Nature and Size of Volcanic ash Fingers
We find the convective scaling law of Hoyal et al. (1999b), that works well for experiments, to greatly underestimate the dimensions of volcanic ash fingers by several orders of magnitude. For example, Manzella et al. (2015) estimated the width of ash fingers at Eyjafjallajökull 2010 to be about 170 m from visual observations. Based on observations of the fingers downward velocity, they also estimated the fine ash volume fraction to be in the range of 1 × 10⁻⁶ to 4 × 10⁻⁶ and the PBL bulk density to be approximately 1.31 kg m−3. Using the values of the air kinematic viscosity
Another source of discrepancy with the experiments is related to the fact that, unlike volcanic clouds, experiments are performed in a confined and quiescent environment, without shear at the base of the particle suspension. Although our experiments can address the case where the plume and fingers are advected at wind speed (Scollo et al., 2017), the effect of shear on the base of volcanic clouds needs to be considered in future work in order to describe more adequately the formation and the size of ash fingers. The presence of shear at the base of the cloud can affect the formation of ash fingers for two main reasons: i) shear can inhibit the formation of a PBL by producing eddies at the base the cloud that impede the sedimentation of particles across the interface and ii) it can create Kelvin-Helmoltz instabilities that will interact with settling-driven gravitational instabilities and possibly control the spatial distribution, dimensions and timing of ash fingers. Moreover, our experiments do not explore the effect of internal cloud dynamics on settling-driven gravitational instabilities. Whilst our experiments are in a transitional regime, volcanic ash clouds and ash fingers are fully turbulent and can contain vertical fluctuations that possibly affect the supply rate of particles to the PBL. We expect that more complete observations of ash fingers, combined with dedicated numerical simulations, will provide a better characterisation of ash finger sizes.
Conditions Favoring the Formation of Volcanic ash Fingers
Based on a new dimensionless number
However, both the cloud thickness and the particle concentrations are related to the MER (Wilson et al., 1978; Sparks, 1986), suggesting that eruptions with high MERs are more prone to develop ash fingers (Scollo et al., 2017). Whilst
Experimental Limitations and Perspectives
As with all experimental studies, a number of limitations must be considered when interpreting the data.
First, because of the additional light scattering effect of particles, we only measure the fluid density field in PLIF experiments for low particle concentrations (1 and 2 g l−1), with relatively large uncertainties (±0.8 kg m−3 on average below the initial density interface). Future combined PLIF and particle imaging will allow simultaneous measurement of the particle spatial distribution and fluid density (Borg et al., 2001; Dossmann et al., 2016), thus accounting for the effect of particles on fluid density measurements. The combination of these two techniques would therefore contribute to reduce the uncertainty associated with fluid density measurements and provide estimates of the fluid phase properties for particle concentrations >2 g l−1.
Second, measurements of the PBL thickness are initially affected by a disturbance to the density interface generated when removing the barrier. We therefore measure the PBL thickness after it reaches a constant value once the initial perturbation disappears (Supplementary Figure S5). The initial perturbation could be reduced by using a thinner composite barrier (Dalziel, 1993; Lawrie and Dalziel, 2011) and a motorised barrier removal system (Davies Wykes and Dalziel, 2014) in order to obtain a better description of the initial growth of the PBL.
Third, the scaling of the finger size with the Grashof number works well when applied to experiments but not when applied to volcanic ash clouds. As described in Nature and Size of Volcanic ash Fingers, differences between the experimental configuration and volcanic clouds can explain this discrepancy, in addition to the challenges associated with the measurement of relevant parameters in natural eruption. Experiments involving particle-laden currents instead of an immobile particle suspension will contribute to better understand this discrepancy and the scaling of natural ash fingers, along with efforts in numerical simulations of the processes. In fact, the scaling analysis in Scaling of Experiments notably revealed that volcanic clouds are associated with a wider range of dimensionless numbers than our experiments and that
Finally, laboratory experiments, unlike volcanic plumes, exist in a confined space affected by boundary conditions and the formation of return flows (Roche and Carazzo, 2019). In our experiments, boundary conditions have an impact on convection in the lower layer, which has only a limited effect on measurements of finger characteristic velocity and dimensions, especially in the early part of the experiments, and a negligible influence on finger formation. Despite these uncertainties however, we can infer useful and rigorous interpretations of the results.
Conclusion
Our experiments provide new insights into the development of an unstable particle-laden layer from an initially stable configuration because of particle settling across the interface. The use of PLIF has revealed that the fluid phase in the upper layer is not substantially affected by the instability and the subsequent propagation of fingers. Additionally, our experiments confirm and expand previous experimental findings and theoretical predictions concerning the increase of both finger number and speed with respect to particle concentration and the decrease of PBL and fingers size. Estimations of the particle mass flux also suggest that fingers are associated with a quicker deposition of fine particles. Finally, we propose a new dimensionless number
• Settling-driven gravitational instabilities in a quiescent environment arise from small density anomalies generated by particle settling across the interface and being incorporated in the denser underlying fluid (i.e., the sugar solution in experiments and the atmosphere for volcanic clouds). The bulk mixture becomes denser in this region (PBL) and destabilizes the density configuration by generating a dense layer above a lighter fluid. A gravitational instability originates and, when the PBL exceeds its critical thickness (dependent on the particle concentration), fingers begin intruding into the lower layer.
• Our new experiments validate previous results (Scollo et al., 2017) and extend them to a larger particle concentration range (from 1 to 10 g l−1). Both the number of fingers and the finger velocity increase with particle concentration of the suspension, and, therefore, the importance of ash fingers on fine ash settling is expected to increase with the mass loading of ash clouds.
• Experiments show that the particle mass flux increases quicker below high particle concentration suspensions than below particle suspensions with low particle concentrations because of the presence of fingers.
• Experimental results suggest that the characteristic lengths of the instability scale with the finger Grashof number, with
• The potential to form settling-driven gravitational instabilities at the base of particle suspensions can be quantified through
Data Availability Statement
The original contributions presented in the study are included in the article/Supplementary Material, further inquiries can be directed to the corresponding author.
Author Contributions
CB, IM, AC, and JP were involved in designing the project. AF conducted experiments and data analysis under PJ and CB supervision. AF elaborated the manuscript. All authors have contributed to data interpretation as well as the editing and finalisation of the paper.
Funding
The study has been funded by the Swiss National Science Foundation #200021_169463.
Conflict of Interest
The authors declare that the research was conducted in the absence of any commercial or financial relationships that could be construed as a potential conflict of interest.
Acknowledgments
Frédéric Arlaud and Jean-Jacques Lasserre are thanked for their technical expertise in the laboratory. We thank Mark Jellinek, TM, LM and Valerio Acocella for their comments that substantially improved the manuscript.
Supplementary Material
The Supplementary Material for this article can be found online at: https://www.frontiersin.org/articles/10.3389/feart.2021.640090/full#supplementary-material
References
Adrian, R. J. (2005). Twenty Years of Particle Image Velocimetry. Exp. Fluids 39, 159–169. doi:10.1007/s00348-005-0991-7
Andronico, D., Scollo, S., and Cristaldi, A. (2015). Unexpected Hazards from Tephra Fallouts at Mt Etna: The 23 November 2013 Lava fountain. J. Volcanology Geothermal Res. 304, 118–125. doi:10.1016/j.jvolgeores.2015.08.007
Ansmann, A., Tesche, M., Groß, S., Freudenthaler, V., Seifert, P., Hiebsch, A., et al. (2010). The 16 April 2010 Major Volcanic Ash Plume over central Europe: EARLINET Lidar and AERONET Photometer Observations at Leipzig and Munich, Germany. Geophys. Res. Lett. 37, a–n. doi:10.1029/2010GL043809
Bagheri, G., and Bonadonna, C. (2016a). Aerodynamics of Volcanic Particles, in Volcanic Ash (Elsevier), 39–52. doi:10.1016/B978-0-08-100405-0.00005-7
Bagheri, G., and Bonadonna, C. (2016b). On the Drag of Freely Falling Non-spherical Particles. Powder Tech. 301, 526–544. doi:10.1016/j.powtec.2016.06.015
Bagheri, G., Rossi, E., Biass, S., and Bonadonna, C. (2016). Timing and Nature of Volcanic Particle Clusters Based on Field and Numerical Investigations. J. Volcanology Geothermal Res. 327, 520–530. doi:10.1016/j.jvolgeores.2016.09.009
Blanchette, F., and Bush, J. W. M. (2005). Particle Concentration Evolution and Sedimentation-Induced Instabilities in a Stably Stratified Environment. Phys. Fluids 17, 073302. doi:10.1063/1.1947987
Bonadonna, C., Mayberry, G. C., Calder, E. S., Sparks, R. S. J., Choux, C., Jackson, P., et al. (2002). Tephra Fallout in the Eruption of Soufrière Hills Volcano, Montserrat. Geol. Soc. Lond. Mem. 21, 483–516. doi:10.1144/GSL.MEM.2002.021.01.22
Bonadonna, C., Phillips, J. C., and Houghton, B. F. (2005). Modeling Tephra Sedimentation from a Ruapehu Weak Plume Eruption. J. Geophys. Res. 110, B08209. doi:10.1029/2004JB003515
Bonadonna, C., Genco, R., Gouhier, M., Pistolesi, M., Cioni, R., Alfano, F., et al. (2011). Tephra Sedimentation during the 2010 Eyjafjallajökull Eruption (Iceland) from deposit, Radar, and Satellite Observations. J. Geophys. Res. 116, B12202. doi:10.1029/2011JB008462
Bonadonna, C., Biass, S., Menoni, S., and Gregg, C. E. (2021). “Assessment of Risk Associated with Tephra-Related Hazards,” in Forecasting and Planning for Volcanic Hazards, Risks, and Disasters (Elsevier), 329–378. doi:10.1016/B978-0-12-818082-2.00008-1
Borg, A., Bolinder, J., and Fuchs, L. (2001). Simultaneous Velocity and Concentration Measurements in the Near Field of a Turbulent Low-Pressure Jet by Digital Particle Image Velocimetry-Planar Laser-Induced Fluorescence. Experiments in Fluids 31, 140–152. doi:10.1007/s003480000267
Brown, R. J., Bonadonna, C., and Durant, A. J. (2012). A Review of Volcanic Ash Aggregation. Phys. Chem. Earth, Parts A/B/C 45-46, 65–78. doi:10.1016/j.pce.2011.11.001
Burgisser, A., and Bergantz, G. W. (2002). Reconciling Pyroclastic Flow and Surge: the Multiphase Physics of Pyroclastic Density Currents. Earth Planet. Sci. Lett. 202, 405–418. doi:10.1016/s0012-821x(02)00789-6
Burgisser, A., Bergantz, G. W., and Breidenthal, R. E. (2005). Addressing Complexity in Laboratory Experiments: the Scaling of Dilute Multiphase Flows in Magmatic Systems. J. Volcanology Geothermal Res. 141, 245–265. doi:10.1016/j.jvolgeores.2004.11.001
Burns, P., and Meiburg, E. (2012). Sediment-laden Fresh Water above Salt Water: Linear Stability Analysis. J. Fluid Mech. 691, 279–314. doi:10.1017/jfm.2011.474
Burns, P., and Meiburg, E. (2015). Sediment-laden Fresh Water above Salt Water: Nonlinear Simulations. J. Fluid Mech. 762, 156–195. doi:10.1017/jfm.2014.645
Carazzo, G., and Jellinek, A. M. (2012). A New View of the Dynamics, Stability and Longevity of Volcanic Clouds. Earth Planet. Sci. Lett. 325–326, 39–51. doi:10.1016/j.epsl.2012.01.025
Carazzo, G., and Jellinek, A. M. (2013). Particle Sedimentation and Diffusive Convection in Volcanic Ash-Clouds. J. Geophys. Res. Solid Earth 118, 1420–1437. doi:10.1002/jgrb.50155
Cardoso, S. S. S., and Zarrebini, M. (2001). Convection Driven by Particle Settling Surrounding a Turbulent Plume. Chem. Eng. Sci. 56, 3365–3375. doi:10.1016/S0009-2509(01)00028-8
Carey, S. (1997). Influence of Convective Sedimentation on the Formation of Widespread Tephra Fall Layers in the Deep Sea. Geol 25, 839–842. doi:10.1130/0091-7613(1997)025<0839:iocsot>2.3.co;2
Chen, C. F. (1997). Particle Flux through Sediment Fingers. Deep Sea Res. Oceanographic Res. Pap. 44, 1645–1654. doi:10.1016/S0967-0637(97)00042-3
Chou, Y.-J., and Shao, Y.-C. (2016). Numerical Study of Particle-Induced Rayleigh-Taylor Instability: Effects of Particle Settling and Entrainment. Phys. Fluids 28, 043302. doi:10.1063/1.4945652
Costa, A., Folch, A., and Macedonio, G. (2010). A Model for Wet Aggregation of Ash Particles in Volcanic Plumes and Clouds: 1. Theoretical Formulation. J. Geophys. Res. 115, B09201. doi:10.1029/2009JB007175
Crimaldi, J. P. (2008). Planar Laser Induced Fluorescence in Aqueous Flows. Exp. Fluids 44, 851–863. doi:10.1007/s00348-008-0496-2
Crowe, C. T., Schwarzkopf, J. D., Sommerfeld, M., and Tsuji, Y. (2011). Multiphase Flows with Droplets and Particles. 2nd Edn. CRC Press. doi:10.1201/b11103
Dalziel, S. B. (1993). Rayleigh-Taylor Instability: Experiments with Image Analysis. Dyn. Atmospheres Oceans 20, 127–153. doi:10.1016/0377-0265(93)90051-8
Davarpanah Jazi, S., and Wells, M. G. (2016). Enhanced Sedimentation beneath Particle-Laden Flows in Lakes and the Ocean Due to Double-Diffusive Convection. Geophys. Res. Lett. 43 (10), 883–910. doi:10.1002/2016GL069547
Davarpanah Jazi, S., and Wells, M. G. (2020). Dynamics of Settling Driven Convection beneath a Sediment Laden Buoyant Overflow: Implications for the Length Scale of Deposition in Lakes and the Coastal Ocean. Sedimentology 67, 699–720. doi:10.1111/sed.12660
Davies Wykes, M. S., and Dalziel, S. B. (2014). Efficient Mixing in Stratified Flows: Experimental Study of a Rayleigh-Taylor Unstable Interface within an Otherwise Stable Stratification. J. Fluid Mech. 756, 1027–1057. doi:10.1017/jfm.2014.308
Del Bello, E., Taddeucci, J., de’ Michieli Vitturi, M., Scarlato, P., Andronico, D., Scollo, S., et al. (2017). Effect of Particle Volume Fraction on the Settling Velocity of Volcanic Ash Particles: Insights from Joint Experimental and Numerical Simulations. Sci. Rep. 7, 39620. doi:10.1038/srep39620
Dossmann, Y., Bourget, B., Brouzet, C., Dauxois, T., Joubaud, S., and Odier, P. (2016). Mixing by Internal Waves Quantified Using Combined PIV/PLIF Technique. Exp. Fluids 57, 132. doi:10.1007/s00348-016-2212-y
Durant, A. J., and Brown, R. J. (2016). “Ash Aggregation in Volcanic Clouds,” in Volcanic Ash (Elsevier), 53–65. doi:10.1016/B978-0-08-100405-0.00006-9
Durant, A. J., Rose, W. I., Sarna-Wojcicki, A. M., Carey, S., and Volentik, A. C. M. (2009). Hydrometeor-enhanced Tephra Sedimentation: Constraints from the 18 May 1980 Eruption of Mount St. Helens. J. Geophys. Res. 114, B03204. doi:10.1029/2008JB005756
Durant, A. J. (2015). Research Focus: Toward a Realistic Formulation of fine-ash Lifetime in Volcanic Clouds. Geology 43, 271–272. doi:10.1130/focus032015.1
Eliasson, J., Yoshitani, J., Weber, K., Yasuda, N., Iguchi, M., and Vogel, A. (2014). Airborne Measurement in the Ash Plume from Mount Sakurajima: Analysis of Gravitational Effects on Dispersion and Fallout. Int. J. Atmos. Sci. 2014, 1–16. doi:10.1155/2014/372135
Eliasson, J., Watson, I. M., and Weber, K. (2016). “In Situ Observations of Airborne Ash from Manned Aircraft,” in Volcanic Ash (Elsevier), 89–98. doi:10.1016/B978-0-08-100405-0.00009-4
Folch, A., Costa, A., and Macedonio, G. (2016). FPLUME-1.0: An Integral Volcanic Plume Model Accounting for Ash Aggregation. Geosci. Model. Dev. 9, 431–450. doi:10.5194/gmd-9-431-2016
Folch, A. (2012). A Review of Tephra Transport and Dispersal Models: Evolution, Current Status, and Future Perspectives. J. Volcanology Geothermal Res. 235–236, 96–115. doi:10.1016/j.jvolgeores.2012.05.020
Freret-Lorgeril, V., Gilchrist, J., Donnadieu, F., Jellinek, A. M., Delanoë, J., Latchimy, T., et al. (2020). Ash Sedimentation by Fingering and Sediment Thermals from Wind-Affected Volcanic Plumes. Earth Planet. Sci. LettersSci. Lett. 534, 116072. doi:10.1016/j.epsl.2020.116072
Fu, G., Lin, H. X., Heemink, A. W., Segers, A. J., Lu, S., and Palsson, T. (2015). Assimilating Aircraft-Based Measurements to Improve Forecast Accuracy of Volcanic Ash Transport. Atmos. Environ. 115, 170–184. doi:10.1016/j.atmosenv.2015.05.061
Gouhier, M., Eychenne, J., Azzaoui, N., Guillin, A., Deslandes, M., Poret, M., et al. (2019). Low Efficiency of Large Volcanic Eruptions in Transporting Very fine Ash into the Atmosphere. Sci. Rep. 9, 1449. doi:10.1038/s41598-019-38595-7
Grant, I. (1997). Particle Image Velocimetry: A Review. Proc. Inst. Mech. Eng. Part. C J. Mech. Eng. Sci. 211, 55–76. doi:10.1243/0954406971521665
Green, T. (1987). The Importance of Double Diffusion to the Settling of Suspended Material. Sedimentology 34, 319–331. doi:10.1111/j.1365-3091.1987.tb00780.x
Gudmundsson, G. (2011). Respiratory Health Effects of Volcanic Ash with Special Reference to Iceland. A Review. Clin. Respir. J. 5, 2–9. doi:10.1111/j.1752-699X.2010.00231.x
Guffanti, M., Mayberry, G. C., Casadevall, T. J., and Wunderman, R. (2009). Volcanic Hazards to Airports. Nat. Hazards 51, 287–302. doi:10.1007/s11069-008-9254-2
Harlow, F. H., and Amsden, A. A. (1975). Numerical Calculation of Multiphase Fluid Flow. J. Comput. Phys. 17, 19–52. doi:10.1016/0021-9991(75)90061-3
Henniger, R., and Kleiser, L. (2012). Temporal Evolution, Morphology, and Settling of the Sediment Plume in a Model Estuary. Phys. Fluids 24, 086601. doi:10.1063/1.4739537
Hobbs, P. V., Radke, L. F., Lyons, J. H., Ferek, R. J., Coffman, D. J., and Casadevall, T. J. (1991). Airborne Measurements of Particle and Gas Emissions from the 1990 Volcanic Eruptions of Mount Redoubt. J. Geophys. Res. 96, 18735. doi:10.1029/91JD01635
Horwell, C. J., and Baxter, P. J. (2006). The Respiratory Health Hazards of Volcanic Ash: a Review for Volcanic Risk Mitigation. Bull. Volcanol. 69, 1–24. doi:10.1007/s00445-006-0052-y
Hoyal, D. C. J. D., Bursik, M. I., and Atkinson, J. F. (1999a). The Influence of Diffusive Convection on Sedimentation from Buoyant Plumes. Mar. Geology. 159, 205–220. doi:10.1016/S0025-3227(99)00005-5
Hoyal, D. C. J. D., Bursik, M. I., and Atkinson, J. F. (1999b). Settling-driven Convection: A Mechanism of Sedimentation from Stratified Fluids. J. Geophys. Res. 104, 7953–7966. doi:10.1029/1998JC900065
Hu, H., Saga, T., Kobayashi, T., and Taniguchi, N. (2002). Simultaneous Velocity and Concentration Measurements of a Turbulent Jet Mixing Flow. Ann. N. Y. Acad. Sci. 972, 254–259. doi:10.1111/j.1749-6632.2002.tb04581.x
Inman, D. L. (1952). Measures for Describing the Size Distribution of Sediments. J. Sediment. Res. 22 (3), 125–145. doi:10.1306/D42694DB-2B26-11D7-8648000102C1865D
Jacobs, C. T., Collins, G. S., Piggott, M. D., Kramer, S. C., and Wilson, C. R. G. (2013). Multiphase Flow Modelling of Volcanic Ash Particle Settling in Water Using Adaptive Unstructured Meshes. Geophys. J. Int. 192, 647–665. doi:10.1093/gji/ggs059
Jacobs, C. T., Goldin, T. J., Collins, G. S., Piggott, M. D., Kramer, S. C., Melosh, H. J., et al. (2015). An Improved Quantitative Measure of the Tendency for Volcanic Ash Plumes to Form in Water: Implications for the Deposition of marine Ash Beds. J. Volcanology Geothermal Res. 290, 114–124. doi:10.1016/j.jvolgeores.2014.10.015
Jenkins, S. F., Wilson, T. M., Magill, C., Miller, V., Stewart, C., Blong, R., et al. (2015). “Volcanic Ash Fall hazard and Risk,” in Global Volcanic Hazards and Risk. Editors S. C. Loughlin, S. Sparks, S. K. Brown, S. F. Jenkins, and C. Vye-Brown (Cambridge: Cambridge University Press), 173–222. doi:10.1017/CBO9781316276273.005
Kavanagh, J. L., Engwell, S. L., and Martin, S. A. (2018). A Review of Laboratory and Numerical Modelling in Volcanology. Solid Earth 9, 531–571. doi:10.5194/se-9-531-2018
Keane, R. D., and Adrian, R. J. (1992). Theory of Cross-Correlation Analysis of PIV Images. Appl. Scientific Res. 49, 191–215. doi:10.1007/BF00384623
Koochesfahani, M. M. (1984). Experiments on Turbulent Mixing and Chemical Reactions in a Liquid Mixing Layer. Dissertation (Ph.D). California Institute of Technology. doi:10.7907/Y7BR-C556
Lawrie, A. G. W., and Dalziel, S. B. (2011). Rayleigh-Taylor Mixing in an Otherwise Stable Stratification. J. Fluid Mech. 688, 507–527. doi:10.1017/jfm.2011.398
Lechner, P., Tupper, A., Guffanti, M., Loughlin, S., and Casadevall, T. (2017). “Volcanic Ash and Aviation The Challenges of Real Time, Global Communication of a Natural Hazard,” in Observing the Volcano World. Editors C. J. Fearnley, D. K. Bird, K. Haynes, W. J. McGuire, and G. Jolly (Cham: Springer International Publishing), 51–64. doi:10.1007/11157_2016_49
Lee, S., Jang, Y., Choi, C., and Lee, T. (1992). Combined Effect of Sedimentation Velocity Fluctuation and Self Sharpening on Interface Broadening. Phys. Fluids A: Fluid Dyn. 4, 2601–2606. doi:10.1063/1.858449
Linden, P. F., and Redondo, J. M. (1991). Molecular Mixing in Rayleigh-Taylor Instability. Part I: Global Mixing. Phys. Fluids A: Fluid Dyn. 3, 1269–1277. doi:10.1063/1.858055
Manville, V., and Wilson, C. J. N. (2004). Vertical Density Currents: a Review of Their Potential Role in the Deposition and Interpretation of Deep-Sea Ash Layers. J. Geol. Soc. 161, 947–958. doi:10.1144/0016-764903-067
Manzella, I., Bonadonna, C., Phillips, J. C., and Monnard, H. (2015). The Role of Gravitational Instabilities in Deposition of Volcanic Ash. Geology 43, 211–214. doi:10.1130/G36252.1
Marsh, B. D. (1988). Crystal Capture, Sorting, and Retention in Convecting Magma. GSA Bull. 100, 1720–1737. doi:10.1130/0016-7606(1988)100<1720:ccsari>2.3.co;2
Martin, D., and Nokes, R. (1989). A Fluid-Dynamical Study of Crystal Settling in Convecting Magmas. J. Petrol. 30, 1471–1500. doi:10.1093/petrology/30.6.1471
Martin, J., Rakotomalala, N., and Salin, D. (1994). Hydrodynamic Dispersion Broadening of a Sedimentation Front. Phys. Fluids 6, 3215–3217. doi:10.1063/1.868051
Maxworthy, T. (1999). The Dynamics of Sedimenting Surface Gravity Currents. J. Fluid Mech. 392, 27–44. doi:10.1017/S002211209900556X
Nicholas, A. P., and Walling, D. E. (1996). The Significance of Particle Aggregation in the Overbank Deposition of Suspended Sediment on River Floodplains. J. Hydrol. 186, 275–293. doi:10.1016/S0022-1694(96)03023-5
Parsons, J. D., Bush, J. W. M., and Syvitski, J. P. M. (2001). Hyperpycnal Plume Formation from Riverine Outflows with Small Sediment Concentrations. Sedimentology 48, 465–478. doi:10.1046/j.1365-3091.2001.00384.x
Prata, A. J., and Tupper, A. (2009). Aviation Hazards from Volcanoes: the State of the Science. Nat. Hazards 51, 239–244. doi:10.1007/s11069-009-9415-y
Reynolds, O. (1883). An Experimental Investigation of the Circumstances Which Determine whether the Motion of Water Shall Be Direct or Sinuous, and of the Law of Resistance in Parallel Channels. Philos. Trans. R. Soc. Lond. 174, 935–982. doi:10.1098/rstl.1883.0029
Roche, O., and Carazzo, G. (2019). The Contribution of Experimental Volcanology to the Study of the Physics of Eruptive Processes, and Related Scaling Issues: A Review. J. Volcanology Geothermal Res. 384, 103–150. doi:10.1016/j.jvolgeores.2019.07.011
Schultz, D. M., Kanak, K. M., Straka, J. M., Trapp, R. J., Gordon, B. A., Zrnić, D. S., et al. (2006). The Mysteries of Mammatus Clouds: Observations and Formation Mechanisms. J. Atmos. Sci. 63, 2409–2435. doi:10.1175/JAS3758.1
Scollo, S., Tarantola, S., Bonadonna, C., Coltelli, M., and Saltelli, A. (2008). Sensitivity Analysis and Uncertainty Estimation for Tephra Dispersal Models. J. Geophys. Res. 113, B06202. doi:10.1029/2006JB004864
Scollo, S., Bonadonna, C., and Manzella, I. (2017). Settling-driven Gravitational Instabilities Associated with Volcanic Clouds: New Insights from Experimental Investigations. Bull. Volcanol. 79. doi:10.1007/s00445-017-1124-x
Sharp, D. H. (1984). An overview of Rayleigh-Taylor instability. Phys. Nonlinear Phenom. 12, 3–18. doi:10.1016/0167-2789(84)90510-4
Sparks, R. S. J. (1986). The Dimensions and Dynamics of Volcanic Eruption Columns. Bull. Volcanol. 48, 3–15. doi:10.1007/BF01073509
Spence, R. J. S., Kelman, I., Baxter, P. J., Zuccaro, G., and Petrazzuoli, S. (2005). Residential Building and Occupant Vulnerability to Tephra Fall. Nat. Hazards Earth Syst. Sci. 5, 477–494. doi:10.5194/nhess-5-477-2005
Sutherland, B. R., Gingras, M. K., Knudson, C., Steverango, L., and Surma, C. (2018). Particle-bearing Currents in Uniform Density and Two-Layer Fluids. Phys. Rev. Fluids 3, 023801. doi:10.1103/PhysRevFluids.3.023801
Suzuki, Y. J., and Koyaguchi, T. (2009). A Three-Dimensional Numerical Simulation of Spreading Umbrella Clouds. J. Geophys. Res. 114, B03209. doi:10.1029/2007JB005369
Troy, C. D., and Koseff, J. R. (2005). The Generation and Quantitative Visualization of Breaking Internal Waves. Exp. Fluids 38, 549–562. doi:10.1007/s00348-004-0909-9
Turner, J. S. (1973). Buoyancy Effects in Fluids. 1st Edn. Cambridge University Press. doi:10.1017/CBO9780511608827
Valentine, G. A., and Wohletz, K. H. (1989). Numerical Models of Plinian Eruption Columns and Pyroclastic Flows. J. Geophys. Res. 94, 1867. doi:10.1029/JB094iB02p01867
Weber, K., Eliasson, J., Vogel, A., Fischer, C., Pohl, T., van Haren, G., et al. (2012). Airborne In-Situ Investigations of the Eyjafjallajökull Volcanic Ash Plume on Iceland and over north-western Germany with Light Aircrafts and Optical Particle Counters. Atmos. Environ. 48, 9–21. doi:10.1016/j.atmosenv.2011.10.030
Wilson, P. N., and Andrews, M. J. (2002). Spectral Measurements of Rayleigh-Taylor Mixing at Small Atwood Number. Phys. Fluids 14, 938–945. doi:10.1063/1.1445418
Wilson, L., Sparks, R. S. J., Huang, T. C., and Watkins, N. D. (1978). The Control of Volcanic Column Heights by Eruption Energetics and Dynamics. J. Geophys. Res. 83, 1829–1836. doi:10.1029/JB083iB04p01829
Wilson, T. M., Stewart, C., Sword-Daniels, V., Leonard, G. S., Johnston, D. M., Cole, J. W., et al. (2012). Volcanic Ash Impacts on Critical Infrastructure. Phys. Chem. Earth, Parts A/B/C 45-46, 5–23. doi:10.1016/j.pce.2011.06.006
Yu, X., Hsu, T.-J., and Balachandar, S. (2013). Convective Instability in Sedimentation: Linear Stability Analysis. J. Geophys. Res. Oceans 118, 256–272. doi:10.1029/2012JC008255
Yu, X., Hsu, T.-J., and Balachandar, S. (2014). Convective Instability in Sedimentation: 3-D Numerical Study. J. Geophys. Res. Oceans 119, 8141–8161. doi:10.1002/2014JC010123
Zehentbauer, F. M., Moretto, C., Stephen, R., Thevar, T., Gilchrist, J. R., Pokrajac, D., et al. (2014). Fluorescence Spectroscopy of Rhodamine 6G: Concentration and Solvent Effects. Spectrochimica Acta A: Mol. Biomol. Spectrosc. 121, 147–151. doi:10.1016/j.saa.2013.10.062
Keywords: settling-driven gravitational instabilities, tephra sedimentation, volcanic ash clouds, ash concentration, analogue experiments, PLIF
Citation: Fries A, Lemus J, Jarvis PA, Clarke AB, Phillips JC, Manzella I and Bonadonna C (2021) The Influence of Particle Concentration on the Formation of Settling-Driven Gravitational Instabilities at the Base of Volcanic Clouds. Front. Earth Sci. 9:640090. doi: 10.3389/feart.2021.640090
Received: 10 December 2020; Accepted: 07 May 2021;
Published: 03 June 2021.
Edited by:
Stephen Self, University of California, Berkeley, United StatesReviewed by:
Thierry Menand, Université Clermont Auvergne, FranceLarry Garver Mastin, United States Geological Survey (USGS), United States
Copyright © 2021 Fries, Lemus, Jarvis, Clarke, Phillips, Manzella and Bonadonna. This is an open-access article distributed under the terms of the Creative Commons Attribution License (CC BY). The use, distribution or reproduction in other forums is permitted, provided the original author(s) and the copyright owner(s) are credited and that the original publication in this journal is cited, in accordance with accepted academic practice. No use, distribution or reproduction is permitted which does not comply with these terms.
*Correspondence: Allan Fries, allan.fries@unige.ch