How Nanopores Influence Dry-Frame VP Pressure Sensitivity
 Rohit Raj
 Priyank Jaiswal
 Yulun Wang
 G. Michael Grammer1
  Ralf J. Weger
- 1Boone Pickens School of Geology, Oklahoma State University, Stillwater, OK, United States
- 2Comparative Sedimentology Laboratory (CSL)–Center for Carbonate Research, Rosenstiel School of Marine and Atmospheric Science, Department of Marine Geosciences, University of Miami, Miami, FL, United States
This paper investigates how nanopore size distribution influences dry-frame P-wave velocity (VP) pressure sensitivity. The study uses a set of twenty-three samples belonging to a single vertical core from the Mississippian-age Meramec formation of the mid-continent US. Individual samples had their facies interpreted, composition estimated, He-gas porosity (ΦHe) determined, and P-wave and S-wave transit times systematically measured for dry core-plugs in a 5–40 MPa loading and unloading cycle. Data from the unloading cycle were linearized in the log scale, and the slope of the best fitting line was considered as a representative of the dry-frame VP pressure sensitivity. A series of photomicrographs from each sample were analyzed using image processing methods to obtain the shape and size of the individual pores, which were mostly in the nanopore (10−6–10–9 m) scale. At the outset, the pore-shape distribution plots were used to identify and discard samples with excessive cracks and complex pores. When the remaining samples were compared, it was found that within the same facies and pore-shape distribution subgroups VP pressure sensitivity increased as the dominant pore-size became smaller. This was largely independent of ΦHe and composition. The paper postulates that at the nanopore scale in the Meramec formation, pores are mostly isolated, and an increase in the confining pressure increased the bulk moduli of the fluids in the isolated pores, which in turn increased the VP pressure sensitivity. The study proposes incorporating this effect quantitatively through a dual-fluid model where the part of the fluid in unconnected pores is considered compressible while the remaining is considered incompressible. Results start to explain the universal observation of why the presence of microporosity quintessentially enhances VP pressure sensitivity.
Introduction
Rocks resist bulk deformation against pressure. This property, known as the bulk modulus (K), is a measure of the volume change with respect to a change in the confining pressure. In a porous material, the change of K is not linear with pressure (Robin, 1973; Hart and Wang, 1995; Zhang et al., 2019). Why and how K changes with loading can provide critical insights into the drainage and injection behavior of reservoir rocks, which in turn is necessary for production and sequestration (Angerer et al., 2002; Vanorio et al., 2011; Vanorio, 2015). Volumetric strain can be measured directly in axial loading experiments yielding what is referred to as the “static” modulus. However, measuring small strains in static loading can be difficult and the experiments are often destructive. A common practice is to instead measure the P-wave (VP) and S-wave (Vs) velocities at ultrasonic frequencies over loading and unloading cycles and, using standard relationships, obtain what is referred to as the “dynamic” modulus (Nur and Simmons, 1969; Martínez-Martínez et al., 2012; Asef and Najibi, 2013). For elastic material such as steel, the static and dynamic moduli are essentially the same. For dry porous rocks, however, one reason of the difference between the two is due to a difference in how rock responds to rate and magnitude of loading (Mashinsky, 2003; Fjær et al., 2013; Fjær, 2019). For example, the strain rate induced by axial loading (typically, 10–6 s−1) is much lower than that induced by ultrasonic frequencies (typically, 10–1 s−1) (Fjær et al., 2013; Fjær, 2019) while the strain amplitude in axial loading is higher, e.g., 10–2 to 10–1 vs. 10–7 to 10–6 (Batzle et al., 2006; Fjær, 2019; Muqtadir et al., 2020). Likewise, parts of the rock that accommodate that static stress, e.g., compliant features such as a crack (Han et al., 2016), are different than the parts that contribute to the elastic stress propagation, e.g., grain contacts. Other experimental conditions such as dispersion and drainage can also set dynamic and static moduli apart. Regardless, the goal of geomechanical measurements is not as much to reconcile the two kinds of moduli as to use them for understanding different aspects of the rock and gain predictability of its behavior. This paper focuses on understanding how the pore-size distribution affects the rate at which VP changes with confining pressure, hereafter referred to as pressure sensitivity.
Static measurements provide stress-strain relationships that can be used for investigating fatigue, relaxation, creep, and rupture. Dynamic measurements provide elastic velocities that can be in turn related to the rock texture and fluid dynamics. Several elastic and elastoplastic models that formulate moduli and velocity in terms of measurable properties such as bulk porosity (Φ) and composition can be explored to explain both static and dynamic modulus and gain insights into the mechanistic nature of the rock (Mavko et al., 2020). However, challenges remain. Why stress-strain relationships in static experiments with simple Hookean porous rocks are often more non-linear than what is expected from their moduli and texture, remains debated (Morgenstern and Phukan, 1969; Biot, 1973; Darling et al., 2004). Similarly, while velocities at a given pressure can be modeled under a set of mechanistic assumptions, being able to explain the entire hysteresis with the same mechanistic model has been rarely done. In dynamic measurements, empirical relationships most commonly emerge between VP pressure sensitivity, and pore topology (Eberhart-Phillips et al., 1989; Prasad and Manghnani, 1997; Kirstetter and MacBeth, 2001; David and Zimmerman, 2012). Static experiments also indicate that the nature of the stress-strain curve can be strongly influenced by the pore topology (Fredrich et al., 1993; Davis et al., 2017). To date, however, for explaining both the dynamic and static results the emphasis has been on using the bulk value of porosity rather than the pore architecture, distribution, or connectivity.
In general, both moduli and velocity of a porous material have several dependencies. Closed-form expressions that view rock as a continuous medium with an even distribution of regular pores can explain the role of key causations such as the composition (grains and fluids) and Φ. Cracks, grain boundaries, and geometrical irregularities are difficult to include in a continuum and are therefore often treated as boundary conditions or an end member problem (Pyrak-Nolte et al., 1990; Liu et al., 2000; Pyrak-Nolte and Morris, 2000). Interestingly, when it comes to the VP pressure sensitivity, end members might outweigh the contribution of composition and Φ. Assuming that the grains remain intact, it is commonly accepted that increase in VP due to loading is mainly due to the closure of cracks and grain boundaries (Darot and Reuschlé, 2000; Freund, 1992; Prasad and Manghnani, 1997) or change in grain arrangement (Kitamura et al., 2010). In this context, the role of microporosity (pores smaller than what Optical Light Microscopy can discern; ∼30 μm; Baechle et al., 2008) seems to be critical. Despite constituting only a small fraction of Φ their presence is known to strongly influence VP pressure sensitivity (de Oliveira et al., 2016; Wang et al., 2015) and possibly both strain rate and amplitude during loading. Microporosity makes the rock behave differently at low and high pressure naturally prompting researchers to conceive dual-porosity models, e.g., Ba et al. (2008), to explain the rock behavior across the entire range of confining pressure. Why and how the presence of pores that are smaller than a certain dimension should affect static or dynamic moduli differently than the rest of the porosity remains unclear.
Unlike that of composition and Φ, understanding the effect of pore shape and size on static or dynamic moduli is not straightforward. Pore aspect ratio (major (l) over minor (w) axis), their orientation, and complexity (perimeter (Pe) over area (Ar)) are theoretically expected to explain how stress accumulates and the material is strained (Zimmerman et al., 1986). Although, their experimental confirmation is widely available (Weger et al., 2009; Weibo et al., 2020), the extent of their exclusivity remains unclear. For example, compressibility might not always be tied to geometry, i.e., the set of compliant features have a large intersection with the set of features that have a high aspect ratio, but they are not identical. The role of the size distribution probably remains even less explored. With a set of synthetic carbonate samples, Wang et al. (2015) have shown how size affects velocity, which may be a function of the dominant wavelength. In the meso-to-micro range (4 mm–1 µm), Weger et al. (2009) found that ultrasonic VP increased as the pores became larger and less complex. On the other hand, in the micro-to-nano range (62.5 µm–1 nm), Raj et al. (2019) discovered the opposite; they noted that the ultrasonic VP increased as the dominant pore size decreased. A key difference between the two experiments was that Weger et al. (2009) samples were saturated while Raj et al. (2019) samples were dry. Another difference was that while Weger et al. (2009) compared samples of vastly different pore architectures, Raj et al. (2019) first classified their sample facies-wise and then composition-wise, ensuring that samples of similar pore architecture are compared. Regardless, both studies showed that, at least in the carbonate rocks, the pore-size distribution might play an equally important role in determining the VP as does Φ.
Almost all existing studies on VP pressure sensitivity have used rocks with pore-size dominantly in the meso- or larger scale. This paper extends the line of inquiry started by Raj et al. (2019) and fills the knowledge gap of examining how nanopores affect dry-frame VP pressure sensitivity. Raj et al. (2019) demonstrated the effect of pore-size distribution on VP with samples from the Mississippian age mixed carbonate-siliciclastic reservoir rocks from the mid-continent, United States, commonly known as the “Miss Lime” formation. This paper uses samples from the distal equivalent of Miss Lime, known as the Meramec formation. The dataset in this paper comprises X-ray diffraction (XRD)-based composition, ΦHe from helium injection porosimetry, ultrasonic velocities of ∼1.5-inch dry core plugs over 5–40 MPa loading and unloading cycle, and pore-size distribution from Digital Image Analysis (DIA) of Scanning Electron Microscopy (SEM) photomicrographs of twenty-three samples. Although the results are presented in the context of dynamic modulus, the idea can be extended to understand static measurements as well.
Study Area
The study area, which is in present-day Oklahoma, was situated 10°–15° south of the paleo equator in the Mississippian epoch (359–323 Ma) (Lane and De Keyser, 1980; Blakey, 2013; Mazzullo et al., 2011). The Mississippian epoch was a transitional period moving from a greenhouse to an icehouse environmental condition that resulted in an overall regressive coastline (Buggisch et al., 2008; Haq and Schutter, 2008). This led to the development of an extensive east-west trending carbonate shelf on a shallow tropical epeiric sea over Devonian-age Woodford shale (Gutschick and Sandberg, 1983). The architecture of this shelf was dominated by both tectonism and higher-order eustatic sea-level changes resulting in high-frequency transgressive-regressive shallowing upward cycles (Childress and Grammer, 2015; Mazzullo et al., 2011; Watney et al., 2001). The shelf development ceased in the late Mississippian due to uplift and erosion associated with Gondwana and Euramerica collision. The Mississippian strata record a transition in composition from the shallow-water Miss Lime carbonates in the north (Watney et al., 2001) to deep-water mixed carbonate-siliciclastic sediments in the Anadarko and Ardmore basin in the south (Price et al., 2017). Currently, from north to south, several laterally and vertically varying proximal and distal facies comprising various permutations of limestones, chert, and silicified limestone with depositional and diagenetic pore systems are found with a gradation in grain size and mineral chemistry depending on their distance from the shoreline.
The Mississippian-age reservoirs are mainly sourced by the underlying Devonian-age Woodford shale and ultimately capped by the overlying Pennsylvanian-age transgressive shale. The core used in this study lies in the Meramec formation of the Sooner Trend Anadarko Canadian and Kingfisher (STACK) play in the Anadarko Basin. At the core location (Figure 1), the Meramec formation is located above the Devonian-age Woodford (Shale) formation and is overlain by Pennsylvanian-age shale units. Compositionally, the Meramec formation is a mixed carbonate-siliciclastic system with Φ in the range of 1–6% and permeability in the range of 0.1–10 mD (Almasoodi et al., 2020). The main reason why the Meramec formation is gaining popularity with the operators is its overpressured nature and low water content that resulting in high initial production (IP) rate (Chopra et al., 2018). The sustained production, such as in the other tight reservoirs, however, requires a detailed understanding of the pore architecture and connectivity.
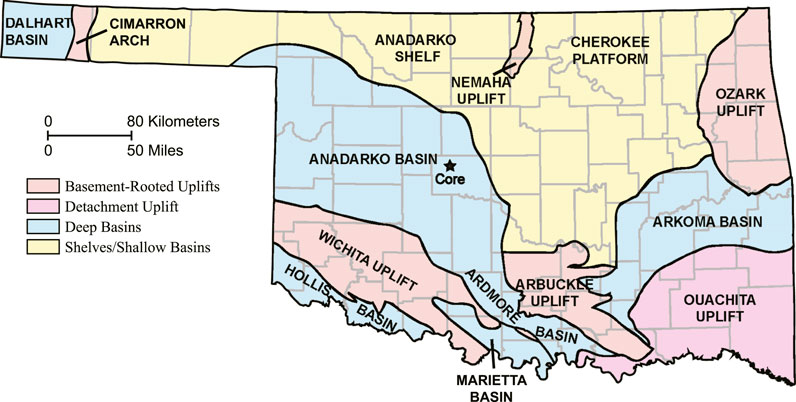
FIGURE 1. Base Map. Major geological features and county lines within the state boundary of Oklahoma are labeled (after Northcutt and Campbell, 1996). Solid star is the core location in Canadian County.
Dataset
The core used for this study is located in Canadian County, Oklahoma, and contained ∼152.5 m (500 ft) thick Meramec formation. First, the Meramec facies were interpreted. Then, within the access restrictions, 23 core plugs with 1.5-inch (3.8 cm) diameter and ∼2 in (5.1 cm) length were extracted ensuring that the key facies were adequately sampled. A small (∼0.5 cm) portion from one end was sawed and separated for XRD and SEM photomicrography, and the remainder of the core plug was used for ultrasonic transit-time measurement under loading and unloading conditions and ΦHe measurement using helium gas porosimetry.
Facies
In the core, the start and end of the Meramec formation was identified using color change from the bounding Devonian and the Pennsylvanian shales (LeBlanc, 2014; Vanden Berg and Grammer, 2016). Within the Meramec Formation, the facies interpretation was based on differences in texture, composition, sedimentary structures, trace fossils (MacEachern et al., 2009) and color (Geological Society of America, 1995). Three facies, hereafter referred to as A, B, and C, were dominant in the core (Figure 2). Facies A (Figure 2A) was laminated siltstone and had millimeter thick black dark brown mud rich and gray calcite-rich layering. It had scattered trace fossils with a variable abundance of brachiopods and crinoids. Facies B (Figure 2B) was a massive-bedded packstone-grainstone. It was grayish with a dominant massive-bedded structure and had abundant skeletal trace fossil fragments of brachiopods, crinoids, and peloids. Facies C (Figure 2C) was a hummocky cross-stratified and planar-laminated packstone-grainstone. It was darker than Facies B and was abundant in skeletal trace fossil fragments of brachiopods, crinoids, and peloids.
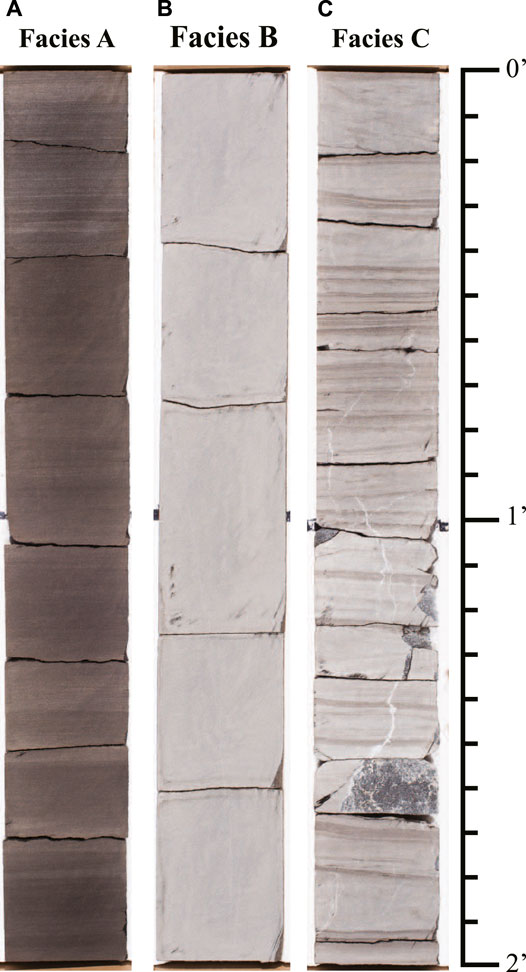
FIGURE 2. Facies. (A) A: mudstone to siltstone with scattered sedimentary features such as lamination, burrowing and bioturbations, (B) B: massive bedded packstone to grainstone, and (C) C: hummocky cross-stratified-planar laminated packstone to grainstone. Transitions From (A) to (C), facies represent a change from distal to proximal shelf depositional environment.
Photomicrographs
For DIA, a small portion from the 0.5 cm disk was cut and polished using a JEOL IB-19500 CP argon-ion mill machine. The ion-milled samples were kept in a vacuum for 2 h and sputter-coated with gold/palladium coating using a Balzers MED 010 machine for 20 s. The photomicrographs were captured with FEI Quanta 600F field emission SEM (Figure 3A). The photomicrographs were then analyzed in grayscale using the Leica’s Application Suite (LAS). Typically, pores and organic matters appear as darker features whereas grains appear as lighter features in SEM photomicrographs. At core location, it is unlikely to contain organic matter (Miller et al., 2019). So, whenever possible, as a rule of thumb, the darker features were interpreted as “pores” while the lighter features were considered as “grains” (Figure 3B). Occasionally, when the distinction of boundary between pores and grains was not obvious, coherency filters were used to make the parts of the image clearer. All photomicrographs were analyzed individually, and every step of DIA was carefully monitored to avoid imaging and interpretational artifacts.
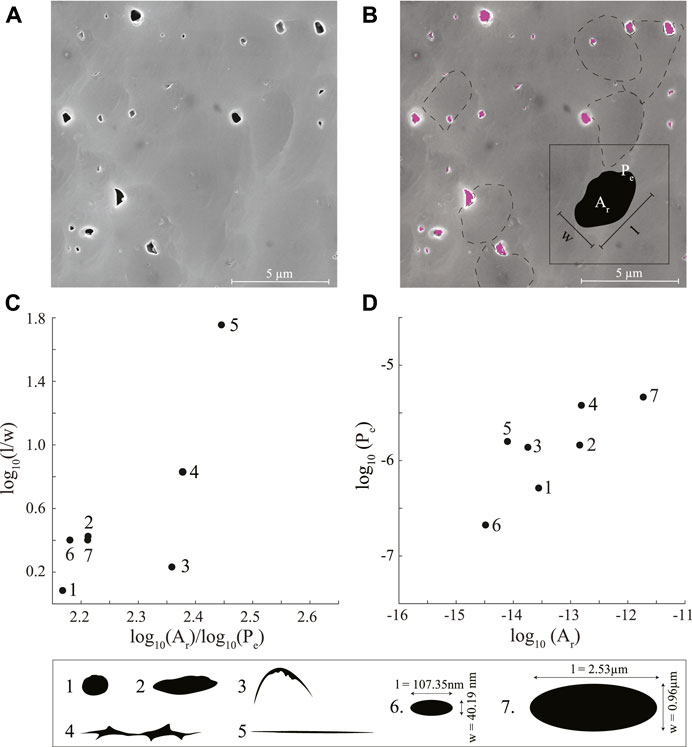
FIGURE 3. Digital Image Analysis (DIA). (A) Representative SEM photomicrograph, (B) same as (A) showing pores identified by DIA in solid color and grain boundaries in dashed line. Inset shows the cartoon of a pore and its architectural parameters, length [l], width [w], area [Ar] and perimeter [Pe], that are measured by DIA, (C) log10(Ar)/log10(Pe) vs. log10 (l/w), and (D) log10(Ar) vs. log10(Pe) crossplots for pores of different shapes and sizes numbered 1–7 shown in the lowest panel. Note that shapes are better resolved in (C) while sizes are better resolved in (D).
The software measured Pe, Ar, l and w of an individual pore in terms of pixels (inset; Figure 3B). All pixels along the periphery of a pore contributed to Pe, and all pixels lying within and on the pore-periphery contributed to Ar. The l and w of the pore were the length and width of a rectangle that tightly enclosed the pore. The spatial orientation of the rectangle was not relevant to the analysis in this paper. After counting the pixels, the software assigned a metric length or size to individual features using the magnification set by the user. In this application, 1.5 nm was heuristically set as the limit of resolution of the SEM photomicrographs, and features below this size were not interpreted. Finally, for every sample, a database with the architectural parameters of all the pores interpreted in its photomicrographs was created.
Ultrasonic VP
Transit times corresponding to P- and two independent orthogonally polarized S-waves were recorded for all core plugs in dry conditions using New England Research Autolab 1000. Saturated-rock measurements were not attempted because of the difficulties in ensuring that samples achieve a complete saturation. Each plug was inserted in a rubber sleeve before setting it between a transducer-receiver assembly. The entire assembly was then put inside a pressure chamber filled with mineral oil. The central frequency of the transducer generated wave signals was 1 MHz for both P- and S-waves. The confining pressure within the pressure chamber was systematically and gradually increased from 5 MPa to 40 MPa (loading) and then decreased to 5 MPa (unloading). Assuming a hydrostatic gradient of 3.102 kPa/ft (10.18 kPa/m), this pressure range was intended to mimic a burial depth from ∼1612 ft to ∼12,895 ft which encompassed the reservoir depth in the core of 10400–10900 ft (∼3170–3322 m). Transit times were recorded at 5, 10, 15, 20, 30, and 40 MPa in both segments (Figure 4A). Measurements at 30 MPa best corresponds to the reservoir conditions which, assuming a hydrostatic gradient, varied from 32.27 MPa to 33.81 MPa. First arrivals in the waveforms were picked manually and converted to velocities using the known sample dimension and instrument-related parameters (Figure 4B). The average uncertainty due to first arrival time picking of P-wave and S-waves were less than 1.25% and 2%, respectively. Only unloading cycle measurements are used in this paper following the common practice in the art where it is assumed that the loading cycle has permanently closed stress cracks that originated from the core first being exposed to the atmospheric conditions.
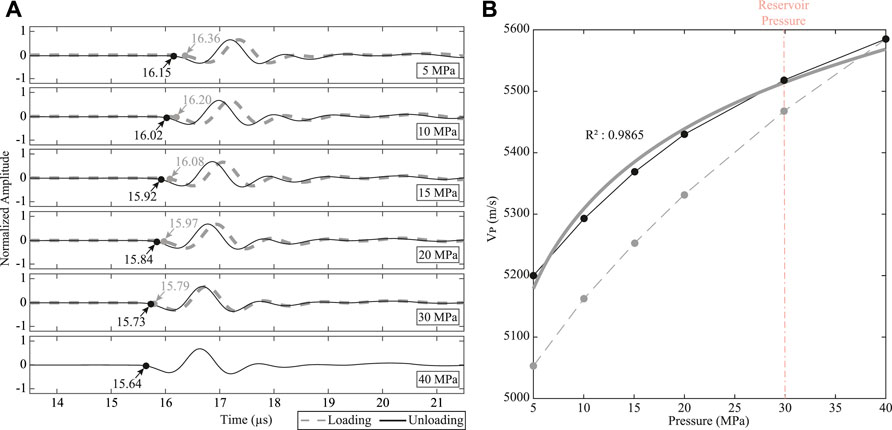
FIGURE 4. P-wave velocity (VP) estimation. (A) Representative ultrasonic waveforms for loading (dashed gray) and unloading (solid black) segments. The corresponding gray and black dots are the interpreted P-wave first arrival times, which are then converted to VP based on known sample length and instrument calibration constants. Confining pressures for individual waveforms are mentioned. (B) VP pressure sensitivity for loading (dashed gray) and unloading (solid black) segments. The thick gray line represents a function of the form VP(PC) = s + rP log10(PC) that is fit to the unloading cycle. For unloading segment of (A), a high correlation coefficient (R2 = 0.9865) is obtained. The process is repeated for P-, S1- and S2-waves for all 23 samples (Supplementary Figures S3–S14). A high value of rp implies a higher-pressure sensitivity.
He-gas Porosity
ΦHe measurement was done using a helium gas injection technique on all core plugs using an AccuPyc II 1340 Pycnometer. The pycnometer uses helium-gas displacement to measure solid phase volume. The instrument has a sample chamber and a precision chamber. The core plug was put first in a compartment of known volume, which was then placed in the sample chamber and sealed. Helium filled the sample chamber and equilibrated. The gas was then allowed to flow into the precision chamber and equilibrate. The pressure-drop as a result of discharge of helium-gas into the empty precision chamber from the sample chamber provides the solid phase volume. Before using the pycnometer, the bulk volume of the core plugs was estimated by measuring diameter and length with a vernier caliper. ΦHe is the ratio of the difference between the bulk and the solid phase volume and the bulk volume. Data are mentioned in Tables 1–3.

TABLE 1. Facies A sample properties.

TABLE 2. Facies B sample properties.

TABLE 3. Facies C sample properties.
Composition
Mineralogy was quantified using XRD. First, the samples were powdered in SPEX ball mill. Powdered samples were then analyzed in Rigaku MiniFlex Diffraction instrument. A quartz sample was used to calibrate the machine before analyzing any sample. Mineralogy was identified using standard Powder Diffraction File and quantified using Rietveld refinement scheme in RIQAS software. Data are tabulated in Tables 1–3.
Data Analysis
We had eleven samples in facies A, and six each in B and C, respectively. We fitted the unloading cycle of the P-wave with the following linear trend (Supplementary Figures S3–S6):
where s and rP are the intercept (measurement at 5 MPa) and gradient, respectively, and PC is confining pressure. For the purpose of this paper, rP represents the VP pressure sensitivity. Equation 1 could be fit to data from all samples with sufficiently high correlation (R2 > 0.95).
Contoured two-dimensional (2D) histograms were used to analyze the pore shape and size distribution for every sample. Two sets of plots were generated. The first set was along the lines of Figure 3C, which is a crossplots between log10Ar/log10Pe and log10(l/w), binned to best preserve the continuity of the distribution. A bin size of 20 was found to be optimal for this kind of plot. Visualizing data in this manner provided an overview of the pore-shape distribution without much regard to their size. Displaying the pore architectural parameters along the lines of Figure 3C was necessary to identify samples with excessive cracks and complex pores. Because these features strongly affect VP pressure sensitivity, it was necessary to discard such samples for this paper to avoid bias. Samples discarded using Figure 3C as a guide are shown in Supplementary Figure S2. This reduced the number of samples for further analysis to five in Facies A (Figure 5), five in Facies B (Figure 6), and four in Facies C (Figure 7). The second set of plots were along the lines of Figure 3D, which is a crossplots between log10Ar and log10Pe of the individual pores, binned to best preserve the continuity of the distribution, e.g., Raj et al. (2019). Visualizing data in this manner provided an overview of the pore-size distribution without much regards to the shape. A bin size of 15 was found to be optimal for this kind of plot.
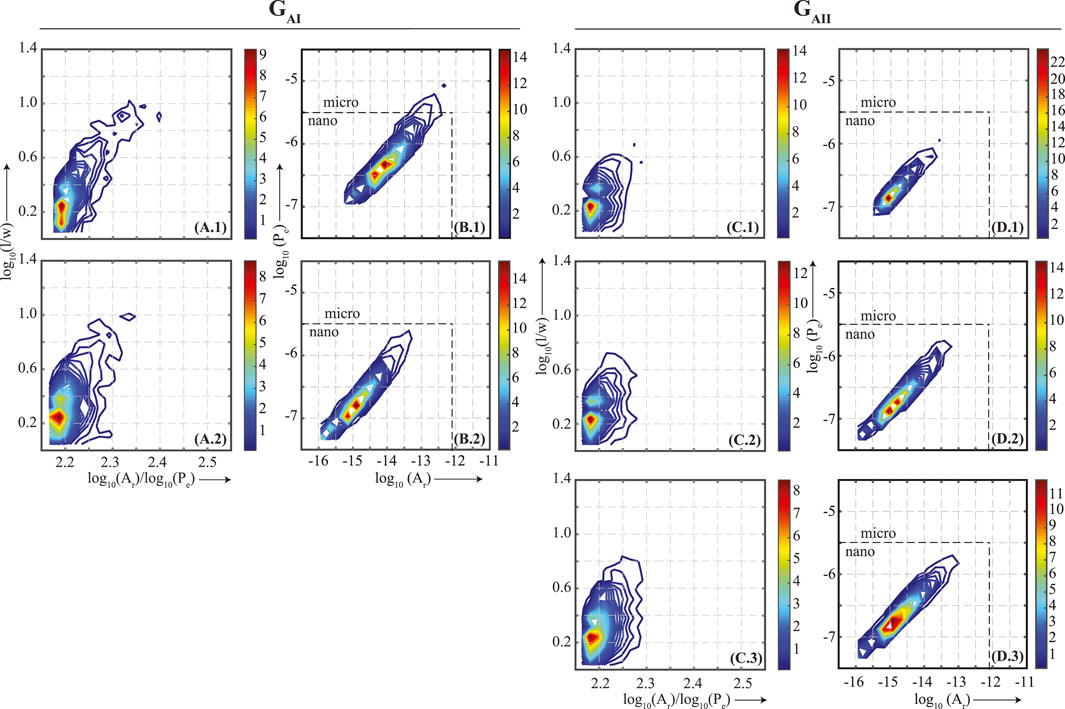
FIGURE 5. Facies A. Contoured histograms of pore l, w, Ar, and Pe are binned and plotted along the lines of Figure 3C to visualize pore-shape (A.1-2 and C.1–3) and Figure 3D to visualize pore-size (B.1-2 and D.1–3) distributions. Based on the pore-shape distribution, samples are classified into two groups, GAI (A.1-2 and B.1–2) and GAII (C.1-3 and D.1–3). In (A)–(D), warm color indicates higher pore population. In (B.1–2) and (D.1–3), a dashed line separates micro- (1–62.5 µm) and nano- (1 nm-1 µm) pores. Sample depth, porosity, composition and gradients for P- (rP), S1- (rS1) and S2- (rS2) waves are mentioned in the Table 1. The figure indicates that within the same pore-shape distribution, rP increases as the dominant pore-size decreases.
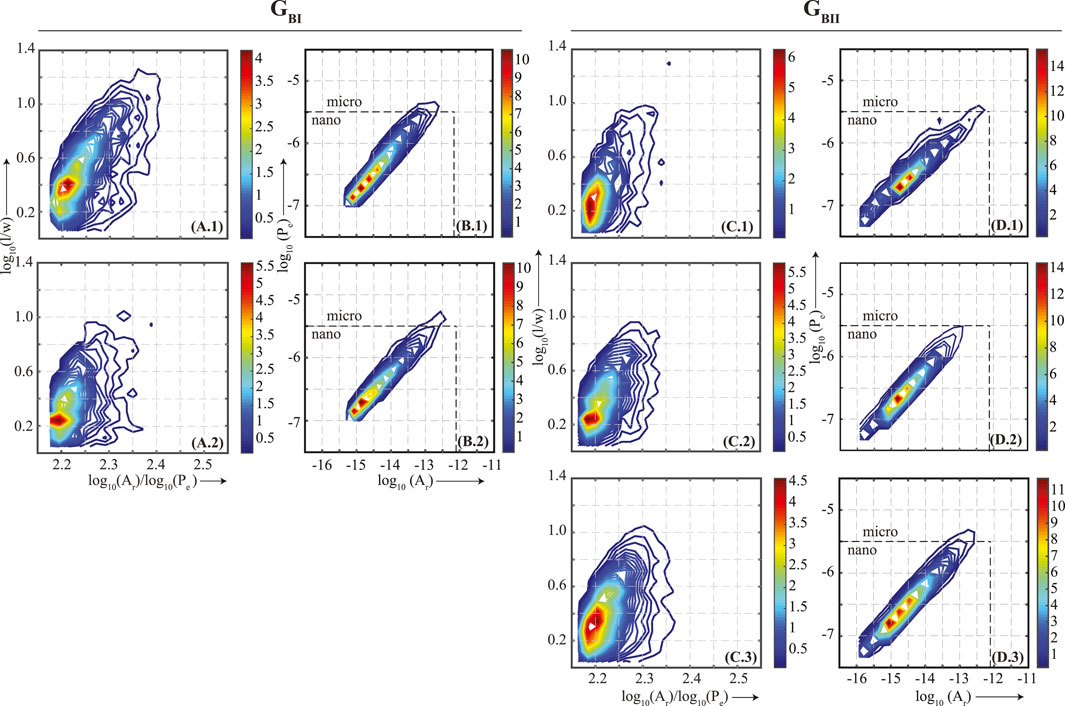
FIGURE 6. Facies B. Symbols and labels are the same as in Figure 5. Sample depth, porosity, composition and gradients for P- (rP), S1- (rS1) and S2- (rS2) waves are mentioned in the Table 2. The figure indicates that within the same pore-shape distribution, rP increases as the dominant pore-size decreases.
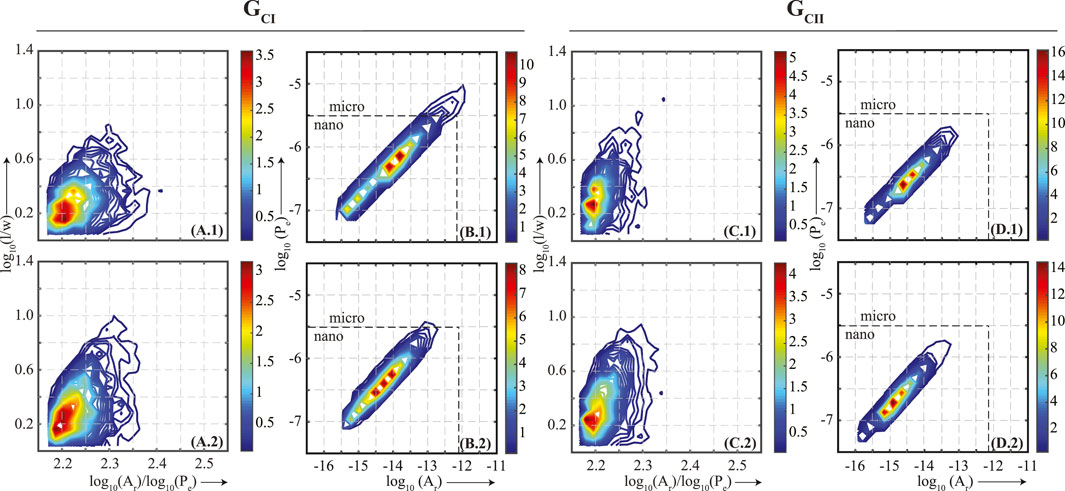
FIGURE 7. Facies C. Symbols and labels are the same as in Figure 5. Sample depth, porosity, composition and gradients for P- (rP), S1- (rS1) and S2- (rS2) waves are mentioned in the Table 3. The figure indicates that within the same pore-shape distribution, rP increases as the dominant pore-size decreases.
Raj et al. (2019) classified their samples first based on facies and then their composition. In this paper we use the pore-shape distribution instead of composition as the second criterion for two reasons. First, samples in this paper were not as compositionally diverse as Raj et al. (2019), and second, a peer study, Baechle et al. (2008), found that pore-shape rather than the composition may have a stronger influence on VP pressure sensitivity. Within each facies, broad pore-shape subgroups were identified and within each subgroup, samples were arranged in increasing order of rP.
In Facies A two pore-shape groups, GAI and GAII, were interpreted (Figure 5). Group GAI (Figures 5A.1, 5A.2) dominantly have pores with an aspect ratio ∼1.7 and a subset that extends into the complex and elongated domain with a pore aspect ratio of as much as up to 10. Group GAII (Figures 5C.1–C.3) dominantly have pores with an aspect ratio between ∼1.6 and an overall tendency of the pores to remain concentrated around this geometrical shape. The pore-size distribution plots for Group GAI (Figures 5B.1, 5B.2) show a decrease in the dominant pore size depicted by a shift in the warmest color as rP increases from 96.3 to 100.9. Changes in the pore-size distribution plots for Group GAII are more subtle. From Figure 5D.1 to Figure 5D.2, as rP increase from 62.0 to 107.9, the dominant size does not change as much, e.g., the dominant pore size maintains its location, but the pore population includes more pores that are smaller than the smallest pore in Figure 5D.1. Likewise, From Figure 5D.2 to Figure 5D.3, as rP increase from 107.9 to 114.7, the overall distribution does not change but the dominant pore size becomes more pronounced.
In Facies B two pore-shape groups, GBI and GBII, are interpreted (Figure 6). Group GBI (Figures 6A.1, 6A.2) dominantly have pores with an aspect ratio between ∼1.8 and ∼2.5 and a subset that extends into the complex and elongated domain with a pore aspect ratio of as much as up to 16. Group GBII (Figures 6C.1–C.3) dominantly have pores with an aspect ratio between ∼1.7 and ∼2.3 and an overall tendency of the pores to remain concentrated around this geometrical shape with a pore aspect ratio below 10. The pore-size distribution plots for Group GBI (Figures 6B.1, 6B.2) show an overall decrease in the dominant pore size without much change in the pore-size distribution as rP increases from 159.4 to 236.6. Changes in the dominant pore-size distribution for Group GBII are more obvious although the overall pore-size distribution itself does not change much. From Figure 6D.1 to Figure 6D.2, as rP increase from 87.4 to 187.5, the dominant pore size shift toward smaller size and becomes more pronounced. Likewise, from Figure 6D.2 to Figure 6D.3, as rP increase from 187.5 to 200.0, the dominant pore size shifts toward the smaller size.
In Facies C as well, two pore-shape groups, GCI and GCII, are interpreted (Figure 7). Group GCI (Figures 7A.1, 7A.2) dominantly have pores with an aspect ratio ∼1.4 and an overall tendency of the pores to remain concentrated around this geometrical shape with an aspect ratio below 6.5. Group GCII (Figures 7C.1, 7C.2) dominantly have pores with aspect ratio ∼1.9 and an overall tendency of the pores to remain concentrated around this geometrical shape with pore aspect ratio below 10. The pore-size distribution plots for Group GCI (Figures 7B.1, 7B.2) show a decrease in the dominant pore size as rP increase from 112.4 to 243.4. Likewise, changes in the dominant pore-size distribution for Group GCII are also more obvious. From Figure 7D.1 to Figure 7D.2, as rP increase from 55.9 to 73.9, the dominant pore size shift toward smaller size and becomes more pronounced. In Facies C, the effect of dominant pore size is more pronounced for both the groups.
Thus, at the core of this paper was examining how pore-size distribution affects VP pressure sensitivity in samples that have a similar pore-shape distribution. Overall, Figures 5–7, suggest within the same pore-shape distribution the VP pressure sensitivity increased as the dominant pore size decreased regardless of composition and ΦHe.
DISCUSSION
Photomicrograph Attributes
Of all measurements performed for this paper, using DIA to quantify the pore-size distribution was the most challenging. When pores are fully connected, ΦHe and pore-size distribution down to nano-scale can be realized through porosimetry or pulse decay methods (Anovitz and Cole, 2015). Regardless of the connectivity, when pores are large (micro- and greater), micro-computerized-tomography scanning can provide a sense of its architecture (Dong and Blunt, 2009). Imaging becomes increasingly more difficult as pores get smaller and isolated. For nanopores, such as the subject of this paper, direct visualization can only be obtained through SEM in 2D or Focused Ion Beam SEM in 3D. However, because of the small sample size (1–2 mm) representativeness of the pore size and distribution plots, e.g., Figures 5–7, is always in question. Determining what fraction of the imaged pores are connected and if so to what extent and whether they behave similarly outside the sample under investigation is interpretive but due to the intensity of the data collection process, inferences have to be made on a limited number of samples. Emerging studies (Dvorkin et al., 2011; Dvorkin and Derzhi, 2012; Andrä et al., 2013; Karimpouli and Tahmasebi, 2016; Berg et al., 2017) have shown that even with limited sampling, an interpreter’s experience and judgement can allow extracting dependable results from DIA.
Nanopores and VP
Neither Raj et al. (2019) nor their peer provided a reason as to why the dominant pore-size should affect VP, although Raj et al. (2019) did observe that the nanopore size (10−9–10–6 m) is in the range of strain amplitude caused by P-wave at ultrasonic frequency. Using a set of synthetic carbonate samples, Wang et al. (2015) have previously suggested that it is the dominant wavelength of the propagating wave that decides how pore-size influences the wave velocity. Results in this paper provide opportunities to explore an additional factor. Along with the P-wave arrival times, the authors measured two orthogonal S-wave arrival times under the same confining pressures. Using an equation similar to Equation 1, VS pressure sensitivity was also computed and the corresponding gradients, rS1 and rS2, are mentioned in Tables 1–3. Fitting of VS data is shown in Supplementary Figures S7–S14. Figures 5–7 and Tables 1–3 show that unlike their VP counterparts, VS pressure sensitivity does not have any obvious correspondence to the dominant pore size. Because S- and P-wave frequencies in the experiment were same, one could argue that if pressure sensitivity is only a pore-size compounded with wavelength phenomenon, VS pressure sensitivity should have reflected the same trend as VP pressure sensitivity. Because S-waves are largely transparent to fluids, the VP pressure sensitivity may therefore be due to pore fluids. The reader is reminded that the experiment being conducted in dry conditions imply that pores are air-filled.
Size Effects
For discussion, consider pores as void spaces devoid of any inherent physical property. Consequently, its compressibility is essentially the aggregate compressibility of the mineral grains surrounding it in addition to how tightly the grains fit into each other. In a scenario where grains fit seamlessly around the pore, the distortion of the grains under static or harmonic pressure changes is manifested as the distortion of the pore itself, which in turn stimulates the trapped pore fluid. For an isolated pore at constant temperature, how the bulk modulus of trapped fluid changes can be understood to the first order of approximation using the ideal gas equation as follows:
where -V(dP/dV) is the same as K. According to Eqs 2–4, K remains proportional to the pore pressure, which, in turn, is the same as the confining pressure under isothermal conditions. Thus, in principle, the bulk modulus of fluids trapped in an isolated pore will increase with an increase in confining pressure. The effect should be more pronounced in compliant pores. A stiff pore may not display the same phenomenon. Regardless, this explains one way through which VP can increase in presence of isolated pores. However, it does not explain why VP sensitivity will increase with decreasing pore size unless one assumes that the smaller the pore, the more likely it is to occur in isolation. In the Meramec formation, this is like. Processes such as cementation, carbonate pressure dissolution, and clay diagenesis that remain active throughout the burial history can create isolated pores that are independent of the pore network created during sedimentation or even fractures from subsequent tectonics. In the Mississippian-age rocks of the study area, such processes have been widely recorded (Vanden Berg and Grammer, 2016; Vanden Berg et al., 2018; Bode et al., 2019).
Two factors might together be contributing to the observed increase in VP pressure sensitivity with decreasing pore size. The primary factor might not directly be the size itself. The smaller pore size in the Meramec formation might imply a greater probability of the pore remaining isolated. Figures 3A,B, suggest presence of both intercrystalline and intracrystalline isolated pores in the Meramec formation. It is understood that a number of interpreted pores in Figures 3A,B maybe connected in the third dimension. Regardless, stress from static loading can localize along the grain boundaries and can readily strain the isolated intercrystalline pores increasing the bulk moduli of the trapped fluids. Likewise, the intracrystalline isolated pores in soft grains such as that of clay and organic matter, can also get strained from static loading. Wave propagation through a “stiffer” fluid would manifests as high VP. The second factor might be the investigation tool itself, which creates particle displacements in the nanopore range (10–6–10–8 m; O'Sullivan et al., 2016; Nourifard and Lebedev, 2019). When ultrasonic waves traverse a pore larger than the strain amplitude, different parts of the pore would get distorted at different instances. On the other hand, smaller pores are expected to be compressed (or dilated) in their entirety at the same instance. Thus, a nanopore dominated system such as the Meramec formation might just be best displaying the effect of the fluid bulk-moduli increase due to static loading on VP. Because the strain amplitude remains comparable across a wide range of seismic frequencies (Hz–MHz), the effect of isolated pores on VP in the Meramec formation might be observable in logs and surface seismic.
Dual-Fluid Model
Independent research exploring fluid behavior in nanopores also exists which is worth reviewing. Gor et al. (2015) and Dobrzanski et al. (2018) have argued that the thermodynamic behavior of fluids trapped in nanopores may be different than the same fluids in the bulk. Like in this paper, they have found that the bulk modulus of the fluid increases as the pore size decreases. However, the experimental confirmation of the theoretical development in these initiatives was done using tools and techniques that are similar to this study. Thus, it may not be unfair to say that whether fluid thermodynamics at the nanoscale is fundamentally different or it manifests differently due to the investigation tool (seismic), could remain an open-ended question.
If indeed VP sensitivity is due to fluids in unconnected pores, the next obvious question is how to include the fluid effect in numerical models. In unstressed rocks, the fluid-solid and fluid-fluid particle interactions during elastic wave propagation can be accounted for through two end-member frameworks: a) Biot’s, where pores vibrate but do not distort (Biot, 1956a; Biot, 1956b); and b) squirt flow, where pores undergo harmonic deformation (Dvorkin et al., 1994; Dvorkin et al., 1995). Both end-members assume complete pore connectivity. As long as pore connectivity is maintained, Biot’s equation can also be adjusted for pre-stressed conditions (Gutierrez and Lewis, 2002). Fluids in unconnected pores are not accounted for directly. In Biot’s framework, unconnected pores are part of the solid matrix, e.g., like a separate grain. In other popular models such as differential effective medium, self-consistent, and Kuster-Toksöz, pores are treated as inclusions with specific geometries within a background matrix (Mavko et al., 2020). Models for unconnected pores consider pore shapes to remain unchanged and the pore-fluids to remain immobile during the elastic wave propagation.
To include VP pressure sensitivity in numerical models, the paper proposes the use of a dual-fluid model where a part of the porosity, e.g., the microporosity, may be seen as isolated containers filled with compressible fluids vs. the rest of the rock that is filled with incompressible fluid. The idea build along the lines of dual-porosity (Pride and Berryman, 2003a; Pride and Berryman, 2003b) and dual stiffness (Liu et al., 2009; Zhao and Liu, 2012) models, but does not require partitioning the pore topology or strain explicitly. In the proposed model, the pore fluid would be separated into a compressible and an incompressible part. The K of the compressible part would remain proportional to the confining pressure while K of the incompressible part would remain unchanged. The proposed model can be implemented within existing frameworks such as Biot’s and differential effective medium to explain the behavior of the same rock at different confining pressure and might provide a graceful way of accounting for microporosity whose presence is known to quintessentially enhance VP pressure sensitivity in both static and dynamic experiments.
Conclusions
Using a set of 23 samples belonging to a vertical core from the Mississippian-age mixed carbonate-siliciclastic Meramec formation, this study found that the dry-frame VP pressure sensitivity can depend on pore shape and size distribution. In the study, these distributions were obtained by first measuring Pe, Ar, l, and w of the individual pores through DIA of SEM photomicrographs and then displaying them as 2D histograms of Ar/Pe–l/w and Ar-Pe crossplots. The parameter representing VP pressure sensitivity was obtained by first measuring the P-wave transit times at ultrasonic frequencies under a 5–40 MPa loading and unloading cycle and then fitting a line to the data from the unloading cycle linearized in the log scale. In samples within the same facies that had a similar pore-shape distribution, VP increased more rapidly with confining pressure as the dominant pore-size, which was in the nanopore range, decreased. The phenomenon was largely independent of composition and ΦHe and only applicable to samples that did not have excessive amounts of cracks and complex pores. The observation is explained by postulating that the pores were mostly isolated at the nanopore scale and an increase in confining stress increased the bulk moduli of the trapped fluids, which in turn increased the VP. The paper concludes that, in the Meramec formation, a) the likelihood of pores becoming isolated became higher as their size decreases, b) VP pressure sensitivity was a function of fluid (air) behavior in isolated pores, and c) the effect was prominent because a nanopore dominated system (<10–6 μm) was being investigated by frequencies that had comparable strain amplitudes. The study proposes incorporating this effect numerically through a dual-fluid model where fluids in the isolated pores are considered compressible while the remaining are considered incompressible. Results start to explain the common observation of why presence of microporosity quintessentially increases VP pressure sensitivity.
Data Availability Statement
Core belongs to Devon Energy Corporation. For access permissions as of 12/2020, contact: Aubrey Humbolt (Aubrey.Humbolt@dvn.com). DIA data and sonic waveforms can be obtained with permission from the authors.
Author Contributions
This study is a part of RR’s PhD dissertation. PJ mentored RR in conceptualizing the paper, analyzing the data and presenting the results. YW interpreted facies. GMG oversaw the sample preparation for SEM. RW oversaw He-gas porosity and ultrasonic velocity measurements.
Funding
Data and funding for the lead student author was provided by Devon Energy Corporation, Oklahoma City, OK, United States.
Conflict of Interest
The authors declare that this study received funding from Devon Energy Corporation. The funder was not involved in the study design, collection, analysis, interpretation of data, the writing of this article or the decision to submit it for publication.
Acknowledgments
Winton Cornell (retired), the University of Tulsa, helped with XRD. SEM imagery was generated at Oklahoma State University Microscopy Laboratory. This is Boone Pickens School of Geology contribution number 2021-120.
Supplementary Material
The Supplementary Material for this article can be found online at: https://www.frontiersin.org/articles/10.3389/feart.2021.641815/full#supplementary-material.
References
Almasoodi, M., Vaidya, R., and Reza, Z. (2020). Drawdown-management and fracture-spacing optimization in the Meramec formation: numerical-and economics-based approach. SPE Reserv. Eval. Eng. 23 (4), 1251–1264. doi:10.2118/201245-pa
Andrä, H., Combaret, N., Dvorkin, J., Glatt, E., Han, J., Kabel, M., et al. (2013). Digital rock physics benchmarks-part II: computing effective properties. Comput. Geosci. 50, 33–43. doi:10.1016/j.cageo.2012.09.008
Angerer, E., Crampin, S., Li, X.-Y., and Davis, T. L. (2002). Processing, modelling and predicting time-lapse effects of overpressured fluid-injection in a fractured reservoir. Geophys. J. Int. 149 (2), 267–280. doi:10.1046/j.1365-246x.2002.01607.x
Anovitz, L. M., and Cole, D. R. (2015). Characterization and analysis of porosity and pore structures. Rev. Mineral. Geochem. 80 (1), 61–164. doi:10.2138/rmg.2015.80.04
Asef, M. R., and Najibi, A. R. (2013). The effect of confining pressure on elastic wave velocities and dynamic to static Young's modulus ratio. Geophysics 78 (3), D135–D142. doi:10.1190/geo2012-0279.1
Ba, J., Cao, H., Yao, F., Nie, J., and Yang, H. (2008). Double-porosity rock model and squirt flow in the laboratory frequency band. Appl. Geophys. 5 (4), 261–276. doi:10.1007/s11770-008-0036-0
Baechle, G. T., Colpaert, A., Eberli, G. P., and Weger, R. J. (2008). Effects of microporosity on sonic velocity in carbonate rocks. Leading Edge 27 (8), 1012–1018. doi:10.1190/1.2967554
Batzle, M. L., Han, D.-H., and Hofmann, R. (2006). Fluid mobility and frequency-dependent seismic velocity - direct measurements. Geophysics 71 (1), N1–N9. doi:10.1190/1.2159053
Berg, C. F., Lopez, O., and Berland, H. (2017). Industrial applications of digital rock technology. J. Pet. Sci. Eng. 157, 131–147. doi:10.1016/j.petrol.2017.06.074
Biot, M. A. (1973). Nonlinear and semilinear rheology of porous solids. J. Geophys. Res. 78 (23), 4924–4937. doi:10.1029/jb078i023p04924
Biot, M. A. (1956a). Theory of propagation of elastic waves in a fluid‐saturated porous solid. I. Low‐Frequency range. J. Acoust. Soc. america 28 (2), 168–178. doi:10.1121/1.1908239
Biot, M. A. (1956b). Theory of propagation of elastic waves in a fluid‐saturated porous solid. II. Higher frequency range. J. Acoust. Soc. america 28 (2), 179–191. doi:10.1121/1.1908241
Blakey, R. C. (2013). Paleogeography and geologic evolution of North America. Phoenix, AZ: Colorado Plateau Geosystems, Inc.
Bode, I. Y., Zhang, C., Vanden Berg, B., and Grammer, G. M. (2019). Multiscale imaging and nuclear magnetic resonance pore characterization in unconventional carbonate mudrocks of the southern midcontinent (USA): Mississippi Lime play. SEPM (Soc. Sediment. Geolo.) 18 (2), 196–219. doi:10.2110/sepmsp.112.11
Buggisch, W., Joachimski, M. M., Sevastopulo, G., and Morrow, J. R. (2008). Mississippian δ13Ccarb and conodont apatite δ18O records—their relation to the Late Palaeozoic Glaciation. Palaeogeogr. Palaeoclimatol. Palaeoecol. 268 (3-4), 273–292. doi:10.1016/j.palaeo.2008.03.043
Childress, M., and Grammer, G. M. (2015). High resolution sequence stratigraphic architecture of a Mid-Continent Mississippian outcrop in Southwest Missouri. Available at: https://hdl.handle.net/11244/33395.
Chopra, S., Sharma, R. K., and Keay, J. (2018). SCOOP and STACK inversion case studies. SEG Tech. Program Expanded Abstr. Soc. Explor. Geophys. 2018, 3392–3396. doi:10.1190/segam2018-2997345.1
Darling, T., TenCate, J., Brown, D., Clausen, B., and Vogel, S. (2004). Neutron diffraction study of the contribution of grain contacts to nonlinear stress‐strain behavior. Geophys. Res. Lett. 31, L16604. doi:10.1029/2004gl020463
Darot, M., and Reuschlé, T. (2000). Effect of pore and confining pressures on VPin thermally pre-cracked granites. Geophys. Res. Lett. 27 (7), 1057–1060. doi:10.1029/1999gl008414
David, E., and Zimmerman, R. W. (2012). Pore structure model for elastic wave velocities in fluid‐saturated sandstones. J. Geophys. Res. Solid Earth 117 (B7), B07210. doi:10.1029/2012jb009195
Davis, T., Healy, D., Bubeck, A., and Walker, R. (2017). Stress concentrations around voids in three dimensions: the roots of failure. J. Struct. Geol. 102, 193–207. doi:10.1016/j.jsg.2017.07.013
de Oliveira, G. L. P., Ceia, M. A. R., Missagia, R. M., Archilha, N. L., Figueiredo, L., Santos, V. H., et al. (2016). Pore volume compressibilities of sandstones and carbonates from Helium porosimeter measurements. J. Pet. Sci. Eng. 137, 185–201. doi:10.1016/j.petrol.2015.11.022
Dobrzanski, C. D., Maximov, M. A., and Gor, G. Y. (2018). Effect of pore geometry on the compressibility of a confined simple fluid. J. Chem. Phys. 148 (5), 054503. doi:10.1063/1.5008490
Dong, H., and Blunt, M. J. (2009). Pore-network extraction from micro-computerized-tomography images. Phys. Rev. E Stat. Nonlin Soft Matter Phys. 80 (3), 036307. doi:10.1103/PhysRevE.80.036307
Dvorkin, J., Derzhi, N., Diaz, E., and Fang, Q. (2011). Relevance of computational rock physics. Geophysics 76 (5), E141–E153. doi:10.1190/geo2010-0352.1
Dvorkin, J., and Derzhi, N. (2012). Rules of upscaling for rock physics transforms: composites of randomly and independently drawn elements. Geophysics 77 (3), WA129–WA139. doi:10.1190/geo2011-0268.1
Dvorkin, J., Mavko, G., and Nur, A. (1995). Squirt flow in fully saturated rocks. Geophysics 60 (1), 97–107. doi:10.1190/1.1443767
Dvorkin, J., Nolen‐Hoeksema, R., and Nur, A. (1994). The squirt‐flow mechanism: macroscopic description. Geophysics 59 (3), 428–438. doi:10.1190/1.1443605
Eberhart-Phillips, D., Han, D.-H., and Zoback, M. (1989). Empirical relationships among seismic velocity, effective pressure, porosity, and clay content in sandstone. Geophysics 54 (1), 82–89. doi:10.1190/1.1442580
Fjær, E. (2019). Relations between static and dynamic moduli of sedimentary rocks. Geophys. Prospect. 67 (1), 128–139. doi:10.1111/1365-2478.12711
Fjær, E., Stroisz, A. M., and Holt, R. M. (2013). Elastic dispersion derived from a combination of static and dynamic measurements. Rock Mech. Rock Eng. 46 (3), 611–618. doi:10.1007/s00603-013-0385-8
Fredrich, J. T., Greaves, K. H., and Martin, J. W. (1993). “Pore geometry and transport properties of Fontainebleau sandstone,” in Proceedings international journal of rock mechanics and mining sciences & geomechanics abstracts1993, Great Britain, December 1993; (Elsevier), 691–697.
Freund, D. (1992). Ultrasonic compressional and shear velocities in dry clastic rocks as a function of porosity, clay content, and confining pressure. Geophys. J. Int. 108 (1), 125–135. doi:10.1111/j.1365-246x.1992.tb00843.x
Gor, G. Y., Siderius, D. W., Rasmussen, C. J., Krekelberg, W. P., Shen, V. K., and Bernstein, N. (2015). Relation between pore size and the compressibility of a confined fluid. J. Chem. Phys. 143 (19), 194506. doi:10.1063/1.4935430
Gutierrez, M. S., and Lewis, R. W. (2002). Coupling of fluid flow and deformation in underground formations. J. Eng. Mech. 128 (7), 779–787. doi:10.1061/(asce)0733-9399(2002)128:7(779)
Gutschick, R. C., and Sandberg, C. A. (1983). “Mississippian continental margins of the conterminous United States,” in The Shelfbreak: Critical Interface on Continental Margins. Editor D Jean Stanley, and G. T. Moore. (Tulsa, Oklahoma: Society of Economic Paleontologists and Mineralogists).
Han, T., Gurevich, B., Pervukhina, M., Clennell, M. B., and Zhang, J. (2016). Linking the pressure dependency of elastic and electrical properties of porous rocks by a dual porosity model. Geophys. J. Int. 205 (1), 378–388. doi:10.1093/gji/ggw019
Haq, B. U., and Schutter, S. R. (2008). A chronology of Paleozoic sea-level changes. Science 322 (5898), 64–68. doi:10.1126/science.1161648
Hart, D. J., and Wang, H. F. (1995). Laboratory measurements of a complete set of poroelastic moduli for Berea sandstone and Indiana limestone. J. Geophys. Res. 100 (B9), 17741–17751. doi:10.1029/95jb01242
Karimpouli, S., and Tahmasebi, P. (2016). Conditional reconstruction: an alternative strategy in digital rock physics. Geophysics 81 (4), D465–D477. doi:10.1190/geo2015-0260.1
Kirstetter, O., and MacBeth, C. (2001). Compliance-based interpretation of dry frame pressure sensitivity in shallow marine sandstone. SEG Tech. Program Expanded Abstr. 2001 Soc. Exploration Geophys. 2001, 2132–2135. doi:10.1190/1.1816572
Kitamura, K., Takahashi, M., Mizoguchi, K., Masuda, K., Ito, H., and Song, S. R. (2010). Effects of pressure on pore characteristics and permeability of porous rocks as estimated from seismic wave velocities in cores from TCDP Hole-A. Geophys. J. Int. 182 (3), 1148–1160. doi:10.1111/j.1365-246x.2010.04694.x
Lane, H. R., and De Keyser, T. (1980). “Paleogeography of the late Early Mississippian (Tournaisian 3) in the central and southwestern United States,” in Paleozoic Paleogeography of the West-Central United States. Editors T. D. Fouch, and E. R. Magathan (Denver, Colorado: Rocky Mountain Symposium 1: Rocky Mountain Section SEPM), 149–162.
LeBlanc, S. L. (2014). High resolution sequence stratigraphy and reservoir characterization of the “Mississippian Limestone” in north-central Oklahoma. Oklahoma: Oklahoma State University, ProQuest Dissertations Publishing.
Liu, E., Hudson, J. A., and Pointer, T. (2000). Equivalent medium representation of fractured rock. J. Geophys. Res. 105 (B2), 2981–3000. doi:10.1029/1999jb900306
Liu, H.-H., Rutqvist, J., and Berryman, J. G. (2009). On the relationship between stress and elastic strain for porous and fractured rock. Int. J. Rock Mech. Mining Sci. 46 (2), 289–296. doi:10.1016/j.ijrmms.2008.04.005
MacEachern, J. A., Bann, K. L., Gingras, M. K., and Pemberton, S. G. (2009). Applied Ichnology, Short Course Notes 52: SEPM. Tulsa: OklahomaSociety for Sedimentary Geology), 380.
Martínez-Martínez, J., Benavente, D., and García-del-Cura, M. A. (2012). Comparison of the static and dynamic elastic modulus in carbonate rocks. Bull. Eng. Geol. Environ. 71 (2), 263–268. doi:10.1007/s10064-011-0399-y
Mashinsky, E. (2003). Differences between static and dynamic elastic moduli of rocks. Phys. Causes Russ. Geology. Geophys. 44 (9), 953–959.
Mavko, G., Mukerji, T., and Dvorkin, J. (2020). The rock physics handbook. 2nd Edn. Cambridge, England: Cambridge University Press.
Mazzullo, S. J., Wilhite, B. W., and Boardman, D. R. (2011). Lithostratigraphic architecture of the Mississippian reeds spring formation (middle Osagean) in southwest Missouri, northwest Arkansas, and northeast Oklahoma: outcrop analog of subsurface petroleum reservoirs. Shale Shaker. 61 (5), 254–269.
Miller, J. C., Pranter, M. J., and Cullen, A. B. (2019). Regional stratigraphy and organic richness of the Mississippian Meramec and associated strata. Central Oklahoma: Anadarko Basin.
Morgenstern, N. R., and Tamuly Phukan, A. L. (1969). Non-linear stress-strain relations for a homogeneous sandstone. Int. J. Rock Mech. Mining Sci. Geomech. Abstr. 6, 127–142. doi:10.1016/0148-9062(69)90031-x
Muqtadir, A., Al‐Dughaimi, S., and Dvorkin, J. (2020). Deformation of granular aggregates: static and dynamic bulk moduli. J. Geophys. Res. Solid Earth 125 (1), e2019JB018604. doi:10.1029/2019jb018604
Northcutt, R. A., and Campbell, J. A. (1996). “Geologic provinces of Oklahoma,” in Basement Tectonics 12.Proceedings of the International Conferences on Basement Tectonics. Editors J. P. Hogan, and M. C. Gilbert (Berlin, Germany: Springer, Dordrecht), vol 6.
Nourifard, N., and Lebedev, M. (2019). Research note: the effect of strain amplitude produced by ultrasonic waves on its velocity. Geophys. Prospecting 67 (4), 715–722. doi:10.1111/1365-2478.12674
Nur, A., and Simmons, G. (1969). The effect of saturation on velocity in low porosity rocks. Earth Planet. Sci. Lett. 7 (2), 183–193. doi:10.1016/0012-821x(69)90035-1
O'Sullivan, C., O'Donovan, J., Ibraim, E., Hamlin, S., Muir Wood, D., and Marketos, G. (2016). Micromechanics of seismic wave propagation in granular materials. Berlin, Germany: Springer.
Prasad, M., and Manghnani, M. H. (1997). Effects of pore and differential pressure on compressional wave velocity and quality factor in Berea and Michigan sandstones. Geophysics 62 (4), 1163–1176. doi:10.1190/1.1444217
Price, B., Haustveit, K., and Lamb, A. (2017). “Influence of stratigraphy on barriers to fracture growth and completion optimization in the Meramec stack play, Anadarko basin, Oklahoma,” in Proceedings unconventional resources technology conference, 24-26 July 2017; Austin, Texas Editors T. Blasingame, S. Maxwell, and D. Valleau. (Austin, Texas: Society of Exploration Geophysicists, American Association of Petroleum), 3453–3460.
Pride, S. R., and Berryman, J. G. (2003a). Linear dynamics of double-porosity dual-permeability materials. I. Governing equations and acoustic attenuation. Phys. Rev. E Stat. Nonlin Soft Matter Phys. 68 (3), 036603. doi:10.1103/PhysRevE.68.036603
Pride, S. R., and Berryman, J. G. (2003b). Linear dynamics of double-porosity dual-permeability materials. II. Fluid transport equations. Phys. Rev. E Stat. Nonlin Soft Matter Phys. 68 (3), 036604. doi:10.1103/PhysRevE.68.036604
Pyrak-Nolte, L., and Morris, J. (2000). Single fractures under normal stress: the relation between fracture specific stiffness and fluid flow. Int. J. Rock Mech. Mining Sci. 37 (1-2), 245–262. doi:10.1016/s1365-1609(99)00104-5
Pyrak-Nolte, L. J., Myer, L. R, and Cook, N. G. W (1990). Transmission of seismic waves across single natural fractures. J. Geophys. Res. 95 (B6), 8617–8638. doi:10.1029/JB095iB06p08617
Raj, R., Jaiswal, P., Vanden Berg, B., and Grammer, G. M. (2019). Pore size and ultrasonic velocity: lessons from Miss Lime reservoirs. SEPM (Society for Sedimentary Geology) 18 (2), 183–195. doi:10.2110/sepmsp.112.04
Robin, P. Y. F. (1973). Note on effective pressure. J. Geophys. Res. 78 (14), 2434–2437. doi:10.1029/jb078i014p02434
Vanden Berg, B., and Grammer, G. M. (2016). 2-D pore architecture characterization of a carbonate mudrock reservoir: insights from the mid-continent “Mississippi Lime”,” in Imaging Unconventional Reservoir Pore Systems. Editor T. Olson (Oklahoma: American Association of Petroleum Geologists), 185–231. doi:10.1306/13592022M1123698
Vanden Berg, B., Nussbaumer, C., Noack, A., Thornton, J., Weger, R. J., Eberli, G. P., et al. (2018). A comparison of the relationship between measured acoustic response and porosity in carbonates across different geologic periods, depositional basins, and with variable mineral composition. Interpretation 6 (2), T245–T256. doi:10.1190/int-2017-0108.1
Vanorio, T., Nur, A., and Ebert, Y. (2011). Rock physics analysis and time-lapse rock imaging of geochemical effects due to the injection of CO2 into reservoir rocks. Geophysics 76 (5), O23–O33. doi:10.1190/geo2010-0390.1
Vanorio, T. (2015). Recent advances in time-lapse, laboratory rock physics for the characterization and monitoring of fluid-rock interactions. Geophysics 80 (2), WA49–WA59. doi:10.1190/geo2014-0202.1
Wang, Z., Wang, R., Wang, F., Qiu, H., and Li, T. (2015). Experiment study of pore structure effects on velocities in synthetic carbonate rocks. Geophysics 80 (3), D207–D219. doi:10.1190/geo2014-0366.1
Watney, W. L., Guy, W. J., and Byrnes, A. P. (2001). Characterization of the Mississippian chat in south-central Kansas. AAPG Bull. 85 (1), 85–113. doi:10.1306/8626C767-173B-11D7-8645000102C1865D
Weger, R. J., Eberli, G. P., Baechle, G. T., Massaferro, J. L., and Sun, Y. F. (2009). Quantification of pore structure and its effect on sonic velocity and permeability in carbonates. Bulletin 93 (10), 1297–1317. doi:10.1306/05270909001
Weibo, S., Zihan, Q., Yanan, H., and Cheng, H. (2020). Estimating pore volume compressibility by spheroidal pore modeling of digital rocks. Pet. Explor. Develop. 47 (3), 603–612. doi:10.1016/s1876-3804(20)60077-5
Zhang, L., Ba, J., Fu, L., Carcione, J. M., and Cao, C. (2019). Estimation of pore microstructure by using the static and dynamic moduli. Int. J. Rock Mech. Mining Sci. 113, 24–30. doi:10.1016/j.ijrmms.2018.11.005
Zhao, Y., and Liu, H. H. (2012). An elastic stress-strain relationship for porous rock under anisotropic stress conditions. Rock Mech. Rock Eng. 45 (3), 389–399. doi:10.1007/s00603-011-0193-y
Keywords: digital image analysis (DIA), nanopores, Pwave velocity (VP), dynamic modulus, pore architecture
Citation: Raj R, Jaiswal P, Wang Y, Grammer GM and Weger RJ (2021) How Nanopores Influence Dry-Frame VP Pressure Sensitivity. Front. Earth Sci. 9:641815. doi: 10.3389/feart.2021.641815
Received: 15 December 2020; Accepted: 03 February 2021;
Published: 26 April 2021.
Edited by:
Beatriz Quintal, University of Lausanne, SwitzerlandReviewed by:
Kyle Spikes, University of Texas at Austin, United StatesKen Ikeda, The University of Texas at Austin, United States
Copyright © 2021 Raj, Jaiswal, Wang, Grammer and Weger. This is an open-access article distributed under the terms of the Creative Commons Attribution License (CC BY). The use, distribution or reproduction in other forums is permitted, provided the original author(s) and the copyright owner(s) are credited and that the original publication in this journal is cited, in accordance with accepted academic practice. No use, distribution or reproduction is permitted which does not comply with these terms.
*Correspondence: Priyank Jaiswal, priyank.jaiswal@okstate.edu