Large-Scale Field Test Study on Failure Mechanism of Non-Cohesive Landslide Dam by Overtopping
 Liang Li
 Xingguo Yang1,2
  Jiawen Zhou
 Gang Fan
- 1College of Water Resource and Hydropower, Sichuan University, Chengdu, China
- 2State Key Laboratory of Hydraulics and Mountain River Engineering, Sichuan University, Chengdu, China
In recent years, landslide lake disasters occur frequently in southwest mountainous areas of China. Considering the influence of dam size and discharge channel location, three large-scale field tests were carried out in a natural river to study the failure process and mechanism of non-cohesive soil landslide dam, and the process and mechanism of non-cohesive landslide dam breach were analyzed. The results show that the dam size and discharge channel location have a significant influence on the breach mechanism of the landslide dam. The dam failure process can be divided into three stages: the initiation stage, the development stage and the failure stage. When the discharge channel is located close to the bank, the width of the breach is smaller, and the volume of the residual dam body is larger. The more stable the dam body is, the longer the breach process time is, and the smaller the peak discharge is. This study can provide a scientific reference for the emergency disposal and risk assessment of landslide dam.
Introduction
Landslide dam is one of the most devastating natural disasters worldwide, especially in the mountainous areas of Southwest China. As a result of earthquake, rainfall, snow melting and other factors, soil or rock slopes slide and block the valley or river, forming a landslide dam (Costa and Schuster, 1988; Korup, 2002; Dunning et al., 2007; Huang, 2009; Chen et al., 2020; Zhou et al., 2020). As a natural dam, the landslide dam body consists of loose and un-compacted materials, and it is easy to burst in a very short time, resulting in a large number of floods, threatening the safety of life and property in up-and-down stream districts (Zhou et al., 2013; Fan et al., 2014; Zhou et al., 2016; Choi et al., 2018; Liao et al., 2020). The Wenchuan earthquake induced numerous landslide dams in densely populated areas, on May 12, 2008 in Sichuan, China. Among them, 258 landslide dams have a height of more than 10 m, a storage capacity of more than 1 × 10⁵ m3, and a catchment area of more than 2 × 10⁷ m2 (Cui et al., 2009; Xu et al., 2009). On October 10 and November 3, 2018, two large successive landslides occurred in Baige village, the border of Sichuan Province and Tibet Autonomous Region, the landslides completely blocked the Jinsha River, which is the longest river in China and the third longest river in the world. (Fan et al., 2019; Li et al., 2019; Zhong et al., 2020). Due to the rapid rise of water level, the first dammed lake breached naturally on October 12, and the maximum dam breaching discharge was about 10,000 m3/s. On November 3, another landslide occurred at the same location, resulting in a larger-scale dammed lake. Based on the site conditions, artificial diversion was adopted and the breach began on November 12, with a peak discharge of 31000 m3/s (Wang et al., 2020; Zhang et al., 2020).
The failure modes of landslide dams include overtopping, piping and slope instability, among which the overtopping is the main type of landslide dam breaking, 91% landslide dams failed by overtopping (Costa and Schuster, 1988; Peng and Zhang, 2012). In order to provide a scientific basis for the emergency treatment of the landslide dam, a deep understanding of the burst process, the failure mechanism and flood evolution caused by overtopping is required. In recent decades, scholars have carried out a large number of indoor and field model tests and numerical simulations to study the failure mechanism of the landslide dam, and achieved fruitful results. For example, The United States Army Corps of engineers has established a reasonable model for predicting dam breaching discharge by measuring the relevant data of overtopping dam breach through indoor flume model tests (Brunner, 1995). Cao et al. (2011) carried out a series of experiments to reveal the impact of different inflow discharge, dam composition, dam geometry and initial breach dimension on breach mechanism and flood routing characteristics. Jiang et al. (2019) conducted a series of flume tests to investigate the formation mechanism of progressive failure of natural dams, the breaching characteristics and the effect of outburst flood on the channel bed. The EU IMPACT project was divided into 22 groups of indoor tests and five groups of outdoor large-scale tests. The scale of laboratory small scale model test is 1:10–1:7.5, and the model dam height is 0.5–0.6 m. The mechanism and process of dam breaching in overtopping and the influence of different materials, compactness and breach location on the development of dam breaching are revealed. Five large-scale field tests with the dam height of 4–6 m were carried out for different dam materials, sizes, and failure modes. The results show that the dam breaching mechanism is similar to the laboratory tests, but the duration is longer, and the peak discharge of dam breaching is small (Hoeeg et al., 2004; Morris et al., 2007). Nanjing Institute of water sciences carried out a large-scale field test in Dawa reservoir, Chuzhou, Anhui Province, China, with a dam height of 9.7 m and a total storage capacity of 100,000 m3. It is revealed that the greater the viscosity of the dam, the slower the overtopping process, the smaller the scale of the breach and the smaller the peak discharge (Zhang et al., 2009). Some researchers conduct a field-scale landslide dam failure experiment to investigate the landslide dam failure process and mechanism through seismic and acoustic signals (Yan et al., 2017; Feng et al., 2020; Kang et al., 2020). The formation and development of dam breaching is a complex process, which involves the size and structure of landslide dam body, material type, flow conditions, etc. Although a lot of tests have been carried out and profound understanding has been obtained, our understanding of the process and mechanism of dam failure is still insufficient and more studies should be conducted on the failure mechanism of the landslide dam (Morris et al., 2007; Fujisawa et al., 2009; Chang and Zhang, 2010). In addition, these field tests are aimed at earth rock dams, and the randomness of dam materials is not considered. Therefore, it is necessary to carry out the large-scale field tests in natural environment to reveal the failure process and mechanism of the landslide dam.
In the past, large-scale field tests were carried out in a specific environment and location, while few field tests were carried out in mountainous natural rivers where landslide dams frequently occurred (Zhang et al., 2009). In this study, three field tests with different dam size and discharge channel location on a natural river in mountainous area of Southwest China, were carried out to reveal the failure process and mechanism of the landslide dam. The experimental results show that the dam failure process can be divided into three stages: the initiation stage, the development stage and the failure stage. When the discharge channel is located close to the bank, the width of the breach is smaller, and the volume of the residual dam body is larger. The more stable the dam body is, the longer the breaching process time is, and the smaller the peak discharge is. This study can provide a scientific reference for the emergency disposal and risk assessment of landslide dam.
Experimental Design
Test Site
It is difficult to reproduce the natural conditions of the real landslide dam with the experimental model established in the laboratory. Therefore, this study placed the experiment site in a river channel with natural water flow to simulate the failure process of natural landslide dams. The experiment site is located in Huashi Gully, which is the branch of Mianyuan river, Tianchi Township, Mianzhu City, Sichuan Province, China, as illustrated in Figure 1. The 2008 Wenchuan earthquake induced many barrier lakes in Mianyuan River, such as Xiaogangjian barrier lake, Xujiaba barrier lake and Wenjiagou barrier lake. Hence, the in-site model tests of barrier lakes in Mianyuan river basin are very representative. The Huashi gully is sparsely populated and convenient for transportation, there are rural roads along the gully. In Huashi Gully, the measured average flow during the experiment period was 0.25 m3/s.
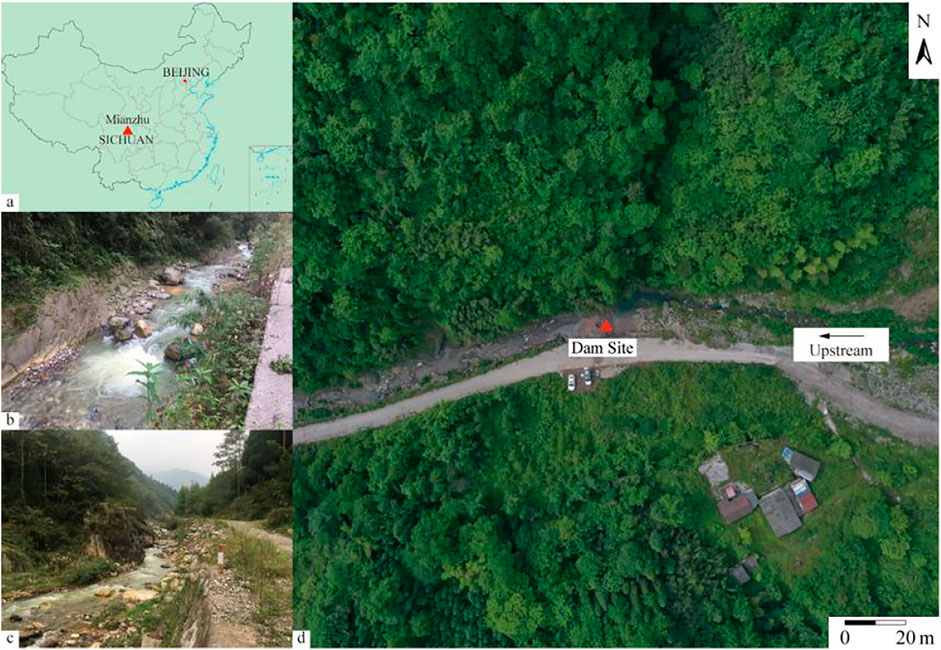
FIGURE 1. (A) Location of experiment site, (B) topography of experiment site, (C) topography of the downstream of experiment site and (D) vertical view of the model dam.
According to the historical statistics of grain size distribution of landslide dam materials, clay-sand-rock mixture and sand-rock mixture are the most common landslide dam materials (Jiang et al., 2018). Based on the field investigation, there are large number of natural graded granular materials (sand and gravel) in Huashi Gully near the experiment site, which are directly used in the test to construct the landslide dam. The material of test dam is non-cohesive and wide grading unconsolidated material, the particle size distribution range is 0.005–100 mm. Granular materials with particle size greater than 100 mm are removed to reduce the effect of large size particles on the dam failure process. Although there are boulders which are not in the statistical range of particle size distribution curve in natural landslide dams, the boulders are not considered in the establishment of experimental materials due to the lack of measurement data to quantify the specific particle size and quantity of boulders. The mean grain diameter (d50) of dam material is 10.0 mm. As shown in Figure 2, the uniformity coefficient (Cu) and the curvature coefficient (Cc) are 50 and 2.64, respectively, which represents the wide and continuous distribution of the particle size.
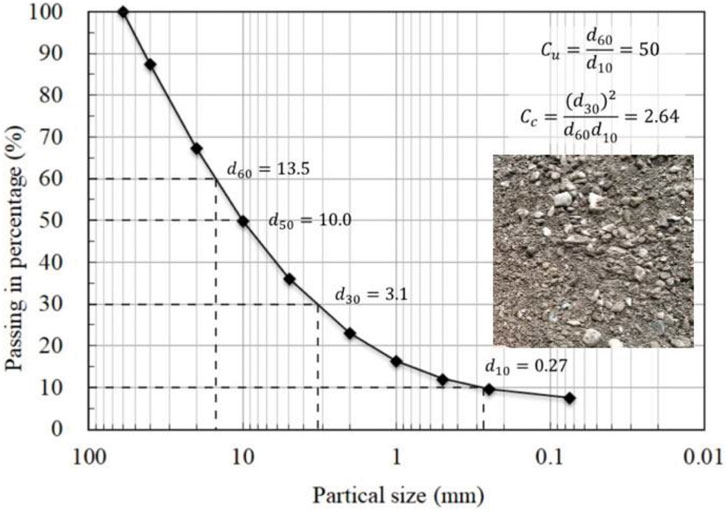
FIGURE 2. The particle size distribution of dam materials.
Model Design
The scale relationship derived from the similarity analysis is often contradictory in large-scale model test. The model test of landslide lake, which is strictly similar to the prototype, is very rare. In order to study the special phenomenon, it needs to relax the similarity criterion, abandon the generality of similarity, and only focus on the macro effect similarity when designing the large-scale mode test. Therefore, the test model can be designed according to the dominant similarity condition, so that the model can predict the prototype. In order to simulate the erosion of an erodible landslide dam, the material of the model should be stable in physical and mechanical properties, and have the following three characteristics: 1) permeability, 2) sudden collapse and, 3) multiphase flow characteristics of the burst flood. It is found that the dammed lake breaching flood is a kind of structural fluid (mostly diluted debris flow), which meets the similar conditions of flow and sediment transport (Zhang et al., 2015). However, due to the complexity of calculation of bed load transport rate and sediment carrying capacity of debris flow, and the limitation of research level, the accuracy is still difficult to meet the requirements of model design. Meanwhile, the time distortion is not allowed in the landslide dam breaching test, that is, the model time scale should be determined by the flow movement time scale, so the similar conditions of flow sediment transport and riverbed deformation can’t be considered in model design.
Besides geometric similarity and water quantity similarity, the following similarity conditions should also be considered in the design of dammed lake failure model (Zhang et al., 2015).
The similarity conditions of flow gravity:
The similarity conditions of flow resistance (downstream channel of barrier lake):
The similarity conditions of flow process:
The similarity conditions of sand and gravel initiation velocity:
The similarity condition of debris flow velocity:
Where λL is the horizontal scale; λV is the flow velocity scale; λh is the vertical scale; λn is the roughness scale; λt1 is the flow movement time scale; λVC is the sediment initiation velocity scale; λVN is the debris flow velocity scale.
In addition, in order to ensure that the flow pattern of the model is similar to that of the prototype, two limiting conditions of flow pattern and surface tension should be satisfied. Because the dam breaching model is prone to form turbulence and the water depth is large, these two conditions cannot be considered. Since this test does not aimed at any specific landslide dam, therefore, the parameters such as the size of the dam, the material of the dam and the flow pattern of the burst flood are not designed specifically during the test. The similarity analysis shows that the results of this study can reflect the main characteristics of the real landslide dam breach, such as the flood routing process, breach development, downstream sediment accumulation and so on. According to the similarity criterion, the test results can be deduced to the relevant characteristics of the actual dam failure process, and provide reference for risk assessment and emergency disposal of real landslide dam.
Three model tests were carried out in this study, these dams after construction and before test are shown in Figure 3. The cross-section shape of the model landslide dam is trapezoidal, the shape and size of test no.3 are shown in Figure 4. The test dam body adopted the method of layered filling, with the thickness of each layer of 50 cm, mechanical throwing filling and no rolling. To simulate unconsolidated landslide dam material, the granular material was fully mixed and poured into the river using an excavator to form the model dam. The void ratio of each dam material layer was between 0.75 and 0.82, which is consistent with the results of field investigations of nature landslide dams that range between 0.59 and 1.11 (Chang and Zhang, 2010; Zhang et al., 2019). After the construction of dam, the density of dam material was measured by Pycnometer method, and the specific gravity is 2.6, the mechanical parameters of the dam soil as summarized in Table 1.
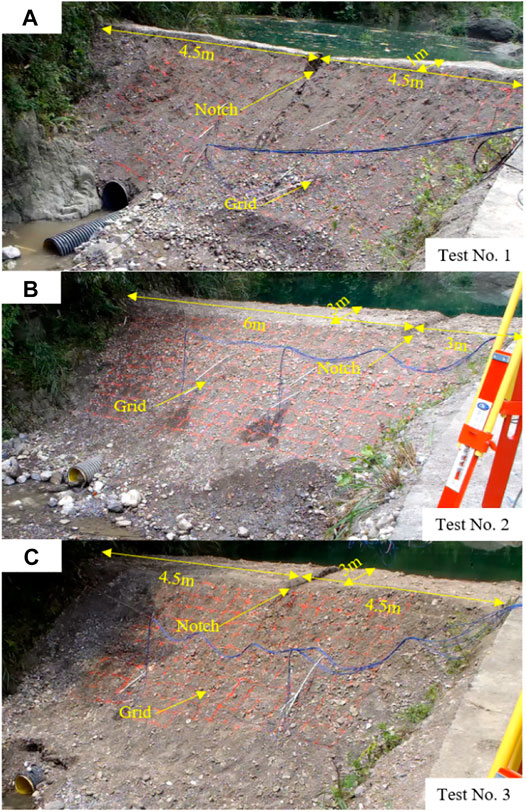
FIGURE 3. Images of test dams after construction: (A) the dam of Test No. 1, (B) the dam of Test No. 2, (C) the dam of Test No. 3.
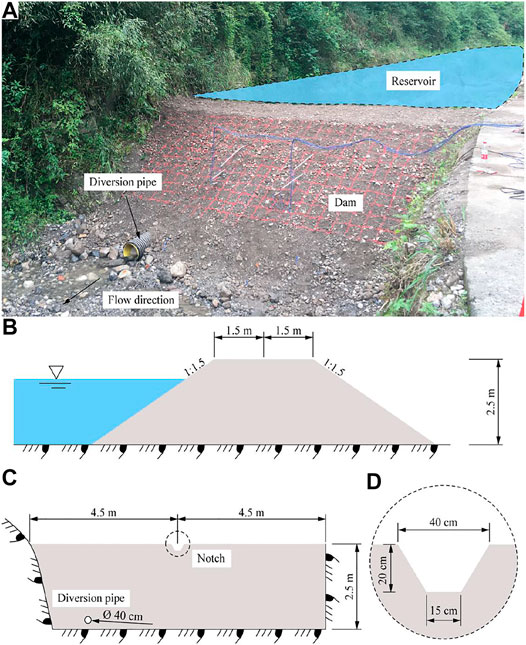
FIGURE 4. Detailed dimensional sketches of the No. 3 model landslide dam: (A) the photo of the model landslide dam, (B) the cross profile of the dam, (C) longitudinal profile of the dam, and (D) dimension of notch on the model landslide.

TABLE 1. The mechanical parameters of the dam soil.
In the Test No. 1, except for the width of dam crest is 1.0 m and the volume of dam body is 105 m3, other geometric dimensions, dams filling method and test conditions are exactly the same as the other two tests. In the Tests No. 2 and No. 3, the dimension of the model landslide dams is the same, the width of landslide dam crest is 3.0 m, the width of landslide dam bottom is 10.5 m, the length of landslide dam is 9.0 m, the height of landslide dam is 2.5 m, the slope of upstream and downstream dam body is 1:1.5, and the volume of dam is 152 m3, as summarized in Table 2. The difference between these two tests (No. 2 and No. 3) is the discharge channel position on the model landslide dam. In the Test No. 2, discharge channel was located one third away from the left bank of the dam, i.e., 3 m from the left bank, while the discharge channel of test No. 1 and test No. 3 were located at the middle of the dam. The test conditions were set to reveal the influence of dam width and location of discharge channel on the failure mechanism of the landslide dams.
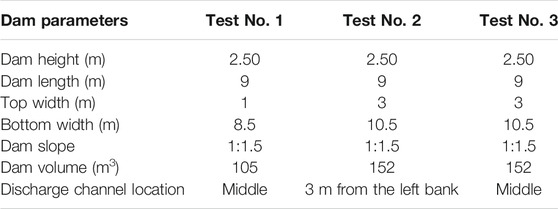
TABLE 2. Summary of test condition for this study.
After the completion of the dam filling, the discharge channel is manually excavated at the pre-designed position of the dam crest. The notch is inverted trapezoidal, with a height of 20 cm, a bottom width of 15 cm and a top width of 40 cm. Before the test, a rectangular grid was painted on the downstream slope of the dam to quantitatively observe the erosion failure of the downstream slope of the landslide dam. The grid dimension was 30 cm × 30 cm. In order to prevent the dam body from being washed away during the dam construction, a diversion pipe with a diameter of 400 mm and a length of 10.7 m was embedded in the river channel before the dam body was constructed. Digital cameras are installed upstream and downstream of the dam to record the entire dam breaching process. Furthermore, an unmanned aerial vehicle (UAV) hovered over the dam to record the continuous video. When the construction of the model landslide dam is completed and the impounding begins, the diversion pipe was blocked with a waterproof retaining plate.
Determining Method for the Discharge Process
According to the water balance equation, the discharge during landslide dam breaching can be calculated as follows:
where Qout is the outflow (m3/s), Qin is the inflow (m3/s), V is the dammed lake storage capacity (m3) and H is the water level (m).
However, the outflow is usually composed of seepage and breach discharge. Field observation shows that seepage exists in the process of impoundment and dam failure. In addition to surface runoff, seepage into the ground, which brings difficulties to the measurement. Considering that the seepage is very tiny and will not cause significant impact on the test result, hence, the seepage flow is not considered in the calculation of dam breach flow.
Different from laboratory test, the topography of the dammed lake area in the field test is irregular. In this study, terrestrial laser scanner (TLS) technology was used to obtain the point cloud of the barrier lake and establish a three-dimensional surface model. The TLS used was a RIGEL VZ-2000i, a pulse-based scanner produced by RIGEL MTS Austria, with a measurement accuracy of 5 mm and a repeatability of 3 mm. The curve between the water level and the storage capacity of the reservoir can be obtained by the three-dimensional surface model, as shown in Figure 5.The relationship between the lake volume and the water level (dV/dH) was determined by calculating the water surface area of the lake under different water levels. According to the principle of hydrostatic pressure, the relationship between water level and time (dH/dt) is obtained by measuring the water level with a piezometer installed in the dammed lake, with an accuracy of 0.01 mm. In this study, the inflow is the average flow during the experiment period, which was 0.25 m3/s. Base on the water balance equation, combined with the water level-storage curve and real-time water level change curve of the reservoir, the discharge process curve can be calculated. Before the test, the accuracy of discharge process is consistent with the actual situation through field calibration.
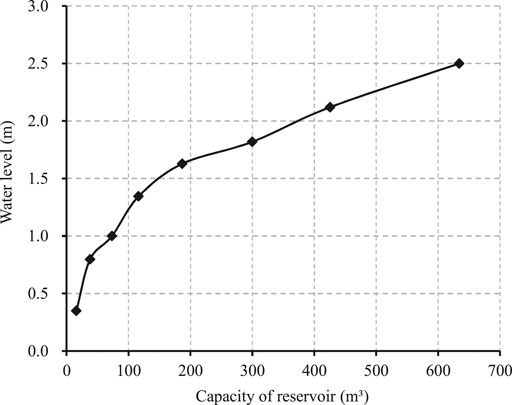
FIGURE 5. The curve between the water level and storage capacity of the reservoir.
Results and Discussion
Based on the results of the Test No. 3, this paper analyzes the process of water level and discharge, and the mechanism of dam failure. According to the results of Test No. 1 and the Test No. 3, the influence of different dam size on the failure process is compared and analyzed. By comparing the results of Test No. 2 and the Test No. 3, the influence of different discharge channel position on the failure process is analyzed.
Process Analysis of Water Level and Discharge During Dam Failure
Upstream Water Level
The total recording time of the model test data is 30 min (1,800 s) from the time when the lake water level reaches the bottom elevation of the discharge channel to the end of the dam failure. The natural stream discharge in the Huashi gully is Q = 0.25 m3/s. Based on the recorded data, the change process of lake water level can be divided into three stages: 1) slow rising stage (0–900 s); 2) rapid falling stage (900–1,290 s) and 3) slow falling stage (1,290–1,800 s), as shown in Figure 6. At t = 0 s, the reservoir water level reaches the bottom elevation of the discharge channel, and the water flows from the upstream to the downstream along the discharge channel bottom. In addition, because the reservoir area with the dam crest water level is large, and the reservoir water level rises very slowly, and the whole process lasts for 900 s. With the development of the breach, the discharge flow increases gradually. When t = 900 s, the instantaneous discharge of the breach is just equal to the upstream natural discharge, and the reservoir water level reaches the peak value of 2.55 m. The breach process of the model landslide dam continued and the discharge was greater than the upstream inflow, and the reservoir water level began to decline. Then, with the rapid development of the breach, the discharge increased sharply, and the reservoir water level dropped rapidly. When t = 1,290 s, the water level dropped to 1.29 m, which lasted for 300 s. After that, the reservoir water level drops slowly. When t = 1,800 s, the reservoir water level drops to 1.09 m, which is basically consistent with the natural river water level, indicating that the upstream and downstream water flow tends to be stable and the dam breaching process ends.
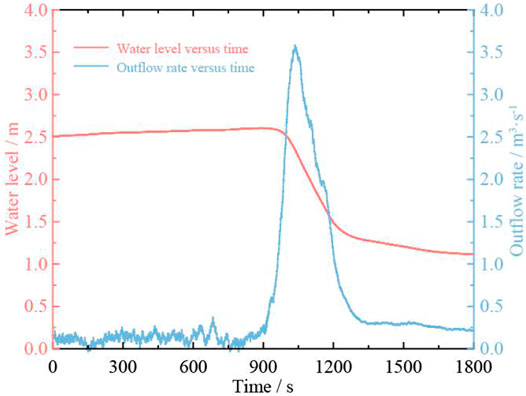
FIGURE 6. Water level and discharge curve of Test No. 3.
Discharge During Dam Failure
The breach discharge is calculated from the curve between the water level and the storage capacity curve of the reservoir. It can be seen from the curve of flow change in Figure 6 that the flow experiences four stages, i.e., slow increase, rapid increase, rapid decrease, and slow decrease. When t = 0 s, the reservoir water begins to overflow downstream along the diversion channel, and the discharge is very small, which indicates the beginning of dam breaching. In the time of t = 0–849 s, the flow increases slowly, and the flow change is very small, from the initial 0.1 m3/s to 0.51 m3/s. When t = 930 s, the breach flow increases sharply, and the obvious inflection point can be seen from the figure. When t = 1,100 s, the flow reaches the peak value, QP = 3.55 m3/s. After that, the flow rate began to decline sharply to t = 1,180 s, and the flow rate decreased to 1.12 m3/s. In the last stage, the flow decreases slowly. When t = 1,800 s, Qout = Qin = 0.25 m3/s, clear water flow can be seen in the residual channel, indicating the end of erosion, this process takes a relatively long time.
Failure Process Analysis
Combined with the change process of water level and discharge, and video-recordings data, the development process of dam failure can be divided into three stages: initiation stage, development stage and failure stage, as shown in Figure 7.
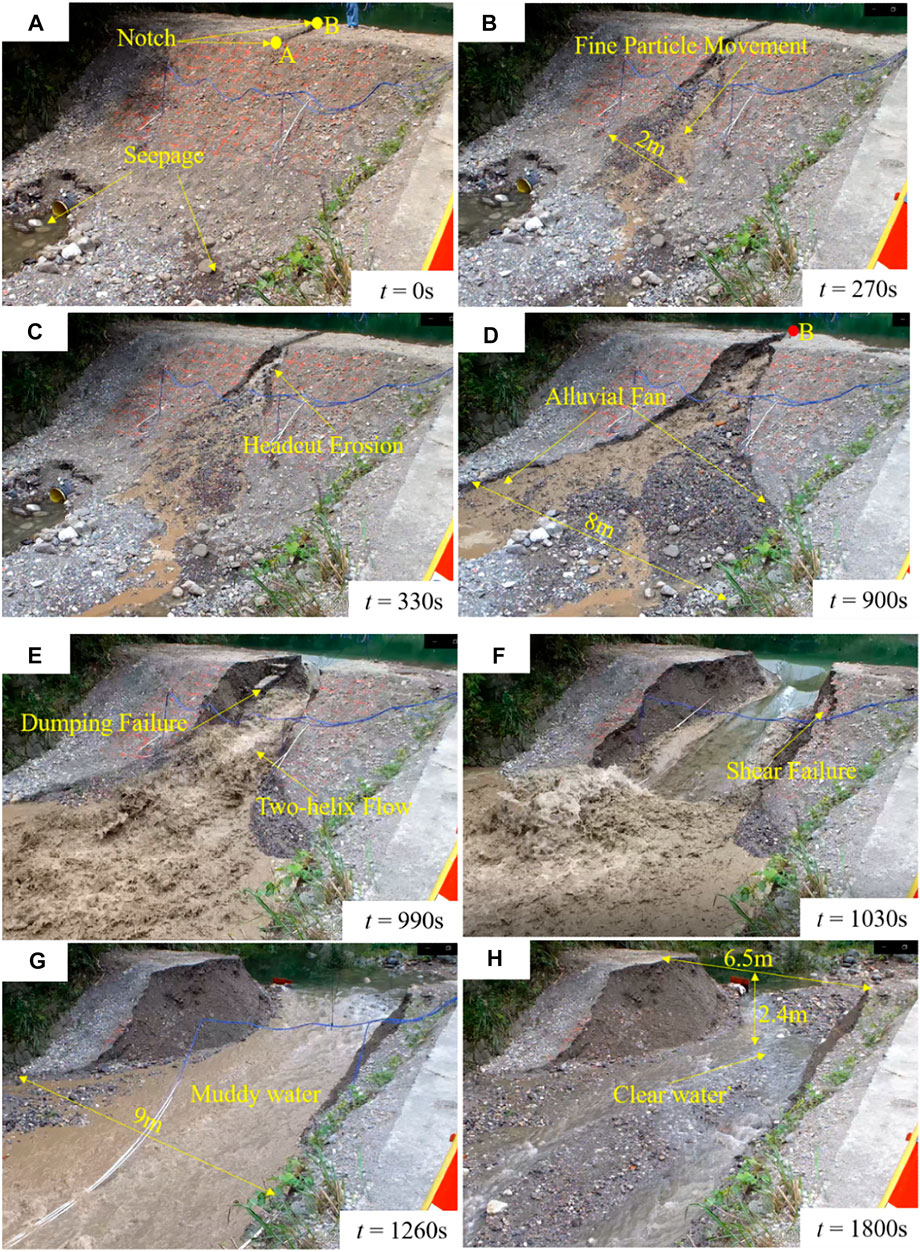
FIGURE 7. Images of dam failure process at different time: (A,B) the main features of the Stage I, (C,D) the main features of the Stage II, (E–H) the main features of the Stage III.
Stage I: it is the initiation stage and mainly characterized by downstream slope erosion, formed obvious erosion ditch in the downstream surface. The corresponding time was 0–270 s (Figure 7A and Figure 7B), the reservoir water level and flow increased slowly. t = 0 s is the moment that water travel along the initial notch and finally reaches the Point A The dam crest breach is widened to 0.5 m and the alluvial width at the toe of the slope finally extended to 2 m. Under the action of gravity, the water flows along the downstream slope to find the optimal path to the downstream channel, and the optimal path is the path with the smallest material particles on the slope. At first, the flow velocity is slow, which drives small particles. With the increase of flow velocity, it drives slightly larger particles and gradually forms a fixed channel. In the range of near the dam crest, the flow is small strands. Because the flow drives the fine particles on the slope, the velocity is not enough, and the particles move slowly, so they accumulate near the downstream slope toe and flow radially near the slope toe. The sediment carried by the slope water deposited in fan shape around the downstream slope toe gully, forming an alluvial fan.
Stage II: it is the development stage, which mainly shows that the upstream and downstream of the dam crest are connected, and the dam breach develops from the downstream of the dam crest to the upstream of the dam crest, connecting the whole dam crest. The corresponding time is 270–900 s (Figure 7C and Figure 7D), and the reservoir water level and flow continue to increase slowly. The velocity and discharge of overtopping flow increased gradually, the erosion capacity increased gradually, and the gully widened and deepened gradually. In the loose and concentrated area of fine particles, slope materials are easy to be carried away by water flow and eroded to form gullies. Due to the inconsistency of the density of the model landslide dam and the uneven distribution of the material particles, the anti-erosion ability of the dam body is quite different. The water flow forms a multi-stage stepped small drop sill on the slope surface and a large alluvial fan at the foot of the slope. At this stage, the dam crest breach is widened to 2.4 m, and the alluvial width at the foot of the slope extend to 8 m.
Stage III: it is the failure stage, which is mainly characterized by the undercutting erosion and lateral erosion of the breach, the rapid decline of the bottom elevation of the breach, and the collapse of the slopes on both sides, with a corresponding time of 900–1800 s (Figures 7E–H). The velocity and discharge of the breach increase rapidly, then decrease rapidly after reaching the peak value, and the reservoir water level decreases rapidly. The width of the breach develops to 6.5 m and remains stable. The alluvial width at the foot of the slope reaches 9 m, that is to say, it develops to the banks on both sides of the river. About two thirds of the dam body is washed away by high-speed flow. This stage is the key of the whole breach process, and the development of breach, the decline of reservoir water level and the change of discharge mainly occur in this stage. When t = 1,800 s, the breach discharge is equal to the upstream inflow, and the flow is clear, which indicates that the breach tends to be stable and the dam breaching ends. The change of water flow from turbid to clear can be used as a sign to judge the end of outburst.
Influence of Different Discharge Channel Position on Dam Failure
For the same dam size and test conditions, the shape and size of discharge channel are the same, the position of discharge channel is different, the failure process of landslide dam is similar, and the residual volume of dam after breaching is different. As shown in Table 3, the residual volume of the dam in Test No. 2 is larger than that in Test No. 3. The residual volume of the dam in Test No. 2 and Test No. 3 are 78 m3 and 51 m3, respectively, and the proportion to the original dam volume is 51 and 34%, respectively. As shown in Figure 8, the final breach width of Test No. 2 is 4.5 m, which is less than that of Test No. 3 of 6.5 m. As shown in Figure 9, the total breaching time of Test No. 2 is approximately equal to the Test 3, 1,760 and 1,800 s, respectively. From the stage time point of view, each stage time of Test No. 2 is consistent with that of Test No. 3, which indicates that the different position of discharge channel has no effect on the dam failure process. The development stage time and failure stage time are very close, which indicates that the peak discharge process is similar. The dam body has high erosion resistibility, and there will be no sudden dam failure during overflow (Liu, 2014). As the discharge channel is located near the left bank in the Test No. 2, the water flow will destroy the dam body on the left side of the discharge channel and wash out all the dam body near the left bank easily, and the rock mass on the left bank is exposed, which has strong anti-scouring ability, so as to reduce the scouring of the dam body. The larger volume of residual dam, the smaller erosion of dam caused by the burst flood, that is, the less sediment carried by the burst flood. Under the same flow condition and topographic features, the less sediment carried by flood, the less impact on downstream channel sedimentation and narrowing. The tests results show that the discharge channel should be set near the bank to reduce the dam erosion, which can provide a scientific reference for the emergency disposal and risk assessment of landslide dam.

TABLE 3. Ratio of the volume of residual dam to original dam.
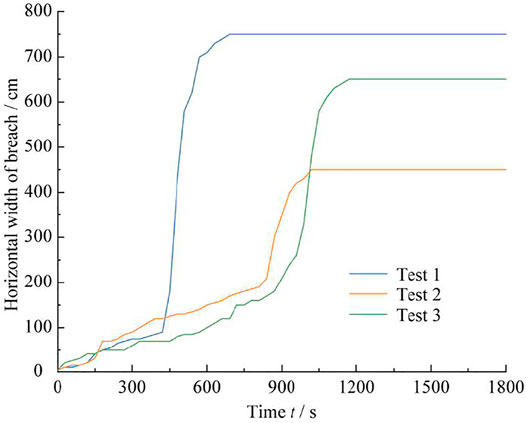
FIGURE 8. Horizontal expansion of breach at downstream of dam crest.
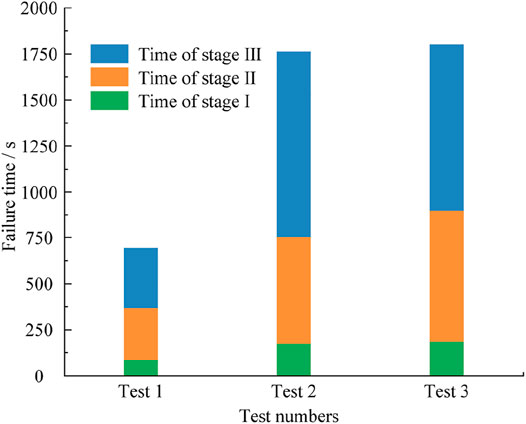
FIGURE 9. Water level and discharge curve of Test No. 1.
Influence of Dam Size on Dam Failure
Under the same discharge channel and test conditions, the dam failure process is different with different dam crest width. As shown in Figure 10, the peak discharge QP of Test No. 1 is 7.55 m3/s, much larger than that of Test No. 3, which is close to 2 times of Test No. 3. As shown in Figure 9, the total failure time of Test No. 1 is 690 s, which is far less than that of Test No. 2 and Test No. 3, 1,760 and 1,800 s, respectively. From the stage time point of view, each stage time of Test No. 1 is significantly less than that of Test No. 2 and No. 3. Compared with each stage time of Test No. 3, each stage time of Test No. 1 was 47, 39, 36%, respectively. As shown in Figure 8, the final breach width of Test No. 1 is 7.5 m, and the final breach width of Test No. 3 is 6.5 m. Combined with the present observation, the collapse process of Test No. 1 is a typical instant collapse, which is very dangerous for the infrastructures and lives in the downstream area. The crest width of Test No. 1 is 1 m, compared with Test No. 3, the heights of Test No. 1 and No. 3 are the same, the dam volume and crest width of the Test No. 1 is small and the stability is poor. In addition, due to the increase of the peak discharge, the sediment carrying capacity of burst flood is also improved, which aggravates the erosion of dam materials, accelerates the damage rate, and shortens the time, accordingly. Under the same hydraulic conditions, the dam is easier to be destroyed, the breaching time is shorter, the flood peak flow is larger, and the harm to the downstream is greater.
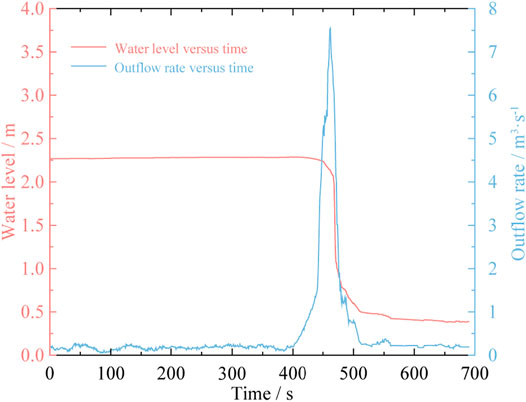
FIGURE 10. Failure time of each stage.
Failure Mechanism Analysis
The development of breach is an extremely complex process, which is a process with soil-water coupling, involving hydraulics, soil mechanics, sediment movement and other disciplines. Head-cut erosion, slope instability and “two-helix flow” erosion are the three main breach mechanisms of dam failure (Zhang et al., 2009; Zhu et al., 2011; Jiang et al., 2018), which were observed in this experiment. During the field tests, it can be observed that the development of the breach is a trumpet shaped radial development with the outlet of the discharge channel on the dam crest as the origin. However, many existing breach models predict discharge by assuming that the breach linear development along the longitudinal and lateral directions, therefor, the development process of breach should be in-deep research. The channel is formed by the erosion of the downstream slope, then the width of the breach remains unchanged, and the channel is scoured upward and downward at the same time. When the breach develops to the upstream of the dam crest, the development of the breach accelerates, and the width and undercutting depth of the breach increase rapidly, accompanied by slope instability (includes shear failure and dumping failure) and “two-helix flow” erosion (Figure 7E and Figure 7F). Helix flow exists on both sides of the breach, and the flow pattern of the flow channel is composed of two parts: bend flow on both sides and direct flow in the middle. The water flow on both sides is rolling and turbid, and the water flow in the middle is calm and clear. The existence of two-helix flow increases the carrying capacity of flow and promotes the lateral expansion of dam breach. The non-viscous material dam breaching develops rapidly, the flood peak process time is short, and the discharge peak value is large. The results of the three tests show that the discharge of the breach increases sharply and the water level in the upstream decreases rapidly.
The initiation stage of breach has an important influence on the development of later breach, which should be paid enough attention to. At present, it is generally recognized that with the continuous rise of reservoir water level, the water will naturally overflow at the lowest part of the dam crest, and gradually erode on the downstream slope, forming a flow channel, so that the dam breaching begins. The initiation mechanism of debris flow plays a dominant role in the occurrence, development, and damage of debris flow. Moreover, migration, accumulation, and blockage of fine particles in the soil will lead to soil failure, and then develop into debris flow (Cui et al., 2017). As shown in Figure 7B and Figure 7C, after the water overflows, the fine particles are first taken away on the slope. Due to the low velocity and gravity, the fine particles move slowly in the flow and deposit at the foot of the slope temporarily. With the accumulation of fine particles at the foot of the slope, the outflow channel is blocked and the water flows to both sides, resulting in the lateral deposition of fine particles and the formation of an obvious alluvial fan. With the widening of the breach and the increase of the velocity, the ability of erosion and transportation of water flow is enhanced, and the fine particles of the alluvial fan at the foot of the slope are taken away by the flow, and the water is concentrated to form a flow channel. Later, with the increasing of the flow velocity, the flow channel is deepened and widened. In the initiation stage, the factors that affect the erosion ability of materials, such as the material characteristics, particle composition and compaction degree, have a greater impact on slope erosion and flow channel development, thus affecting the change of breaching velocity and the breaching development. Therefore, an in-depth understanding of the initiation stage of landslide dam failure process is imperative for providing guidance for the prediction, mitigation, and disposal of landslide dams.
Conclusion
By conducting three large-scale field model tests in a nature river channel, the overtopping failure process of the landslide dam was investigated in this study. The following conclusions can be obtained:
1) The breaching of non-cohesive soil dam can be divided into three stages: initiation stage, development stage and failure stage. The initiation stage is characterized by the movement of the fine particles in the downstream slope and the coarse particles. The main form of the development stage is the source erosion on the slope surface and the main forms of failure stage are slope instability and “two-helix flow” erosion.
2) The residual volume of the dam in Test No. 2 and Test No. 3 are 78 m3 and 51 m3, respectively, and the proportion to the original dam volume is 51 and 34%, respectively. The discharge channel is closer to the bank, the width of the breach is smaller, and the volume of the residual dam body is larger.
3) The total failure time of Test No. 1 is 690 s, which is far less than that of Test No. 2 and Test No. 3, 176 and 1,800 s, respectively. The peak discharge QP of Test No. 1 is 7.55 m3/s, much larger than that of Test No. 3. The more stable the dam body is, the longer the breaching process time is, and the smaller the peak discharge is, and vice versa.
Data Availability Statement
The original contributions presented in the study are included in the article/Supplementary Material, further inquiries can be directed to the corresponding author.
Author Contributions
GF, JwZ and XY did the conceptualization, review, and editing. LL, GF and JyZ did the test. LL did the methodology, collected the resources, and prepared the original draft. LL and GF did the validation. GF and XY did the investigation and funding acquisition. All authors have read and agreed to the published version of the manuscript.
Funding
This research was funded by the National Key R & D Program of China (No. 2018YFC1508601), the National Natural Science Foundation of China (No. U20A20111) and the Sichuan Youth Science and Technology Innovation Research Team Project (No. 2020JDTD0006).
Conflict of Interest
The authors declare that the research was conducted in the absence of any commercial or financial relationships that could be construed as a potential conflict of interest.
Publisher’s Note
All claims expressed in this article are solely those of the authors and do not necessarily represent those of their affiliated organizations, or those of the publisher, the editors and the reviewers. Any product that may be evaluated in this article, or claim that may be made by its manufacturer, is not guaranteed or endorsed by the publisher.
Acknowledgments
Critical comments by the reviewers greatly improved the initial manuscript.
References
Brunner, G. W. (1995). HEC-RAS River Analysis System. Hydraulic User's Manual. Version 1.0. Vicksburg: US Army Corps of Engineers, Institute for Water Resources, Hydrologic Engineering Center.
Cao, Z., Yue, Z., and Pender, G. (2011). Landslide Dam Failure and Flood Hydraulics. Part I: Experimental Investigation. Nat. Hazards 59, 1003–1019. doi:10.1007/s11069-011-9814-8
Chang, D. S., and Zhang, L. M. (2010). Simulation of the Erosion Process of Landslide Dams Due to Overtopping Considering Variations in Soil Erodibility along Depth. Nat. Hazards Earth Syst. Sci. 10 (4), 933–946. doi:10.5194/nhess-10-933-2010
Chen, Q., Fan, G., and Zhou, J.-W. (2020). Numerical Simulation of the 2017 Xinmo Catastrophic Landslide Considering Entrainment Effect. Front. Earth Sci. 8, 537800. doi:10.3389/feart.2020.537800
Choi, C., Cui, Y., Au, K., Liu, H., Wang, J., Liu, D., et al. (2018). Case Study: Effects of a Partial-Debris Dam on Riverbank Erosion in the Parlung Tsangpo River, China. Water 10, 250. doi:10.3390/w10030250
Costa, J. E., and Schuster, R. L. (1988). The Formation and Failure of Natural Dams. Geol. Soc. Am. Bull. 100, 1054–1068. doi:10.1130/0016-7606(1988)1002.3.CO;2
Cui, P., Zhu, Y.-Y., Han, Y.-S., Chen, X.-Q., and Zhuang, J.-Q. (2009). The 12 May Wenchuan Earthquake-Induced Landslide Lakes: Distribution and Preliminary Risk Evaluation. Landslides 6, 209–223. doi:10.1007/s10346-009-0160-9
Cui, Y.-F., Zhou, X.-J., and Guo, C.-X. (2017). Experimental Study on the Moving Characteristics of fine Grains in Wide Grading Unconsolidated Soil under Heavy Rainfall. J. Mt. Sci. 14 (3), 417–431. doi:10.1007/s11629-016-4303-x10.1007/s11629-016-4303-x
Dunning, S. A., Mitchell, W. A., Rosser, N. J., Petley, D. N., and Petley, D. N. (2007). The Hattian Bala Rock Avalanche and Associated Landslides Triggered by the Kashmir Earthquake of 8 October 2005. Eng. Geology. 93, 130–144. doi:10.1016/j.enggeo.2007.07.003
Fan, X., Rossiter, D. G., van Westen, C. J., Xu, Q., and Görüm, T. (2014). Empirical Prediction of Coseismic Landslide Dam Formation. Earth Surf. Process. Landforms 39, 1913–1926. doi:10.1002/esp.3585
Fan, X., Xu, Q., Alonso-Rodriguez, A., Subramanian, S. S., Li, W., Zheng, G., et al. (2019). Successive Landsliding and Damming of the Jinsha River in Eastern Tibet, China: Prime Investigation, Early Warning, and Emergency Response. Landslides 16, 1003–1020. doi:10.1007/s10346-019-01159-x
Feng, Z.-Y., Huang, H.-Y., and Chen, S.-C. (2020). Analysis of the Characteristics of Seismic and Acoustic Signals Produced by a Dam Failure and Slope Erosion Test. Landslides 17 (7), 1605–1618. doi:10.1007/s10346-020-01390-x
Fujisawa, K., Kobayashi, A., and Aoyama, S. (2009). Theoretical Description of Embankment Erosion Owing to Overflow. Géotechnique 59, 661–671. doi:10.1680/geot.7.00035
Hoeeg, K., Loevoll, A., and Vaskinn, K. A. (2004). Stability and Breaching of Embankment Dams: Field Tests on 6 M High Dams. Int. J. Hydropower Dams 11 (1), 88–92.
Huang, R. Q. (2009). Some Catastrophic Landslides Since the Twentieth Century in the Southwest of China. Landslides 6, 69–81. doi:10.1007/s10346-009-0142-y
Jiang, X., Wei, Y., Wu, L., Hu, K., Zhu, Z., Zou, Z., et al. (2019). Laboratory Experiments on Failure Characteristics of Non-Cohesive Sediment Natural Dam in Progressive Failure Mode. Environ. Earth Sci. 78 (17), 538. doi:10.1007/s12665-019-8544-1
Jiang, X., Wei, Y., Wu, L., and Lei, Y. (2018). Experimental Investigation of Failure Modes and Breaching Characteristics of Natural Dams. Geomatics, Nat. Hazards Risk 9, 33–48. doi:10.1080/19475705.2017.1407367
Kang, C., Chen, S. C., Chan, D., and Tfwala, S. (2020). Numerical Modeling of Large-Scale Dam Breach experiment. Landslides 17, 2737–2754. doi:10.1007/s10346-020-01465-9
Korup, O. (2002). Recent Research on Landslide Dams - A Literature Review with Special Attention to New Zealand. Prog. Phys. Geogr. Earth Environ. 26, 206–235. doi:10.1191/0309133302pp333ra
Li, H.-B., Qi, S.-C., Chen, H., Liao, H.-M., Cui, Y.-F., and Zhou, J.-W. (2019). Mass Movement and Formation Process Analysis of the Two Sequential Landslide Dam Events in Jinsha River, Southwest China. Landslides 16, 2247–2258. doi:10.1007/s10346-019-01254-z
Liao, H.-M., Yang, X.-G., Li, H.-B., Gan, B.-R., and Zhou, J.-W. (2020). Increase in Hazard from Successive Landslide-Dammed Lakes along the Jinsha River, Southwest China. Geomatics, Nat. Hazards Risk 11, 1115–1128. doi:10.1080/19475705.2020.1776404
Liu, N. (2014). Hongshiyan Landslide Dam Danger Removal and Coordinated Management. Front. Eng. 1, 308–317. doi:10.15302/j-fem-2014041
Morris, M. W., Hassan, M. A. A. M., and Vaskinn, K. A. (2007). Breach Formation: Field Test and Laboratory Experiments. J. Hydraulic Res. 45 (Suppl. 1), 9–17. doi:10.1080/00221686.2007.9521828
Peng, M., and Zhang, L. M. (2012). Breaching Parameters of Landslide Dams. Landslides 9, 13–31. doi:10.1007/s10346-011-0271-y
Wang, H., Zhou, Y., Wang, S., and Wang, F. (2020). Coupled Model Constructed to Simulate the Landslide Dam Flood Discharge: A Case Study of Baige Landslide Dam, Jinsha River. Front. Earth Sci. 14, 63–76. doi:10.1007/s11707-019-0805-5
Xu, Q., Fan, X.-M., Huang, R.-Q., and Westen, C. V. (2009). Landslide Dams Triggered by the Wenchuan Earthquake, Sichuan Province, South West China. Bull. Eng. Geol. Environ. 68, 373–386. doi:10.1007/s10064-009-0214-1
Yan, Y., Cui, P., Chen, S.-c., Chen, X.-q., Chen, H.-y., and Chien, Y.-l. (2017). Characteristics and Interpretation of the Seismic Signal of a Field-Scale Landslide Dam Failure Experiment. J. Mt. Sci. 14 (2), 219–236. doi:10.1007/s11629-016-4103-3
Zhang, H. W., Liu, L., Zhong, D. Y., Zhang, L. H., and Zhang, J. F. (2015). Physical Model Design Method and Verification on Dammed Lake Break. Yellow River 4, 1–5. (in Chinese). doi:10.3969/j.issn.1000-1379.2015.04.001
Zhang, J., Li, Y., Xuan, G., Wang, X., and Li, J. (2009). Overtopping Breaching of Cohesive Homogeneous Earth Dam with Different Cohesive Strength. Sci. China Ser. E-Technol. Sci. 52, 3024–3029. doi:10.1007/s11431-009-0275-1
Zhang, L., Xiao, T., He, J., and Chen, C. (2019). Erosion-Based Analysis of Breaching of Baige Landslide Dams on the Jinsha River, China, in 2018. Landslides 16 (10), 1965–1979. doi:10.1007/s10346-019-01247-y
Zhang, S.-L., Yin, Y.-P., Hu, X.-W., Wang, W.-P., Zhu, S.-N., Zhang, N., et al. (2020). Initiation Mechanism of the Baige Landslide on the Upper Reaches of the Jinsha River, China. Landslides 17, 2865–2877. doi:10.1007/s10346-020-01495-3
Zhong, Q., Chen, S., Wang, L., and Shan, Y. (2020). Back Analysis of Breaching Process of Baige Landslide Dam. Landslides 17, 1681–1692. doi:10.1007/s10346-020-01398-3
Zhou, J.-W., Cui, P., and Fang, H. (2013). Dynamic Process Analysis for the Formation of Yangjiagou Landslide-Dammed Lake Triggered by the Wenchuan Earthquake, China. Landslides 10, 331–342. doi:10.1007/s10346-013-0387-3
Zhou, J.-W., Cui, P., and Hao, M.-H. (2016). Comprehensive Analyses of the Initiation and Entrainment Processes of the 2000 Yigong Catastrophic Landslide in Tibet, China. Landslides 13, 39–54. doi:10.1007/s10346-014-0553-2
Zhou, J.-W., Li, H.-B., Lu, G.-D., Zhou, Y., Zhang, J.-Y., and Fan, G. (2020). Initiation Mechanism and Quantitative Mass Movement Analysis of the 2019 Shuicheng Catastrophic Landslide. Q. J. Eng. Geology. Hydrogeology 54, qjegh2020–052. doi:10.1144/qjegh2020-052
Keywords: landslide dam, field test, overtopping failure, dam breaching, failure mechanism
Citation: Li L, Yang X, Zhou J, Zhang J and Fan G (2021) Large-Scale Field Test Study on Failure Mechanism of Non-Cohesive Landslide Dam by Overtopping. Front. Earth Sci. 9:660408. doi: 10.3389/feart.2021.660408
Received: 23 February 2021; Accepted: 12 July 2021;
Published: 27 July 2021.
Edited by:
Venkatesh Merwade, Purdue University, United StatesReviewed by:
Zheng-yi Feng, National Chung Hsing University, TaiwanHao Wu, Powerchina Huadong Engineering Co., Ltd., China
Copyright © 2021 Li, Yang, Zhou, Zhang and Fan. This is an open-access article distributed under the terms of the Creative Commons Attribution License (CC BY). The use, distribution or reproduction in other forums is permitted, provided the original author(s) and the copyright owner(s) are credited and that the original publication in this journal is cited, in accordance with accepted academic practice. No use, distribution or reproduction is permitted which does not comply with these terms.
*Correspondence: Gang Fan, fangang@scu.edu.cn