Relationship Between Dams, Knickpoints and the Longitudinal Profile of the Upper Indus River
 Liqin Zhou1,2,3
  Weiming Liu1,2*
  Xiaoqing Chen1
  Hao Wang4 Xudong Hu5 Xuemei Li1 Wolfgang Schwanghart6
- 1Key Laboratory of Mountain Hazards and Earth Surface Process, Institute of Mountain Hazards and Environment, Chinese Academy of Sciences, Chengdu, China
- 2China-Pakistan Joint Research Center on Earth Sciences, CAS-HEC, Islamabad, Pakistan
- 3University of Chinese Academy of Sciences, Beijing, China
- 4Institute of Geographic Sciences and Natural Resource Research, Chinese Academy of Sciences, Beijing, China
- 5Hubei Key Laboratory of Disaster Prevention and Mitigation, College of Civil Engineering and Architecture, China Three Gorges University, Yichang, China
- 6Institute of Environmental Science and Geography, University of Potsdam, Potsdam-Golm, Germany
Mass movements in mountainous areas are capable of damming rivers and can have a lasting effect on the river longitudinal profile. The long profile is commonly used to retrieve regional tectonic information, but how much dams may compromise geomorphometry-based tectonic analysis has not been systematically researched. In this study, we investigate the relationship between river dams and the longitudinal profile of the upper Indus River basin, based on interpretation and analysis of remote sensing imagery and digital elevation models (DEMs) and local field work. We identified 178 landslide, glacier and debris flow dams. Using TopoToolbox, we automatically extracted the river longitudinal profile from the 30 m SRTM DEM, determined the location of convex knickpoints and calculated the channel steepness index. One hundred and two knickpoints were detected with heights above 148 m, of which 55 were related to dams. There is good spatial correspondence between dams, convexities in the river longitudinal profile and relatively high steepness index. Different dam types have different impacts on the river profile; on the upper Indus, debris flow dams have a greater impact than landslide and glacier dams and can form knickpoints of up to 900 m. Therefore, dams may have a significant influence on the river longitudinal profile, knickpoints and steepness index, and should be considered when extracting information on regional tectonics using these indices.
Introduction
Rivers are not only a significant driving force of geomorphic evolution, but also an important geomorphic unit that can record other driving forces such as tectonic activity and climate change (Whipple, 2000; Beaumont et al., 2001; Kirby and Whipple, 2001; Kirby et al., 2003; Whipple, 2004; Zhang et al., 2017). The development of high-resolution and global digital elevation applications has facilitated extraction and analysis of the river longitudinal profile and they have been widely used to derive indexes of long-term tectonic evolution (Hu et al., 2010; Pánek et al., 2010; Goren et al., 2014; Willett et al., 2014; Yang et al., 2015; Wang et al., 2017). The long profile can act as a predictor of zones of erosion and sediment deposition during extreme events (Korup, 2006a; Korup, 2006b; Korup and Montgomery, 2008; Walsh et al., 2012) and reflect the repeated impact of mass-wasting events (Korup, 2006b). River longitudinal profiles and metrics derived from them, such as channel steepness indexes and knickpoints (Wobus et al., 2006), have become critical tools for studying the topographic evolution of mountain belts and deciphering changes in climate and tectonics (Bishop et al., 2005). The most direct and widely observed expression of river adjustment to transient or intrinsic perturbations is a discrete change in river gradient, commonly termed a “knickpoint”. As the number and spatial distribution of knickpoints and knickzones play an important role in interpreting tectonically active landscapes, it is critical that studies use a reproducible method of quantifying their locations (Gailleton et al., 2019).
In recent years, studies have shown that the river longitudinal profile may exhibit a significant response to extreme damming events (Korup, 2006a; Korup, 2006b; Korup and Montgomery, 2008; Korup et al., 2010a; Walsh et al., 2012). However, the role of natural dams is often not considered when extracting quantitative morphological parameters from the long profile; knickpoints caused by extreme events may compromise the reliability of tectonic and climate change interpretations. The Nanga Parbat–Haramosh Massif in the western Himalayas comprises some of the greatest relief on Earth, with the highest measured rates of uplift, denudation and river incision in bedrock (Hewitt et al., 2011). Many studies have sought to understand how the morphology of the massif relates to tectonics, glaciation and sediment yield (Shroder et al., 1993; Korup et al., 2007), but few extreme damming events had been recognized and many of their impacts had been attributed to other processes (Hewitt, 2009a).
Existing research on dams in the Himalayan region is mostly concentrated in the southeastern margin of the Qinghai-Tibetan Plateau (Ouimet et al., 2007; Xu et al., 2013; Chen and Cui, 2015; Liu et al., 2015; Liu et al., 2018). Using remote sensing interpretation and field survey, Korup et al. (2010b) identified over 900 glacier and landslide dams along the Yarlung Tsangpo and Indus rivers that were consistent with the distribution of river knickpoints; the study concluded that the damming effect played an important role in maintaining the integrity of the Qinghai-Tibetan Plateau. The Indus River is mainly located in the western Himalayan tectonic syntaxes, with deep valleys and numerous glaciers. Hewitt (2009a) identified nearly 150 landslide dams in the upper Indus River, and suggested that Holocene river system evolution has been controlled by landslide-driven channel deposition and incision, rather than tectonic activity and glaciation. Hewitt (2009a) concluded that the contribution of extreme damming events to denudation and sedimentation in the upper Indus River and its tributaries had been largely overlooked.
Many previous studies have used river profiles and knickpoints to retrieve information on tectonic activity (Hu et al., 2010; Goren et al., 2014), but they seldom consider the long-term impact of extreme surface processes on fluvial geomorphology (Korup, 2006a; Ouimet et al., 2007). A few studies have confirmed the correlation between dams and knickpoints, and suggested causal linkages (Korup, 2006b; Walsh et al., 2012; Scheingross et al., 2020), but not examined the influence of different dam types on the magnitude of river knickpoints. In this preliminary study, we identify different types of dams in the upper Indus River basin and quantify their influence on the river longitudinal profile and knickpoint magnitude, in order to understand the geomorphic response of river damming. The study provides basic data for evaluating mechanisms driving the geomorphic evolution of the western Himalayan syntaxes.
Study Area
The upper Indus River in the southwestern Qinghai-Tibetan Plateau, is part of the western Himalayan syntaxes, which covers the Hindu Kush, Karakoram and most of the western Himalayan mountains (Immerzeel et al., 2015) (Figure 1). There are large differences in local climate with altitude, from arid valley floors at lower elevations to perennial ice climates with heavy snowfall and extensive glacier cover at higher elevations (Hewitt, 1994). Glaciers transport large volumes of debris and their melt waters dominate the flow of the upper Indus. Earthquakes and extreme weather events combine with rugged, steep terrain to produce countless large landslides, snow avalanches, rock falls and debris flows; and there is a history of catastrophic floods from the breaching of natural dams (Hewitt, 1982).
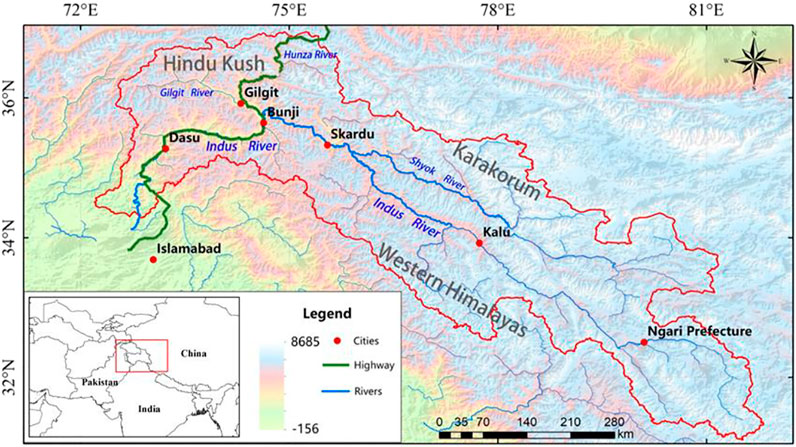
FIGURE 1. Location of the study area in the upper Indus River, western Himalayas.
The upper Indus basin has a subtropical climate, with a strong monsoon that is affected by the regional topography to give a large precipitation gradient (Figure 2). A global precipitation dataset (http://www.worldclim.org/) indicates mean annual precipitation in the catchment from 1970 to 2000 of c. 25–1,353 mm/a (Figure 2A) the variation trend of precipitation distribution is inconsistent with the variation of channel stepness (ksn), so precipitation will not be taken as the factor affecting river channel variation in this paper. A partial geological map of the upper Indus, mainly covering the Indus gorge and downstream reaches (http://www.ngac.org.cn), shows complex lithology in the downstream areas comprising intrusive and effusive volcanic rock, metamorphic rocks and sedimentary rocks (Figure 2B). The area is mainly controlled by two fault zones, the Indus Suture and Shyok Suture. The Shyok Suture Zone, mainly represented in ophiolites, traverses the Indus River. The Indus Suture forms the rapidly uplifting Nanga Parbat–Haramosh Massif, which mainly comprises lower Neoproterozoic strata. Quaternary uplift rates in the Indus gorge are estimated at 3–10 mm/a, with the higher rates on the Massif (Zeitler, 1985; Whittington et al., 1999). However, high rates of bedrock incision in the Indus gorge of 3–12 mm/a suggest fluvial down-cutting is able to keep pace with uplift (Burbank et al., 1996). This means that deposits are well preserved despite high rates of tectonic uplift and erosion in the Karakoram Himalaya.
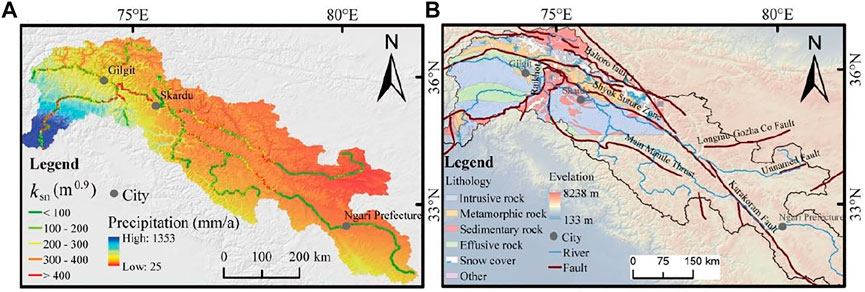
FIGURE 2. Precipitation and geology of the study area. (A) Normalized channel steepness (ksn) and average annual precipitation (1970–2000) in the upper Indus River (Precipitation data are c. 1 km2 resolution, from http://www.worldclim.org/version2): (B) Regional geological map (resolution 1:1,000,000, from http://www.ngac.org.cn).
Materials and Methods
Remote Sensing Interpretation of Dams
In remote areas such as the upper Indus, dams can be identified using a range of data sources, including literature review, field survey and remote sensing interpretation, combined with multi-period, high-resolution Google Earth images. Since we can only conduct field surveys on the China-Pakistan highway section, and other places cannot be reached, there is currently no better method to obtain data on dams for those places that cannot go to field surveys, therefore, the dams are mainly obtained through remote sensing interpretation in this study. The location of the dam was delineated using a combination of features including location of residual dam materials on both sides of the river channel, variation in river channel width, and presence of lacustrine sediments upstream channel or outburst flood sediment downstream (Figure 3).
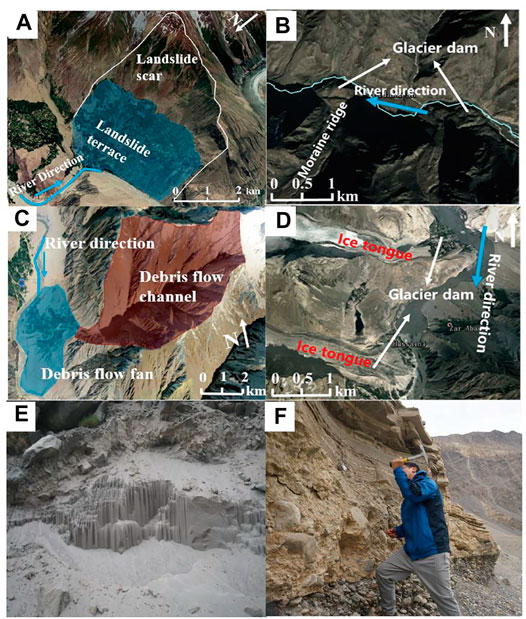
FIGURE 3. Example of remote sensing interpretation of dams from high-resolution Google Earth images. (A) Landslide; (B) Glacier dam; (C) Debris flow; (D) Glacier dam; (E) Outburst flood sediment; (F) lacustrine sediments.
The source or cause of the dam can be assessed using remote sensing interpretation; the three most common river-blocking mechanisms are landslide, debris flow and glacier advance, so identification of dam type is mainly based on the recognition of these features (Figure 3). At present, the remote sensing interpretation signs of these three types of mass movement have been relatively clearly studied (Li et al., 2015; Xu et al., 2014; Fan et al., 2019a; Bazai et al., 2021). This research uses unified remote sensing interpretation signs (e.g. morphology, tone, vegetation, texture structure and so on) to identify different mass movement (Table 1).
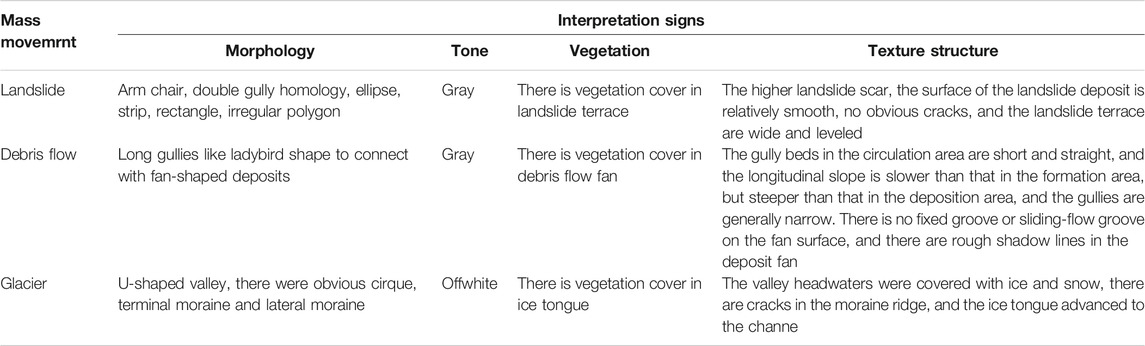
TABLE 1. Remote sensing interpretation signs of different mass movement.
In this study, we first established a set of remote sensing interpretation criteria for large landslides, debris flows and glaciers and applied it to visual interpretation of Google Earth images covering the upper Indus River (Table 1; Figure 3). Second, we collated results of studies on the Indus River to obtain the location of previously researched landslides and glaciers (Hewitt, 1998; Hewitt, 2009b; Hewitt, 2011). We use these data to verify and to revise the results of remote sensing interpretation. The height of the dam was determined using the difference in elevation between the highest point of the dam and the valley bottom by the Google Earth images. The geomorphic features we used to delineate dams represent the effect of long-term process, so the dams are paleo-dams that are the product of ancient landslide, debris flow and glacier activity, rather than contemporary features.
Digital Terrain Analysis
We obtained 30-m-resolution SRTM DEM data from National Aeronautics and Space Administration (NASA, https://earthdata.nasa.gov). We used ArcGIS to preprocess the DEM to obtain the complete Indus River basin, with the raster projection converted to WGS 1984_UTM 43 projection coordinates. Then we used TopoToolbox (Schwanghart and Scherler, 2014; https://topotoolbox.wordpress.com/) to extract river geomorphic parameters from the projected DEM, as outlined below.
Smoothing the River Longitudinal Profile
The analysis of river longitudinal profiles is an important tool for studying landscape evolution, however, characterizing river profiles based on digital elevation models (DEMs) is prone to errors and artifacts, particularly along valley bottoms, and elevations are commonly overestimated in steep topography. To avoid these problems, we used the constrained regularized smoothing (CRS) algorithm of Schwanghart and Scherler (2017) to correct and smooth the bumpy river profile (Figure 4A). CRS relies on quantile regression to enable hydrological correction and to quantify uncertainty on river profiles; the method uses quantile carving to reconstruct the profile along different quantiles, rather than using the minima and maxima of the commonly-used carving and filling approach (Figure 4B) (Schwanghart and Scherler, 2017). The CRS approach reduces elevation bias and errors in longitudinal river profiles compared with the conventional carving and filling method (Schwanghart and Scherler, 2017). Another advantage of the CRS method is that it can be applied to the whole river network, so facilitates a systematic analysis of the Indus River profile. In applying the CRS method to the Indus basin, we set the smoothing parameter K to five and quantile τ to 0.5.
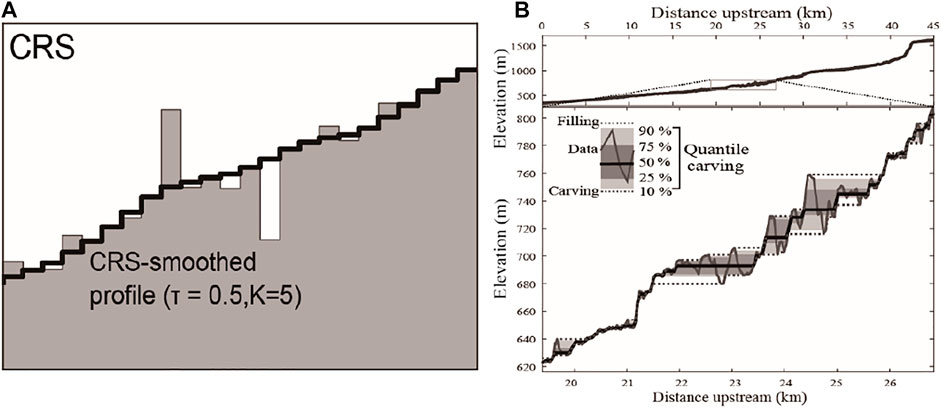
FIGURE 4. Schematic diagrams illustrating the method of smoothing the river profile using the approach of Schwanghart and Scherler (2017). (A) Smoothing using the constrained regularized smoothing (CRS) method; (B) Quantile carving of the longitudinal profile.
Extraction of River Knickpoints
Changes in river profile steepness or abrupt vertical steps in channels are thought to be indicative of changes in erosion rates, lithology or other factors that affect landscape evolution (Gailleton et al., 2019). These changes are termed knickpoints or knickzones and are widespread in bedrock river systems. The number and spatial distribution of knickpoints has been widely used in studies of tectonically active landscapes (Bishop et al., 2005). A range of different methods have been adopted to quantify knickpoint locations, which hinders comparisons, and commonly-used slope–area approaches make pinpointing of knickpoint locations difficult (Kirby and Whipple, 2012). We applied the KnickpointFinder function in TopoToolbox, which reproducibly extracts knickpoint locations from smooth river profiles, over the whole river network (Schwanghart and Scherler, 2014; Schwanghart and Scherler, 2017). The function has fewer parameters and is computationally more efficient than other methods (Gailleton et al., 2019) and the code is readily available online (https://topotoolbox.wordpress.com/).
The KnickpointFinder function uses an algorithm that adjusts a strictly concave upward profile to the actual profile. Offsets between the actual and the concave upward profile occur where the actual profile has convexities. Relaxing the concavity constraint where offsets attain a maximum will adjust the concave profile to the actual profile. KnickpointFinder adjusts the profile iteratively until offsets fall below a specified tolerance value (reflecting uncertainties inherent in river longitudinal profile data). Tolerance values selected should be higher than the maximum expected error between the measured and the true river profile. With lower tolerance values we would likely increase the false positive rate, i.e., the probability of choosing a knickpoint that is due to an artifact (Schwanghart and Scherler, 2017). To exclude knickpoints caused by artifacts, only those with heights greater than the tolerance value are selected to ensure the minimum number of real knickpoints are obtained. Using Schwanghart and Scherler, (2017) algorithm to calculate the research area river network, the tolerance parameter in TopoToolbox was fixed to 148 to extract river knickpoints. We used knickpoint height (e.g., derived from comparison with a reference profile) to directly quantify knickpoint magnitude in this paper.
Using the Stream-Power River Incision Model to Determine Steepness Index
In the stream-power river incision model, the elevation change of the channel is expressed by the difference between the uplift rate (U) of the bedrock and the erosion rate (E) of the river (Whipple, 2004):
Where, z represents the elevation of the river, x is distance from the estuary and t is time. The erosion rate of the river is given by the functional relationship between catchment area (A) and slope (S):
Where, K represents the erosion coefficient, and m and n are indexes of catchment area and slope, respectively. Combining Eqs. 1, 2:
Rearranging Equation 4 by
In this study, we calculated the river gradient and basin area based on the smooth river profile obtained using the CRS algorithm (Schwanghart and Scherler, 2017). We determined the standardized river steepness index (ksn) when θ = 0.45, and derived the average ksn for each 1000-m section of the river.
Results
Distribution of Dams and Steepness Index
The visual remote sensing interpretation identified 178 dams in the upper Indus region (Figure 5). Eighty-four landslide dams were located, mainly distributed in the middle and lower reaches of the main stream of the Indus River, 61 debris flow dams, mainly in the two major tributaries of the upper Shyork and middle Gilgit rivers, and 33 glacier dams, mainly in the upper reaches of the Hunza River. Overall, the distribution of the steepness index ksn seems to be influenced by topography and faults, with low values in the interior of the plateau and larger values at the edge of the plateau. The highest ksn is on the Nanga Parbat–Haramosh Massif which is characterized by the highest rates of erosion and uplift in the region. Comparing the distribution of dams with ksn and faults (Figure 5), shows that some dams are adjacent to fault lines and most are in areas with high ksn. Analysis of the height and elevation characteristics of the dams identified in the upper Indus (Table 2) shows that over 60% of dams are 100–300 m in height. In term of elevation, most dams are found in middle and high altitude areas, between 2000 and 4,000 m.
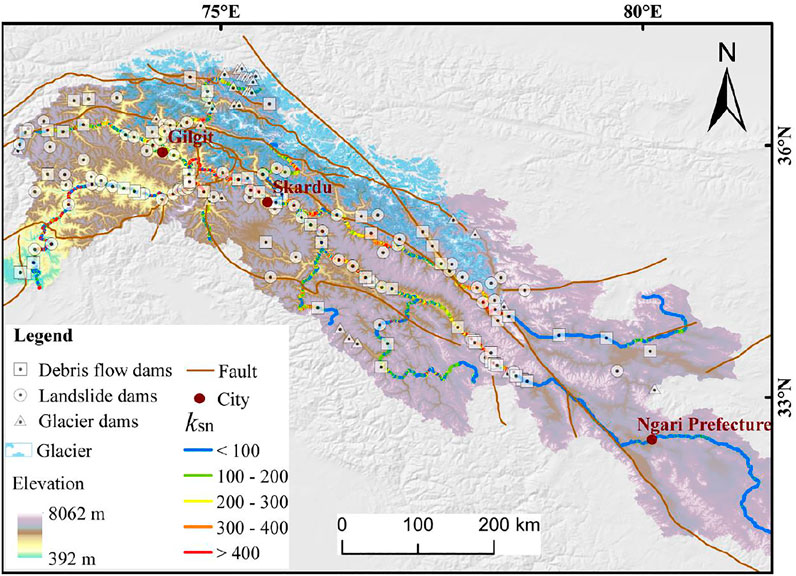
FIGURE 5. Spatial distribution of dams in the upper Indus River as identified from remote sensing interpretation.
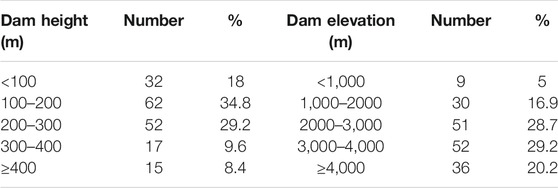
TABLE 2. Height and elevation characteristics of natural dams in the upper Indus River.
Extraction of River Geomorphic Parameters
Overall River Network
Figure 6 plots the results of the basin-wide knickpoint extraction using the TopoToolbox (Schwanghart and Scherler, 2014, 2017). Knickpoints are expressed as the difference to an idealized concave up profile; they are mainly found in the middle and lower reaches and small tributaries of the upper Indus River, while they are largely absent from upper reaches within the plateau (Figure 6). Figure 7 maps knickpoint locations with faults and ksn. Knickpoints mainly correspond with higher ksn and partly with fault lines. Large-magnitude knickpoints are mainly found in the plateau and alpine valley transition zone, the Nanga Parbat-Halamush Massif and Indus gorge.
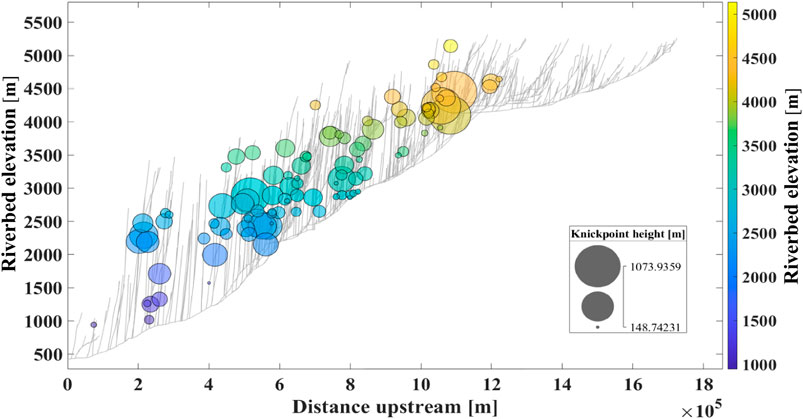
FIGURE 6. River longitudinal profile and location of river knickpoints in the upper Indus River.
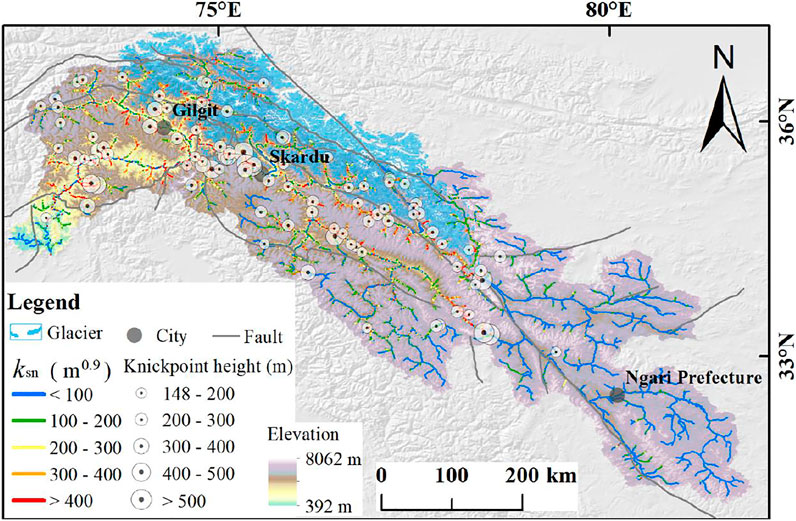
FIGURE 7. Distribution of knickpoints and normalized channel steepness (ksn) in the river network of the upper Indus River.
Preliminary analysis of the height and elevation characteristics of knickpoints (Table 3) shows that the largest proportion are between 148–200 m in height and are located in the upper valley area of the river. Knickpoints between 200–300 m in height are found in small tributaries and glacial valleys on both sides of the main stream. Knickpoints between 300–400 m in height are located near the fault zone and those between 300–400 m in height are near the Indus gorge. Only five knickpoints are above 500 m in height, and most of these in the plateau-alpine canyon transition zone. Over three quarter of knickpoints are in the 148–300 m height range, and most are at 2000–4,000 m elevation, which is a similar distribution to the dams. This may indicate that mass movement sediments are more concentrated in middle and low mountain areas (2000–4,000 m).
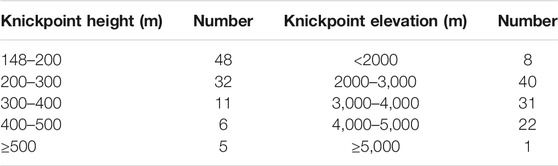
TABLE 3. Height and elevation characteristics of knickpoints in the upper Indus River.
Main Stream Knickpoints
DEM artifacts in tributary valleys make the overall tolerance values for knickpoint extraction larger compared to the main stream Indus River, which confounds direct comparison. To reduce the effect of the DEMs artifacts and increase the accuracy of knickpoint extraction, we divided the Indus basin into the main stream and seven sub-basins: Shyok River, Shigar River, Hunza River, Gilgit River, Astor River, Shingo River, and Zanskar River (Figure 8). The quantile carving method was used to calculate the tolerance value for the main steam in each sub-basin, then knickpoints were identified through iterative calculation using the KnickpointFinder function, giving a total of 30 knickpoints (Table 4). Figure 8 shows that the two knickpoints with height >400 m are in Indus River and Shyok Rive, mainly in the plateau region transition zone. Further comparison showed that the value of ksn at the two knickpoints also changed significantly. In Indus River upstream of the knickpoint, the value of ksn was relatively small with an average of 44 m0.9, while in the downstream, the value of ksn increased significantly with an average of 293 m0.9. In Shyok River upstream of the knickpoint, the value of ksn was relatively small with an average of 40 m0.9, while in the downstream, the value of ksn increased significantly with an average of 276 m0.9.
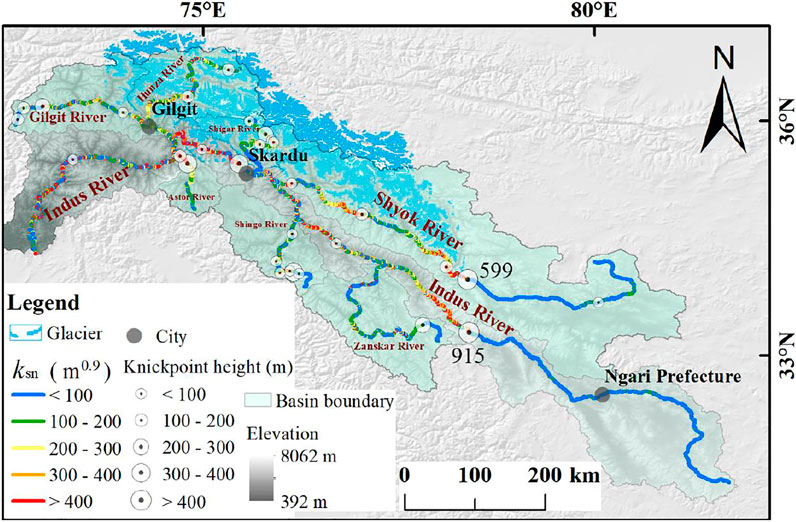
FIGURE 8. Distribution of knickpoints and normalized channel steepness (ksn) in the main stream and sub-basins of the upper Indus River.
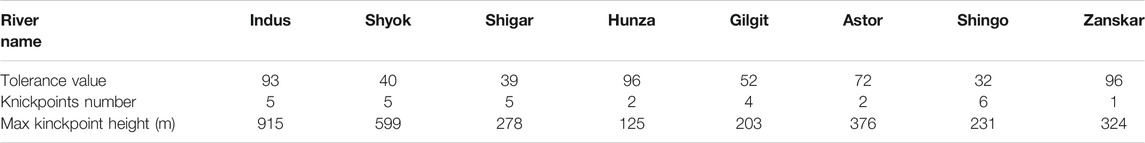
TABLE 4. Tolerance values and knickpoint extraction results for the main stream of major sub-basins in the Indus River basin (see Figure 8 for locations).
Discussion
Effects of Damming on Channel
The relationship between the river longitudinal profile and dams in the eight sub-basins of the upper Indus is plotted in Figure 9. We found that dams have a great influence on the longitudinal profile and steepness index of the river, and the three types of dam have different effects. On the Indus River, debris flow dams correspond with peaks in the steepness index and maximum ksn is 1,541 m0.9 (Figure 9A; Table 5), whereas on Shyok River landslide dams correspond with peaks in the steepness index and maximum ksn is 1,229 m0.9 (Figure 9B; Table 5). However, both rivers have similar long profiles, with relatively flat sections on the plateau that have low ksn values (Figures 9A,B), including lake areas with ksn around 0 (Figure 9B). Many glacier dams are developed in the Hunza River, but the river steepness index shows relatively little variation (Figure 9C). Debris flow dams are associated with steeper reaches in Gilgit River, Shingo River, and Astor River (Figures 9D,G,H) and although Zanskar River has fewer dams, they also correspond with relatively steep zones (Figure 9E). In Shigar River, the steepest part of the river lies in Glacier Valley, but landslide dams have a relatively large impact on the river profile (Figure 9F).
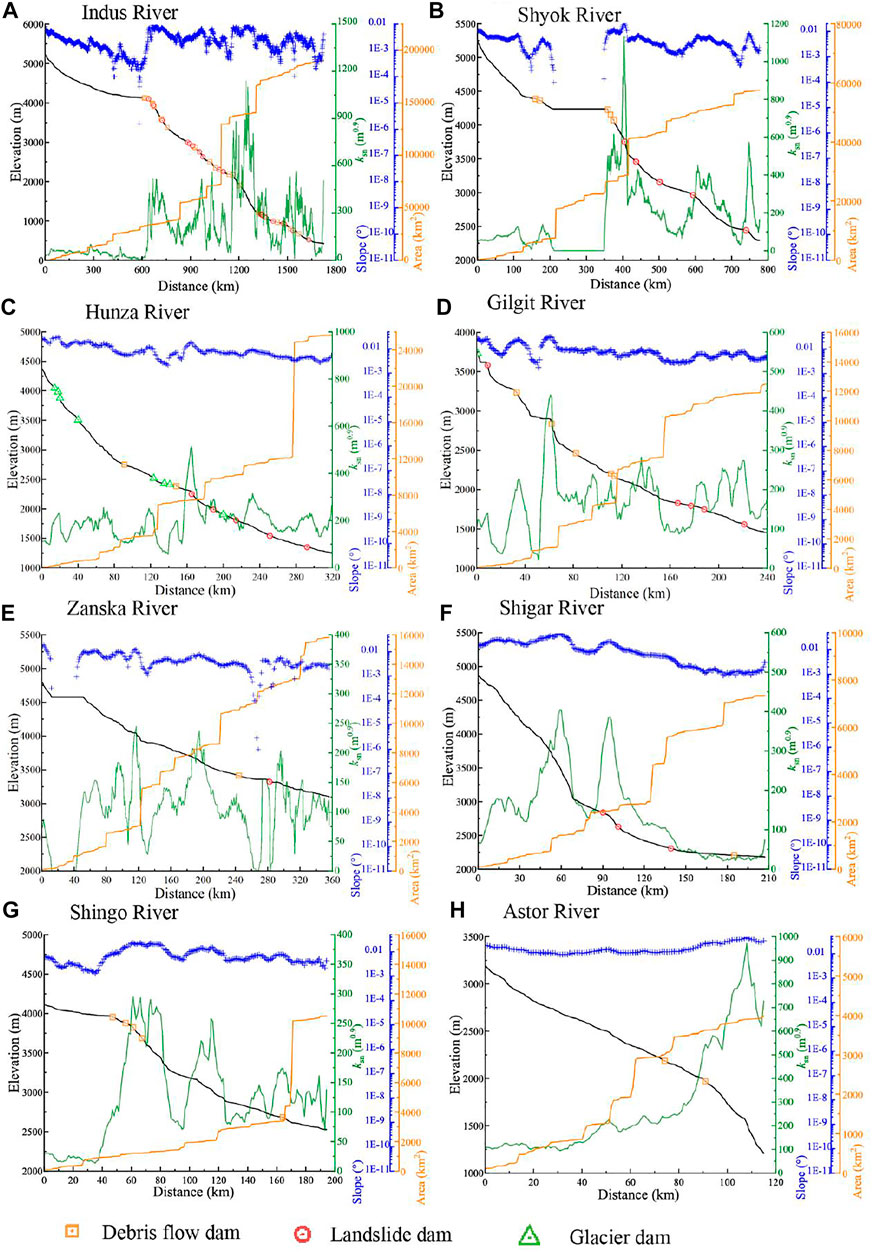
FIGURE 9. Spatial relationships between dams and river longitudinal profile in sub-basins of the upper Indus (see Figure 8 for locations). Each graph plots dam type (debris flow, landslide and glacier) on the long profile (black line), with upstream area (orange), slope (blue) and steepness index (green), the slope and steepness index are smoothed on average for every 10 values.
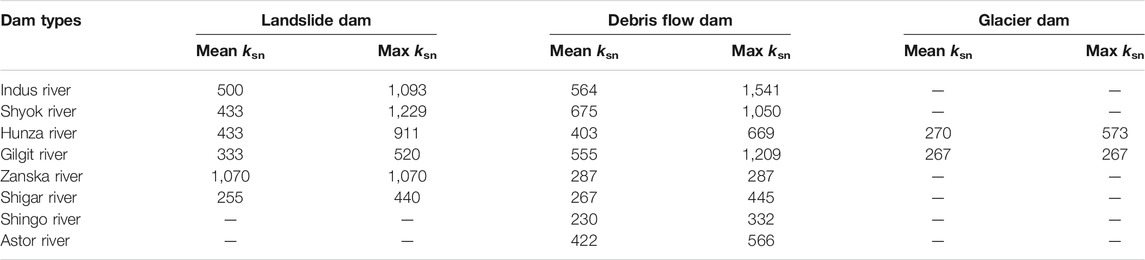
TABLE 5. Steepness index for each dam type (unit: m0.9).
Figure 9 shows that there is good correspondence between dam location, the convex part of the river longitudinal profile and relatively high steepness index. Debris flow dams have the greatest influence on the river long profile, with landslide dam second and glacier dams the least (Figure 9; Table 5). The river steepness index ksn has been widely used as an indicator of the topographic uplift in the region, with higher steepness values related to increased tectonic uplift rate (Hu et al., 2010; Wang et al., 2015). However, as we show above, steepness index is also reflective of the geomorphic response to damming, which is often neglected in tectonic studies (Korup, 2006b).
Most mass movement-generated dams on the Indus and its tributaries, some of which have impounded large lakes in the upper Indus, do not form persistent knickpoints. Factors such as size and duration of lake are also important. Also, it is likely that knickpoints may have been present initially, but the channel has now returned to an equilibrium state. There is ample evidence for ancient glacier dam blockages on the Hunza River, often associated with lake development, but our analysis shows limited geomorphic impact on the river profile, with no significant change in ksn (Figure 9C). The Siachen Glacier in Karakoram blocked the Shyok River during the last glacial period, forming a lake that persisted from 6–27 ka based on analysis of sediment thickness; however, the river has adjusted to a new equilibrium state and there is no significant impact on the longitudinal profile (Scherler et al., 2014). Other research suggests that upstream sedimentation during damming can protect bedrock from erosion, and even after the dam outburst, the coarse gravel of the dam itself and outburst flood deposit is difficult to be eroded by normal water flow, so the knickpoints can be maintained for a long time (Ouimet et al., 2007; Korup et al., 2010a). And studies on the Yarlung Zangbo and Jinsha rivers have shown that the influence of ancient dams on river channel can last at least tens of thousands of years (Liu et al., 2015; Liu et al., 2018).
Knickpoint Formation Types
To better understand the formation mechanism, we compared the spatial distribution of knickpoints across the Indus basin with dams, known faults and lithological variations (Figure 10). We identified spatial association linking 102 knickpoints to potential causes (Figure 10; Table 6): 23 knickpoints related to debris flow dams (DKP), 27 related to landslide dams (LKP), five related to glacier dams (GKP), six related to faults (FKP), 12 related to lithological variations (LOKP), 17 in glacier valley (GVKP) and 11 knickpoints unknown (OKP). However, using spatial correlation to imply causation is problematic; knickpoints may result from a combination of multiple factors, or migrate headwards so that their location changes over time (Zhang et al., 2011). Hence, it is necessary to make a judgment based on knowledge of local topographic features, tectonic activity, timing of damming event, etc.
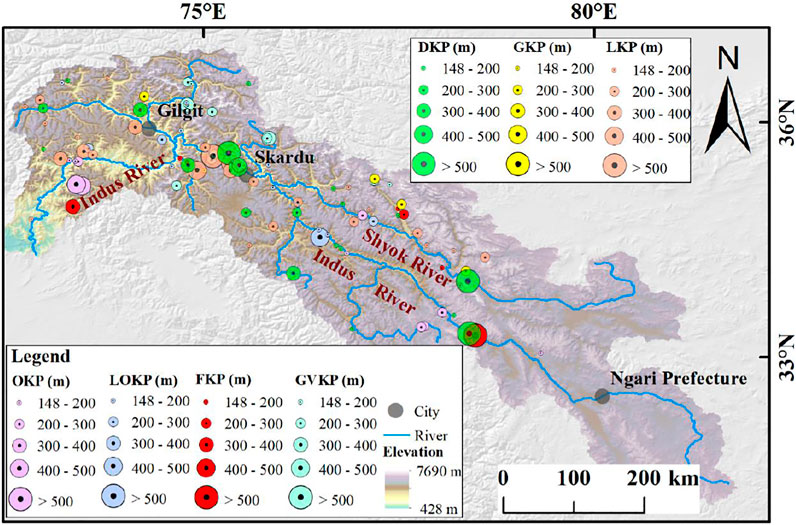
FIGURE 10. Distribution of knickpoint types in the upper Indus River.
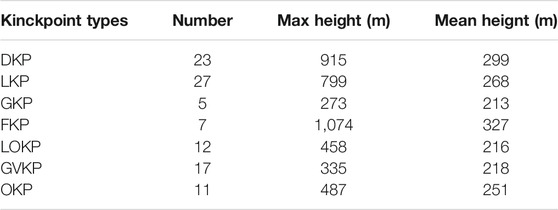
TABLE 6. Types of knickpoints and their height statistics (see Figure 10 for locations).
There are 55 knickpoints affected by the dams, accounting for more than half, but different types of dam have different effects on the knickpoint. We analyzed the height of the knickpoint associated with each formation type and found those associated with debris flow dams to be the greatest, with a maximum height of over 900 m (Table 6). This indicates the significant geomorphic impact of debris flow accumulation fans on the elevation profile of the channel, and may be due to the high frequency of debris flow events which makes their removal difficult. The importance of debris flows to knickpoints is supported by Fan et al. (2019b), who mapped 666 knickpoints in the Minjiang River Basin, at the eastern margin of the plateau, and found that most were related to accumulation from landslides and debris flows. Furthermore, Korup (2006b) found that no matter what the regional geological tectonic and climatic conditions are, knickpoints correspond with the location of large-scale bedrock landslide or collapse events. In the lower reaches of the Gilgit and Hunza rivers, wide valley sedimentary terraces are formed due to large landslides, with large amounts of landslide debris injected into the channel, which may affect the ability of river sediments to accrete, transport and erode (Burbank, 2002). Understanding of the geomorphic impact of dams on the river long profile, along with careful analysis of the structural and climatic background, is necessary to obtain a reasonable regional geomorphic evolution model.
Conclusion
We used TopoToolbox to extract the longitudinal profile, knickpoints and ksn values for the Indus River basin and compared them with dam types and location obtained through remote sensing interpretation. A total of 178 dams and 102 knickpoints were identified, with 55 knickpoints related to dams. Overall, there is a good spatial correlation between dams, high steepness index ksn and river knickpoints in the Indus basin. The impact of debris flow dams on the river longitudinal profile is more significant than that of landslide and glacial dams in the upper Indus River. Knickpoints formed by debris flow dams have a maximum height of over 900 m. The study demonstrates that dams play an important role in the evolution of river longitudinal profiles. The potential influence of dams should be considered when using river knickpoints to derive information on tectonic activity.
Data Availability Statement
The original contributions presented in the study are included in the article/supplementary material, further inquiries can be directed to the corresponding author.
Author Contributions
LZ is mainly responsible for data extraction and analysis of the paper, WL is mainly responsible for guiding and supervising the writing, and providing ideas, XC provided project support and paper discussion, HW provide discussion and guidance on the thesis writing process, XH provides a discussion of the revision of the thesis language and the writing process, XL provide discussion and suggestions on the writing process, WS provides TopoToolbox for extracting geomorphic parameter data.
Funding
This research was supported by the Second Tibetan Plateau Scientific Expedition and Research Program (STEP, Grant Nos. 2019QZKK0902f), the Strategic Priority Research Program of the Chinese Academy of Sciences (Grant Nos. XDA 20030301), the National Natural Science Foundation of China (Grant Nos. 42071017 and 41771023).
Conflict of Interest
The authors declare that the research was conducted in the absence of any commercial or financial relationships that could be construed as a potential conflict of interest.
Publisher’s Note
All claims expressed in this article are solely those of the authors and do not necessarily represent those of their affiliated organizations, or those of the publisher, the editors and the reviewers. Any product that may be evaluated in this article, or claim that may be made by its manufacturer, is not guaranteed or endorsed by the publisher.
Acknowledgments
A special acknowledgement should be expressed to China-Pakistan Joint Research Center on Earth Sciences that supported the implementation of this study, thanks to Professor ZongJi Yang for his assistance in the field survey.
References
Bazai, N. A., Cui, P., Carling, P. A., Wang, H., Hassan, J., Liu, D., et al. (2021). Increasing Glacial lake Outburst Flood hazard in Response to Surge Glaciers in the Karakoram. Earth-Science Rev. 212, 103432. doi:10.1016/j.earscirev.2020.103432
Beaumont, C., Jamieson, R. A., Nguyen, M. H., and Lee, B. (2001). Himalayan Tectonics Explained by Extrusion of a Low-Viscosity Crustal Channel Coupled to Focused Surface Denudation. Nature 414 (6865), 738–742. doi:10.1038/414738a
Bishop, P., Hoey, T. B., Jansen, J. D., and Artza, I. L. (2005). Knickpoint Recession Rate and Catchment Area: the Case of Uplifted Rivers in Eastern Scotland. Earth Surf. Process. Landforms 30, 767–778. doi:10.1002/esp.1191
Burbank, D. W., Leland, J., Fielding, E., Anderson, R. S., Brozovic, N., Reid, M. R., et al. (1996). Bedrock Incision, Rock Uplift and Threshold Hillslopes in the Northwestern Himalayas. Nature 379, 505–510. doi:10.1038/379505a0
Burbank, D. W. (2002). Rates of Erosion and Their Implications for Exhumation. Mineral. Mag. 66 (1), 25–52. doi:10.1180/0026461026610014
Chen, J., and Cui, Z. (2015). Discovery of Outburst Deposits Induced by the Xuelongnang Paleolandslide-Dammed lake in the Upper Jinsha River, China and its Environmental and hazard Significance. Acta Sedimentologica Sinica 33 (2), 275–284. (in Chinese).
Fan, X., Scaringi, G., Domènech, G., Yang, F., Guo, X., Dai, L., et al. (2019a). Two Multi-Temporal Datasets that Track the Enhanced Landsliding after the 2008 Wenchuan Earthquake. Earth Syst. Sci. Data 11 (1), 35–55. doi:10.5194/essd-11-35-2019
Fan, X., Yunus, A. P., Jansen, J. D., Dai, L., Strom, A., and Xu, C. (2019b). Comment on ‘Gigantic rockslides induced by fluvial incision in the Diexi area along the eastern margin of the Tibetan Plateau’ by Zhao et al. Geomorphology 338, 27–42. doi:10.1016/j.geomorph.2019.106963
Gailleton, B., Mudd, S. M., Clubb, F. J., Peifer, D., and Hurst., M. D. (2019). A Segmentation Approach for the Reproducible Extraction and Quantification of Knickpoints from River Long Profiles. Earth Surf. Dynam. 7, 211–230. doi:10.5194/esurf-7-211-2019
Goren, L., Fox, M., and Willett, S. D. (2014). Tectonics from Fluvial Topography Using Formal Linear Inversion: Theory and Applications to the Inyo Mountains, California. J. Geophys. Res. Earth Surf. 119 (8), 1651–1681. doi:10.1002/2014jf003079
Hewitt, K. (1994). “Altitudinal Organization of Karakoram Geomorphic Processes and Depositional Environments,” in In Himalaya to the Sea: Geology, Geomorphology and the Quaternary. Editor J. F. ShroderJr (New York: Routledge)), 159–183.
Hewitt, K. (1998). Catastrophic Landslides and Their Effects on the Upper Indus Streams, Karakoram Himalaya, Northern Pakistan. Geomorphology 26 (1), 47–80. doi:10.1016/s0169-555x(98)00051-8
Hewitt, K. (2009a). Catastrophic Rock Slope Failures and Late Quaternary Developments in the Nanga Parbat-Haramosh Massif, Upper Indus basin, Northern Pakistan. Quat. Sci. Rev. 28 (11–12), 1055–1069. doi:10.1016/j.quascirev.2008.12.019
Hewitt, K., Gosse, J., and Clague, J. J. (2011). Rock Avalanches and the Pace of Late Quaternary Development of River Valleys in the Karakoram Himalaya. Geol. Soc. America Bull. 123 (9), 1836–1850. doi:10.1130/b30341.1
Hewitt, K. (1982). “Natural dams and outburst foods of the Karakoram Himalaya,” in IAHS. 138, 259–269.
Hewitt, K. (2011). Rock Avalanche Dams on the Trans Himalayan Upper Indus Streams: A Survey of Late Quaternary Events and Hazard-Related Characteristics. Berlin, Heidelberg: Springer, 177–204. doi:10.1007/978-3-642-04764-0_6 Rock Avalanche Dams on the Trans Himalayan Upper Indus Streams: A Survey of Late Quaternary Events and Hazard-Related Characteristics
Hewitt, K. (2009b). Rock Avalanches that Travel onto Glaciers and Related Developments, Karakoram Himalaya, Inner Asia. Geomorphology 103 (1), 66–79. doi:10.1016/j.geomorph.2007.10.017
Hu, X., Pan, B., Kirby, E., Li, Q., Geng, H., and Chen, J. (2010). Spatial Differences in Rock Uplift Rates Inferred from Channel Steepness Indices along the Northern Flank of the Qilian Mountain, Northeast Tibetan Plateau. Chin. Sci. Bull. 55 (27/28), 3205–3214. doi:10.1007/s11434-010-4024-4
Immerzeel, W. W., Wanders, N., Lutz, A. F., Shea, J. M., and Bierkens, M. F. P. (2015). Reconciling High Altitude Precipitation in the Upper Indus Basin with Glacier Mass Balances and Runoff. Hydrol. Earth Syst. Sci. 12 (5), 4755–4784.
Kirby, E., and Whipple, K. (2001). Quantifying Differential Rock-Uplift Rates via Stream Profile Analysis. Geol. 29 (5), 415–418. doi:10.1130/0091-7613(2001)029<0415:qdrurv>2.0.co;2
Kirby, E., and Whipple, K. X. (2012). Expression of Active Tectonics in Erosional Landscapes. J. Struct. Geology 44, 54–75. doi:10.1016/j.jsg.2012.07.009
Kirby, E., Whipple, K. X., Tang, W., and Chen, Z. (2003). Distribution of Active Rock Uplift along the Eastern Margin of the Tibetan Plateau: Inferences from Bedrock Channel Longitudinal Profiles. J. Geophy. Res. Soil Earth 108 (4), 2217. doi:10.1029/2001jb000861
Korup, O., Clague, J. J., Hermanns, R. L., Hewitt, K., Strom, A. L., and Weidinger, J. T. (2007). Giant Landslides, Topography, and Erosion. Earth Planet. Sci. Lett. 261, 578–589. doi:10.1016/j.epsl.2007.07.025
Korup, O., Densmore, A. L., and Schlunegger, F. (2010b). The Role of Landslides in Mountain Range Evolution. Geomorphology 120 (1-2), 77–90. doi:10.1016/j.geomorph.2009.09.017
Korup, O. (2006a). Effects of Large Deep-Seated Landslides on Hillslope Morphology, Western Southern Alps, New Zealand. J. Geophy. Res. 111 (F1). doi:10.1029/2004jf000242
Korup, O., Montgomery, D. R., and Hewitt, K. (2010a). Glacier and Landslide Feedbacks to Topographic Relief in the Himalayan Syntaxes. Proc. Natl. Acad. Sci. 107 (12), 5317–5322. doi:10.1073/pnas.0907531107
Korup, O., and Montgomery, D. R. (2008). Tibetan Plateau River Incision Inhibited by Glacial Stabilization of the Tsangpo Gorge. Nature 455 (7214), 786–789. doi:10.1038/nature07322
Korup, O. (2006b). Rock-slope Failure and the River Long Profile. Geol. 34 (1), 45–48. doi:10.1130/g21959.1
Li, S., Deng, B., Xu, H., and Wang, Z. (2015). Fast Interpretation Methods of Landslides Triggered by Earthquake Using Remote Sensing Imagery. Remote Sensing Inf. 30 (04), 25–28. (in Chinese). doi:10.3969/j.issn.1000-3177.2015.04.005
Liu, W., Lai, Z., Hu, K., Ge, Y., Cui, P., Zhang, X., et al. (2015). Age and Extent of a Giant Glacial-Dammed lake at Yarlung Tsangpo Gorge in the Tibetan Plateau. Geomorphology 246, 370–376. doi:10.1016/j.geomorph.2015.06.034
Liu, W., Zhou, G. G. D., Ge, Y., and Huang, R. (2018). Gradual Late Stage Deepening of Gega Ice-Dammed lake, Tsangpo Gorge, southeastern Tibet, Indicated by Preliminary Sedimentary Rock Magnetic Properties. Acta Geophysica 66 (5), 1–8. doi:10.1007/s11600-018-0191-5
Ouimet, W. B., Whipple, K. X., Royden, L. H., Sun, Z., and Chen, Z. (2007). The Influence of Large Landslides on River Incision in a Transient Landscape: Eastern Margin of the Tibetan Plateau (Sichuan, China). Geol. Soc. Am. Bull. 119 (11-12), 1462–1476. doi:10.1130/b26136.1
Pánek, T., Hradecký, J., Smolková, V., Šilhán, K., Minár, J., and Zernitskaya, V. (2010). The Largest Prehistoric Landslide in Northwestern Slovakia: Chronological Constraints of the Kykula Long-Runout Landslide and Related Dammed Lakes. Geomorphology 120 (3–4), 233–247. doi:10.1016/j.geomorph.2010.03.033
Scheingross, J. S., Limaye, A. B., McCoy, S. W., and Whittaker, A. C. (2020). The Shaping of Erosional Landscapes by Internal Dynamics. Nat. Rev. Earth Environ. 1, 661–676. doi:10.1038/s43017-020-0096-0
Scherler, D., Munack, H., Mey, J., Eugster, P., Wittmann, H., Codilean, A. T., et al. (2014). Ice Dams, Outburst Floods, and Glacial Incision at the Western Margin of the Tibetan Plateau: A > 100 k.Y. Chronology from the Shyok Valley, Karakoram. Geol. Soc. Am. Bull. 126 (5-6), 738–758. doi:10.1130/b30942.1
Schwanghart, W., and Scherler, D. (2017). Bumps in River Profiles: Uncertainty Assessment and Smoothing Using Quantile Regression Techniques. Earth Surf. Dynam. 5 (4), 821–839. doi:10.5194/esurf-5-821-2017
Schwanghart, W., and Scherler, D. (2014). Short Communication: TopoToolbox 2 - MATLAB-Based Software for Topographic Analysis and Modeling in Earth Surface Sciences. Earth Surf. Dynam. 2 (1), 1–7. doi:10.5194/esurf-2-1-2014
Shroder, J. F., Owen, L., and Derbyshire, E. (1993). “Quaternary Glaciation of the Karakoram Mountains and Nanga Parbat Himalaya,” in Himalaya to the Sea: Geology, Geomorphology, and the Quaternary. Editor J.F. Shroder (London, United Kingdom: Routledge)), 132–158.
Walsh, L. S., Martin, A. J., Ojha, T. P., and Fedenczuk, T. (2012). Correlations of Fluvial Knickzones with Landslide Dams, Lithologic Contacts, and Faults in the Southwestern Annapurna Range, central Nepalese Himalaya. J. Geophy. Res. Earth Surf. 117 (F1), 1012. doi:10.1029/2011jf001984
Wang, N., Han, Z., Li, X., Chen, G., Wang, X., and Lu, H. (2015). Tectonic Uplift of Mt. Lushan Indicated by the Steepness Indices of the River Longitudinal Profiles. Acta Geographica Sinica 70 (09), 1516–1525. (in Chinese). doi:10.11821/dlxb201509013
Wang, Y., Zhang, H., Zheng, D., von Dassow, W., Zhang, Z., Yu, J., et al. (2017). How a Stationary Knickpoint Is Sustained: New Insights into the Formation of the Deep Yarlung Tsangpo Gorge. Geomorphology 285, 28–43. doi:10.1016/j.geomorph.2017.02.005
Whipple, K. X. (2004). Bedrock Rivers and the Geomorphology of Active Orogens. Annu. Rev. Earth Planet. Sci. 32 (1), 151–185. doi:10.1146/annurev.earth.32.101802.120356
Whipple, K. X., Hancock, G. S., and Anderson, R. S. (2000). River Incision into Bedrock: Mechanics and Relative Efficacy of Plucking, Abrasion, and Cavitation. Geol. Soc. America Bull. 112 (3), 490–503. doi:10.1130/0016-7606(2000)112<490:riibma>2.0.co;2
Whittington, A. G., Harris, N. B. W., and Butler, R. W. H. (1999). “Contrasting Anatectic Styles at Nanga Parbat, Northern Pakistan,” in Himalaya and Tibet: Mountain Roots to Mountain Tops. Editors A. MacFarlane, R.B. Sorkhabi, and J. Quade Boulder, Colo, Geol. Soc. of Am. 328, 129–144.
Willett, S. D., McCoy, S. W., Perron, J. T., Goren, L., and Chen, C.-Y. (2014). Dynamic Reorganization of River Basins. Science 343 (6175). doi:10.1126/science.1248765
Wobus, C., Whipple, K. X., Kirby, E., Snyder, N., Johnson, J., Spyropolou, K., et al. (2006). Tectonics from Topography: Procedures, Promise, and Pitfalls. GSA Spec. Pap. 398, 55–74. doi:10.1130/2006.2398(04)
Xu, C., Shyu, J. B. H., and Xu, X. (2014). Landslides Triggered by the 12 January 2010 Port-Au-Prince, Haiti, Mw = 7.0 Earthquake: Visual Interpretation, Inventory Compiling, and Spatial Distribution Statistical Analysis. Nat. Hazards Earth Syst. Sci. 14 (7), 1789–1818. doi:10.5194/nhess-14-1789-2014
Xu, Z., Liu, W., and Huang, R. (2013). Geomorphological Effects of Landslide Damming. Quat. Sci. 33 (3), 490–500. (in Chinese).
Yang, R., Willett, S. D., and Goren, L. (2015). In Situ low-relief Landscape Formation as a Result of River Network Disruption. Nature 520 (7548), 526–529. doi:10.1038/nature14354
Zeitler, P. K. (1985). Cooling History of the NW Himalaya, Pakistan. Tectonics 4, 127–151. doi:10.1029/tc004i001p00127
Zhang, H., Kirby, E., Pitlick, J., Anderson, R. S., and Zhang, P. (2017). Characterizing the Transient Geomorphic Response to Base-Level Fall in the Northeastern Tibetan Plateau. J. Geophys. Res. Earth Surf. 122 (2), 546–572. doi:10.1002/2015jf003715
Keywords: river longitudinal profile, dams, knickpoint, steepness index, upper Indus River
Citation: Zhou L, Liu W, Chen X, Wang H, Hu X, Li X and Schwanghart W (2021) Relationship Between Dams, Knickpoints and the Longitudinal Profile of the Upper Indus River. Front. Earth Sci. 9:660996. doi: 10.3389/feart.2021.660996
Received: 30 January 2021; Accepted: 20 July 2021;
Published: 30 July 2021.
Edited by:
Biswajeet Pradhan, University of Technology Sydney, AustraliaReviewed by:
Joern Lauterjung, German Research Centre for Geosciences, Helmholtz Centre Potsdam, GermanyMing Zhang, China University of Geosciences Wuhan, China
Copyright © 2021 Zhou, Liu, Chen, Wang, Hu, Li and Schwanghart. This is an open-access article distributed under the terms of the Creative Commons Attribution License (CC BY). The use, distribution or reproduction in other forums is permitted, provided the original author(s) and the copyright owner(s) are credited and that the original publication in this journal is cited, in accordance with accepted academic practice. No use, distribution or reproduction is permitted which does not comply with these terms.
*Correspondence: Weiming Liu, liuwm@imde.ac.cn