Geoarchaeology and Heritage Management: Identifying and Quantifying Multi-Scalar Erosional Processes at Kisese II Rockshelter, Tanzania
 Ilaria Patania1,2*
  Samantha T. Porter3 William F. Keegan4,5 Rukia Dihogo6 Sara Frank6
  Jason Lewis7
  Husna Mashaka8 Julius Ogutu9
  Elena Skosey-Lalonde4,10
  Christian A. Tryon4,11 Elizabeth M. Niespolo12,13
  Debra Colarossi14,15
  Kathryn L. Ranhorn16,17
- 1Zinman Institute of Archaeology, University of Haifa, Haifa, Israel
- 2Department of Maritime Civilization, University of Haifa, Haifa, Israel
- 3Liberal Arts Technologies and Innovation Services, University of Minnesota, Minneapolis, MN, United States
- 4Department of Anthropology, University of Connecticut, Storrs, CT, United States
- 5Heritage Consultants LLC, Newington, CT, United States
- 6History and Archaeology Department, University of Dar es Salaam, Dar es Salaam, Tanzania
- 7Department of Anthropology and Turkana Basin Institute, Stony Brook University, New York, NY, United States
- 8Department of History and Archaeology, University of Nairobi, Nairobi, Kenya
- 9Facultad geografía e historia, Universidad Complutense de Madrid, Madrid, Spain
- 10The Interdisciplinary Center for Archaeology and Evolution of Human Behaviour, Universidade do Algarve, Faro, Portugal
- 11Human Origins Program, National Museum of Natural History, Smithsonian Institution, Washington, DC, United States
- 12Department of Earth and Planetary Science, University of California-Berkeley, Berkeley, CA, United States
- 13Berkeley Geochronology Center, Berkeley, CA, United States
- 14Department of Human Evolution, Max Planck Institute for Evolutionary Anthropology, Leipzig, Germany
- 15Department of Geography and Earth Sciences, Aberystwyth University, Aberystwyth, United Kingdom
- 16School of Human Evolution and Social Change, Arizona State University, Tempe, AZ, United States
- 17Institute of Human Origins, Arizona State University, Tempe, AZ, United States
Natural and anthropogenically induced soil erosion can cause serious loss of the archaeological record. Our work shows the value of multi-scalar geoarchaeological study when excavating and re-excavating rockshelters in a highly dynamic sedimentary environment where erosion is prominent. Here we present our work on Kisese II rockshelter, Tanzania, originally excavated in the 1950s and largely unpublished, that preserves an important Pleistocene-Holocene archaeological record integral to understanding the deep history of the Kondoa Rock-Art World Heritage Center. Unlike rockshelters in quiescent tectonic settings, like much of central Europe or South Africa, Kisese II exists in highly dynamic sedimentary environments associated with the active tectonics of the Great Rift Valley system exacerbated by human-induced environmental and climate change. We report on our 2017 and 2019 exploratory research that includes integrated regional-, landscape-, and site-scale geoarchaeological analyses of past and present sedimentary regimes and micromorphological analyses of the archaeological sediments. Historical records and aerial photographs document extensive changes in vegetation cover and erosional regimes since the 1920s, with drastic changes quantified between 1960 and 2019. Field survey points to an increased erosion rate between 2017 and 2019. To serve future archaeologists, heritage specialists, and local populations we combine our data in a geoarchaeological catena that includes soil, vegetation, fauna, and anthropogenic features on the landscape. At the site, micromorphological coupled with chronological analyses demonstrate the preservation of in situ Pleistocene deposits. Comparison of photographs from the 1956 and 2019 excavations show a maximum sediment loss of 68 cm in 63 years or >10% of >6-m-thick sedimentary deposit. In the studied area of the rockshelter we estimate ∼1 cm/yr of erosion, suggesting the ongoing removal of much of the higher archaeological sediments which, based on the coarse stratigraphic controls and chronology of the original Inskeep excavations, would suggest the loss of much of the archaeological record of the last ∼4000 years. These multi-scalar data are essential for the construction of appropriate mitigation strategies and further study of the remaining stratigraphy.
Introduction
Caves and rockshelters are important sedimentary archives for studying the deep human past because of their persistent and repeated use across the Pleistocene and Holocene for habitation, burial of the dead, as surfaces for painting or engraving, and other purposes. Excavation of these sites require an archaeological methodology attuned to reconstructing the environmental processes that formed and shaped them over millennia. We emphasize here the documentation of environmental and anthropogenic factors that may contribute to the loss of these cultural-environmental archives through erosion. We use the Kisese II rockshelter in north-central Tanzania as our case study to explore how an integrated geological and archaeological approach can document past and present sedimentary regimes to understand portions of the deep history of eastern Africa and help frame conservation approaches to preserve this record.
Climate change affects cultural heritage at all latitudes and for decades archaeologists have documented these processes (Sesana et al., 2021). In particular, erosion has been studied at sites along coastal areas as these environments are particularly sensitive to changes in sea level (e.g., Davis et al, 2020). In arctic environments archaeologists have documented accelerated loss of heritage in association with melting ice (e.g., Hollesen et al., 2018). Despite these known processes, methods to study how landscape dynamics can potentially erase records of the past are still uncommon. Geoarchaeological advances have made possible important studies on 1) how past human and natural forces impact archaeological and natural sediments (e.g., Karkanas et al., 2000; Stiner et al., 2001; Shahack-Gross et al., 2004); 2) how erosion can contribute to the creation of a complex geo-archaeological stratigraphy (e.g., Karkanas and Goldberg, 2013); and 3) how landscape erosion, sedimentation, and cave entrance and rockshelter stratigraphy can be incorporated to reconstruct the past (Karkanas et al., 2020). Our geoarchaeological study at Kisese II builds on these approaches and investigates historic and continuing impacts of changing strategies of pastoralism, farming, and land use policy changes on the archaeological record of the Kondoa region in north-central Tanzania. The results of this study can both contribute to roadmaps for future climate change responses and provide a model for integrating multiple stakeholder community perspectives in the reconstruction and study of ancient social and environmental processes.
This paper extends from a simple observation: comparison of archival photographs and present-day field observations suggest the loss of up to 60 cm of sediment by erosion at Kisese II between 1956 and 2019, a loss that likely removed most of the “Iron Age” archaeological record (beginning locally ∼1 ka; Kessy 2013) at the shelter, and sediments sampling the period when much of the rock art for which the region is famous was made (Bwasiri and Smith, 2015). Combined with observations about the rapid fading and possible loss of many of the painted images since their first recording almost a hundred years ago (Temu, 2018), we are confronted with the immediate need to understand and hopefully mitigate some of these processes that are contributing to the alteration of the local sedimentary and archaeological records at Kisese II.
Our study is one of the first in Tanzania to consider historical and coeval landscape studies. We employ a multi-scalar analytical approach, from the regional to the microscopic, to understand the impact of slope-erosional and sedimentary forces on rockshelter sediments to aid excavation strategy, interpretation of sedimentology, and issues of site conservation. Scholars in general and archaeologists specifically have described the importance of ensuring practical outcomes of research (Bwasiri and Emmanuel, 2011; Mehari and Ryano, 2016; González-Ruibal et al, 2018; Schmidt, 2019) and collaborating with community stakeholders in academic research (Schmidt and Pikirayi, 2016, Douglass and Cooper, 2021). We build a critical link between archaeological research, heritage management, and climatic and environmental change in the Kondoa region. The site of Kisese II is a relevant case study as it is situated in an area notorious for high erosion, where human intervention to minimize soil impoverishment and erosion is well documented (reviewed in Lane 2010). Overall, this study will contribute to our understanding of the impact of erosion on rockshelter and cave entrance sediments in highly active erosive environments such as the one in Kondoa where archaeological sites are abundant. We hope to contribute to a way of doing archaeology in eastern Africa and elsewhere that answers the call to produce a “usable past” (Andah, 1995; Kryder-Reid, 1997; Hassan, 1999; Schmidt, 2006; Lane, 2009).
Kisese II Site Context
The site of Kisese II lies within the Kondoa Rock Art Sites World Heritage Region in Tanzania (Figure 1), the richest area of preserved rock art in eastern Africa, likely made by both foragers and pastoralists (Bwasiri and Smith, 2015). Kisese II is one of the few sites in the region with a long (>6-m-thick) stratigraphic sequence that preserves a record of environmental and human behavioral change spanning portions of the Late Pleistocene and Holocene (see Masao, 1976; Ranhorn et al., in review). First excavated in 1951 by M.D. and L.S.B. Leakey, major excavations later took place in 1956 by R.R. Inskeep (summarized in Tryon et al., 2018; Tryon et al., 2019) which demonstrated the presence of multiple human burials, thousands of ostrich eggshell beads, and a rich corpus of worked and unworked ochre, stone tools, ceramics, and fossil fauna.
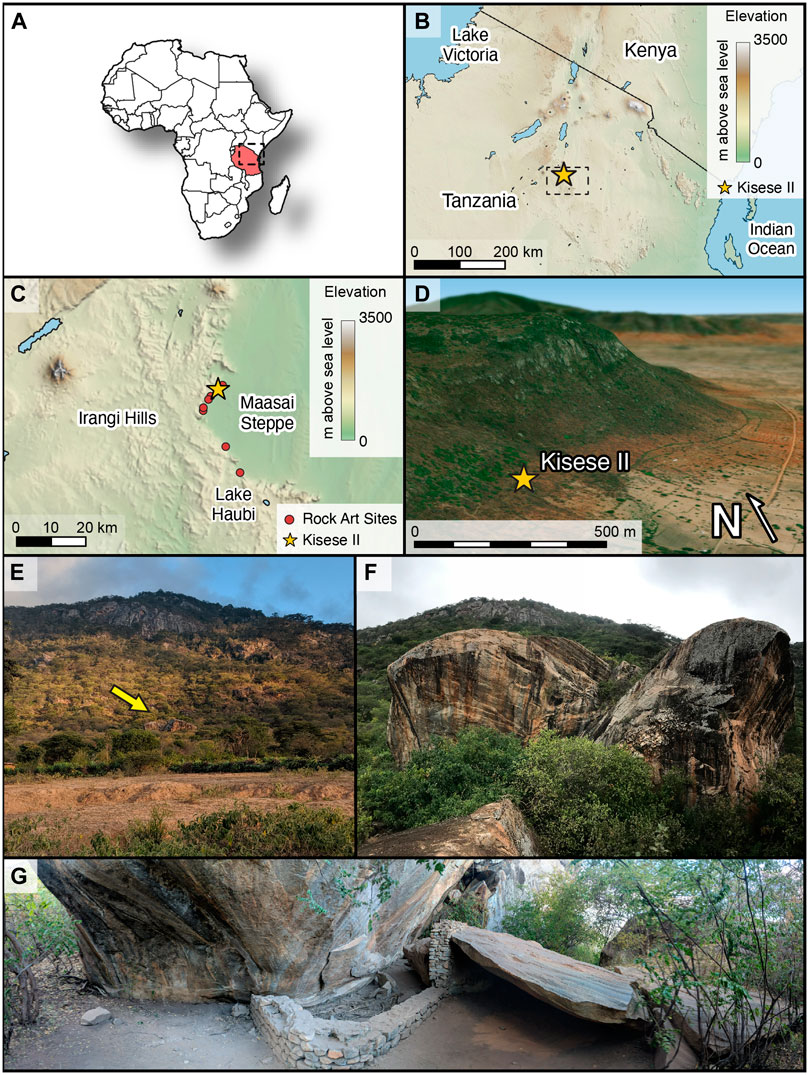
FIGURE 1. (A) Political map of Africa with Tanzania and the area shown in (B) indicated by a dashed line. (B) Geographic location of Kisese II rockshelter (marked by the star) and the area shown in (C) indicated by a dashed line. (C) Close up of the area with the location of Kisese II and other rock art sites identified by the UNESCO World Heritage Centre (red dots). (D) Position of Kisese II on the slope of the Irangi Hills. View facing NE. Image generated with the BlenderGIS addon for Blender. (E) View of the site (indicated by an arrow) taken from the downslope facing northwest. (F). Detail of the two large boulders sheltering the Kisese II site taken from the smaller front boulder and facing northwest. (G) Panoramic image of the archaeological site taken in 2019 showing the location of the shelter, slabs, small boulder, and modern wall.
Published details of the Leakey and Inskeep excavations are sparse, and our initial restudy of the site began in 2012 and focused on archival and museum-based collections from these initial excavations (e.g., Tryon et al., 2018; Niespolo et al., 2020; Laird et al., 2021). Radiocarbon dates from ostrich eggshell fragments indicate the Kisese II archaeological record spans at least the last 50,000 years (50 ka) (Tryon et al., 2018) but due to limited excavation information the extent of lateral variation in deposition and age was unknown. Excavations and field study resumed in 2017 and 2019 by the Kondoa Deep History and Heritage Project (KDHP), initiated and directed by Ranhorn in 2017. Published studies of the rock art of the Kondoa region more broadly began in the 1920s, with detailed efforts by L.S.B. Leakey (1936); Leakey (1950); Masao (1982); Leakey (1983); Bwasiri and Smith (2015).
The rockshelter is positioned on the Irangi Hills on the eastern margin of the Gregory Rift Valley (Figures 1D,E) and consists of a shallow (∼10 m), east-facing, overhang on a large boulder about 200 m below the escarpment; one other large boulder makes up the complex while one smaller one and a fallen slab rest in front of the rockshelter (Figures 1E–G). The site is somewhat protected from the elements by the front boulder, with a favorable lookout point easily reached by climbing on top of the boulders where the Maasai Steppe and the eastern margins of the Irangi Hills are visible, making it a desirable place for habitation and other human activities.
The Irangi Hills mostly consist of Pre-Cambrian feldspathic gneisses and schists (Eriksson et al, 2000). Soil types change gradually downslope and are today highly eroded; the main soils listed in past studies of the Kondoa landscape include chromic luvisols, lixisols, and regosols on the upper slope, ferric lixisols in the mid-slope, and albic arenasols and gleysols (locally called mbuga soils) in the piedmont and plains of the Maasai Steppe (Payton et al., 1992).
Today, the Kondoa region has a semi-arid to tropical savanna climate with a bimodal precipitation pattern and an average of 500–800 mm mean annual precipitation with frequent high-intensity storms during rainy seasons (Lyaruu and Backeus, 1999). Reconstructions of Late Pleistocene-Holocene rainfall from materials collected at Kisese II indicate similar or drier conditions in the past (Niespolo et al., 2020). Paleoenvironmental studies at the Lake Haubi Basin, ca. 25 km NE of Kondoa, show that the history of erosion in Kondoa dates to at least 14 ka (Eriksson et al, 2000) (Figure 1).
Methodology
To reach a full understanding of the site and the landscape, a diachronic understanding of sedimentary processes is necessary. For this reason, we employ a multi-scalar analytical approach, from regional to landscape to microscopic, that includes a combination of bibliographic research, archival aerial photographs, landscape survey, 3D reconstruction, GIS mapping of the slope below the site and the rockshelter, total station mapping of rockshelter sediments and rock faces, and micromorphological study of the archaeological sediments.
Historical Synthesis of Regional Paleoenvironments
To contextualize our analyses we performed a regional paleoenvironmental review of published material and historical documents. This is necessary to understand the modern environmental situation and its impact on the archaeological and land resources of Kondoa. We reconstructed vegetation change, erosion, sedimentary regimes and the impacts on local inhabitants using published geological and palaeoclimatological data as well as colonial and post-independence land management policies over the last 100 years. These results are presented in the discussion section only as they are not newly produced data but are necessary for the appropriate contextualization of our data.
Landscape Reconstruction Using Aerial Imagery, GIS Analyses, and Pedestrian Survey
By landscape scale we mean the immediate vicinity (∼5 km2 radius) of the site of Kisese II for which we did comparative GIS analyses on photographs from 1960 to 2019 and two foot surveys of the slope. For 1960, we used aerial photographs DOS-49-TN-0011-0122 and DOS-49-TN-0011-0123 from flights over the area in July 1960 produced for the Directorate of Overseas Surveys (D.O.S.) from the D.O.S. archives at the National Collection of Aerial Photography (NCAP) in Scotland. The 1960 flights represent the earliest systematic aerial photography of the region (cf. McGrath, 1976; McIlwaine, 1997; Caillard, 2003), and dates to 4 years after Inskeep’s excavations at Kisese II. All images used in the analysis were taken during the dry season. Modern aerial photograph data was collected from Google Maps for 2019, with the image captured on July 24, and thus all aerial imagery was taken during the dry season. Fieldwork at Kisese II in 2019 was conducted in August. Our GIS measurements of topsoil change are based on the amount of ferric lixisol (paleosol) vs. the yellow regosol exposed in 2019 in comparison to the 1960s aerial image. The total area analyzed is 20,710.1 km2. In order to cover the landscapes of Kisese II and the surrounding area, we also analyzed a close up of the transect of Kisese II (area of 1,643.63 km2).
Both the 2019 and 1960 aerial photographs were first converted to a common TIFF format in Adobe Photoshop. The TIFF images were combined to create a single data layer for each year, and each year’s image was georegistered in ArcGIS software 10.8.1 to the datum Arc 1950 UTM Zone 36 South in a Transverse Mercator projection using the Clarke 1880 spheroid. This is the datum, projection, and spheroid used in the 1:50,000 scale topographic maps series Y742 85/4 and 104/2 prepared by the D.O.S. in 1963, which were based in part on the 1960 photographs as well as field survey. After georegistration, the image files were converted to the ERDAS IMAGINE 4.0 file format, retaining the original image data and georegistration with minimal pixel loss and distortion. ERDAS IMAGINE file formats produce the best and most consistent results when used in IDRISI Selva software. The files were then imported into IDRISI Selva and processed using supervised classification to extract the reddish areas we identify as a ferric lixisol revealed through the erosion of the overlying yellow sandy regosol. The resulting classified areas were then converted from raster format to vector format, and the area of the exposed ferric lixisol was calculated in square meters.
We conducted pedestrian surveys of the area surrounding the site to record soils and sediments currently on the slope, document the erosional and sedimentary forces at play, and establish a base level for a multi-year study on the impact of erosion on the landscape. Survey in 2017 and 2019 was guided by 1:50,000 maps published by the Tanzania Geological Survey (quarter degree sheets 85 and 104) and used a hand-held GPS (Garmin GPSmap 62s, GPS accuracy: < 10 m, altimeter accuracy: < 3 m) to record the latitude and longitude of erosional surfaces, rills, gullies, and changes in vegetation. We documented erosive features with digital photographs to create terrestrially based 3D photogrammetric models of the slope. To contextualize these erosive features historically we used the digitized historical aerial photographs noted above. To summarize and display our results we adopt the soil catena model initially developed by Milne et al. (1936); Bushnell (1942). To create an archaeologically relevant environmental study of the area we used a general soil catena of the Irangi escarpment (Payton et al., 2019) as a roadmap to create a one localized to Kisese II, and integrated it with vegetation, fauna, and archaeological data thus constructing a geoarchaeological catena.
Excavation
At the site of Kisese II we studied erosion patterns from rainwater runoff on the sediments and contextualized them with the landscape data generated by our survey. Using archival data and digital techniques, we directly measured sediment loss at the site since major excavations occurred in 1956. These data guide field excavation to investigate the remaining stratigraphy. Micromorphological analyses were used to interpret the archaeological palimpsest(s) and reconstruct human activities and depositional and erosional history of the shelter from >50 ka to ∼5 ka.
Our 2017 and 2019 excavations of 2 × 3 m and 2 × 2 m reached a maximum depth of 2.40 and 1.40 m respectively relative to the modern surface. The main goal was to identify the limits of the older excavations; for this reason we adopted the 1956 grid north and placed units adjacent to the Inskeep and Leakey trenches, with their boundary positions estimated using archival photographs. To investigate the presence and extent of previously unexcavated stratigraphy we placed a test pit, measuring 1 × 1 m for 50 cm depth, under the largest rock slab. Based on comparison with existing radiocarbon dates on materials from the 1956 excavations (Tryon et al., 2018), the recent excavations span >50–5 ka including the Last Glacial Maximum. A total station relative to a local datum was used to record all positional data including of each micromorphological sample using a handheld data collector running EDM Mobile (McPherron et al., 2005). For each initialization, the X, Y, Z coordinates of 3 points were measured on permanent datums to calculate the station’s position relative to the archaeological grid. This position was then verified by taking a point on a fourth permanent datum. A maximum of 0.5 cm of combined error in the X, Y, and Z positions of this verification point was accepted for initialization.
Micromorphological Sampling
Eleven intact oriented sediment samples for micromorphological analyses were collected from excavation profiles in 2017 (for sampling techniques see Courty et al, 1989; Goldberg and Macphail, 2008). The position of the blocks on the profile was recorded with a Leica total station and mapped into the archaeological site grid within 0.5 cm error. The sediments were studied using a petrographic microscope to 1) determine the nature and organization of the components (e.g., composition, size, texture), 2) distinguish natural and cultural formation processes and 3) build a framework for interpreting the history of human occupation of the rockshelter. The blocks were processed in the Multi-User Laboratory at Harvard University Department of Anthropology. The samples were oven-dried for 7 days at 60°C, and then impregnated with mixture of 7 parts unpromoted polyester resin and 3 parts styrene catalyzed with methyl-ethyl-ketone-peroxide (MEKP; 8 ml per liter of mixture). Once dried the blocks were sliced into 50 × 75 × 10 mm chips that were sent to Spectrum Petrographics (Vancouver, WA) for mounting. The thin sections were examined using a microfilm reader, and binocular and petrographic microscopes in plane-polarized light (PPL), cross-polarized light (XPL), and oblique incidence light (OIL) at various scales from × 5 to × 200 (Courty et al, 1989). Descriptive nomenclature follows that of Stoops (2003); Courty et al. (1989).
3D Modelling
3D models of the site were created both during and after excavation using photogrammetry (structure from motion). Advances in both the affordability and quality of photogrammetry software in recent years has resulted in a proliferation of the technique in archaeology, including its use to quantify sediment volumes (Koenig et al, 2017; Emmitt et al., 2021; Nobles and Roosevelt 2021). Photographs were taken using a Sony RX100 Mark V compact digital camera. RAW images were collected for archival purposes, which were converted into JPG images for further processing. Calibrated scale bars designed for photogrammetry purchased from Cultural Heritage Imaging were included in the areas being photographed. The position of coded targets printed on these scale bars were recorded using a Leica reflectorless total station. Photographs were processed into textured 3D models as well as 2.5D digital elevation models (DEMs) using Agisoft Metashape. These models were scaled and referenced to the site grid in 3D in Agisoft Metashape. The resulting outputs allow for accurate and precise measurement of features in three dimensions outside of a field context.
We quantified erosion at the rockshelter since 1956 by measuring the distance between the former topsoil line visible on the shelter wall and the modern topsoil height, using a scaled and georeferenced orthographic photo of the rockshelter wall with Agisoft Metashape. The photographs for this model were largely taken post-excavation when a total station was not available. In order to georeference this model, the post-excavation chunk was aligned to an already georeferenced model in Metashape using point-based alignment. The total error on the four scale bar control points for the georeferenced model was 0.0755 cm. Finally, using QGIS we then traced both the modern sediment line and weathering line and measured the distance between these two lines at 50 cm intervals.
Results
Geo-Archaeological Catena of Kisese II
Our geoarchaeological catena shows a schematic diagram of local natural and anthropogenic features (Figure 2). Moving from the summit towards the valley the catenary sequence is shown in Figure 2 and explained in detail in Table 1. (Figures 2, 3); (Figures 2, 3); (Figures 3, 4A–D); (Figures 4E–G); (Figure 4); (Figures 4H,J); (Figures 2, 4A,J); (Figure 4I); (Figures 4A,H,J); (Figures 2, 4A)
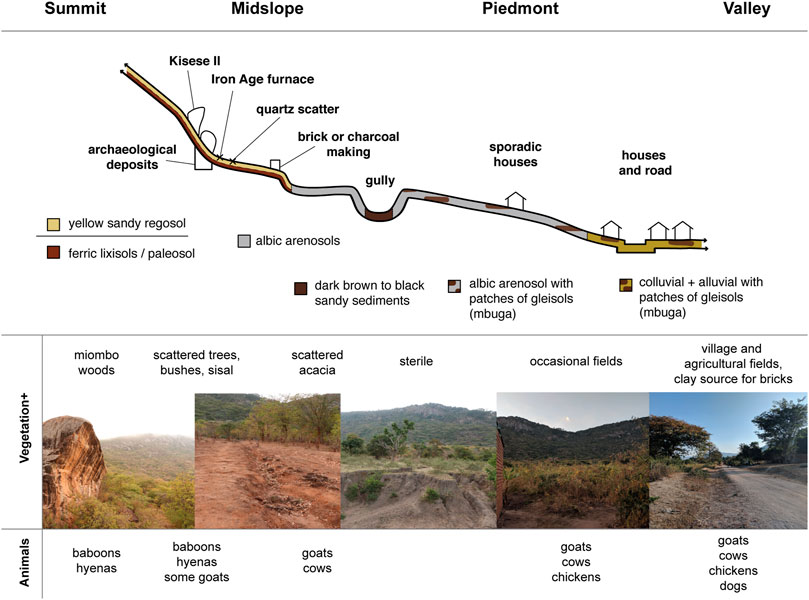
FIGURE 2. Schematic diagram representing the transect of the slope where Kisese II is located. The elevation of the site is 1,287 ± 3 m above sea level. The diagram shows a geoarchaeological catena constructed from the results of our foot survey. To create a resource relevant to archaeological work we combined a classic soil catena with environmental features such as vegetation and fauna, and anthropogenic features such as sites and modern human presence. Follows a description of the soils we recorded on the slope (Table 1).

TABLE 1. Commentary to the geoarchaeological catena (Figure 2) listing the recorded categories for each section of the surveyed area that was divided into 4 sections depending on its position on the landscape. We identified soils using geological maps and past geological surveys of the region. Characteristics for each soil we identified are as follows: Regosols: weakly developed soil found on unconsolidated materials. Luvisols: a well developed soil with an eluviated argic subsoil. These soils are prone to erosion when found on slopes and require terracing or other kinds of human intervention to retain stability. Albic arenosols: bleached sandy soil having sand or another coarse texture in the upper 50 cm soil layer. Gleysol (mbuga): wetland or hydric soil characterized by waterlogging by ground water unless drained.
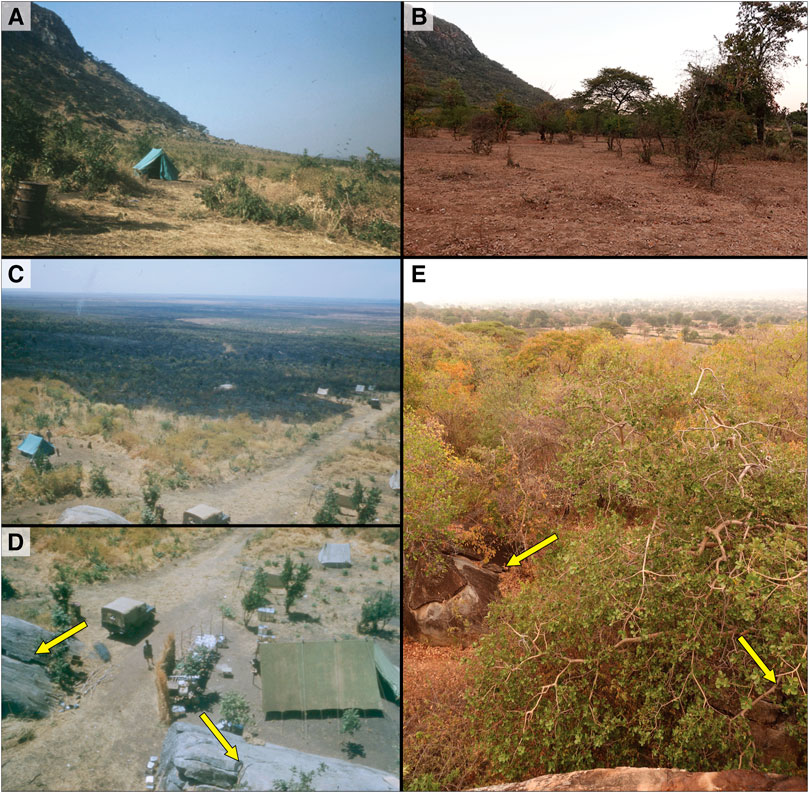
FIGURE 3. Comparison of images taken during the 1956 Inkeep excavations (A,C,D) and 2019 Ranhorn excavations (B,E) showing changes at a landscape scale. (A,B) Photographs taken from the lowlands facing north. Note the shift from a grassland dominated vegetation to wooded, as well as the disappearance of the yellow regosol in favor of the red paleosol. (C–E) Photographs taken from the front boulder of the Kisese II facing south towards the Maasai Steppe. Arrows indicate distinctive rock features visible in the historic and modern photos. Here again the vegetation shift from savanna grassland to woods is evident as is the change in topsoil. Note the large burned patch of grass in (C) portraying slash and burn farming technique in use in the 1950s.
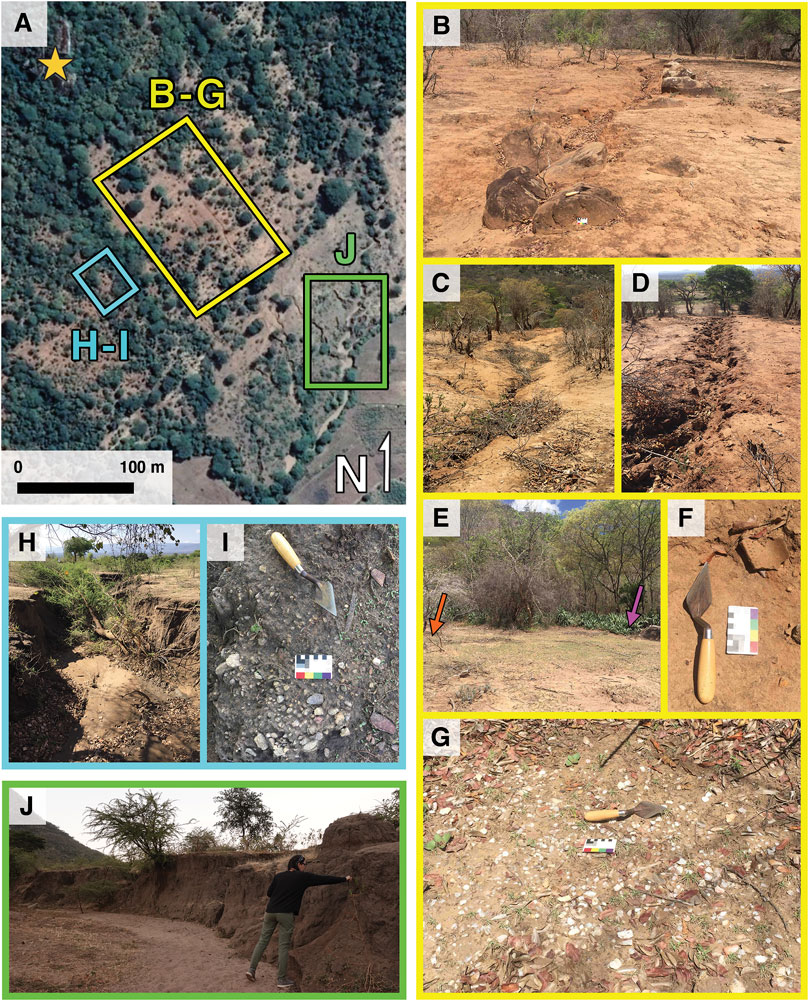
FIGURE 4. Images of erosional features around the Kisese II site. (A) Satellite images of the site (ESRI World Imagery: Maxar Imagery, 2018). The location of the site is marked with a star. The three areas bounded by rectangles indicate the location of the photographs in (B–G). (B) rill forming right below the site with small boulders, embedded in the red paleosol, being exposed by the erosion of the yellow regosol. (C,D) progression of erosion and rill carving between our 2017 and 2018 survey seasons. Note the complete removal of the yellow regosol and the enlargement of the rill. (E–G) scatters of stone tools and pottery being exposed and transported downhill. Arrows in (E) show the position of the scatter shown in (G) and a row of sisal plants to the right. As mentioned in the text sisal plants were planted as a strategy to combat slope erosion. However, they create a very limited and localized barrier to erosion as we witnessed in this case where the scatter of stone tools positioned only a few meters from it is still being impacted by colluvial activity. (H–J) show the more drastic effects of erosion. (H) shows the large gully, indicated in Figure 2, that starts immediately south of the site and runs downhill until the valley. Along the gully we have found scatters of stone tools, such as the one shown in (I). (J) Area where three different gullies coalesce into a badland.
To quantify erosion on the landscape in the past 60 years we analyzed historical and modern aerial photographs of the landscape around the site using GIS (Figures 5, 6). Briefly, 1) there was a drastic change in topsoil exposure; 2) new gullies and rills formed; 3) forest cover expanded; and 4) anthropogenic agricultural features increased in number and size in the piedmont and valley. Inspection of data from the 1960 photographs reveals only trace amounts of the paleosol exposed, below the resolution of our analyses. In 2019 the area of Kisese II and its surrounding landscape was composed in total by 623.808 m2 of lixisol, indicating a loss of topsoil of 3% in the total area analyzed over 59 years (Figure 6C). At a closer look the transect of the immediate landscape of Kisese II has been impacted the least, with a loss of 0.12% of topsoil loss in the total area, 2.129 m2 of lixisol, on a total area analyzed of 1,643.630 m2 (Figure 5D). The comparison of the landscape photographs also shows a drastic change in tree coverage with grassland and farmed fields being replaced by woodland on the Irangi escarpment. In the valley the fields have increased and small isolated dwellings seem to have disappeared altogether in favor of houses along the main road.
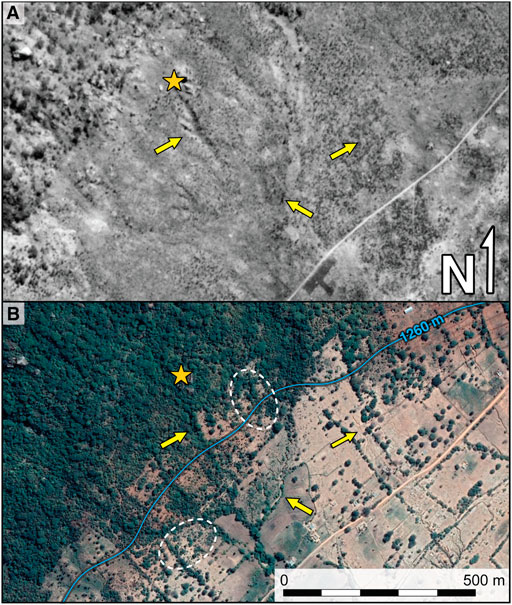
FIGURE 5. Comparison of historic and modern aerial imagery around Kisese II. Location of the site is indicated by a star. Arrows indicate the position of modern erosional features. Although the larger gullies present today were already visible in 1960, most of the indicated erosional features were not yet present, highlighting how although erosion is a longstanding process in Kondoa it has increased significantly since 1960. Dotted white lines indicate areas demonstrating the extent of erosion of the yellow topsoil around the site, resulting in the red paleosol dominating the higher portions of the slope above the 1,260 m above sea level topographic line. Note the extent of the miombo forest slowly populating further downhill compared to the almost barren slopes in 1960. (A) Historic aerial photograph taken in 1960 (Directorate of Overseas Surveys archives, National Collection of Aerial Photography, Scotland, NCAP/ncap.org.uk). (B) Modern satellite image from ESRI World Imagery (Maxar Imagery, 2018).
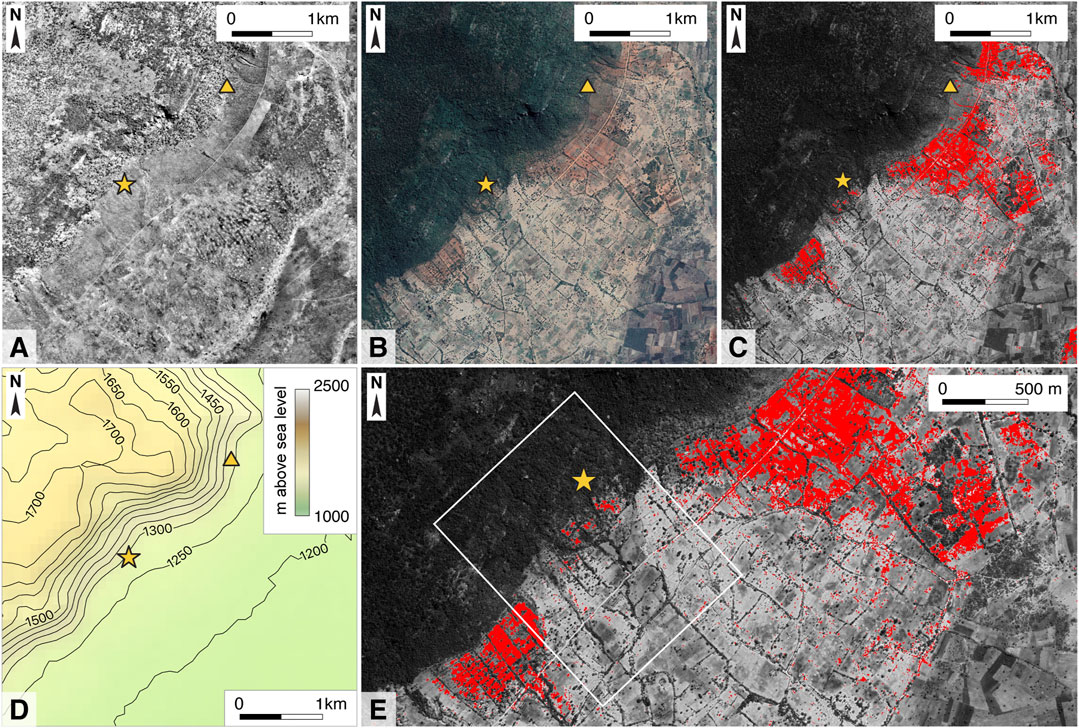
FIGURE 6. Comparison of historic and modern aerial imagery around the wider region surrounding Kisese II. The triangle denotes the location of Kisese I, and the star denotes the location of Kisese II. Location of the site is indicated by a star. (A) Historic aerial photograph taken in 1960 (Directorate of Overseas Surveys archives, National Collection of Aerial Photography, Scotland, NCAP/ncap.org.uk). Note the extent of deforestation well beyond the summit of the Irangi Hills. (B) Modern satellite image from Google Earth. (C) Greyscale version of modern Google Earth imagery, with areas corresponding to exposed ferric lixisol through analysis in IDRISI Selva overlaid in red. (D) Topographic map of the study area. (E) Enlargement of Figure 6C. The white box corresponds to the area defined as the immediate landscape around Kisese II for the GIS analysis. It is clear that the landscape of Kisese II has been impacted the least.
Observations on Erosion at the Site
Today, primary sedimentary processes at Kisese II appear to be a combination of colluvial input and erosion driven by slopewash processes, accelerated by dripline-mediated rainfall (Figure 7). Although screened by vegetation today, aeolian processes may well have been more active in the past. Sediment loss is particularly evident along the back wall of the shelter where differential weathering of the rock demarcates the height of the topsoil during the latest period of soil stability observed in 1956 photographs of the Inskeep excavation (Figure 8). We observed a maximum loss of 68 cm of sediment, equal to spits I and II from the 1956 excavations that contained Iron Age archaeological remains (Figure 9). We also observed formation of erosive features from splash erosion that caused sediment deflation to sheetwash and remove artifacts and sediments from the site (Figure 7).
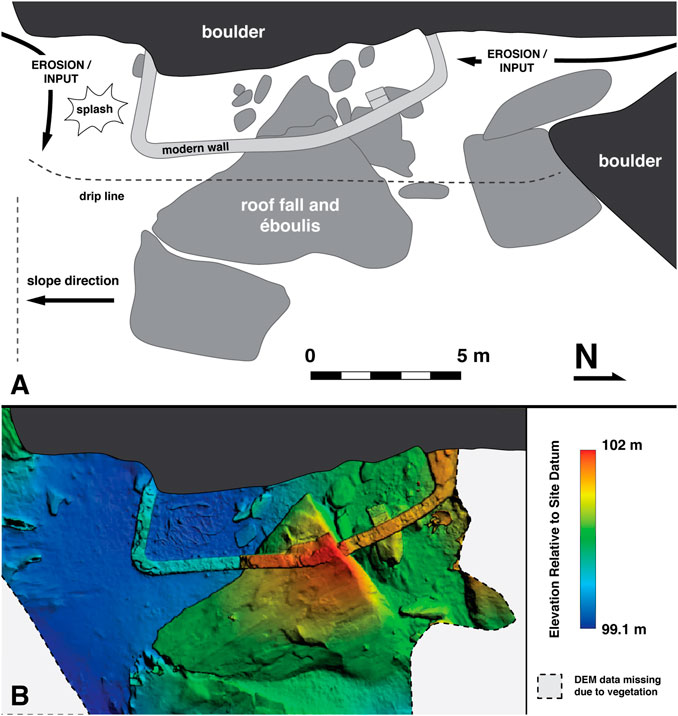
FIGURE 7. Diagrams of the rockshelter in plan view from above. North arrow indicates grid north. (A) the different processes we identified: combination of erosion and sedimentation is visible especially at the S and N edges of the boulder; Splash erosion is present along the dripline and in circumscribed areas. As shown in the diagram, the majority of the sediments are protected by the rock slabs. (B) Digital elevation model generated from a photogrammetric model produced in Agisoft Metashape. Elevation units are relative to site datum. Note the difference in elevation between the northern and the southern portion.
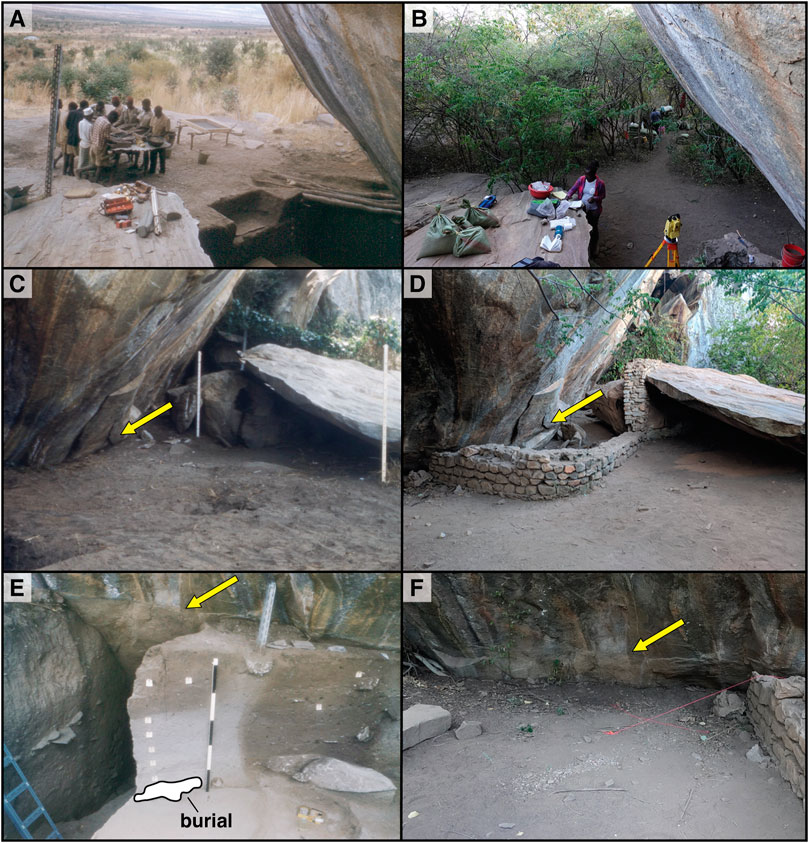
FIGURE 8. Comparison of images taken during the 1956 Inkeep excavations (left column) and 2019 Ranhorn excavations (right column) showing changes at the site scale. (A,B) View of the site facing southwest towards both the historic and modern screening area and the large gully to the S of the site noted in Figure 2. Note the dramatic change in tree cover. (C,D) View of the site facing north. Yellow arrows indicate the position of the weathering line on the rock face, demonstrating the extent of sediment loss at the back wall of the shelter. (E,F) View of the shelter wall facing west. Yellow arrows indicate the position of the same weathering feature on the rock face, demonstrating the lateral extent of sediment erosion.
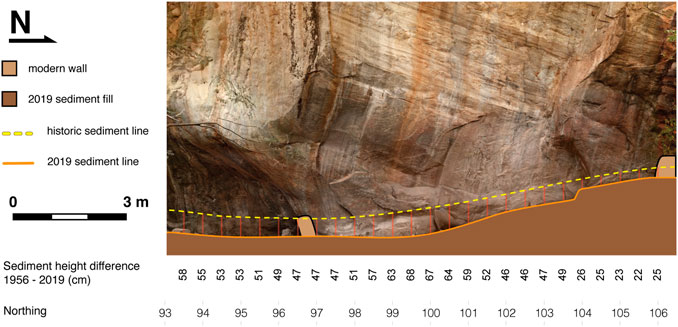
FIGURE 9. Orthomosaic of the back wall of the shelter with outlines of modern and 1956 sediment lines, the volume outline of rock slabs, and the modern containment wall. The difference in the Z direction between the historic and modern sediment line is shown at positions spaced 50 cm apart along the site grid. Note the difference in elevation between the lower south portion and higher northern edge probably due to the higher impact of colluvial input versus erosion because of the slabs and the northern boulder that protect this area.
During the beginning of the 2017 rainy season, we had an opportunity to study how heavy rainfall hit the rockshelter wall and fell on the sediments (Figure 7). Most of the archaeological site was protected, except for the south corner where water and sediments coming from above and behind the boulder flow into the site. Because of the inward bend, most of the back wall of the rockshelter remained dry during storms with some concentrated flow that did not seem to impact the archaeological sediments. However, the curve of the back wall created a pronounced drip line that causes splash erosion on a circumscribed south-eastern portion of the sediments and in some small, circumscribed areas in the southern corner (Figure 7). One large piece of rockfall protects the rest of the sediments towards the center and north (Figure 7).
The sediments in the south outside the drip line that are not capped by the slab or the overhang are impacted by sheet erosion causing a southward dipping slope of ∼20° for 15–20 m, observed also in the excavation profiles from the 1956 excavations (cf. Tryon et al., 2018). Approximately 10 m south is a steep gully of ∼10 m depth that continues eastwards until the piedmont. The gully appears only as a depression in the 1956 photographs and the 1960 aerial photograph confirm the presence of an incipient erosive feature, indicating that the majority of it has been carved in the past 60 years (Figures 5, 8A) in line with oral accounts from community members. Sediment and artifacts eroded from the site are in part channeled into the gully and washed down hill (Figures 4H,I).
Micromorphological Results
Our micromorphological study is currently restricted to samples collected in 2017 from a 2 × 3 m trench excavated to a depth of 2.40 m adjacent to the larger 1956 excavations (Figure 10). In a volume of 4 m3 we recovered over 5,000 artifacts signaling a bias in recovery methods by Inskeep who reported a similar number of artifacts from 80 m3. Our micromorphological study results suggest the presence of three distinct sedimentary groups each containing between 2 and 5 geological stratigraphic units for a total of 9 geoarchaeological stratigraphic aggregates, shown in Figure 10. Described from bottom to top these strata are:
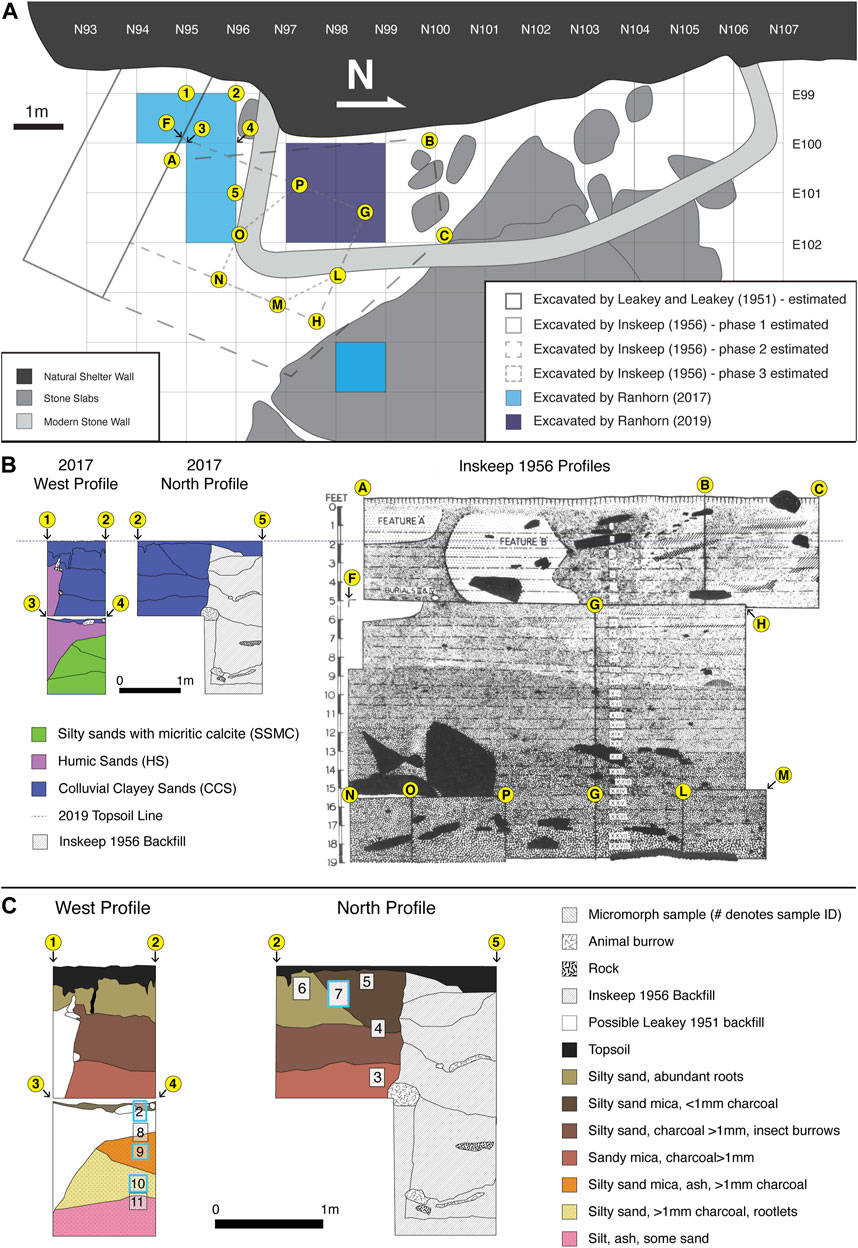
FIGURE 10. Location and sedimentary context of the historic and modern excavations at Kisese II. The location of historic trenches was estimated using historic drawings, photographs, and the location of features as observed in modern excavations. Letters in circles (representing positions identified by Inskeep in original drawings) and numbers in circles (representing positions from the modern excavations) indicate the same locations as shown in plan and section view. (A): plan view of the site. North here indicates grid north. (B): Comparison of the profiles observed in the 2017 excavation correlated with Inkeep’s profile. The 2017 profile shows the three sediment packs described in the text. (C): Detailed profiles from the 2017 excavations showing sediment characteristics, features, and the position of micromorphology samples described in the text. Samples shown in Figure 11 are outlined in blue.
Silty Sands With Micritic Calcite
In situ Late Pleistocene sediments. Stratigraphic aggregate SSMC is 0.94 m thick. Comparison with and partial georectification of l photograph from 1956 indicate the SSMC broadly corresponds to the middle of spit X to the bottom of spit XIV from the Inskeep excavation and thus is likely Late Pleistocene in age. The thin sections from SSMC indicate a rapidly deposited silty-sand layer with micritic calcite, rounded bone fragments, and some colluvial input (Samples 11, 10, 9, and part of 8). The lower layer (sample 11) shows no bedding and has low porosity (Figures 11A,B) indicating that it was deposited quickly, with micrite cementing the sediments (Figure 11B yellow arrow) and coating the heated bone inclusions (Figure 11B pink arrow). The layers above (samples 10 and 9) have a similar silty-sandy matrix with micrite (Figure 11C). However, calcite decreases moving up the section, accompanied by an increase in bone frequency (Figures 11C,D, pink arrows).
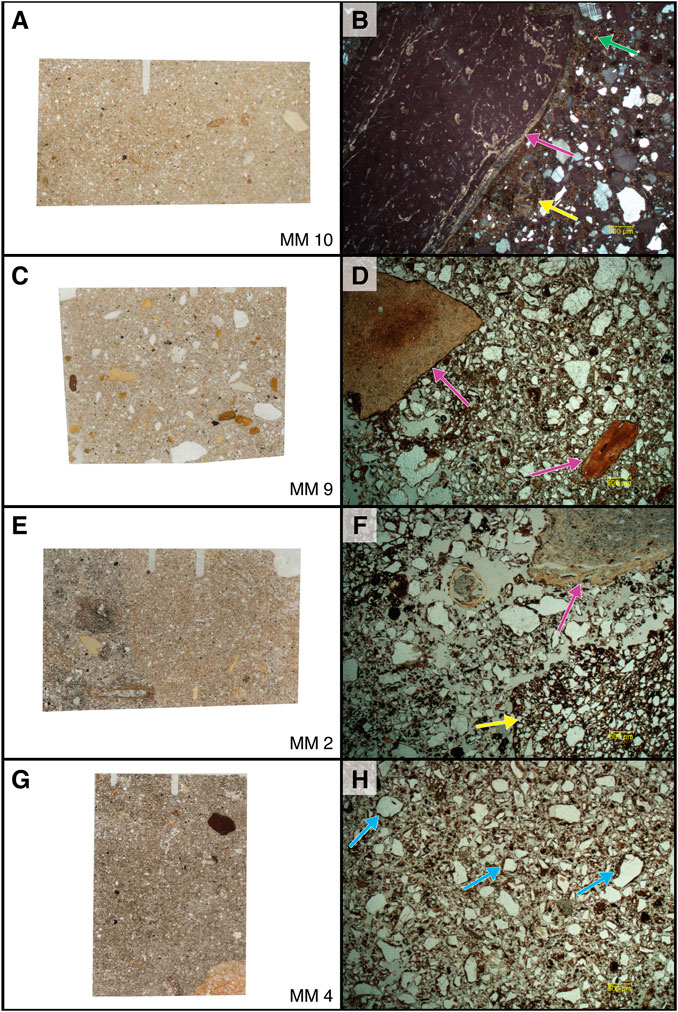
FIGURE 11. Scans and photomicrographs of thin sections discussed in the text. Photomicrographs show the most significant features described in the text. (A) scan of thin sections of sample 10. Note the massive microstructure and the low quantity of bones included in the matrix. (B) photomicrograph of sample 10 (2x XPL) showing cemented matrix with micrite filling the space between grains (yellow arrows) and coatings on larger inclusions such as heated bones (pink arrow). Green arrow points to a grain of volcanic mineral (possibly olivine). These grains are very sporadic in the lower sediments but increase in quantity in the upper sediments. (C) scan of thin sections of sample 9. Note the increase in quantity of heated bones and the more open microstructure. (D) photomicrograph sample 9 (2x PPL) matrix containing less calcite and instead showing more redoximorphic features and a higher quantity of heated bones. However, the bones look subangular to subrounded, suggesting that they are not in primary deposition. (E) scan of thin sections of sample 2 containing the clayey in situ layer and the intrusive humic sandy layer. Note the sharp boundary between the two layers and the difference in microstructure and color between the two layers. (F) photomicrograph sample 2 (2x PPL) showing evidence of mixed matrix with aggregates of material from other layers (yellow arrow) and non-heated, diagenetically altered bones (pink arrow). (G) scan of thin section of sample 7. (H) photomicrograph of sample 7 (2x PPL) in the upper layer the matrix does not contain any evidence of calcite nor heated bones, moreover porosity is more spongy and open and the grains all show clay coatings (blue arrows) suggesting a fast colluvial accumulation.
Humic Sands
Backfill from 1956. Sediment assigned to HS is 1.62 m thick and is only concentrated on the south portion of the excavation. Loose bioturbated humic sandy sediments (parts of samples 8 and 2 collected at the boundaries between groups) comprise much of the area excavated in 2017 (Figure 10). This stratigraphic aggregate is characterized by layers with sharp and straight boundaries as shown in the scan of the thin section (Figure 11E), suggesting an artificial cut. The sediments contain clasts of calcitic or clayey aggregates as well as pedorelicts (Figure 11F) that we interpret as reworked chunks of the lower and upper layers suggesting that these sediments are made of backfill of the earlier Inskeep excavation from 1956. Sample 2 in Figure 11E also shows the difference in porosity between the two layers, with the humic sediments being spongier and the red sediments more compact and uniform. Both these factors confirm the intrusive nature of the humic sediments. Fresh or diagenetically altered bone fragments are also present (Figure 11F, pink arrows) however, burned bones were not identified in the thin sections.
Colluvial Clayey Sands
Insect turbated partially-in situ Holocene sediments. Sediments assigned to CCS are 1.08 m thick. They broadly correspond in depth to part of spit II to spit V from the Inskeep excavation and thus are likely early Holocene in age. Periodically saturated colluvial clayey sand with a high degree of bioturbation (Samples 2–7). Sample 2 was collected from a red-brown clayey sand that in the field was identified as in situ Holocene deposits. This layer appeared truncated by the 1950s excavations making its stratigraphic relation with the lower in situ sediments unclear. Microscopic examination shows no calcite, but instead dusty red clay coatings around the quartz sand grains suggesting colluvial input. The layer lacks evidence for ash or other forms of CaCO3 strengthening the probability that the calcite seen in the lower sediments was indeed original to the sediments at time of deposition and did not percolate from the upper sediments.
The rest of the upper sediments, observed in samples 3 to 7, have similar composition and inclusions as sample 2 with the addition of very few grains (∼10 per slide) of olivine, a volcanic mineral. We interpreted this group as colluvial sediments as indicated by the subrounded quartz grains and the thick coating that covers each grain (Figures 11G,H blue arrows). Frequent redoximorphic features suggest a wetter depositional environment while a crumbly texture and open porosity pattern points to a slower rate of sedimentation relative to the lower sediments (Figure 11G). These layers contain abundant humic material and bioturbation passages of different ages. We hypothesize that these layers were already partially bioturbated at the time of the 1956 excavation. Because of the 1956 excavation, the loss of topsoil, and therefore the drastic change in flora and environmental conditions at the site, additional bioturbation has disturbed these sediments even further. Layers assigned to CCS lack any evidence for ash, charcoal, burned material, micrite, or animal dung. This suggests that the CaCO3 observed in the lower layers was not leached out from these upper sediments and is instead restricted to the sedimentary environment of the lower sediments.
Discussion
History of Landscape Processes and Environmental Change in Kondoa Region
Reconstructions by Eriksson and others (2000) that combine geology and OSL dating of colluvial and alluvial sediments trace the chronology of early Holocene erosion and show that the Kondoa district has been characterized by a K-cycle (sensu Butler 1967) with periods of erosion and depositions punctuated by hillslope stability that allow for pedogenesis (Eriksson et al, 2000). Their published OSL dates point to an erosive episode between 14.5 and 11.4 ka when coarse colluvial material was deposited in already present depressions on the hillslopes. The terminal Pleistocene was followed by a period of stability allowing for the formation of albic-arenosols (caused by illuviation of Fe and formation of ferric nodules and ironstone). Stability seemed to last until ∼900 years ago when a new more intense erosive cycle started, characterized by sheet and rill formation and the deposition of alluvial fans (Eriksson et al, 2000); more studies are needed to understand if this cycle is connected to the Medieval Warm Period (or Medieval Climate Anomaly) that in eastern Africa created drastic fluctuations between cold and warm spikes (see Lüning et al, 2017 and citations within). Approximately 600 years ago, the mid-slope ferric lixisols were exposed and eroded causing the accumulation of red colluvium and the formation of gullies (Payton et al., 1992; Eriksson et al, 2000). This Holocene erosive cycle seems to have continued until present with the growth of older gullies up to 20–25 m, erosion of older colluvium and albic arenisols, the formation of new rills and gullies in the partially bare high and mid-slope, and the formation of badlands where multiple gullies have coalesced, all features that we recognize today on the landscape surrounding Kisese II. Sediment deposition in the Lake Haubi region between 1835 and 1988, a rough proxy for erosion rates in the Irangi hills, ranges from 0.9 to 6.2 cm/year (Eriksson and Sandgren, 1999), highlighting the scale of sediment loss and redeposition in the region.
These long-term processes provide the context for more recent impacts caused by government programs to modify, control, and contain erosion. Vulnerability of rural populations and environments in Kondoa due to severe soil erosion has been at the center of governmental studies and actions since colonial times with several attempts to mitigate its effects (Kannenberg, 1900; Fosbrooke, 1951; Eriksson et al., 2000 and citations within). From 1927 to 1949 the British colonial government initiated a major program of deforestation on the lower slopes and plains. A subsequent program was launched to control the spread of tsetse flies and human trypanosomiasis or “sleeping sickness” that significantly altered local faunal communities (Swynnerton, 1936; Mugasha and Nshubemuki, 1988; Headrick, 2014).
Deforestation almost certainly exacerbated existing erosional processes, and in the last century several attempts were made to limit soil erosion and thus the loss of productive land in Kondoa (Phillips, 1930; Backéus et al., 1994; Blay et al., 2004; Lane, 2009). Although some efforts were more successful than others in slowing down erosion, in hindsight there were two main challenges with the approaches taken to limit erosion: 1) disentangling the causes of the erosion including human practices and global and local climatic shifts; 2) imposing solutions across large areas not considering local knowledge and the health and wellbeing of the population (Lane, 2009). As a result, changes were not permanent. The 1990s saw the beginning of the erosional cycle that is still in action today. Our investigations show that this new erosional cycle is caused by a combination of a lack of enforcement of regulations, an overall inefficacy of erosion mitigation strategy, and the exacerbation of localized and global climate changes. Records show that rain patterns started to drastically change in the 1990s to become increasingly more unpredictable with out-of-season high-intensity storms and droughts. Kangalawe et al. (2008) note that severe droughts struck the area of Kondoa for three consecutive years between 1994 and 1997. These were immediately followed by unusually heavy rains in 1997 and 1998. Since then, numerous erosional models have been published that assess plans to move forward (e.g., Payton et al., 1992; Eriksson et al, 2000; Mwalyosi, 2000; Madulu, 2001; Ndomba et al, 2009; Ligonja and Shrestha, 2015).
Slope Processes Between 1956 and 2019
Our landscape reconstruction adds nuance to this wider regional image of erosion and environmental change by identifying and quantifying slope processes from 1956 to 2019. GIS comparison of aerial images shows four main features that characterize landscape change at Kisese II in the past 60 years: 1) the drastic change in topsoil cover; 2) the formation of new gullies and rills; 3) forest expansion; 4) the increase of anthropogenic agricultural features in the piedmont and valley (Figures 4–6). Our foot survey and analyses of photographs from the 1956 excavation has demonstrated that: 1) these processes are still in place and becoming more rapid; 2) they impact the archaeological record on the landscape in different ways depending on local geomorphology.
From both archival data and our own observations we know that the soil sequence on the slope consists of yellow regosols on top of a red lixisol paleosol (Figures 2–6). The GIS analysis on historical and contemporary aerial views shows that, on the slope we surveyed, circumscribed to the immediate landscape of Kisese II, 2,129 m2 of regosol coverage has been lost in the past 60 years. Our 2019 survey shows also that an erosional regime is indeed prevalent on the slope with ongoing loss of archaeological and ethnographic record (Figures 3–6). Scatters of stone tools recorded right below the site embedded in yellow regosol in 2017 were significantly reduced by 2019 (Figure 4G). Clumps of redeposited tools, probably coming from several km uphill, were found at the piedmont in the larger gully we surveyed (Figure 4I). Between 2017 and 2019 we also recorded an increase in numbers of eroded pottery sherds on the midslope (Figure 4F). Our wider GIS analysis that covered an area that includes Kisese II and Kisese I, the closest known rockshelter containing rockart, shows an even more grave situation, with 623.808 m2 of the landscape covered by red lixysol in 2019. The extent of erosion on the Kisese I transect is such that we assume a much greater loss of archaeological record than at Kisese II. Our results show that soil erosion at Kisese II has reached a critical point, having significant impact not only on a half-century time scale but even on a yearly basis.
Erosion is also regulated by vegetation. Our study shows that tree coverage has changed the Irangi landscape several times since the beginning of the last century. As seen from our archival and bibliographic research, forced governmental deforestation started in the 1920s and its impacts were still visible in 1956. At this time the woods were sparse (Figures 3, 5) and the tree line was much higher upslope, tens of meters above the site (Figure 6). While today the site is encroached by trees, in 1956 the area around the rockshelter was characterized by farmland and grassland as seen in photographs from the 1956 excavation and 1960 aerial pictures (Figure 3). In the 1950s slash and burn techniques were in use (Figure 3C) contributing to the further weakening of the ecosystem. An interesting result concerning links between vegetation and erosion concerns the sisals, xerophitic plants originally introduced by the colonial governments to serve as a biological barrier against erosion (Lane 2009) and later adopted by local farmers to signal property limits that are now abandoned due to unproductivity of the soil. We recorded lines of sisal as far uphill as a few tens of meters below the last boulder of Kisese II (Figure 4E pink arrow). Our observations show that in discordance with their original purpose the plants are not preventing soil erosion, instead they create localized raised sediments in a carved out landscape. The soil accretion circumscribed only around their roots has produced a localized biological barrier to colluvial sediments on their path, as such their presence can be used as an indicator of the extent of the impact of erosion on the hillslope.
One of the most visible erosional features throughout the Kondoa landscape are the deep gullies carved on the slope. Although at Kisese II some of the gullies were already present as shallow erosional features in 1956, our study shows that most gullies we see today formed between 1960 and 2019 while the ones present in 1956 and 1960 have enlarged and deepened considerably at times coalescing into badlands in the piedmont (Figures 4A,H,J, 5). The erosive and rain trends are such that gullies will continue to deepen and badland areas will increase in number. Seen through the results of this study we must assume that the progressive growth of these features will impact the remaining archaeology on the landscape as well as modern anthropogenic features: homes, agricultural fields, roads etc. Comparison between the 1960 and 2019 photographs shows how the local inhabitants, at least partially guided by the erosive processes and governmental impositions mentioned here, have changed their land use patterns. We detected clear traces of farming intensification shown by the increase in plowed land in the valley, and significant anthropogenic alteration to the slope.
In the area around Kisese II our results point to a quick and drastic acceleration of the latest erosive cycle identified by Eriksson and others (2000) happening between 1960 and 2019, hundreds of years after the beginning of the cycle. Moreover, when we compare our results for the transect immediately below Kisese II, and the wider area covered in Figure 6 it is clear that although erosion is the prevalent force in Kondoa as a whole, separate sections of the slope are impacted differently depending on their geomorphology and other environmental factors. Our study shows that the immediate landscape of Kisese II has been impacted the least. Although this might not be surprising news, it is a fact that is often ignored by archaeologists that work on this landscape.
Kisese II Erosional Regimes
Our work at the site scale has been two-fold: 1) the qualification of modern sedimentary regimes and quantification of sediment loss since 1956 and 2) understanding the archaeological stratigraphy. We were able to show that although there is sediment loss consistent with the landscape results, a more complex sedimentary regime is in place at Kisese II that also includes colluvial input. Using photographs from the 1956 excavation we confirmed that the weathering line on the wall is indeed related to past topsoil height (Figures 8C–F). We found a maximum loss of 68 cm, or an average of ∼1 cm per year from 1956 to 2019. Our results show also a difference between the S and the N portion of the cave, with the top soil height in the N 45 cm higher than on the S (Figure 9). However, not all the areas of the rockshelter are impacted in the same way horizontally (Figure 7).
Changes in local vegetation around the site mirrors what we found for the slope. The shift from grassland to wooded, can be directly observed through comparison of photographs from 1956 to 2019 (Figures 3, 8); those from the past must be inferred indirectly. Trees encroaching the site are causing some superficial bioturbation to the remaining archaeological sediments. However, the trees are also functioning as a biological barrier against erosion, minimizing the impact of heavy rains on the area immediately outside the shelter.
The 2017 and 2019 excavation seasons were primarily aimed at locating the edge of previous excavations, and the micromorphological samples described above provide an understanding of the depositional and post-depositional sedimentary history of the last ∼14 ka at the rockshelter, including those impacts caused by previous archaeological excavations. In summary our micromorphological data show: 1) colluvial input is a major contributor to the topsoil especially in the northeastern corner of the site; 2) field observations about the boundaries of past excavations are accurate; 3) the existence of stark differences in sediment composition and arrangement between the Pleistocene and the Holocene sequences. At least two other sources of post-depositional sedimentary disturbances were noted by earlier archaeologists: Ash-lenses interpreted as hearth features and flexed human burials. Future research will investigate these and the origin of the CaCO3 detected in the micromorphological analyses: since the bedrock is granitic the calcite cannot be authigenic and must have been either transported to the site or formed in place from material other than the bedrock. The micritic nature of the CaCO3 suggests that it was percolated and recrystallized from a solution and the upward increase in frequency of heated bones suggests that the actual loci of the fire could be the upper layers of this group, but more samples are needed to confirm this.
Implications for People in Kondoa and Heritage
The loss of land and heritage we described here impacts not only the archaeological and geological records but most importantly the local people in very concrete ways by affecting their current and future livelihoods. Since 1960 farmers near Kisese II adapted to their fast changing environment by building terraces and using traditional farming knowledge. However the intensification of the erosional regime of the slope since the 1990s forced them to abandon the higher slopes altogether for the valley. The increased tempo of the erosion we have noticed between 2017 and 2019 will accelerate the loss of productive land, the widening of badlands, and the destruction of infrastructures having a concrete impact on the future livelihoods in Machinjioni the village in which the site is located. Crops will have to be changed to adapt production to the new impoverished environment, while transportation of goods and people will be severely impacted.
The loss of local archaeology has potentially devastating heritage effects for people living there today. For example, the loss of the record could preclude people in Machinjioni specifically and Kondoa in general from establishing new economic enterprises involving tourism and heritage management. Furthermore, erosion-induced erasure of tangible heritage may inhibit the creation and transmission of social memory. Combined, these processes create additional barriers that prevent indigenous communities from playing important roles in the development and implication of heritage management policy (Bwasiri, 2011).
Conclusion
The region of Kondoa in north-central Tanzania is famous for long-term, detailed studies of soil erosion and its impact on the local farming population (e.g., Ligonja and Shrestha, 2015). In relation to environmental changes archaeologists have long been concerned with the rapid fading of many of the painted images on the rockshelter (e.g., Temu, 2018). Our multi-scalar work combines bibliographic and field research to better understand the nature and history of the Kondoa regional dynamism to reconstruct the landscape and site sedimentary processes.
Using historical photographs and published data we reconstructed the chronology of major vegetation changes, topsoil loss, and the formation of erosional features over the past ∼60 years. Archival documentation shows that since the 1930s the landscape around Kisese II has undergone three main anthropogenic shifts that altered ecosystems and exposed the landscape to more drastic impacts of climate change: 1) the forceful deforestation and removal of indigenous fauna exposed topsoil across the region and well into the mountainous terrain, 2) forceful abandonment of the previously created farm and pastureland caused disappearance of land stewardship, shortage of manure, and soil impoverishment and 3) climate change-induced intensification of rains drastically increased erosion of the already impoverished soil. Archival photographs and landscape survey shows that this regional context can be applied directly to Kisese II and the surrounding landscape.
On the landscape immediately around Kisese II we qualified erosion by interpreting our survey results within the regional data described above. We have identified: 1) the almost complete loss of yellow regosol on the mid slope and at the site; 2) the incipient erosion of the chromic lyxisol, identified as Pleistocene Paleosol and its relation to the possible loss of archaeological sites; 3) the drastic expansion of unproductive land by the rapid formation and enlargement of gullies, uncovering and eroding Pleistocene arenasols, and resulting formation of badlands.
The regional and landscape data we discuss here are invaluable to contextualize the site of Kisese II and guide archaeological work. At the site, we have recorded the topography using photogrammetry and through comparison with historical photographs and archival notes from Inskeep we have documented an erosional rate of ∼1 cm/yr in the past 60 years for a total maximum loss of 68 cm. We have also identified localized erosion features such as splash erosion at the dripline and some sheet erosion outside of the sheltered area to the S and SE. Our analyses show that sediment loss at the shelter is a result of the larger regional and landscape processes described above. The loss of sediment impacts also the rock art, as comparisons with the radiocarbon chronology of the site suggest that much of the upper ∼4 ka history of the shelter has been lost, an age that is the current best estimate for the age of some of the paintings at Kisese II and in the region more broadly (Masao, 1976). Using micromorphology we were able to integrate our landscape and topographic data with micro-geoarchaeological stratigraphy. We reconstructed a complex series of sedimentary forces and their interactions and our results show reason for optimism. In some instances sediment at Kisese II is protected from erosion: 1) the conformation of the boulder group and the large rock falls protect some areas of the shelter from rain activity; 2) colluvial input is also present at the cave and it mitigates sediment loss especially in the northern portion of the rockshelter, and 3) micromorphology has confirmed that the Pleistocene layers are in situ as are the early Holocene strata although these have suffered bioturbation from animals and roots and any interpretation of the material coming from these must take that into account.
The loss of sedimentary and archaeological context at Kisese II and its landscape is already dramatic in itself, but in addition we have shown that context to the extant rock art at a UNESCO world heritage site is being rapidly lost. Through the analysis of the erosion at Kisese II landscape we have shown that in this environment a complete loss of context is possible. For this reason we must act quickly.
The impact of this study in particular and KDHP as a whole goes beyond the creation of scientific data. It is a step towards changing how we practice archaeology towards the creation of more practical outcomes. Natural and human induced climate change combined with at least a century of recorded agricultural and environmental policies have impacted the archaeology and sediments at the site. The integration of geological, historical, and community-based archaeological research as practiced by KDHP can be used to improve the wellbeing of local communities and aid preservation of cultural heritage to provide the local and global community with a “usable past” (sensu: Andah, 1995; Kryder-Reid, 1997; Hassan, 1999; Schmidt, 2006).
Data Availability Statement
The original contributions presented in the study are included in the article/supplementary material, further inquiries can be directed to the corresponding author.
Author Contributions
IP Conceptualization of study and article, Methodology, Investigation (excavation, survey, and sampling), Analyses, Writing-Original draft preparation, Reviewing, and Editing. SP Investigation (excavation and survey), 3D modelling, Mapping, Photography, Preparation editing and finalization of figures and graphs, Reviewing, and Editing. DR Investigation (excavation) SF Investigation (excavation), field logistics. JL Final Editing HM Investigation (excavation), field logistics. JO Investigation (excavation) ES-L Investigation (excavation, survey and sampling), Reviewing, and Editing. CT Conceptualization of article, Reviewing, and Editing. DC Reviewing, and Editing. KR Conceptualization of article, Investigation (PI), Reviewing, and Editing.
Funding
Funding for excavation and analyses of Kisese II was provided by Graduate Women in Science (with support from Adele Lewis, Nell Mondy, and Eloise Gerry), the American School of Prehistoric Research, and the Leakey Foundation.
Conflict of Interest
Author WK was employed by the company Heritage Consultants LLC.
The remaining authors declare that the research was conducted in the absence of any commercial or financial relationships that could be construed as a potential conflict of interest.
Publisher’s Note
All claims expressed in this article are solely those of the authors and do not necessarily represent those of their affiliated organizations, or those of the publisher, the editors and the reviewers. Any product that may be evaluated in this article, or claim that may be made by its manufacturer, is not guaranteed or endorsed by the publisher.
Acknowledgments
We thank the people of Machinjioni village who welcomed us, were open to collaborate with us, and continue to host us. We specifically want to thank Rajai, Nuhu, Paulo, Joseph, Hadija, Sofia, Eligys, Mzungu, Jida, Anna, Hamisi, Nondi, Nduju, Mariam, Amina, and Aereliana who made this work possible. We also thank the Antiquities Division at the Ministry of Natural Resources and Tourism, specifically Misana Bwire and Emmanuel Bwasiri, for their assistance in protecting the heritage around Kondoa. We thank Jennifer Charlson for permission to publish some of the photographs taken by R.R. Inskeep in 1956 that are now housed at the McDonald Institute at Cambridge University. Historical aerial photographs are reproduced with permission from the National Center for Aerial Photography (#IMSL-IR-171675). This work was permitted under COSTECH permit 2019-304-NA-2015-22. This work was possible thanks to the support of the Zinman Institute of Archaeology, the Maritime Civilization department at Haifa University, Advanced Imaging Service for Objects and Spaces at University of Minnesota Twin Cities, the Department of Anthropology at Harvard University, and the School of Human Evolution and Social Change at Arizona State University. We thank Daniel Fallu, Yitzchak Jaffe, Ruth Shahak-Gross, Michael Storozum, and Kristen Wroth for useful comments on earlier drafts of the manuscript.
References
Agisoft (2020). Agisoft Metashape Professional Edition. Version 1.6.5. St. Petersburg, Russia: Agisoft LLC.
Andah, B. W. (1995). Studying African Societies in Cultural Context. Santa Fe, New Mexico: See Schmidt & Patterson, 149–181.
Backéus, I., Rulangaranga, Z. K., and Skoglund, J. (1994). Vegetation Changes on Formerly Overgrazed Hill Slopes in Semi‐Arid Central Tanzania. J. Appl. Veg. Sci. 5 (3), 327–336.
Blay, D., Edouard, B., O Chamshama, S. A., and Chikamai, B. (2004). “Rehabilitation of Degraded Lands in Sub-saharan África: Lessons Learned from Selected Case Studies,” in Forestry Research Network for Sub-saharan Africa (Fornessa) (Kumasi, Ghana: International Union of Forest Research Organizations).
Blender (2020). Blender. Version 2.91.0. Amsterdam, Netherlands: LTS. Available at: https://www.blender.org/download/releases/2-91/.
BlenderGIS (2020). BlenderGIS Addon. Version 2.2.5. Amsterdam, Netherlands: FAQ. Retrieved from https://github.com/domlysz/BlenderGIS.
Borner, M. (1985). The Increasing Isolation of Tarangire National Park. Oryx 19, 91–96. doi:10.1017/s0030605300019797
Bushnell, T. M. (1942). Some Aspects of the Soil Catena Concept. Soil Sci. Soc. America, Proc. 7, 466–476.
Butler, B. E. (1967). “Soil Periodicity in Relation to Landform Development in Southeastern Australia,” in Landform Studies from Australia and New Guinea. Editors J. N. Jennings, and J. A. Ž. Mabbutt (London: Cambridge University Press), 231–255.
Bwasiri, E. J. (2011). “The Challenge of Managing Intangible Heritage: Problems in Tanzanian Legislation and Administration”, South African Archaeological Bulletin. 66 (194), 129–135.
Bwasiri, E. J., and Smith, B. W. (2015). The Rock Art of Kondoa District, Tanzania. Azania: Archaeological Res. Africa 50, 437–459. doi:10.1080/0067270X.2015.1120436
Bwasiri, E. J., and Emmanuel, J. (2011). The Implications of the Management of Indigenous Living Heritage: The Case Study of the Mongomi Wa Kolo Rock Paintings World Heritage Site, Central Tanzania. South Afr. Archaeological Bull., 60–66.
Caillard, V. (2003). History of Mapping in Tanzania. Available at: http://web.vincentcaillard.free.fr/Images/MappingInTanzania.pdf.
Clark Labs, Clark University (2012). IDRISI 17.0, the Selva Edition [software]. Worcester, MA: Clark Labs, Clark University.
Courty, M. A., Goldberg, P., and Macphail, R. (1989). Soils and Micromorphology in Archaeolog: Cambridge Manuals in Archaeology. Cambridge: Cambridge University Press.
Davis, D. S., Seeber, K. E., and Sanger, M. C. (2020). Addressing the Problem of Disappearing Cultural Landscapes in Archaeological Research Using Multi-Scalar Survey. The J. Isl. Coastal Archaeology 16, 1–17. doi:10.1080/15564894.2020.1803457
Douglass, K., and Cooper, J. (2021). “Archaeology, Environmental Justice, and Climate Change on Islands of the Caribbean and Southwestern Indian Ocean,” in Proc. Natl. Acad. Sci. U.S.A. (International Union of Forest Research Organizations) 175 (1), 8254–8262.
Emmitt, J., Pillay, P., Barrett, M., Middleton, S., Mackrell, T., Floyd, B., et al. (2021). A Comparison of Volumetric Reconstruction Methods of Archaeological Deposits Using Point-Cloud Data from Ahuahu, Aotearoa New Zealand. Remote Sensing 13 (19), 4015. doi:10.3390/rs13194015
Eriksson, M. G., Olley, J. M., and Payton, R. W. (2000). Soil Erosion History in Central Tanzania Based on OSL Dating of Colluvial and Alluvial Hillslope Deposits. Geomorphology 36, 107–128. doi:10.1016/s0169-555x(00)00054-4
Eriksson, M. G., and Sandgren, P. (1999). Mineral Magnetic Analyses of Sediment Cores Recording Recent Soil Erosion History in central Tanzania. Palaeogeogr. Palaeoclimatol. Palaeoecol. 152, 365–383. doi:10.1016/s0031-0182(99)00043-7
Goldberg, P., and Macphail, R. I. (2008). Practical and Theoretical Geoarchaeology. 3rd ed. Malden, MA: Blackwell Publishing Ltd.
González-Ruibal, A., González, P. A., and Criado-Boado, F. (2018). Against Reactionary Populism: towards a New Public Archaeology. Antiquity 92, 507–515. doi:10.15184/aqy.2017.227
Hassan, F. A. (1999). African Archaeology: The Call of the Future. Afr. Aff. 98 (392), 393–406. doi:10.1093/oxfordjournals.afraf.a008046
Headrick, D. R. (2014). Sleeping Sickness Epidemics and Colonial Responses in East and Central Africa, 1900-1940. Plos Negl. Trop. Dis. 8, e2772. doi:10.1371/journal.pntd.0002772
Hollesen, J., Callanan, M., Dawson, T., Fenger-Nielsen, R., Friesen, T. M., Jensen, A. M., et al. (2018). Climate Change and the Deteriorating Archaeological and Environmental Archives of the Arctic. Antiquity 92 (363), 573–586. doi:10.15184/aqy.2018.8
Kangalawe, R. Y. M., Christiansson, C., and Östberg, W. (2008). Changing Land-Use Patterns and Farming Strategies in the Degraded Environment of the Irangi Hills, Central Tanzania. Agric. Ecosyst. Environ. 125, 33–47. doi:10.1016/j.agee.2007.10.008
Kannenberg, H. (1900). Reise Durch Die Hamitischen Sprachgebiete Um Kondoa. Mittheilungen von Forschungsreisenden Und Gelehrten Aus Den Deutschen Schutzgebieten 13, 144–172.
Karkanas, P., Bar-Yosef, O., Goldberg, P., and Weiner, S. (2000). Diagenesis in Prehistoric Caves: The Use of Minerals that Form In Situ to Assess the Completeness of the Archaeological Record. J. Archaeological Sci. 27 (10), 915–929. doi:10.1006/jasc.1999.0506
Karkanas, P., and Goldberg, P. (2013). 6.23 Micromorphology of Cave Sediments. Treatise on Geomorphology 6, 286–297. doi:10.1007/s00213-012-2718-910.1016/b978-0-12-374739-6.00120-2
Karkanas, P., Marean, C., Bar-Matthews, M., Jacobs, Z., Fisher, E., and Braun, K. (2020). Cave Life Histories of Non-anthropogenic Sediments Help Us Understand Associated Archaeological Contexts. Quat. Res. 99, 270–289. doi:10.1017/qua.2020.72
Kessy, E. T. (2013). The Transition from the Later Stone Age to Iron Age in Kondoa, Central Tanzania. Afr. Archaeol Rev. 30 (3), 225–252. doi:10.1007/s10437-013-9141-4
Koenig, C. W., Willis, M. D., and Black, S. L. (2017). Beyond the Square Hole. Adv. Archaeol. Pract. 5 (1), 54–70. doi:10.1017/aap.2016.8
Kryder-Reid, E. (1997). Making Alternative Histories: The Practice of Archaeology and History in Non-western Settings:Making Alternative Histories: The Practice of Archaeology and History in Non-western Settings. Am. Anthropologist 99 (3), 646–647. doi:10.1525/aa.1997.99.3.646
Laird, M. F., Sawchuk, E. A., Kwekason, A., Mabulla, A. Z. P., Ndiema, E., Tryon, C. A., et al. (2021). Human Burials at the Kisese II Rockshelter, Tanzania. Am. J. Phys. Anthropol. 175 (1), 187–200.
Lane, P. (2009). Environmental Narratives and the History of Soil Erosion in Kondoa District, Tanzania: An Archaeological Perspective. Int. J. Afr. Hist. Stud. 42 (3), 457–483.
Leakey, L. S. B. (1950). Archaeological Aspects of the Tanganyika Paintings. Tanganyika Notes Rec. 29, 15–19.
Leakey, M. D. (1983). Africa's Vanishing Art: The Rock Paintings of Tanzania. London, United Kingdom: Hamish Hamilton.
Ligonja, P. J., and Shrestha, R. P. (2015). Soil Erosion Assessment in Kondoa Eroded Area in Tanzania Using Universal Soil Loss Equation, Geographic Information Systems and Socioeconomic Approach. Land Degrad. Develop. 26 (4), 367–379. doi:10.1002/ldr.2215
Lüning, S., Gałka, M., and Vahrenholt, F. (2017). Warming and Cooling: The Medieval Climate Anomaly in Africa and Arabia. Paleoceanography 32, 1219–1235. doi:10.1002/2017PA003237
Lyaruu, H. V. M., and Backeus, I. (1999). Soil Seed Bank and Regeneration Potential on Eroded hill Slopes in the Kondoa Irangi Hills, central Tanzania. Appl. Veg. Sci. 2, 209–214. doi:10.2307/1478984
Madulu, N. F. (2001). Reversed Migration Trends in the Kondoa Eroded Area:Lessons for Future Conservation Activities in the Hado Project Areas, Tanzania. Soc. Sci. Res. Rep. Ser. 20, 1.
Masao, F. T. (1982). The Rock Art of Kondoa and Singida: A Comparative Description. Dar es Salaam: National Museums of Tanzania, Occasional Paper No. 5.
Masao, F. T. (1976). The Late Stone Age and the Rock Paintings of Central Tanzania. Vancouver, BC: Simon Fraser University. Ph.D. dissertation.
McGrath, G. (1976). The Surveying and Mapping of British East Africa 1890-1946: Origins, Development and Coordination. Cartographica Monograph No. 18. Toronto: University of Toronto Press.
McPherron, S. J. P., Dibble, H. L., and Goldberg, P. (2005). Z. Geoarchaeology 20 (3), 243–262. doi:10.1002/gea.20048
Mehari, A. G., and Ryano, K. P. (2016). “Maasai People and Oldupai (Olduvai) Gorge: Looking for Sustainable People-Centered Approaches and Practices,” in Community Archaeology and Heritage in Africa (Oxfordshire, United Kingdom: Routledge), 35–59.
Milne, G., Beckley, V. A., Jones, G. H. G., Martin, W. S., Griffith, G., and Raymond, L. W. (1936). A ProvisionalSoil Map ofEast Africa (Kenya, Uganda, Tanganyika, and Zanzibar) with Explanatory Memoir. London: publisher not identified, 34.
Mugasha, A. G., and Nshubemuki, L. (1988). Soil Conservation in Kondoa, Tanzania: the Case of the Rangi People in the HADO Area. For. Ecol. Manag. 25, 159–180. doi:10.1016/0378-1127(88)90085-0
Mwalyosi, R. B. B. (2000). Vegetation Changes Following Land Reclamation in the Kondoa Eroded Area, Central Tanzania. Afr. J. Ecol. 38 (3), 265–268. doi:10.1046/j.1365-2028.2000.00257.x
Ndomba, P. M., Mtalo, F., and Killingtveit, A. (2009). Estimating Gully Erosion Contribution to Large Catchment Sediment Yield Rate in Tanzania. Phys. Chem. Earth, Parts A/B/C 34 (13–16), 741–748. doi:10.1016/j.pce.2009.06.009
Niespolo, E. M., Sharp, W. D., Tryon, C. A., Faith, J. T., Lewis, J., Ranhorn, K. L., et al. (2020). Ostrich Eggshell Stable Isotopes Record Site-Specific Paleoenvironmental Changes During the Middle to Later Stone Age Transition in Eastern Africa. Quaternary Science Reviews 230. doi:10.1016/j.quascirev.2019.106142
Nobles, G. R., and Roosevelt, C. H. (2021). Filling the Void in Archaeological Excavations: 2D Point Clouds to 3D Volumes. Open Archaeology 7 (1), 589–614. doi:10.1515/opar-2020-0149
Payton, R. W., Christiansson, C., Shishira, E. K., Yanda, P., and Eriksson, M. G. (1992). Landform, Soils and Erosion in the North-Eastern Irangi Hills, Kondoa, Tanzania. Geografiska Annaler: Ser. A, Phys. Geogr. 74 (A), 65–79. doi:10.1080/04353676.1992.11880351
Phillips, J. (1930). Some Important Vegetation Communities in the Central Province of Tanganyika Territory (Formerly German East Africa): A Preliminary Account. J. Ecol. 18, 193–234. doi:10.2307/2256004
P. R. Schmidt, and I. Pikirayi (Editors) (2016). Community Archaeology and Heritage in Africa: Decolonizing Practice. Routledge, 324
Schmidt, P. R. (2006). Historical Archaeology in Africa: Representation, Social Memory, and Oral Traditions. Vancouver, BC: Rowman Altamira.
Schmidt, P. R. (2019). Participatory Archaeology and Heritage Studies: Perspectives from Africa. Routledge.
Sesana, E., Gagnon, A. S., Ciantelli, C., Cassar, J., and Hughes, J. J. (2021). Climate Change Impacts on Cultural Heritage: A Literature Review. Wires Clim. Change 12, 1. doi:10.1002/wcc.710
Shahack-Gross, R., Berna, F., Karkanas, P., and Weiner, S. (2004). Bat Guano and Preservation of Archaeological Remains in Cave Sites. J. Archaeological Sci. 31 (9), 1259–1272. doi:10.1016/j.jas.2004.02.004
Stiner, M. C., Kuhn, S. L., Surovell, T. A., Goldberg, P., Meignen, L., Weiner, S., et al. (2001). Bone Preservation in Hayonim Cave (Israel): A Macroscopic and Mineralogical Study. J. Archaeological Sci. 28, 643–659. doi:10.1006/jasc.2000.0634
Stoops, G. (2003). Guidelines for Analysis and Description of Soil and Regolith Thin Sections. Madison, WI: Soil Science Society of America Inc.
Swynnerton, C. F. M. (1936). The Tsetse Flies of East Africa: A First Study of Their Ecology, with a View to Their Control. London: Transactions of the Royal Entomological Society of London, 1.
Temu, E. L. (2018). Rock Art Damage Reducing Facilitators of Central Tanzania Heritage: A Gateway to Tourism Promotion. J. Popular Edu. Africa 2 (2), 52–68.
Tryon, C. A., Ranhorn, K., and Lewis, J. E. (2019). “Excavating the Archives: The 1956 Excavations of the Late Pleistocene-Holocene Sequence at Kisese II (Tanzania),” in Modern Human Origins and Dispersal. Editors H. Reyes-Centeno, C. Bentz, and Y. Sahle (Tübingen: Kerns-Verlag), 215–238.
Keywords: cave entrance, eastern Africa, Kondoa, micromorphology, sedimentology, archaeological stewardship
Citation: Patania I, Porter ST, Keegan WF, Dihogo R, Frank S, Lewis J, Mashaka H, Ogutu J, Skosey-Lalonde E, Tryon CA, Niespolo EM, Colarossi D and Ranhorn KL (2022) Geoarchaeology and Heritage Management: Identifying and Quantifying Multi-Scalar Erosional Processes at Kisese II Rockshelter, Tanzania. Front. Earth Sci. 9:665193. doi: 10.3389/feart.2021.665193
Received: 07 February 2021; Accepted: 10 December 2021;
Published: 02 March 2022.
Edited by:
Andrea Zerboni, University of Milan, ItalyReviewed by:
Guido Stefano Mariani, University of Cagliari, ItalyAurel Perșoiu, Romanian Academy, Romania
Christos Pennos, University of Bergen, Norway
Copyright © 2022 Patania, Porter, Keegan, Dihogo, Frank, Lewis, Mashaka, Ogutu, Skosey-Lalonde, Tryon, Niespolo, Colarossi and Ranhorn. This is an open-access article distributed under the terms of the Creative Commons Attribution License (CC BY). The use, distribution or reproduction in other forums is permitted, provided the original author(s) and the copyright owner(s) are credited and that the original publication in this journal is cited, in accordance with accepted academic practice. No use, distribution or reproduction is permitted which does not comply with these terms.
*Correspondence: Ilaria Patania, ilariapat@gmail.com