Submarine Groundwater Discharge From Non-Tidal Coastal Peatlands Along the Baltic Sea
 Erwin Don Racasa
 Bernd Lennartz
 Miriam Toro
 Manon Janssen
- 1Soil Physics, Faculty of Agricultural and Environmental Sciences, University of Rostock, Rostock, Germany
- 2Landesamt für Landwirtschaft, Umwelt und ländliche Räume, Flintbek, Germany
Submarine groundwater discharge (SGD) is an important pathway for water and materials within the land-ocean transition zone that can impact coastal environments and marine life. Although research from sandy shorelines has rapidly advanced in recent years, there is very little understanding of coastal areas characterized by a low hydraulic conductivity, such as carbon-rich coastal peatlands. The objective of this study was to determine the magnitude and location of terrestrial SGD to be expected from a non-tidal low-lying coastal peatland located along the Baltic Sea and to understand the controlling factors using numerical modeling. We employed the HYDRUS-2D modeling package to simulate water movement under steady-state conditions in a transect that extends from the dune dike-separated rewetted fen to the shallow sea. Soil physical properties, hydraulic gradients, geological stratifications, and topography were varied to depict the range of properties encountered in coastal peatlands. Our results show that terrestrial SGD occurs at the study site at a flux of 0.080 m2 d−1, with seepage rates of 1.05 cm d−1 (upper discharge region) and 0.16 cm d−1 (lower discharge region above submerged peat layer). These calculated seepage rates compare to observations from other wetland environments and SGD sites in the Baltic Sea. The groundwater originates mainly from the dune dike—recharged by precipitation and infiltration from ponded peatland surface water—and to a lesser extent from the sand aquifer. The scenario simulations yielded a range of potential SGD fluxes of 0.008–0.293 m2 d−1. They revealed that the location of terrestrial SGD is determined by the barrier function of the peat layer extending under the sea. However, it has little impact on volume flux as most SGD occurs near the shoreline. Magnitude of SGD is mainly driven by hydraulic gradient and the hydraulic conductivity of peat and beach/dune sands. Anisotropy in the horizontal direction, aquifer and peat thickness, and peatland elevation have little impacts on SGD. We conclude that SGD is most probable from coastal peatlands with high water levels, large Ks and/or a dune dike or belt, which could be an essential source for carbon and other materials via the SGD pathway.
Introduction
Submarine groundwater discharge has been recognized as an important land-ocean route for water and materials (Burnett et al., 2003; Burnett et al., 2006; Moore, 2010; Taniguchi et al., 2019) and often has higher concentrations of carbon, nutrients, and metals than river waters (Moore, 2010). Along the German coast of the southern Baltic Sea, low-lying coastal areas with peatlands (<1 masl elevation) have been abundantly documented (Jurasinski et al., 2018), some with submerged peat extending beyond the coastline (Kreuzburg et al., 2018). The vast majority of these coastal peatlands are degraded due to a long history of drainage for agricultural usage (Baird, 1997) and bordered by coastal protection measures (Bollmann et al., 2010). They are thus characterized by a low hydraulic conductivity (Ks) and low hydraulic gradients. In organic-rich subterranean estuaries, high concentrations of remineralized forms of organic matter have been reported (Taniguchi et al., 2019). Coastal peatlands with their large stores of carbon, organic matter, and nutrients from decaying plants could thus be a potentially overlooked source of water and materials for the Baltic Sea via the SGD pathway.
The occurrence of SGD—sourced from terrestrial groundwater or recirculated seawater and usually a mixture of both—depends on several factors. Soil hydrological properties, such as hydraulic conductivity, anisotropy, and preferential flow pathways, can affect the magnitude and location of terrestrial SGD. Real-world complexities such as geological heterogeneities, non-uniform and evolving alongshore and cross-shore morphology (Robinson et al., 2018), topographic differences, and anthropogenic structures can also be important factors. Global coastal groundwater discharge is predominantly controlled by the flow capacity of aquifers–a product of permeability, topographic gradient, and thickness of coastal aquifers (Luijendijk et al., 2020). In contrast, SGD from recirculated seawater or “recirculated SGD” is driven by currents, waves, tides, and density differences (Taniguchi et al., 2019). In this research, we focus only on terrestrial SGD.
Although SGD studies have rapidly advanced in recent years, most information was generated from sandy shorelines. Very little research has been conducted on muddy shorelines such as salt marshes, mangroves (Taniguchi et al., 2019), and even coastal peatlands. Previous SGD studies in the Baltic Sea have focused on known and expected groundwater discharge areas (Szymczycha et al., 2014; Szymczycha et al., 2016; Szymczycha and Pempkowiak, 2016; Szymczycha et al., 2020) but new sources, such as submarine terraces (Jakobsson et al., 2020) and pockmarks (Idczak et al., 2020), have also been proposed. Total groundwater discharge in the Baltic Sea was estimated at 1% of total river runoff but phosphorus and carbon SGD fluxes were calculated to be 86 and 30%, respectively, of rivers (Szymczycha and Pempkowiak, 2016). The measured annual average concentrations of dissolved organic carbon (DOC) in the Bay of Puck is 5.8 mg C L−1 (Szymczycha et al., 2014). However, in coastal peatlands, DOC and other materials concentrations can be much more relevant.
Our study seeks to address the lack of data for SGD from coastal peatlands using numerical simulations. The main objectives are to 1) quantify magnitude and location (distance from coast) of terrestrial SGD flux from a coastal peatland located along the Baltic Sea and 2) determine the factors that govern terrestrial SGD from peatlands in low-lying coastal environments by assessing the impact of soil hydraulic properties, sea and groundwater levels, and geological stratification and topography. With the current trend on restoring extensively modified coastal peatlands to mitigate greenhouse gas emissions, understanding how groundwater flows and how materials are transported is ever more imperative.
Materials and Methods
Study Site
The reference peatland for simulating groundwater flow and discharge in this study is based on a coastal peatland near the city of Rostock, northeast Germany, the Hütelmoor Nature Reserve (“Naturschutzgebiet Heiligensee und Hütelmoor”; 54.2139 N 12.1725 E) (Figure 1). This coastal peatland borders the Baltic Sea along a 3-km long shoreline, but is physically separated by a 40-m wide dune dike that thins out in its northern part. The area was shaped by the Weichselian ice age. The glacial till is covered by glacio-fluvial sands with 2.5–15 m thickness, which now form a shallow aquifer (Ibenthal, 2020 and references therein). During the Littorina transgression 8,000–1,200 BP, the rising groundwater level resulted in the development of a paludification fen from 7,000 BP onwards (Kreuzburg et al., 2018). Peat thickness is up to 3 m in the central peatland and near the coast, while it thins out towards the forest. A special feature is the outcropping of the peat at the coastline and in the shallow Baltic Sea. Strongly decomposed sedges and reed make up the peat. Elevation of the peatland is −0.15–0.75 masl (meters above sea level) with a total area of 350 ha (Ibenthal, 2020). Annual precipitation, annual evapotranspiration, and average daily temperature are 693 mm, 604 mm (1951–2010; Miegel et al., 2016), and 9.7°C (at Warnemünde, ∼7 km away, 1990–2019; DWD(Deustcher Wetterdienst), 2020), respectively.
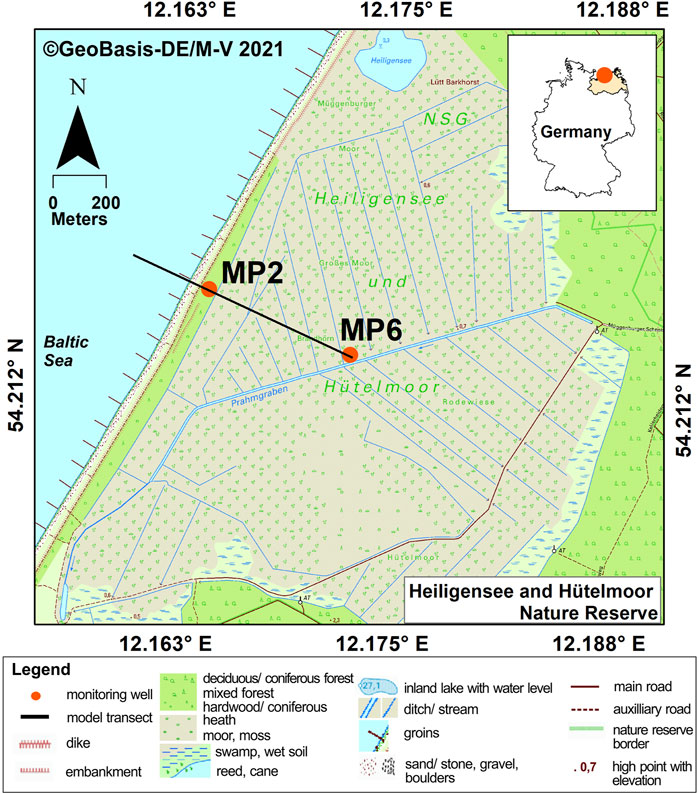
FIGURE 1. The nature reserve “Heiligensee und Hütelmoor,” in Mecklenburg-Western Pomerania, Germany. The black line indicates the transect for the 2D groundwater model. MP2 and MP6 are groundwater observation wells. A groundsill was installed at the outlet of the ditch system in December 2009, restricting the drainage function of the ditches to high water levels. The background topographical map was taken from https://www.laiv-mv.de/Geoinformation/Karten/Topographische-Karten/.
The Hütelmoor, similar to many coastal peatlands in the southern Baltic Sea region, has been artificially drained, diked, and utilized as pasture. Initial drainage started in the 18th century and extensive pumping from 1976 to 1991 led to degradation and compaction of the peat’s upper decimeters (Jurasinski et al., 2018). In December 2009, the construction of a ground sill with an elevation of 0.4 masl at the outlet of the peatland’s ditch system enabled rewetting and renaturation of the peatland. Since then, most of the peatland is flooded with surface waters. The ditches still drain the peatland when the water level exceeds the groundsill, they affect local groundwater flow fields and divert water inflow from the forest (Ibenthal, 2020). The peatland is still separated from the Baltic Sea by a dune dike, that is not maintained anymore. The electrical conductivity (EC) in ground- and surface water in the peatland ranged from 4–13 mS/cm and thus revealed brackish waters, originating from earlier inundations and occasional seawater inflow via the dike system during storms (Ibenthal, 2020). In comparison, several EC measurements from the nearshore waters in front of the Hütelmoor ranged from 18 to 27 mS/cm, corresponding to a salinity of 11–15 psu. Due to the brackish nature of groundwater in the peatland, we name the submarine groundwater discharging from land “terrestrial” (and not fresh) SGD in this study.
Approach for Modelling Terrestrial SGD
We simulated terrestrial submarine groundwater discharge in the Hütelmoor using the HYDRUS-2D modeling package. HYDRUS simulates water movement in variably saturated media by solving the Richards equation for Darcian water flow:
where θ is the volumetric water content, h is pressure head, xi are spatial coordinates, t is time, S is the sink term,
HYDRUS can simulate the flow of water both in the unsaturated dune dike and the fully saturated peatland. The reference scenario comprises a 2D cross-section reaching from the central part of the Hütelmoor Nature Reserve peatland into the shallow Baltic sea (Figures 1, 2). The topography, geological stratification, material properties, and boundary conditions were based on measured data, and steady-state groundwater fluxes were simulated to yield a long-term average of terrestrial SGD. Fluxes originating from aquifer, peat, and dune were quantified separately. In subsequent model runs, these factors were changed one by one based on actual and realistic predicted conditions, to determine their respective impacts on SGD.
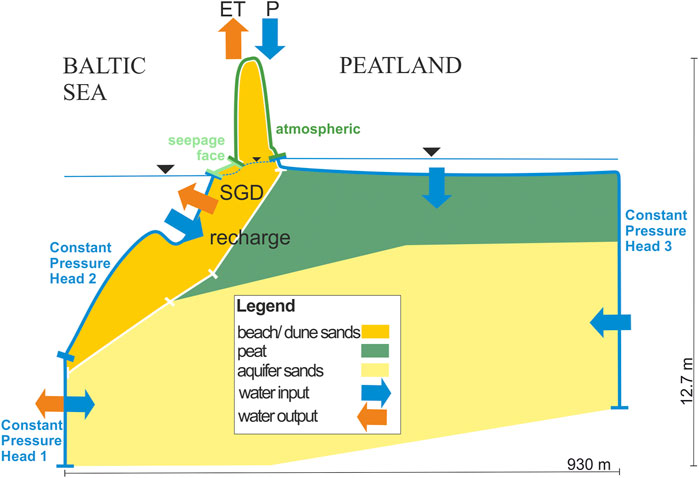
FIGURE 2. Coastal peatland system with water in- and outflows and model boundary conditions. White lines at the boundary of the beach/dune sands are mesh lines used to calculate water fluxes. The peat extension layer is also depicted here. Note the vertical exaggeration of the cross-section.
Water inflows (Figure 2–blue arrows) into the coastal peatland system come from 1) the ponded surface waters above the peat, 2) precipitation at dune dike and beach, 3) recharge from recirculated SGD at the seafloor (corresponding to Constant Pressure Head 2), and 4) lateral groundwater inflow from the landside. Outflows (orange arrows) from the system occur as evapotranspiration in the dune and the total SGD from the seafloor. Uncertainty in water flow from the sea-submerged aquifer sands (left boundary) makes it either an inflow or outflow region. Infiltration from ponded peatland surface waters is also expected into the dune dike.
Modeling Domain
We established the modeling domain (Supplementary Figure 1) using published and available data. It extends from the shallow Baltic Sea to the central peatland (Figure 1). Elevation measurements at the groundwater observation wells (Ibenthal, 2020) and seawater level were used as reference points of the domain, while ground heights in between these reference points were obtained from a Digital Elevation Map (provided by Landesamt für innere Verwaltung Mecklenburg-Vorpommern, Schwerin, Germany) using the 3D Analyst Toolbox of ARCMap. The materials were distributed following the geological profile constructed based on sediment cores (Jurasinski et al., 2018; Ibenthal, 2020). Bathymetric data from marine surveys (Kreuzburg et al., 2018) completed the model geometry, taking note of the longshore bar mound 100 m from the coast. The modeling domain’s total length is 930 m, of which 245 m extend into the sea. In the vertical direction, it extends from 3.7 masl at the top of the dune dike to −9 masl at the aquifer bottom. The bottom boundary follows the surface of the glacial till.
The modeling domain’s discretization was carefully scrutinized and yielded a final target size of 1.0 m, x-direction stretching factor of 25, and a smoothing factor of 1.8. To account for the highly non-linear water flow in the unsaturated zone of the dune dike, a surface mesh refinement of 0.05 m was applied in the upper beach/dune sands. Surface refinements of 0.2 and 0.5 m were also applied at the lower beach/dune sands and peat materials, respectively. A total of 3,454 nodes resulted from this configuration with 351 nodes and 351 elements on the domain boundary.
Model Runtime
The maximum model runtime was set at 360 days. All simulations achieved steady-state in the given runtime except for the minimum beach/dune Ks scenario, where runtime was increased to 720 days. Initial, minimum, and maximum time steps were set at 0.01, 0.001, and 5 days, respectively.
Soil Hydraulic Parameters
We applied the single-porosity van Genuchten-Mualem model. Soil hydraulic properties of the reference scenario (Table 1) were derived from soil data gathered previously at the study site. For soil texture of the aquifer sands and beach/dune sands, average particle size distributions were calculated from 34 to 6 soil samples, respectively. The resulting composition of aquifer sands was 89.4% sand, 7.5% silt and 3.1% clay. The beach/dune sands were sandier with 98.3% sand, 0.9% silt and 0.8% clay. Soil hydraulic parameters were then generated using the neural network prediction “Rosetta” incorporated into the Hydrus software (Schaap et al., 2001). Peat hydraulic parameters were calculated with the pedotransfer functions for sedge bulk density of ≤0.2 g cm−3 proposed by Liu and Lennartz (2019), based on measured bulk density ranging from 0.12 to 0.15 g cm−3 in the peatland (L. Gosch, personal communication, August 23, 2019) and 0.17 g cm−3 in the peat exposed at the coastline (Gosch et al., 2019). The residual water content for peat was assigned a value of 0.2. For the tortuosity and pore-connectivity parameter (L), a value of 0.5 is acceptable for degraded fen peat under wet or saturation conditions (Dettmann et al., 2014; Liu and Lennartz, 2019) as well as for sands, as this is the average value for most soils based on calculations by Mualem (1976) (Simunek et al., 2018). For the peat and aquifer sands, saturated hydraulic conductivities (Ks), values determined with slug tests at the study site were used (Ibenthal, 2020); the resulting Ks values (geometric means) are 8.64 × 10⁻³ m d−1 for the peat (n = 4) and 1.73 m d−1 for the aquifer sands (n = 4). Dune Ks of 11.8 m d−1 (n = 8) was laboratory-determined on samples taken in the northern part of the dune and was adapted from a previous study (Mohawesh et al., 2017).
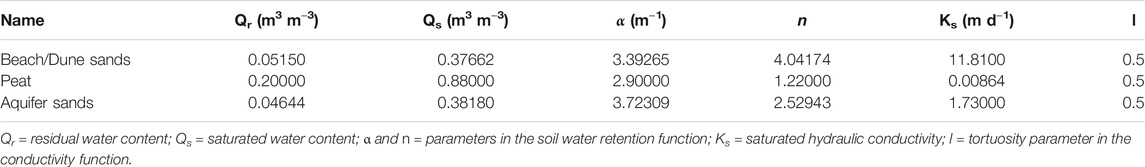
TABLE 1. Soil hydraulic parameters used in the standard scenario.
Boundary and Initial Conditions
The model boundary conditions (BC) were set as follows (see also Figure 2): Atmospheric BC was applied to the dune surface wherein long-term averages of meteorological variables were used (average precipitation: 1.90 mm d−1; average evapotranspiration: 1.65 mm d−1) (Rostock-Warnemünde 1951–2010; Miegel et al., 2016). At the beach, a seepage face BC was applied which switches to atmospheric BC in the absence of seepage. However, no seepage was observed across the seepage face in any of the simulations. In HYDRUS, “seepage face” refers to the boundary condition applied in surfaces where water leaves the saturated part of the flow domain. Constant head BCs in hydrostatic equilibrium were set on the left side (Constant Pressure Head 1) and at the seafloor (Constant Pressure Head 2), the pressure head corresponds to the average sea water level at Warnemünde, Rostock (2005–2015) of 0.091 masl (WSV(Wasserstraßen und Schiffahrtsverwaltung des Bundes), 2020). Likewise, the right-side boundary (Constant Pressure Head 3), which continues to the peatland surface, was assigned a constant BC in hydrostatic equilibrium, corresponding to the average peatland water level of 0.357 masl (September 2016 to October 2018; derived from 73,735 individual 15-min interval measurements; converted to equivalent freshwater heads). No flux was assumed at the bottom as the glacial till was considered impermeable.
Initial pressure heads were set to correspond with the constant head boundary conditions. As such, the initial bottom pressure head amounted to 9.357 m. A slight slope (0.05, x-direction) from the sea up to behind the dike was added because of pressure head differences. The peatland’s ponded conditions have a higher pressure head compared to the seawater on the left side. The angular slope was not applied in sea level scenarios as the hydraulic gradient’s difference was only 0.001 m.
Uncertainty Analysis
Most groundwater bodies are heterogeneous with hydraulic conductivity variability influencing groundwater transport (Peña-Haro et al., 2011). In peat soils, it has been shown that a heterogeneous hydraulic conductivity distribution can lead to complex groundwater flow patterns (Beckwith et al., 2003). Since our simulations are based on homogenous hydraulic conductivities in the three materials considered, uncertainty of the model outcome resulting from the variability of Ks cannot be assessed. To address this, we performed 100 extra simulation runs with random Ks values (Supplementary Table 1). The number of replicates of the Ks measurements was too small to derive distributions (aquifer, peat), or samples were only taken from a single site (beach/dune Ks). We therefore additionally analyzed Ks values calculated from particle size distributions following Beyer (1964) both for the aquifer (n = 34) and the beach/dune sands (n = 6). The geometric means were close to the ones of the measured Ks values. All Ks values were then log10-transformed. Random numbers were drawn from normal distributions with means based on the measured values, and the standard deviations of the Beyer-derived values.
For the peat Ks, the coefficient of variation reported by Baird (1997) for a degraded peat was used to calculate the SD. Other published datasets for fen peat (Liu et al., 2016; Wang et al., 2021) were not considered because of much higher Ks values. The log10 mean and SD were then used to generate the random Ks values. In Supplementary Table 1, a descriptive statistics summary of the random Ks values is listed.
Scenarios
To investigate the factors that affect the magnitude and location of terrestrial SGD from coastal peatlands, three clusters of scenarios were analyzed: 1) soil physical properties, 2) hydraulic gradients and, 3) geological stratification and topography (Table 2). The parameters were changed one at a time to better determine their individual impacts on SGD.
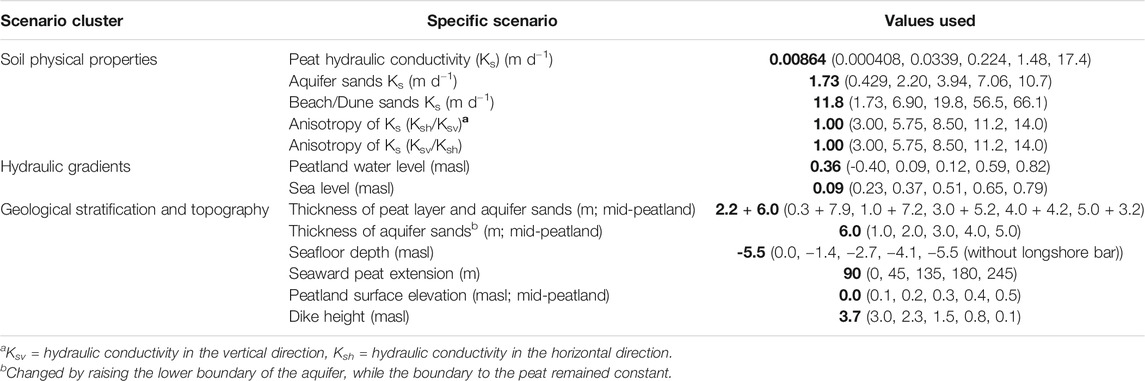
TABLE 2. Steady-state scenarios used in the modeling.
Soil Physical Properties
We investigated the effects of different magnitudes of material Ks and peat anisotropy. The peat Ks in the reference scenario is similar to mesic-humic peat in a peatland-pond system (Ferone and Devito, 2004) but lower than the average Ks for peatland sedges compiled in a meta-study (2.24 × 10⁻¹ m d−1; Liu and Lennartz, 2019). To picture a realistic range of potential peat Ks in coastal peatlands, the minimum, maximum and geometric mean of sedge peat Ks reported by Liu and Lennartz (2019) was used as well as mean ± one standard deviation of the log-transformed Ks. For the aquifer and beach/dune sands, Ks values were estimated from particle size distributions described previously. For the beach/dune sands, though, the aquifer sand Ks value of the reference scenario (1.73 m d−1) was used as the minimum value.
Anisotropy of Ks has been reported repeatedly in peat (Beckwith et al., 2003; Wang et al., 2020), with fen peats showing a higher Ks either in vertical or horizontal direction depending on peat type (Liu et al., 2016). Wang et al. (2020) reported anisotropy in two fens with Ks in the vertical direction being larger than the horizontal direction (Ksv > Ksh) by a factor of six. Liu et al. (2016) described anisotropy with the higher flow in the horizontal direction by factors of up to seven. However, vertical flow was higher by a factor of 14 in one sample. Therefore, we examined the anisotropy’s effect in both the vertical and horizontal direction, with factors ranging from three to fourteen.
Hydraulic Gradients
To analyse the effect of changing water levels in peatlands on terrestrial SGD, we used the minimum and maximum values measured during a three-year well monitoring period. The mean ± one standard deviation was also used to depict intermediate peat water levels. Furthermore, a 0.090 masl peat water level, similar to sea level, was simulated.
Investigated seawater levels were based on sea-level rise scenarios (BACC II Author Team, 2015; Grinsted et al., 2015). A global mean sea level rise mid-range estimate of +0.70 m is expected. We took this as the maximum value and divided it into five equal increments. We assumed that the peatland water level will rise in response to rising sea levels, so that the peatland water level was set equal to the sea level (hydraulic head = 0.001 m).
Geological Stratification and Topography
Geological stratifications, changing profiles, and the topography could also influence the magnitude and location of groundwater across the seafloor. Changing the thickness of the peat and aquifer sands layers plays a major role in water transport due to their relation to hydraulic conductivity. Here, the original peat thickness of 2.2 m was varied from 0.3 m up to 5 m–from the minimum peat depth for soils to be considered a mire based on the German soil classification system (Trepel et al., 2017), to thick fen peats. On average, peat layers are often assumed to be between 1.5–2 m (Zauft et al., 2010). As a response to the changing peat thickness, the upper limit of the aquifer sands also changed, while the lower limit was kept constant. However, to determine the impact of the aquifer sands thickness alone, simulations of 1–5 m thick aquifer sands with a constant peat thickness were also performed.
In the Hütelmoor and other coastal peatlands, it has been observed that the peat layer extends below the dune dike and beyond the shoreline, sometimes with outcropping peat in shallow waters. To examine the impact of varying seaward peat extension, the peat layer ended under the shoreline in the minimum scenario and was extended until the left border of the modeling domain in the maximum scenario. We also simulated scenarios of various seafloor depths ranging from −4.1 to 0.0 masl to represent coastal areas with broader and shallower nearshore zones. An additional scenario of the same seafloor geometry as the reference scenario without the longshore bar at 100 m from the shore was also simulated.
Scenarios for changing the topography of the study area were conducted by altering the man-made dike height and the peat elevation. The dike height was incrementally decreased by 0.7 m from 3.7 m up to 0.8 masl. Concurrently, peat elevation was raised from its current height of 0.0 masl in the middle of the peatland to 0.5 masl, which is a realistic value for more natural peatlands. The 0.357 masl peat water level was kept constant in this set of simulations to determine the effect of the topography alone.
Quantification of Terrestrial SGD
HYDRUS calculates flow velocities for each of the nodes and reports integrated fluxes across boundaries. Terrestrial SGD was assumed to be equal to the flux across the Constant Pressure Head two boundary, which extends across the entire seafloor (Figure 2). The net flux of recirculated seawater across this boundary is zero under steady-state conditions. The terrestrial SGD comprises all the water from the peat, aquifer sands, and beach/dune sands that come out as submarine groundwater discharge. Water fluxes from each of the different materials were determined using mesh lines in the material boundaries (Figure 2); fluxes across mesh lines are calculated by HYDRUS in the same way as those across the boundary conditions.
Discharge and recharge regions in the seafloor were identified by looking at velocity vectors and streamlines, both of which are outcomes of HYDRUS graphic user interface post-processes. After identification of discharge and recharge regions, we added meshlines to these regions to quantify water fluxes separately. Discharge determined from these regions can be defined as “total SGD”, since it includes both terrestrial and recirculated SGD. However, caution should be taken when interpreting total and recirculated SGD as the model does not consider marine forcings such as waves. The calculated fluxes across boundaries or mesh lines are reported in m2 d−1. To determine the seepage rate from the seafloor (m d−1), the fluxes were divided by the total length of the respective boundary or mesh line.
Results
Flow Patterns and Location of SGD in Coastal Peatlands
Reference Peatland
Submarine groundwater discharge has been observed in two separate areas of the seafloor in the reference simulation (Figure 3A). Firstly, SGD is released in the upper 0.6 m water depth over a distance of 10 m from the shoreline into the sea (upper discharge region). Here, water originates from 1) atmospheric input to the dune and the beach and 2) peatland surface water that infiltrated into the dune base, as deduced from velocity vectors. Water flows from the dune base into the beach sands and towards the Baltic sea, following the hydraulic gradient. The underlying peat acts as an aquitard due to its low hydraulic conductivity, limiting the infiltration of surface water and groundwater flow.
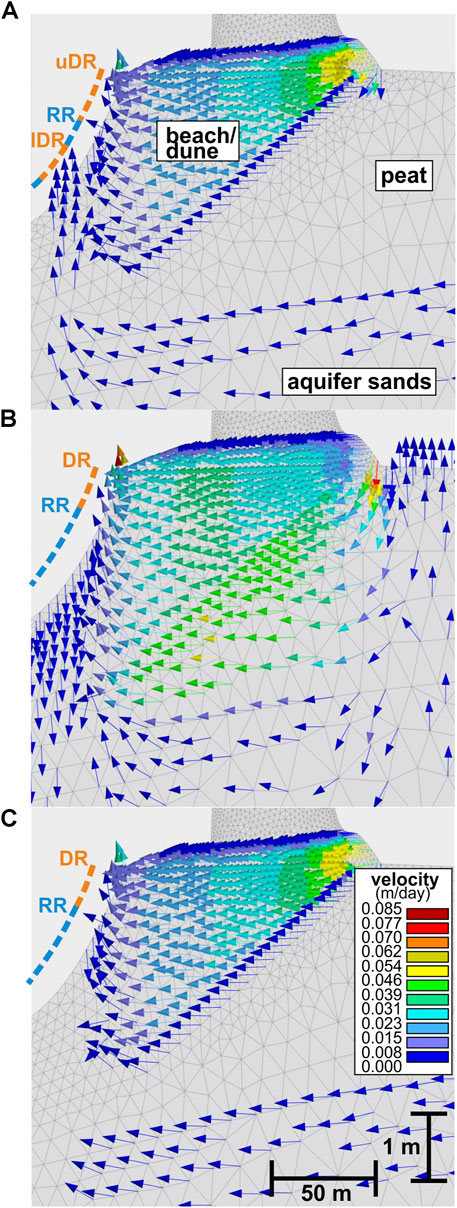
FIGURE 3. Groundwater flow paths of the reference and selected scenarios illustrated using velocity vectors, in subset of the modelling domain. From top to bottom: (A) reference (B) peat Ks max, (C) peat extension max. Discharge (DR) and recharge regions (RR) are indicated with orange and blue dashed lines, respectively. The upper (uDR) and lower (lDR) discharge regions are shown in panel 3A.
The lower discharge region is located at 1.4–1.7 m depth (length ∼15 m), with water coming from the sand aquifer. Flowing particles (user-defined particles showing trajectory and position through time) were observed to cross from the aquifer sands through the thinly buried peat layer and to the beach/dune sands (Supplementary Figure 2A). In between the two described discharge regions, areas with seawater recharge are found, contributing to the overall SGD flux. No seepage from the beach occurred.
Scenarios
Among all scenario simulations, two different patterns of SGD were observed with either two discharge regions (as in the reference peatland) or one discharge region (Figures 3B,C). However, most submarine groundwater appears to discharge in the upper 0.6 m of the seafloor based on velocity vectors.
The two-discharge-region pattern seems to form when there is considerable water flow from the aquifer (due to higher aquifer Ks than minimum value, increased aquifer thickness) or when the hydraulic gradient is large. The pattern is maintained when beach/dune Ks, peat Ksh/Ksv ratio, seafloor depth, peat elevation, and dike height are varied. In all those scenarios, the general groundwater discharge pattern remains similar to the reference peatland mainly due to the strong impact of the peat layer extending towards the sea. However, the lengths of the discharge regions may differ between the simulations. For example, the upper discharge region is smallest for the shallowest seafloor scenario, where SGD is limited to a few meters near the shore.
The single discharge region, located in the upper seafloor, occurs whenever the influence of the peat layer extending to the sea to act as a barrier is either diminished (upper and lower discharge regions merge) or amplified (development of lower discharge region is impeded). For instance, larger peat Ks than the reference (Figure 3B) or peat Ksv/Ksh ratios >3 reduce the barrier effect of the peat extension layer. Thus, both the dune and aquifer flow pathways merge in the beach sands to a one-discharge area. In contrast, increasing peat thickness and continuing the peat layer (Figure 3C) farther under the Baltic Sea magnify the barrier effect of the peat layer, and upflow of water from the aquifer to the seafloor is prevented. Furthermore, a decrease in aquifer flow due to a decrease in aquifer thickness leads to a single discharge-region flow pattern.
SGD Fluxes From Coastal Peatlands
Reference Peatland
Water inputs into the modelling domain mainly originate from infiltration at the dune dike base and peat surface and the lateral groundwater inflow (these latter two cannot be distinguished), while atmospheric input at dune and beach is less important (Figure 4). Outputs are terrestrial SGD across the seafloor and a minimal groundwater outflow through the sea-submerged aquifer sands on the left boundary of the modeling domain.
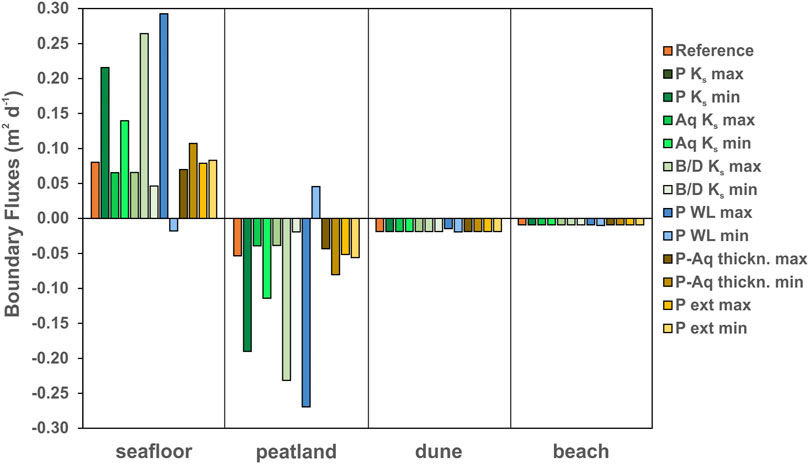
FIGURE 4. Net boundary fluxes of the reference scenario (orange) and selected scenarios of soil physical properties (green shades), hydraulic gradients (blue shades), and geological stratifications (yellow shades). For location of boundaries, see Figure 2 (seafloor ≙ Constant Pressure Head two; peatland ≙ Constant Pressure Head three; dune ≙ atmospheric; beach ≙ seepage face). Fluxes from the left boundary (Constant Pressure Head 1) were not included due to low values (10–4 to 10–6 m2 d−1). Notations: P, peat; Aq, aquifer; B/D, beach/dune; WL, water level; ext, extension.
Looking at the simulated terrestrial SGD flux across the seafloor, our long-term average SGD is 0.080 m2 d−1 (0.056 L min−1 m−1) (Figure 5). Upscaled total terrestrial SGD for the entire 3-km coastline of the Hütelmoor is estimated to be 240 m3 d−1, or 168 L min−1. We evaluated the uncertainty of the reference scenario’s SGD based on the combination of random Ks for the three materials, due to its high variability in nature. The boxplot in Figure 5 presents the uncertainty analysis results (see also Supplementary Table 1). The median SGD of the 100 simulation runs is 0.083 m2 d−1 and thus close to the value of the reference scenario. The lower and upper bounds are 0.038 m2 d−1 and 0.195 m2 d−1.
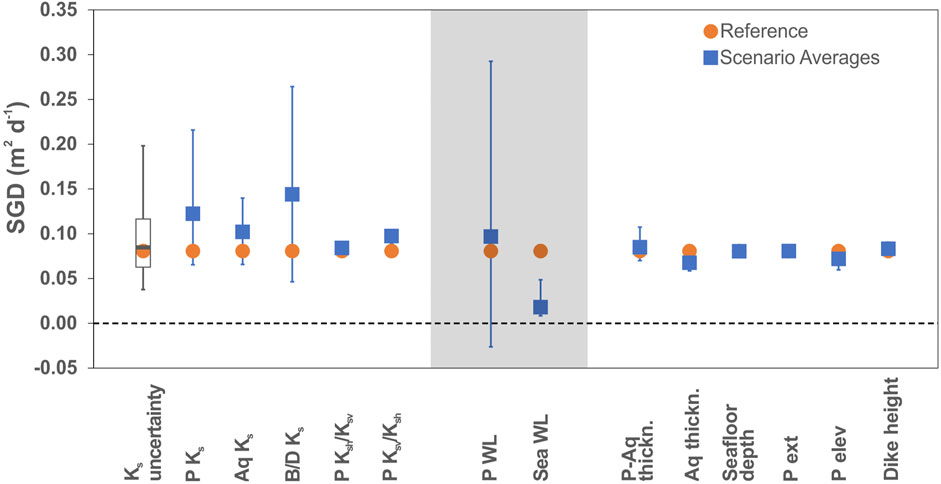
FIGURE 5. Range of submarine groundwater discharge in different scenarios with results of Ks uncertainty analysis (boxplot). Blue boxes are averages of the scenario simulations and the error bars represent the range. Error bars of uncertainty analysis represent the upper and lower bounds based on ±1.5* Interquartile Range. The reference scenario flux is represented here in orange dots. The shaded area separates the three groups of properties. Notations: P, peat; Aq, aquifer; B/D, beach/dune; WL, water level; ext, extension.
The seepage rate calculated separately for both observed discharge regions revealed that discharge is distinctly higher near the shore. Most SGD flows out in the upper discharge region with a flux of 0.106 m2 d−1 and a corresponding seepage rate of 0.0105 m d−1 (Table 3). An additional but vitally lower flux of 0.023 m2 d−1 (seepage rate: 0.0016 m d−1) is found in the lower discharge region. The seafloor’s average seepage rate is 0.0033 m d−1 based on the terrestrial SGD flux of the whole seafloor and the lengths of the discharge regions. Average discharge flux (0.128 m2 d−1) and seepage rate (0.0052 m d−1) calculated from the two discharge regions are slightly higher than the terrestrial SGD flux across the seafloor, which is due to the additional input of recirculated SGD from the recharge regions. Still, we are able to show here that most terrestrial SGD occurs in the upper seafloor with minor flux arising from the thin section of the peat extension.
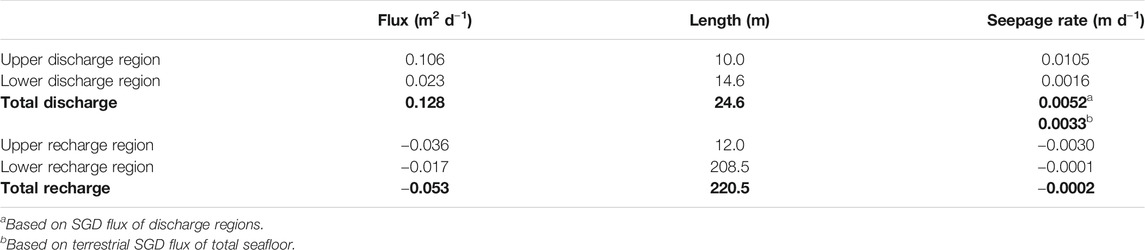
TABLE 3. Fluxes across specific discharge and recharge regions of the reference peatland. Total discharge/recharge flux, length, and seepage rate are highlighted in bold.
Range of SGD Expected From Coastal Peatlands
In nearly all scenarios, the majority of the water inputs come from the peatland with only minor atmospheric inputs from the dune and beach (Figure 4). The water input through the peatland increases with large hydraulic conductivity or gradient, while the atmospheric input remains constant.
The SGD fluxes simulated in the various scenarios range from 0.008 to 0.293 m2 d−1, corresponding to 10–360% of the reference scenario’s flux (Figure 5). In one scenario—with low peatland water level—a flow reversal was observed, i.e., seawater intrudes with a flux of −0.019 m2 d−1. The largest SGD flux is observed in the maximum water level scenario, and also the maximum Ks for peat and beach/dune sands yield large fluxes (270 and 330% of reference, respectively). The effect of the aquifer sand Ks is less pronounced, with SGD fluxes amounting to 80–170% of the reference, but still considerably more than that of the other factors. All sea level rise simulations recorded minimal SGD fluxes (0.008–0.048 m2 d−1; 10–60%). Peat anisotropy (0.081–0.104 m2 d−1; 101–130%), peat-aquifer thickness (0.070–0.107 m2 d−1; 87–134%), aquifer thickness (0.059–0.075 m2 d−1; 73–94%), seafloor depth (0.079–0.081 m2 d−1; 98–101%), peat extension (0.079–0.083 m2 d−1; 98–104%), and dike height (0.081–0.091 m2 d−1; 100–113%) have little impact on the SGD flux. Most of the simulated SGD fluxes fall within the range of values obtained from the Ks-based uncertainty analysis, where a minimum and maximum SGD flux of 0.038 m2 d−1 and 0.493 m2 d−1 were determined, respectively. The beach/dune sands Ks is highly linearly correlated with SGD (R2 = 0.9837) in the uncertainty analysis, while peat Ks (R2 = 0.016) and aquifer sands Ks (R2 = 0.0356) are not (Figure 7).
Origin of SGD Flux
To better understand the SGD flow and magnitude patterns in a coastal peatland system, we determined the source of terrestrial SGD (Figure 6). For this purpose, fluxes from different subsections of the materials (dune, beach, main peat body, thin peat extension, aquifer) to the beach sands were quantified in selected scenarios using meshlines (Figure 2). Positive fluxes are inputs and contributors to the beach sands while negative fluxes represent outflow of water (Figure 6). The sum of these fluxes should be equal to the terrestrial SGD determined at the seafloor boundary. The reference peatland has a 2.4% accuracy. However, we observed deviations ranging from −13 to 9% in other scenarios. This can be attributed to the fact that nodes at the edges of meeting meshlines are considered for flux calculations across both meshlines.
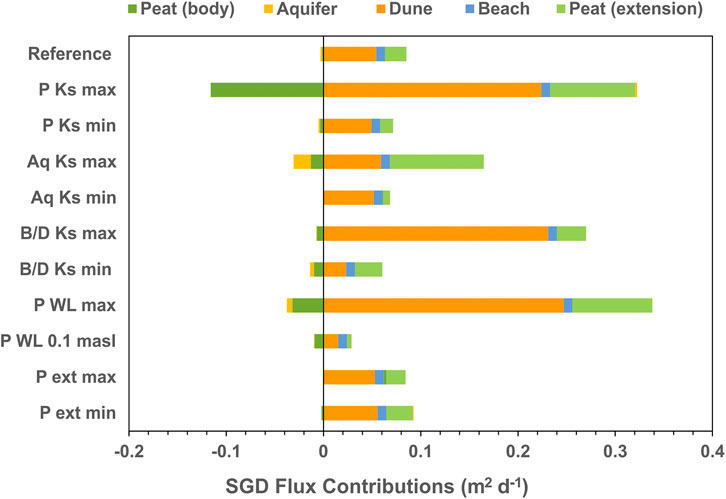
FIGURE 6. Contributions from the dune, beach, peat body, peat extension, and aquifer sands to submarine groundwater discharge for selected scenarios. Positive fluxes are inputs while negative fluxes represent output of water from the beach sands. In P Ks max scenario, a large volume of water infiltrated the dune dike and then, water flowed down to the peat body.
In the reference peatland, most of the terrestrial SGD comes from the dune dike (0.054 m2 d−1; 63%), recharged by precipitation (1/3) and infiltrating peatland surface waters (2/3), and the beach (0.0092 m2 d−1; 11%). The remaining part of the SGD originates from the aquifer, but flows upward through the thin, buried peat extension layer under the seafloor (0.022 m2 d−1; 26%). No discharge was observed from the main peat body, or directly from the aquifer into the marine sediments.
In the scenarios, the relative contributions of dune, beach, and aquifer to the terrestrial SGD vary as a function of soil properties and hydraulic gradient: With a high aquifer Ks, the aquifer (via the peat extension) gains in importance, while a low peatland water level or low Ks of peat or aquifer enhance the contribution from the dune. The relative contributions only increased/decreased by 3% for the peat extension scenarios compared to the reference scenario. The share of the dune and beach varies from 41 to 89%.
Discussion
SGD Flux From Coastal Peatland
The upscaled total terrestrial SGD for the entire 3-km coastline of the Hütelmoor is 240 m3 d−1. Lower and upper limits of estimates based on Ks uncertainty are 114 and 596 m3 d−1, respectively. The results are slightly higher than previous terrestrial SGD estimates from the same study site with 15–164 m3 d−1 (Miegel et al., 2016) and 180 m3 d−1 (Ibenthal, 2020), which were calculated using water balance equations of the contribution of peat and aquifer sands (Miegel et al., 2016) and MODFLOW 3D numerical simulations including the dune sands (Ibenthal, 2020).
Comparing with other wetland environments, our average seepage rate of 0.33 cm d−1 is comparable in magnitude to a mudflat in China (Qu et al., 2017) and lower estimates of a tide-dominated coastal wetland in Taiwan (Hsu et al., 2020) (Table 4). However, it is expectedly lower than seepage rates from crab burrows-influenced tropical mangrove systems in Australia due to preferential flow pathways (Tait et al., 2017) and from a subtropical estuarine creek adjacent to a dune-wetland system (Sadat-Noori et al., 2015). The seepage rate near the shore (1.05 cm d−1) is comparable to rates observed in sandy beaches (Kotwicki et al., 2014; Qu et al., 2017) and a sandy pockmark (Virtasalo et al., 2019) in the Baltic Sea. This result may be explained by the fact that terrestrial SGD could also be generated from small dune dike systems with additional inputs from infiltrating peatland surface waters. However, it should be noted that our average seepage rate represents terrestrial SGD only while seepage rate near the shore has contributions from recirculated SGD. Fresh SGD contributes 0.01–10% of surface water runoff (Church, 1996), with recent global estimates of 0.6% (Luijendijk et al., 2020). In tide-dominated systems, a conservative estimate of fresh SGD contribution is ∼5% of the total flux (Li et al., 2009; Santos et al., 2009:; Hsu et al., 2020). Total SGD flux estimates could thus be larger with possible large inputs from recirculated SGD.
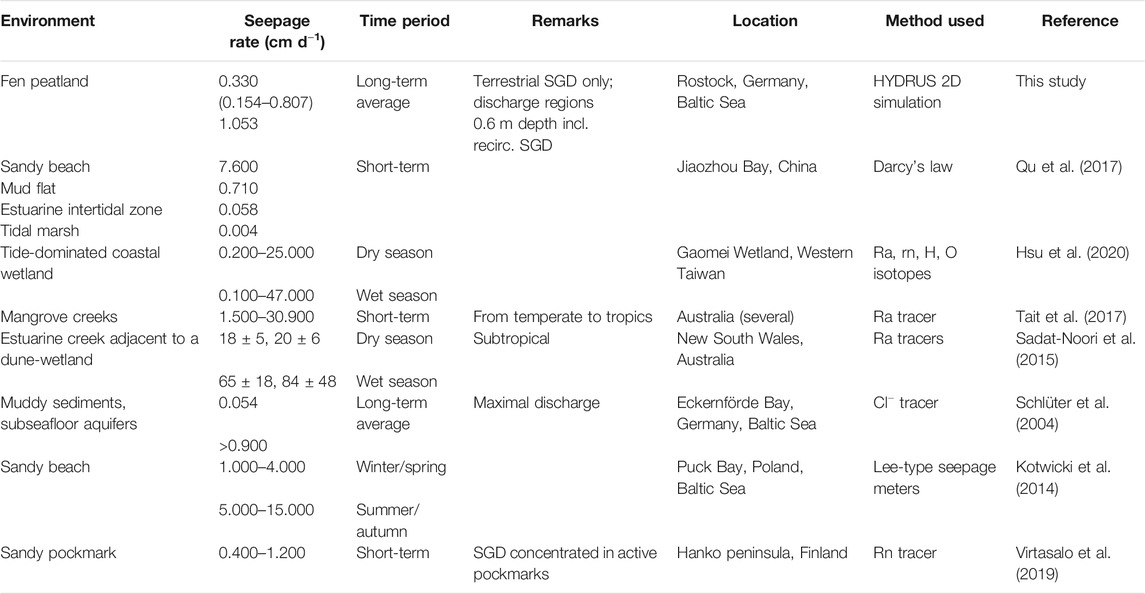
TABLE 4. Seepage rates of SGD studies from wetland environments and different locations in the Baltic Sea.
Factors Controlling SGD From Coastal Peatlands
Importance of Peat Extension Layer to SGD Flow
The prevailing two-discharge region flow pattern in the reference peatland is due to the strong impact of the peat layer extending underneath the beach. In sandy lakeshores (McBride and Pfannkuch, 1975; Fukuo and Kaihotsu, 1988) and coastal areas (Bokuniewicz, 1992), the concentration of terrestrial SGD at the interface of land and water body is expected with groundwater discharge rapidly decreasing as the distance from the shore increases. The distribution is affected, though, by aquifer heterogeneity and sediment hydraulic conductivity, which may vary over several orders of magnitude (Taniguchi et al., 2003). In this study, the occurrence of a lower SGD region is due to the barrier function of the peat extension layer, interrupting the flow field because of its hydraulic properties. This parallels offshore SGD originating from aquifers that have been confined by a low permeability material (Kooi and Groen, 2001; Post et al., 2013), which can extend several kilometers into the sea. In Sweden and Finland, groundwater has been observed to discharge from submarine terraces in siltier, more permeable portions of glacial clay at water depths of ∼12 m (Jakobsson et al., 2020).
The barrier function of the peat layer interplays with its Ks, Ks anisotropy, and geological stratifications. It diminishes with larger peat Ks and Ksv/Ksh anisotropy values but is magnified with increasing peat thickness and longer extension of the peat into the sea. In a similar way that the peat extension and the main peat body restrict groundwater discharge to the sea, our model shows that the low-conductivity peat layer also hinders seawater intrusion towards the peatland. Scenarios with higher sea level did not result in the formation of a seawater wedge but rather in landward discharge behind the dune dike (Supplementary Figure 2B). This pattern may be unique to ponded coastal peatlands and muddy shorelines. Thus, the peat may serve as a barrier for both groundwater discharge and seawater intrusion.
In terms of SGD magnitude, however, the peat extension layer is not important. Compared to the reference peatland, the SGD flux only decreased by 2% when the peat was extended to the left border of the modelling domain and only increased by 3% when it ended under the shoreline. Nonetheless, more peat material extending into the sea in the groundwater-seawater mixing zone may still be significant for material transport and biogeochemical processes (see below).
Ks and Hydraulic Gradient
While the peat extension layer determines the discharge patterns, the hydraulic conductivity and hydraulic gradient are the main controls of the magnitude of SGD from coastal peatlands. The peat Ks influences the infiltration of surface waters into the peat and subsequent SGD generation. A low peat Ks reduces the infiltration of surface water into the peat and limits the contribution of peat and underlying aquifer to SGD. However, it might prolong ponding under transient conditions, enabling infiltration into the dune dike base that eventually flows out as terrestrial SGD. For the aquifer sands Ks, a low Ks restricts discharge from the aquifer, resulting in a single SGD region related to the dune. Meanwhile, the beach/dune sands Ks only affects the SGD flux magnitude and not the location. The high positive correlation of the beach/dune Ks with SGD (Figure 7) emphasizes the role of the coastal sediments for SGD generation in coastal peatlands.
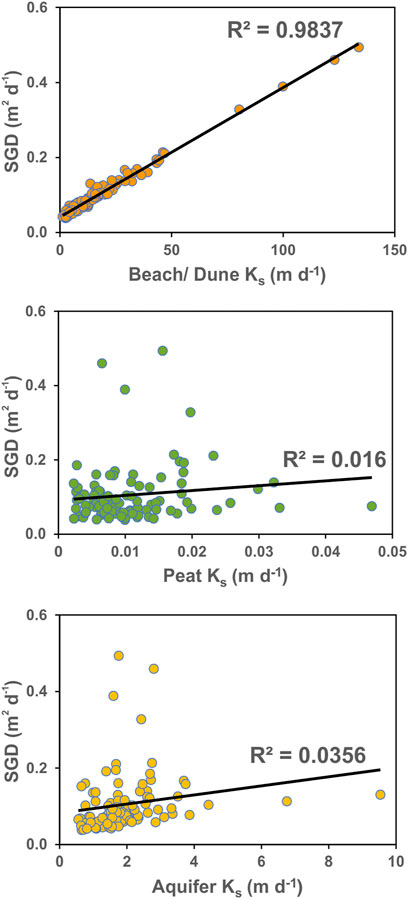
FIGURE 7. Linear regressions of SGD and material Ks, Ks data generated for uncertainty analysis. Beach/dune sands Ks is highly correlated with SGD.
The peat and the underlying aquifer sands’ properties thus affect not only groundwater flow in the peatland (Quillet et al., 2017), but also SGD magnitude and location. Large hydraulic conductivities are typically found in pristine peat, while lower values are characteristic of degraded peatlands (Lennartz and Liu, 2019) and are related to a decrease in macroporosity due to disintegration of plant materials (Liu et al., 2016). Peat can have macropores; a single-large pore space may take up 94–99% (Rezanezhad et al., 2016), which may dominate water and solute transport (Baird and Gaffney, 2000). In marine sediments, bioturbator bivalves such as Mya arenaria, found in most of the Baltic Sea (Forster and Zettler, 2004), may distinctly increase Ks. A direct correlation between hydraulic conductivity and SGD rates has been observed in a study of four different types of wetlands in China (Qu et al., 2017). Moreover, it has been shown that the bottleneck for coastal groundwater discharge is the flow capacity, which is a function of permeability, thickness of permeable units, and topographic gradient (Luijendijk et al., 2020).
The peatland’s water level is the most sensitive factor determining the magnitude of terrestrial SGD (Figure 5). While Luijendijk et al. (2020) assumed the topographic gradient as the maximum possible hydraulic gradient, the average hydraulic gradient is larger than the topographic one at our study site. This is due to the ponded peatland surface waters maintained after rewetting by a groundsill, combined with the low peat Ks and the dune dike. We can assume that the resulting hydraulic gradient is similar to pristine conditions since subsidence and peat degradation after drainage lowered surface elevation of up to 1 m at the study site. However, it is expected that sea level rise will reduce the hydraulic gradient in the future. According scenarios have shown that the water flow direction even reverses and is directed towards the peatland inside the dune body if the sea level rises above the average peatland water level, while simultaneously SGD occurs underneath (Supplementary Figure 2B). This results in a decreased SGD as a function of reduced hydraulic gradients.
The data presented here is from steady-state conditions depicting long-term averages, neglecting temporal dynamics of the hydraulic gradient. In reality, both seasonal and short-term variations occur (Ibenthal 2020). For example, larger gradients in winter due to rising ground- and surface water levels will induce higher SGD rates than in summer when evaporation is high (Miegel et al., 2016). In the short term, storms and changing seawater levels cause a high variability of hydraulic gradients. These variations will not affect the average SGD but will have an important impact on solute transport in the transition zone between land and sea.
Other Factors
The remaining factors studied in this work have little impact on SGD flow and magnitude. Anisotropy of Ks, peat and aquifer thickness, and peat elevation have a relatively small impact compared to Ks and hydraulic gradient. Large peat Ksh/Ksv may only slightly enhance water flow into the peat extension but not strong enough to cancel its barrier function. Our findings are consistent with Beckwith et al. (2003), who showed that anisotropy has a smaller influence on groundwater flow patterns in peat than geological heterogeneity. Anisotropy also appeared to have a minor effect on phosphate transport than peat soil heterogeneity (Wang et al., 2020). The anisotropic angle was shown to be highly significant for determining the landward extent of seawater in a high hydraulic conductivity homogenous aquifer (Costall et al., 2020). However, such saltwater wedge has not been observed at the study site neither in drillings nor in our simulations. Material thickness can - depending on its inherent Ks—impact SGD positively or negatively (Smith and Nield, 2003).
The impact of peat and aquifer thickness on flow and magnitude in our system is small compared to Ks and hydraulic gradient. However, we only simulated peat and aquifer sands thickness of 0.3—5.0 m and 1.0—5.0 m, respectively, typical of German coastal peatlands. In other peatlands, peat (Habicht et al., 2017) and aquifer sands (Vilumaa et al., 2017) might be thicker and may have a higher impact on SGD. Scenarios of higher peat elevation, expected in less degraded peatlands, resulted in slightly decreasing SGD because less surface water is available that can freely infiltrate into the dune dike base. However, it is also expected that less degraded peatlands will have larger Ks and thus will allow a larger volume of groundwater flow. To illustrate, a simulation of 0.4 masl peat elevation and Ks of 17.4 m d−1 resulted in 0.215 m2 d−1 SGD flux, similar to the flux calculated from the scenario with the same peat Ks value.
Dike height and the seafloor depth do not have any distinct impact on neither SGD magnitude nor location. With a shallower seafloor, only the water depth at which SGD occurs decreases, with implications for the mixing into the water column. These results may be explained by the fact that the source of terrestrial SGD remains unaffected by the changes.
Model Limitations
This is the first time that HYDRUS-2D was used to determine SGD from a coastal peatland system, and it was able to address our objectives. The model has performed reasonably well—all scenarios have less than 1% relative mass balance error, the prescribed rate for water flow simulations. The lowest and highest relative errors were 0.01 and 0.89%, respectively.
A drawback of the model for applications at the coast is that it does not account for density-driven flow. We assume, however, that density effects can be neglected at our study site due to small density difference between the Baltic Sea and the peatland’s groundwater. While the salinity of the Baltic Sea is comparably low near the study site with 11.4 psu (IOW(Leibniz Institute for Baltic Sea Research Warnemünde), 2020), high electrical conductivities and chloride concentrations have been recorded in the groundwater of the peatland (Ibenthal, 2020). They are rather homogeneously distributed in the peat and the underlying aquifer and are attributed to former floodings of the peatland with seawater, as has been proven with sulfur isotopes (Koebsch et al., 2019). The groundwater in the aquifer of the considered transect is decades old, as has been revealed by tritium-helium dating (Ibenthal, 2020). The densities of water samples collected between 2019 and 2020 from the groundwater peatland (n = 32) and dune (n = 3), from surface water (n = 15) and Baltic Sea (n = 5) were calculated for the long-term average temperature of 9.7°C, following Millero and Poisson (1981). Likewise, density from salinity measurements by IOW (n = 169; 1996–2018) was also calculated (Supplementary Table 2). A density difference of 0.006 g cm−3 between Baltic Sea waters (IOW(Leibniz Institute for Baltic Sea Research Warnemünde), 2020) and groundwater in the Hütelmoor is more than four times lower than the value used by Robinson et al. (2007) to simulate variable-density flow experiments. As such, less convective mixing is expected due to the lower density difference of groundwater and seawater.
The effect of density on the sea level pressure head and SGD was tested by calculating the equivalent freshwater head for a water depth of 1.0 m, where most of the SGD comes out. The calculated head difference between the reference scenario and the density-corrected head is 0.01 m, with discharge flux decreasing by only 0.002 m2 d−1 (2%). We, therefore, assume that the model results are reliable despite neglecting density effects.
Furthermore, tides were not accounted for by the model, as they are assumed to be minimal at the study site. The Baltic Sea is an enclosed basin with a maximal tidal height of 23 cm (100-year period estimate) for the whole region and 6 cm in the nearby Danish straight (Medvedev et al., 2016).
Proposed Mechanisms for SGD Occurrence
Based on our simulations, it can be suggested that terrestrial SGD occurs more in peatlands that are 1) rewetted and diked with low peat Ks and 2) lowly-degraded peatlands with higher Ks and elevation. Future investigations on matter fluxes are thus recommended to focus on these environments.
Most coastal peatlands along the Baltic Sea are assumed to have low peat hydraulic conductivity as a result of draining and diking activities arising from agricultural use and coastal protection measures. Many of these peatlands may be rewetted in the future like the Hütelmoor since the restoration of peatlands by increasing the height of the water table is a cost-effective measure to cut down on greenhouse gas emissions (Leifeld and Menichetti, 2018). Low Ks and diking result in less infiltration of surface waters and ponding in the peatland. This water infiltrates the dune and eventually flows out as SGD. One interesting finding of this study is that most waters that come out as SGD are from the ponded surface waters.
Conversely, we can also expect SGD in peatlands that have higher elevation and are less degraded. In this setting, the peatlands have higher Ks allowing more water to infiltrate the ground, flowing into the dune and out of the seafloor as SGD. The peat extension, likely compacted due to pressure, may still hinder upflow from the aquifer sands. However, the upper peat layer will allow more groundwater to flow to the beach. Less degraded peat will also have a higher percentage of macroporosity, leading to preferential flow pathways. These observations point out the importance of land use in the past and land management activities in the future.
In both mechanisms, we have demonstrated that even a narrow dune can be important for groundwater recharge and subsequent SGD generation, as reported earlier for larger dune belts (Stieglitz, 2005; Röper et al., 2012). These results have consequences not only for the quantity but also for the quality of the discharged water, emphasizing the role of the dune and beach in total SGD flux. Taken together, our findings suggest that the dune is important for recharge and infiltration of peatland surface waters.
Implications for Carbon and Material Transport
It is now well-known that groundwater often has higher concentrations of carbon and materials (Moore, 2010) than its receiving body of water where it discharges. Over the last few years, organic-rich subterranean estuaries have been shown to have higher concentrations of remineralized components of organic matter, including nutrients, DOC, DIC, DOM, trace elements, reduced species such as ammonium and iron (II), and lower pH (Taniguchi et al., 2019). At our study site, DOC concentrations measured in groundwater in peat and aquifer amount to 48–490 mg C L−1 and 12–99 mg C L−1, respectively, and to 38–380 mg C L−1 in the peatland’s surface water. Our values are much higher than the previously mentioned DOC average from SGD (Szymczycha et al., 2014). While DOC may undergo several biogeochemical transformations before it is discharged to the sea, the high concentrations in peatland surface and groundwaters offer a glimpse of potential large DOC inputs via SGD. In addition, the absence of large rivers in the southern Baltic Sea could increase the importance of SGD as pathways for water and material transport.
Our study showed that a peat layer extending to the sea, and potentially cropping out, hardly influences the quantity of water fluxes. However, the peat could still be important biogeochemically. Peat from the study site has been shown to release DOC in contact with saline water (Gosch et al., 2018) and low-saline groundwater (Kreuzburg et al., 2020). Exposure of peat to water with changing salinity can promote the release of DOC and remineralized components such as CO2 and DIC (Kreuzburg et al., 2020). As such, peat deposits along coastal zones could be potential hot spots of increased release of these materials and may be important to the release of climate-relevant gases (Kreuzburg et al., 2020). Moreover, additional geological complexities such as marine sediment bulldozing by bivalves and other groups in marine environments (Santos et al., 2012) and peat degradation and preferential solute transport on land (Liu et al., 2017) can enhance material export from coastal peatlands. Given the knowledge gaps in material transport and its abundance in the Baltic Sea, coastal peatlands warrant further scientific investigation to address their potential as an overlooked source of water and materials for the Baltic Sea via the SGD pathway, characterized by low hydraulic conductivity and low hydraulic gradient.
Conclusion
Coastal peatlands are widespread along the German Baltic Sea coast. They have often been drained and diked but are increasingly rewetted. This study aimed at assessing whether terrestrial submarine groundwater discharge is likely to occur from such a low-lying, low hydraulic conductivity coastal peatland using 2D numerical modelling of water flow, and at evaluating the factors that determine the magnitude and pattern of SGD from coastal peatlands presuming a range of realistic properties. Our simulations show that terrestrial SGD can originate from a low Ks and low gradient coastal peatland, although the SGD flux at our study site is in the lower range of other wetland environments and Baltic Sea SGD sites. The terrestrial SGD is sourced primarily from the dune dike, recharged from the ponded peatland surface waters and precipitation, and to a lesser extent from the shallow aquifer underlying the peat. As the peatland’s surface and groundwater are typically enriched in remineralized organic matter, SGD is a potential source of these materials with consequences for marine geochemical budgets and ecosystems, and matter fluxes need to be quantified.
A specific feature of coastal peatlands is that the peat layer may continue underneath the sea. Scenario simulations reveal that this extending peat layer has a barrier function and mainly determines the location of SGD in interplay with Ks and geological stratification. It is thus assumed to play a crucial role in how the marine ecosystem is affected locally. However, it has little effect on the SGD magnitude, which is mainly controlled by the hydraulic gradient and Ks, especially of beach/dune and peat. The high positive correlation between beach/dune Ks and SGD underlines the importance of even a small dune belt for SGD generation.
We conclude that SGD is most probable from those coastal peatlands with 1) high water levels, 2) large Ks and/or 3) a dune dike or belt, irrespective of the specific geologic setup or topography. This is assumed to be the case for rare, lowly-degraded peatlands, typically characterized by high permeability and water level, and for rewetted (formerly drained) peatlands, where the Ks of the degraded peat is small, but a high water level is maintained artificially and ponded water constitutes a unique water source for SGD. While current efforts of rewetting coastal peatlands are thus expected to increase their contribution to SGD, the expected sea level rise will counteract this development in the future.
Data Availability Statement
The raw data supporting the conclusions of this article will be made available by the authors, without undue reservation.
Author Contributions
ER gathered data, conducted the numerical modeling, analyzed the data, wrote and revised the article. BL conceived the topic and reviewed the article. MI gathered data and reviewed the article. MJ conceived the topic, gathered data, contributed to development of the model set up and data analysis, wrote and revised the article.
Funding
This study was conducted within the framework of the Research Training Group “Baltic TRANSCOAST” funded by the DFG (Deutsche Forschungsgemeinschaft) under grant number GRK 2000 (www.baltic-transcoast.uni-rostock.de/). This is Baltic TRANSCOAST publication no. GRK 2000/0048. We acknowledge financial support by the DFG and the University of Rostock within the funding programme Open Access Publishing.
Conflict of Interest
The authors declare that the research was conducted in the absence of any commercial or financial relationships that could be construed as a potential conflict of interest.
Publisher’s Note
All claims expressed in this article are solely those of the authors and do not necessarily represent those of their affiliated organizations, or those of the publisher, the editors and the reviewers. Any product that may be evaluated in this article, or claim that may be made by its manufacturer, is not guaranteed or endorsed by the publisher.
Acknowledgments
We thank the Stadtforstamt Rostock for their support in the conduct of this research in the Naturschutzgebiet Heiligensee und Hütelmoor. We also thank editor and the reviewers for their valuable inputs which greatly improved this article. The authors would also like to thank Haojie Liu for his help in identifying the hydraulic properties of the peat soils.
Supplementary Material
The Supplementary Material for this article can be found online at: https://www.frontiersin.org/articles/10.3389/feart.2021.665802/full#supplementary-material.
References
BACC II Author Team (2015). “Second Assessment of Climate Change for the Baltic Sea Basin. Regional Climate Studies,” in Second Assessment of Climate Change for the Baltic Sea Basin. Regional Climate Studies Geesthacht, Germany: Springer, Cham. doi:10.1007/978-3-319-16006-1
Baird, A. J. (1997). Field Estimation of Macropore Functioning and Surface Hydraulic Conductivity in a Fen Peat. Hydrol. Process. 11, 287–295. doi:10.1002/(sici)1099-1085(19970315)11:3<287::aid-hyp443>3.0.co;2-l
Baird, A. J., and Gaffney, S. W. (2000). Solute Movement in Drained Fen Peat: A Field Tracer Study in a Somerset (UK) Wetland. Hydrol. Process. 14 (14), 2489–2503. doi:10.1002/1099-1085(20001015)14:14<2489::aid-hyp110>3.0.co;2-q
Beckwith, C. W., Baird, A. J., and Heathwaite, A. L. (2003). Anisotropy and Depth-Related Heterogeneity of Hydraulic Conductivity in a Bog Peat. II: Modelling the Effects on Groundwater Flow. Hydrol. Process. 17, 103–113. doi:10.1002/hyp.1117
Beyer, W. (1964). Zur Bestimmung der Wasserdurchlassigkeit von Kieson und Sanduen aus der Kornverteilung, Wasserwirt. Wassertech 14, 165–169.
Bokuniewicz, H. J. (1992). Analytical Descriptions of Subaqueous Groundwater Seepage. Estuaries 15 (4), 458–464. doi:10.2307/1352390
Bollmann, M., Bosch, T., Colijn, F., Ebinghaus, R., Froese, R., Güssow, K., et al. (2010). World Ocean Review: Living with the Oceans. Hamburg: Maribus GmbH.
Burnett, W. C., Aggarwal, P. K., Aureli, A., Bokuniewicz, H., Cable, J. E., Charette, M. A., et al. (2006). Quantifying Submarine Groundwater Discharge in the Coastal Zone via Multiple Methods. Sci. Total Environ. 367, 498–543. doi:10.1016/j.scitotenv.2006.05.009
Burnett, W. C., Bokuniewicz, H., Huettel, M., Moore, W. S., and Taniguchi, M. (2003). Groundwater and Pore Water Inputs to the Coastal Zone. Biogeochemistry 66, 3–33. doi:10.1023/b:biog.0000006066.21240.53
Church, T. M. (1996). An Underground Route for the Water Cycle. Nature 380 (6575), 579–580. doi:10.1038/380579a0
Costall, A. R., Harris, B. D., Teo, B., Schaa, R., Wagner, F. M., and Pigois, J. P. (2020). Groundwater Throughflow and Seawater Intrusion in High Quality Coastal Aquifers. Sci. Rep. 10 (1), 1–33. doi:10.1038/s41598-020-75736-9
Dettmann, U., Bechtold, M., Frahm, E., and Tiemeyer, B. (2014). On the Applicability of Unimodal and Bimodal Van Genuchten-Mualem Based Models to Peat and Other Organic Soils under Evaporation Conditions. J. Hydrol. 515, 103–115. doi:10.1016/j.jhydrol.2014.04.047
DWD(Deustcher Wetterdienst) (2020). Warnemünde. Available at: https://cdc.dwd.de/portal/201912031600/mapview (Accessed July 20, 2020)
Ferone, J. M., and Devito, K. J. (2004). Shallow Groundwater-Surface Water Interactions in Pond-Peatland Complexes along a Boreal Plains Topographic Gradient. J. Hydrol. 292 (1–4), 75–95. doi:10.1016/j.jhydrol.2003.12.032
Forster, S., and Zettler, M. L. (2004). The Capacity of the Filter-Feeding Bivalve Mya Arenaria L. To Affect Water Transport in sandy Beds. Mar. Biol. 144 (6), 1183–1189. doi:10.1007/s00227-003-1278-2
Fukuo, Y., and Kaihotsu, I. (1988). A Theoretical Analysis of Seepage Flow of the Confined Groundwater into the lake Bottom with a Gentle Slope. Water Resour. Res. 24 (11), 1949–1953. doi:10.1029/wr024i011p01949
Gosch, L., Janssen, M., and Lennartz, B. (2018). Impact of the Water Salinity on the Hydraulic Conductivity of Fen Peat. Hydrological Process. 32, 1214–1222. doi:10.1002/hyp.11478
Gosch, L., Townsend, H., Kreuzburg, M., Janssen, M., Rezanezhad, F., and Lennartz, B. (2019). Sulfate Mobility in Fen Peat and its Impact on the Release of Solutes. Front. Environ. Sci. 7, 189. doi:10.3389/fenvs.2019.00189
Grinsted, A., Jevrejeva, S., Riva, R., and Dahl-Jensen, D. (2015). Sea Level Rise Projections for Northern Europe under RCP8.5. Clim. Res. 64 (1), 15–23. doi:10.3354/cr01309
Habicht, H.-L., Rosentau, A., Jõeleht, A., Heinsalu, A., Kriiska, A., Kohv, M., et al. (2017). GIS-based Multiproxy Coastline Reconstruction of the Eastern Gulf of Riga, Baltic Sea, during the Stone Age. Boreas 46, 83–99. doi:10.1111/bor.12157
Hsu, F.-H., Su, C.-C., Wang, P.-L., and Lin, I.-T. (2020). Temporal Variations of Submarine Groundwater Discharge into a Tide-Dominated Coastal Wetland (Gaomei Wetland, Western Taiwan) Indicated by Radon and Radium Isotopes. Water 12, 1806. doi:10.3390/w12061806
Ibenthal, M. (2020). Marine and Terrestrial Influence on Submarine Groundwater Discharge in Coastal Waters Connected to a Peatland. E dissertation. Göttingen, Germany: Georg-August-Universität GöttingenAvaialble at: https://ediss.uni-goettingen.de/handle/21.11130/00-1735-0000-0005-13C2-A.
Idczak, J., Brodecka-Goluch, A., Łukawska-Matuszewska, K., Graca, B., Gorska, N., Klusek, Z., et al. (2020). A Geophysical, Geochemical and Microbiological Study of a Newly Discovered Pockmark with Active Gas Seepage and Submarine Groundwater Discharge (MET1-BH, central Gulf of Gdańsk, Southern Baltic Sea). Sci. Total Environ. 742, 140306. doi:10.1016/j.scitotenv.2020.140306
IOW(Leibniz Institute for Baltic Sea Research Warnemünde) (2020). Environmental Long-Term Data Programme, Station TFO5 - Oceanographic Database Search with Interactive Navigation - ODIN2. Avaialble at: https://odin2.io-warnemuende.de/#/(Accessed December 12, 2020).
Jakobsson, M., O'Regan, M., Mörth, C.-M., Stranne, C., Weidner, E., Hansson, J., et al. (2020). Potential Links between Baltic Sea Submarine Terraces and Groundwater Seeping. Earth Surf. Dynam. 8, 1–15. doi:10.5194/esurf-8-1-2020
Jurasinski, G., Janssen, M., Voss, M., Böttcher, M. E., Brede, M., Burchard, H., et al. (2018). Understanding the Coastal Ecocline: Assessing Sea-Land Interactions at Non-tidal, Low-Lying Coasts through Interdisciplinary Research. Front. Mar. Sci. 5, 342. doi:10.3389/fmars.2018.00342
Koebsch, F., Winkel, M., Liebner, S., Liu, B., Westphal, J., Schmiedinger, I., et al. (2019). Sulfate Deprivation Triggers High Methane Production in a Disturbed and Rewetted Coastal Peatland. Biogeosciences 16, 1937–1953. doi:10.5194/bg-16-1937-2019
Kooi, H., and Groen, J. (2001). Offshore Continuation of Coastal Groundwater Systems; Predictions Using Sharp-Interface Approximations and Variable-Density Flow Modelling. J. Hydrol. 246, 19–35. doi:10.1016/s0022-1694(01)00354-7
Kotwicki, L., Grzelak, K., Czub, M., Dellwig, O., Gentz, T., Szymczycha, B., et al. (2014). Submarine Groundwater Discharge to the Baltic Coastal Zone: Impacts on the Meiofaunal Community. J. Mar. Syst. 129, 118–126. doi:10.1016/j.jmarsys.2013.06.009
Kreuzburg, M., Ibenthal, M., Janssen, M., Rehder, G., Voss, M., Naumann, M., et al. (2018). Sub-marine Continuation of Peat Deposits from a Coastal Peatland in the Southern Baltic Sea and its Holocene Development. Front. Earth Sci. 6, 103. doi:10.3389/feart.2018.00103
Kreuzburg, M., Rezanezhad, F., Milojevic, T., Voss, M., Gosch, L., Liebner, S., et al. (2020). Carbon Release and Transformation from Coastal Peat Deposits Controlled by Submarine Groundwater Discharge: a Column experiment Study. Limnol. Oceanogr. 65 (5), 1116–1135. doi:10.1002/lno.11438
Leifeld, J., and Menichetti, L. (2018). The Underappreciated Potential of Peatlands in Global Climate Change Mitigation Strategies. Nat. Commun. 9, 1071. doi:10.1038/s41467-018-03406-6
Lennartz, B., and Liu, H. (2019). Hydraulic Functions of Peat Soils and Ecosystem Service. Front. Environ. Sci. 7, 92. doi:10.3389/fenvs.2019.00092
Li, X., Hu, B. X., Burnett, W. C., Santos, I. R., and Chanton, J. P. (2009). Submarine Ground Water Discharge Driven by Tidal Pumping in a Heterogeneous Aquifer. Ground Water. 47 (4), 558–568. doi:10.1111/j.1745-6584.2009.00563.x
Liu, H., Forsmann, D. M., Kjaergaard, C., Saki, H., and Lennartz, B. (2017). Solute Transport Properties of Fen Peat Differing in Organic Matter Content. J. Environ. Qual. 46 (5), 1106–1113. doi:10.2134/jeq2017.01.0031
Liu, H., Janssen, M., and Lennartz, B. (2016). Changes in Flow and Transport Patterns in Fen Peat Following Soil Degradation. Eur. J. Soil Sci. 67 (6), 763–772. doi:10.1111/ejss.12380
Liu, H., and Lennartz, B. (2019). Hydraulic Properties of Peat Soils along a Bulk Density Gradient-A Meta Study. Hydrological Process. 33, 101–114. doi:10.1002/hyp.13314
Luijendijk, E., Gleeson, T., and Moosdorf, N. (2020). Fresh Groundwater Discharge Insignificant for the World's Oceans but Important for Coastal Ecosystems. Nat. Commun. 11, 126. doi:10.1038/s41467-020-15064-8
McBride, M. S., and Pfannkuch, H. O. (1975). The Distribution of Seepage within Lakebeds. J. Res. US Geol. Surv. 3 (5), 505–512.
Medvedev, I. P., Rabinovich, A. B., and Kulikov, E. A. (2016). Tides in Three Enclosed Basins: The Baltic, Black, and Caspian Seas. Front. Mar. Sci. 3, 46. doi:10.3389/fmars.2016.00046
Miegel, K., Graeff, T., Selle, B., Salzmann, T., Franck, C., and Bronstert, A. (2016). Investigation of a Renatured Fen on the Baltic Sea Coast of Mecklenburg - Part I: System Description and Basic Hydrological Characterisation. Hydrol. Wasserbewirtscahftung. 60 (4), 242–258.
Millero, F. J., and Poisson, A. (1981). International One-Atmosphere Equation of State of Seawater. Deep Sea Res. A. Oceanographic Res. Pap. 28 (6), 625–629. doi:10.1016/0198-0149(81)90122-9
Mohawesh, O., Janssen, M., Maaitah, O., and Lennartz, B. (2017). Assessment the Effect of Homogenized Soil on Soil Hydraulic Properties and Soil Water Transport. Eurasian Soil Sci. 50 (9), 1077–1085. doi:10.1134/s1064229317090046
Moore, W. S. (2010). The Effect of Submarine Groundwater Discharge on the Ocean. Annu. Rev. Mar. Sci. 2, 59–88. doi:10.1146/annurev-marine-120308-081019
Peña-Haro, S., Pulido-Velazquez, M., and Llopis-Albert, C. (2011). Stochastic Hydro-Economic Modeling for Optimal Management of Agricultural Groundwater Nitrate Pollution under Hydraulic Conductivity Uncertainty. Environ. Model. Softw. 26, 999–1008. doi:10.1016/j.envsoft.2011.02.010
Post, V. E. A., Groen, J., Kooi, H., Person, M., Ge, S., and Edmunds, W. M. (2013). Offshore Fresh Groundwater Reserves as a Global Phenomenon. Nature 504, 71–78. doi:10.1038/nature12858
Qu, W., Li, H., Huang, H., Zheng, C., Wang, C., Wang, X., et al. (2017). Seawater-groundwater Exchange and Nutrients Carried by Submarine Groundwater Discharge in Different Types of Wetlands at Jiaozhou Bay, China. J. Hydrol. 555, 185–197. doi:10.1016/j.jhydrol.2017.10.014
Quillet, A., Larocque, M., Pellerin, S., Cloutier, V., Ferlatte, M., Paniconi, C., et al. (2017). The Role of Hydrogeological Setting in Two Canadian Peatlands Investigated through 2D Steady-State Groundwater Flow Modelling. Hydrological Sci. J. 62 (15), 2541–2557. doi:10.1080/02626667.2017.1391387
Rezanezhad, F., Price, J. S., Quinton, W. L., Lennartz, B., Milojevic, T., and Van Cappellen, P. (2016). Structure of Peat Soils and Implications for Water Storage, Flow and Solute Transport: A Review Update for Geochemists. Chem. Geology. 429, 75–84. doi:10.1016/j.chemgeo.2016.03.010
Robinson, C. E., Xin, P., Santos, I. R., Charette, M. A., Li, L., and Barry, D. A. (2018). Groundwater Dynamics in Subterranean Estuaries of Coastal Unconfined Aquifers: Controls on Submarine Groundwater Discharge and Chemical Inputs to the Ocean. Adv. Water Resour. 115, 315–331. doi:10.1016/j.advwatres.2017.10.041
Robinson, C., Li, L., and Barry, D. A. (2007). Effect of Tidal Forcing on a Subterranean Estuary. Adv. Water Resour. 30, 851–865. doi:10.1016/j.advwatres.2006.07.006
Röper, T., Kröger, K. F., Meyer, H., Sültenfuss, J., Greskowiak, J., and Massmann, G. (2012). Groundwater Ages, Recharge Conditions and Hydrochemical Evolution of a Barrier Island Freshwater Lens (Spiekeroog, Northern Germany). J. Hydrol. 454-455, 173–186. doi:10.1016/j.jhydrol.2012.06.011
Sadat-Noori, M., Santos, I. R., Sanders, C. J., Sanders, L. M., and Maher, D. T. (2015). Groundwater Discharge into an Estuary Using Spatially Distributed Radon Time Series and Radium Isotopes. J. Hydrol. 528, 703–719. doi:10.1016/j.jhydrol.2015.06.056
Santos, I. R., Burnett, W. C., Chanton, J., Dimova, N., and Peterson, R. N. (2009). Land or Ocean?: Assessing the Driving Forces of Submarine Groundwater Discharge at a Coastal Site in the Gulf of Mexico. J. Geophys. Res. 114, C04012. doi:10.1029/2008JC005038
Santos, I. R., Eyre, B. D., and Huettel, M. (2012). The Driving Forces of Porewater and Groundwater Flow in Permeable Coastal Sediments: A Review. Estuarine, Coastal Shelf Sci. 98, 1–15. doi:10.1016/j.ecss.2011.10.024
Schaap, M. G., Leij, F. J., and van Genuchten, M. T. (2001). Rosetta : a Computer Program for Estimating Soil Hydraulic Parameters with Hierarchical Pedotransfer Functions. J. Hydrol. 251, 163–176. doi:10.1016/s0022-1694(01)00466-8
Schlüter, M., Sauter, E. J., Andersen, C. E., Dahlgaard, H., and Dando, P. R. (2004). Spatial Distribution and Budget for Submarine Groundwater Discharge in Eckernförde Bay (Western Baltic Sea). Limnol. Oceanogr. 49 (1), 157–167. doi:10.4319/lo.2004.49.1.0157
Šimůnek, J., M., van Genuchten, T., and Šejna, M. (2018). The HYDRUS Software Package for Simulating Two- and Three Dimensional Movement of Water, Heat, and Multiple Solutes in Variably- Saturated Porous Media, Technical Manual (Version 3). Prague, Czech Republic: PC Progress.
Smith, A. J., and Nield, S. P. (2003). Groundwater Discharge from the Superficial Aquifer into Cockburn Sound Western Australia: Estimation by Inshore Water Balance Biogeochemistry 66, 125–144.
Stieglitz, T. (2005). Submarine Groundwater Discharge into the Near-Shore Zone of the Great Barrier Reef, Australia. Mar. Pollut. Bull. 51 (1–4), 51–59. doi:10.1016/j.marpolbul.2004.10.055
Szymczycha, B., Borecka, M., Białk-Bielińska, A., Siedlewicz, G., and Pazdro, K. (2020). Submarine Groundwater Discharge as a Source of Pharmaceutical and Caffeine Residues in Coastal Ecosystem: Bay of Puck, Southern Baltic Sea Case Study. Sci. Total Environ. 713, 136522. doi:10.1016/j.scitotenv.2020.136522
Szymczycha, B., Kroeger, K. D., and Pempkowiak, J. (2016). Significance of Groundwater Discharge along the Coast of Poland as a Source of Dissolved Metals to the Southern Baltic Sea. Mar. Pollut. Bull. 109, 151–162. doi:10.1016/j.marpolbul.2016.06.008
Szymczycha, B., Maciejewska, A., Winogradow, A., and Pempkowiak, J. (2014). Could Submarine Groundwater Discharge Be a Significant Carbon Source to the Southern Baltic Sea?. Oceanologia 56 (2), 327–347. doi:10.5697/oc.56-2.327
Szymczycha, B., and Pempkowiak, J. (2016). The Role of Submarine Groundwater Discharge as Material Source to the Baltic Sea. Switzerland: Springer International Publishing. doi:10.1007/978-3-319-25960-4
Tait, D. R., Maher, D. T., Sanders, C. J., and Santos, I. R. (2017). Radium-derived Porewater Exchange and Dissolved N and P Fluxes in Mangroves. Geochimica et Cosmochimica Acta. 200, 295–309. doi:10.1016/j.gca.2016.12.024
Taniguchi, M., Burnett, W. C., Smith, C. F., Paulsen, R. J., O'Rourke, D., Krupa, S. L., et al. (2003). Spatial and Temporal Distributions of Submarine Groundwater Discharge Rates Obtained from Various Types of Seepage Meters at a Site in the Northeastern Gulf of Mexico. Biogeochemistry 66, 35–53. doi:10.1023/b:biog.0000006090.25949.8d
Taniguchi, M., Dulai, H., Burnett, K. M., Santos, I. R., Sugimoto, R., Stieglitz, T., et al. (2019). Submarine Groundwater Discharge: Updates on its Measurement Techniques, Geophysical Drivers, Magnitudes, and Effects. Front. Environ. Sci. 7, 141. doi:10.3389/fenvs.2019.00141
Trepel, M., Pfadenhauer, J., Zeitz, J., and Jeschke, L. (2017). Mires and Peatlands of Europe: Status, Distribution, and Conservation. Editors H. Joosten, F. Tanneberger, and A. Moen (Stuttgart, Germany: Schweizerbart Science Publishers).
Vilumaa, K., Ratas, U., Tõnisson, H., Kont, A., and Pajula, R. (2017). Multidisciplinary Approach to Studying the Formation and Development of beach-ridge Systems on Non-tidal Uplifting Coasts in Estonia. Boreal Env. Res. 22, 67–81.
Virtasalo, J. J., Schröder, J. F., Luoma, S., Majaniemi, J., Mursu, J., and Scholten, J. (2019). Submarine Groundwater Discharge Site in the First Salpausselkä Ice-Marginal Formation, South Finland. Solid Earth. 10, 405–423. doi:10.5194/se-10-405-2019
Wang, M., Liu, H., and Lennartz, B. (2021). Small-scale Spatial Variability of Hydro-Physical Properties of Natural and Degraded Peat Soils. Geoderma 399, 115123. doi:10.1016/j.geoderma.2021.115123
Wang, M., Liu, H., Zak, D., and Lennartz, B. (2020). Effect of Anisotropy on Solute Transport in Degraded Fen Peat Soils. Hydrological Process. 34, 2128–2138. doi:10.1002/hyp.13717
WSV(Wasserstraßen- und Schiffahrtsverwaltung des Bundes) (2020). Stammdaten–Warnemünde. Available at: https://www.pegelonline.wsv.de/gast/stammdaten?pegelnr=9640015 (Accessed April 5, 2020)
Keywords: coastal wetlands, HYDRUS-2D, terrestrial SGD, hydraulic conductivity (K), non-tidal shorelines, dune dike, rewetted peatlands
Citation: Racasa ED, Lennartz B, Toro M and Janssen M (2021) Submarine Groundwater Discharge From Non-Tidal Coastal Peatlands Along the Baltic Sea. Front. Earth Sci. 9:665802. doi: 10.3389/feart.2021.665802
Received: 09 February 2021; Accepted: 08 July 2021;
Published: 29 July 2021.
Edited by:
Michel Bechtold, KU Leuven, BelgiumReviewed by:
Ullrich Dettmann, Thuenen Institut Braunschweig, GermanyJoseph James Tamborski, Old Dominion University, United States
Copyright © 2021 Racasa, Lennartz, Toro and Janssen. This is an open-access article distributed under the terms of the Creative Commons Attribution License (CC BY). The use, distribution or reproduction in other forums is permitted, provided the original author(s) and the copyright owner(s) are credited and that the original publication in this journal is cited, in accordance with accepted academic practice. No use, distribution or reproduction is permitted which does not comply with these terms.
*Correspondence: Erwin Don Racasa, erwin.racasa@uni-rostock.de