Regional Morpho-Kinematic Inventory of Slope Movements in Northern Norway
 Line Rouyet1,2,3*
  Karianne Staalesen Lilleøren4
  Martina Böhme5
  Louise Mary Vick2
  Reynald Delaloye6
  Bernd Etzelmüller4
  Tom Rune Lauknes1,2 Yngvar Larsen1 Lars Harald Blikra7
- 1NORCE Norwegian Research Centre AS, Tromsø, Norway
- 2Department of Geosciences, UiT The Arctic University of Norway, Tromsø, Norway
- 3Department of Arctic Geology, The University Centre in Svalbard (UNIS), Longyearbyen, Norway
- 4Department of Geosciences, The University of Oslo (UiO), Oslo, Norway
- 5The Geological Survey of Norway (NGU), Trondheim, Norway
- 6Department of Geosciences, The University of Fribourg (UNIFR), Fribourg, Switzerland
- 7The Norwegian Water Resources and Energy Directorate (NVE), Trondheim, Norway
Mountain slopes in periglacial environments are affected by frost- and gravity-driven processes that shape the landscape. Both rock glaciers and rockslides have been intensively inventoried worldwide. Although most inventories are traditionally based on morphologic criteria, kinematic approaches based on satellite remote sensing have more recently been used to identify moving landforms at the regional scale. In this study, we developed simplified Interferometric Synthetic Aperture Radar (InSAR) products to inventory ground velocity in a region in Northern Norway covering approximately 7,500 km2. We used a multiple temporal baseline InSAR stacking procedure based on 2015–2019 ascending and descending Sentinel-1 images to take advantage of a large set of interferograms and exploit different detection capabilities. First, moving areas are classified according to six velocity brackets, and morphologically associated to six landform types (rock glaciers, rockslides, glaciers/moraines, talus/scree deposits, solifluction/cryoturbation and composite landforms). The kinematic inventory shows that the velocity ranges and spatial distribution of the different types of slope processes vary greatly within the study area. Second, we exploit InSAR to update pre-existing inventories of rock glaciers and rockslides in the region. Landform delineations and divisions are refined, and newly detected landforms (54 rock glaciers and 20 rockslides) are incorporated into the databases. The updated inventories consist of 414 rock glacier units within 340 single- or multi-unit(s) systems and 117 rockslides. A kinematic attribute assigned to each inventoried landform documents the order of magnitude of the creep rate. Finally, we show that topo-climatic variables influence the spatial distribution of the rock glaciers. Their mean elevation increases toward the continental interior with a dominance of relict landforms close to the land-sea margin and an increased occurrence of active landforms further inland. Both rock glaciers and rockslides are mostly located on west-facing slopes and in areas characterised by strongly foliated rocks, which suggests the influence of geological preconditioning factors. The study demonstrates the value of semi-quantitative InSAR products to characterise kinematic information at large scale and exploit the results for periglacial research. It highlights the complementarity of both kinematic and morphologic approaches for inventorying slope processes.
Introduction
Mountainous regions are affected by a wide range of periglacial processes leading to slope movements (Gruber and Haeberli, 2009; Jaboyedoff et al., 2013; Ballantyne, 2018). Gravity induces landforms creeping downslope, such as rock glaciers and rockslides. They have specific morphologic characteristics and variable creep rates depending on the material they convey (rock, unconsolidated sediments, ice) and their environmental controlling factors. One common denominator of these landforms is the potential hazard they represent in case of failure (Kääb et al., 2005; Blikra et al., 2006).
Rock glaciers, defined here as creeping permafrost landforms consisting of an ice/rock mixture (Berthling, 2011), are often used as a proxy for permafrost occurrence or paleo-permafrost extent (Lilleøren and Etzelmüller, 2011; Scotti et al., 2013; Etzelmüller et al., 2020; Karjalainen et al., 2020). In mountainous areas where large topographic variability and site-specific conditions determine the local occurrence of permafrost, rock glacier inventories are valuable to complement global kilometric-resolution permafrost products (Obu et al., 2019). Rock glacier kinematics are considered as an indicator of climate change due to the increasing evidence of relations between creep rate and ground temperature (Delaloye et al., 2010; Kääb et al., 2021). Several studies have evidenced that climate change has consequences on the permafrost thermal state and the ice/water contents of rock glaciers (Ikeda et al., 2008), which cause in a first response their acceleration (Kääb et al., 2007; Delaloye et al., 2010), their destabilisation (Roer et al., 2008; Delaloye et al., 2013; Eriksen et al., 2018), exceptionally their collapse (Bodin et al., 2017), but also conversely, as degradation continues, their progressive stabilization (Ikeda et al., 2008; Delaloye et al., 2017). The comprehensive inventory of rock glaciers within specific regions is the first required step to further monitor their long-term trends in a climate-oriented perspective (RGIK, 2021a).
Unstable rock slopes, hereafter referred to as rockslides, are prone to catastrophic failure and therefore inventoried in many mountainous regions around the globe. The mapping of unstable rock masses and the documentation of their creep rates are typically performed to understand their distribution, volumes and mechanisms (Crosta et al., 2013; Pedrazzini et al., 2016). Permafrost and seasonal frost influence the dynamics of certain rockslides (Blikra and Christiansen, 2014; Keuschnig et al., 2015; Hilger et al., 2021) and changing climate has an impact on their stability (Geerstema et al., 2006; Stoffel et al., 2014; Patton et al., 2019). Identifying unstable rock slopes is the first required step to further assess the hazard and risk (Hermanns et al., 2013; 2016), and potentially design operational monitoring networks (Crosta et al., 2017; Kristiansen et al., 2021).
Satellite remote sensing techniques have become widely applied to identify and map moving areas over large mountainous areas. Satellite Interferometric Synthetic Aperture Radar (InSAR) is especially valuable to detect ground displacements along the radar line-of-sight (LOS) at centimetre to millimetre accuracy. InSAR has been extensively used for studies of periglacial landforms, such as rock glaciers (Delaloye et al., 2007; Liu et al., 2013; Wang et al., 2017; Villarroel et al., 2018; Kääb et al., 2021) or rockslides (Lauknes et al., 2010; Bouali et al., 2018; Rosi et al., 2018; Böhme et al., 2019; Vick et al., 2020). In the Western Swiss Alps, Barboux et al. (Barboux et al., 2014; 2015) mapped and inventoried slope movements using InSAR and categorised the detected moving objects by velocity classes and landform types (solifluction, rockslides, push-moraines, rock glaciers). In Bhutan, Dini et al. (2019) categorised different slope processes using InSAR and were able to distinguish between irreversible (gravitational, e.g. rock glaciers or rockslides) and reversible processes (seasonal, e.g. related to freeze/thaw or hydromechanical forces). In Norway, Iceland and Svalbard, various studies also showed that InSAR can be used to identify specific magnitude and orientation of displacement for different periglacial landforms and surficial material types (Lilleøren et al., 2013; Eriksen et al., 2017a; Eckerstorfer et al., 2018; Rouyet et al., 2019).
Several InSAR techniques have been developed depending on the expected ground velocity, the conditions of the study area and the scope of the research. In mountainous environments, landforms moving at dm/yr to m/yr rates are typically investigated by manual analysis of interferometric image pairs (Delaloye et al., 2007; Barboux et al., 2014), while more advanced time series methods perform well on landforms with a mm/yr to cm–dm/yr velocity but tend to fail on fast-moving landforms (Barboux et al., 2015; Rosi et al., 2018; Vick et al., 2020). Nowadays, the development of national to multi-national InSAR mapping services (Dehls et al., 2019; Larsen et al., 2020) allows for identifying moving areas over entire mountain ranges, but relating them to specific processes remain a challenging task. Research towards a comprehensive use of large stacks of Synthetic Aperture Radar (SAR) images to categorise the ground velocity and relate detected moving areas to specific landforms is needed to scale up the exploitation of InSAR technology in geosciences.
Here we propose a multiple temporal baseline approach based on InSAR stacking (Sandwell and Price, 1998), to combine complementary strengths of existing techniques and consider a large range of velocities. We inventory slope movements in a study area in Northern Norway, encompassing a cluster of rock glaciers and rockslides, and compare them to morphologic inventories. We aim to 1) develop simple InSAR products that summarize the kinematic information and semi-quantitatively document ground velocity over large areas; 2) categorise the identified moving areas and relate them to inferred slope processes; 3) combine kinematic and morphologic approaches to update the existing inventories of rock glaciers and rockslides; 4) interpret the kinematic variability and distribution of different landform types and discuss the values and limitations of InSAR for regional periglacial studies.
Study Area
The study area is located in Troms and Finnmark county, Northern Norway (approx. 70°N, 20°E) and covers 7,500 km2, 6,300 km2 of which is on land (Figure 1; Supplementary Figure S1). Shaped over more than 20 glacial cycles (Corner, 2005), the alpine topography is characterised by a high altitudinal gradient with deep narrow fjords and high mountain peaks up to ca. 1800 m a.s.l. in the central part of the area (Lyngen Alps). Towards East, multiple valleys lead from the fjord heads towards a flat-topped terrain (ca. 1,000 m a.s.l.) near the Finnish and Swedish borders.
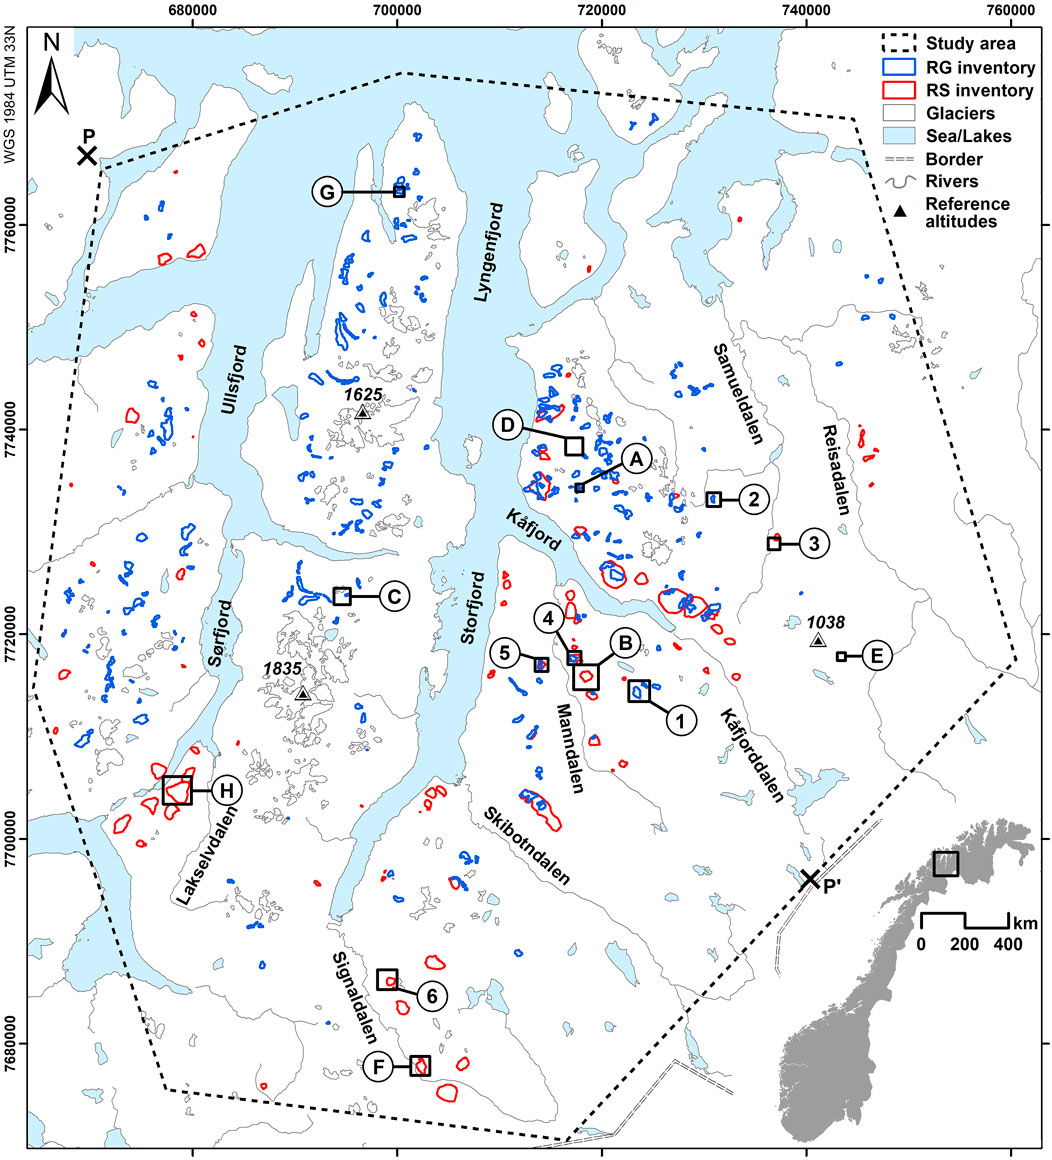
FIGURE 1. Location map of the study area in Northern Norway with landforms from the initial rock glacier (RG) and rockslide (RS) inventories. Detailed maps (A–H) and (1–6) are shown in Figures 3, 6, 8, 10. P–P’ show the limits of the profile used in Section 6.3. Global location of Norway in Northern Europe is shown in Supplementary Figure S1. Glacier inventory from Andreassen and Winsvold (2012) and Winsvold et al. (2014). Sea, lakes, rivers, border and reference altitudes/names from NMA (2020a).
The geology of the region consists of Caledonian nappes of the Upper Allochthon (Andresen, 1985), with basement rocks of the Fennoscandian Shield outcropping in erosion windows and in coastal areas (Zwaan, 1988; Bergh et al., 2007). The thrust nappes were metamorphosed, imbricated, and folded during multiple events, resulting in a dominance of medium-to high-grade metamorphic lithologies (Zwaan, 1988; Augland et al., 2014). The major structures, i.e. faults, shear zones, thrusts and foliation, dip dominantly to the NW, aligning with the complex fold-thrust belt architecture. The Lyngen Alps are metagabbro-dominated, while the western and eastern parts of the study area are characterised by metasedimentary rocks, such as mica schist and phyllite (Zwaan, 1988; Zwaan et al., 1998; NGU, 2020a).
The study area lies within the subarctic climate zone, characterised by long cold winters and short cool summers (NCCS, 2021). The region is influenced by the warm North Atlantic Current, with a large climatic gradient between the temperate and humid coasts and the cold and dry continental interior. The climatic gradient is perpendicular to the land-sea margin and follows a NW–SE orientation, parallel to profile P–P’ (Figure 1, black crosses). At stations close to sea level, mean annual air temperature and precipitation recorded the past 10 years are respectively 4.8°C and 1,197 mm in Botnhamn/Hekkingen on the west coast, 3.7°C and 1,051 mm in Tromsø and 3.2°C and 436 mm in Skibotn (East of Storfjord) (NCCS, 2021). The permafrost distribution follows a similar gradient. The lower elevation limit of the discontinuous zones, where permafrost underlies 50–90% of the landscape, is estimated at around 1,000 m a.s.l. in coastal sites and decreases to below 400°m a.s.l. towards the interior. Around Kåfjord, the lower discontinuous permafrost limit is estimated at 800–900°m a.s.l. (Farbrot et al., 2013; Gisnås et al., 2017), but isolated-sporadic zones, where permafrost underlies <50% of the landscape, can be found down to 500°m a.s.l (Hjort et al., 2014). The permafrost is relatively warm with temperature close or just below 0°C (Christiansen et al., 2010). In-situ ground temperature measurements indicate that the permafrost is warming and degrading in Northern Norway (Isaksen et al., 2007; Farbrot et al., 2013). In the study area, this is documented by six instrumented boreholes in Guolasjávri, Lávkavággi and Nordnes, all East of Storfjord (Farbrot et al., 2013). Models project that this trend is likely to continue in the coming decades (Farbrot et al., 2013; Gisnås et al., 2013).
Due to its geological and geomorphological history, the area presents a cluster of unstable rock slopes (Braathen et al., 2004; Blikra et al., 2006; Osmundsen et al., 2009; Bunkholt et al., 2012; Vick et al., 2020). Several rockslides are intensively investigated (Hermanns et al., 2016) and monitored (Blikra and Kristensen, 2013), due to potential major consequences in case of a collapse into the valleys or fjords, as well as connected secondary effects such as displacement waves. Detailed mapping and inventories of rock glaciers and ice-cored moraines have also been performed, especially in the Kåfjord area (Tolgensbakk and Sollid, 1988; Sollid and Sørbel, 1992; Lilleøren and Etzelmüller, 2011). Recent research evidenced the recent acceleration of a rock glacier complex in Skibotndalen (Eriksen et al., 2018). Other periglacial landforms, such as solifluction lobes and sheets, have also been studied in the region (Hjort et al., 2014; Eriksen et al., 2017a).
Datasets
Sentinel-1 Interferometric Wide Swath Mode Scenes
The InSAR processing is based on images from Sentinel-1 C-band (5.6 cm wavelength) SAR satellites of the European Commission Copernicus Programme. Sentinel-1 is a constellation of two satellites providing a repeat-pass of 6 days. SAR images from ascending (track 58) and descending (track 95) snow-free SAR images (Interferometric Wide Swath mode) between 2015 and 2019 (June–October) were used. The sensor is looking obliquely downward (mean LOS incidence angles: 38.9° in ascending; 27.4° in descending), towards East-Northeast (ENE) for ascending acquisitions and towards West-Northwest (WNW) for descending acquisitions (mean LOS compass directions: 77.4° in ascending; 282.6° in descending). An 8 × 2 (range x azimuth) multi-looking factor was applied, providing a final ground resolution of approximately 40 × 40 m.
Initial Morphologic Inventories and In-Situ Data
The polygonal morphologic inventories used in this study are based on an inventory of cryogenic landforms from the University of Oslo and an inventory of unstable rock slopes from the Geological Survey of Norway.
Within the study area, the cryogenic landforms inventory from Lilleøren and Etzelmüller (2011) consists of 345 rock glaciers, protalus ramparts, ice-cored moraines, debris-covered glaciers, and morainic glacier-forefield. In the present study, we differentiate permafrost from glacial landforms. We discarded 56 landforms to focus on rock glaciers and protalus ramparts, the latter being considered as “embryonic rock glaciers” experiencing permafrost creep (Scapozza et al., 2015). Three landforms were removed due to previously wrong classification (rock avalanche deposits or large solifluction lobes). The initial inventory of rock glaciers (RG) consists of 286 landforms (Figure 1, blue polygons). The inventory is primarily based on geomorphological or quaternary geological maps (Østrem, 1964; Sollid and Torp, 1984; Tolgensbakk and Sollid, 1988) and optical imagery (NMA, 2011). The activity of the rock glaciers was defined as active, inactive, or relict based on morphologic evidence. The delineation follows an extended geomorphological footprint definition, including the frontal and lateral margins/aprons. It must be noted that the quality of the optical images was variable at the time of the inventory and may have led to inaccurate detection and delineation, especially in the upper boundary, due to image distortion in steep areas, shadows and snow cover.
The initial unstable rock slope inventory, hereafter referred to as rockslides (RS), consists of 97 landforms in the study area (NGU, 2020b) (Figure 1, red polygons). It considers areas where signs of gravitational and post-glacial rock mass deformation have been identified by the Geological Survey of Norway (e.g. backscarps, open fractures) and could lead to a rock avalanche in case of failure (Hermanns et al., 2013; Oppikofer et al., 2015). The mapping programme focuses on rockslides that may present a risk to society and therefore is not exhaustive. It must be noted that the reliability of the RS polygonal delineations varies depending on the level of investigation. In areas without detailed geological information, the delineation is indicative, especially the lower limit. Within the study area, three RS are permanently monitored (high risk objects: Gámánjunni 3, Jettan and Indre Nordnes) (Blikra et al., 2009; Blikra et al., 2015; Böhme et al., 2016, 2019; Eriksen et al., 2017b) and 21 RS have corner reflectors for InSAR monitoring and/or periodic differential Global Navigation Satellite System (dGNSS) measurements (Lauknes, 2011a; Bunkholt et al., 2012). Of those last, 13 are showing displacement, four are not moving (certain data), four are uncertain due to short series or bad measurement locations. In total, in-situ mean velocity measurements over 20 RS were used for comparison with the InSAR results of this study. Their location is shown in supplementary material (Supplementary Figure S2).
Methods
The use of InSAR to map slope movements in mountainous environments is usually based on two types of techniques, both with advantages and drawbacks. The analysis of individual interferometric pairs (interferograms) has proven to be valuable in identifying fast-moving landforms (Delaloye et al., 2007; Barboux et al., 2014). It reduces the risk of a biased displacement estimate and exploits information from decorrelated areas, when related to fast-moving landforms (Barboux et al., 2014). However, such analysis requires laborious manual work considering the extensive SAR data archives and may exaggerate the importance of some interferograms with short-term nonrepresentative patterns. Slow-moving landforms (e.g. mm/yr to cm/yr on large rockslides) may be hard to detect due to uncorrected atmospheric effects. Multi-temporal InSAR techniques (Ferretti et al., 2001; Berardino et al., 2002), including the automated conversion from cyclic to continuous phase difference, called unwrapping (Chen and Zebker, 2002), have been developed to process large SAR stacks. It allows for mitigating more robustly atmospheric effects and providing submillimetric accuracy. However, due to InSAR decorrelation during snow-covered periods, time series methods usually require the integration of interferograms with long temporal intervals, which may lead to ambiguous displacement estimates on fast-moving landforms, especially when the velocity is nonlinear (Wasowski and Bovenga, 2014).
We apply here a multiple temporal baseline InSAR stacking methodology to combine the strengths of the single interferogram analysis and multi-temporal InSAR techniques (Section 4.1). Mean annual ground velocity was classified to inventory kinematics at the regional scale (Section 4.2). The results were then used to update the RG and RS inventories and include a kinematic attribute into the databases (Sections 4.3) (Figure 2).
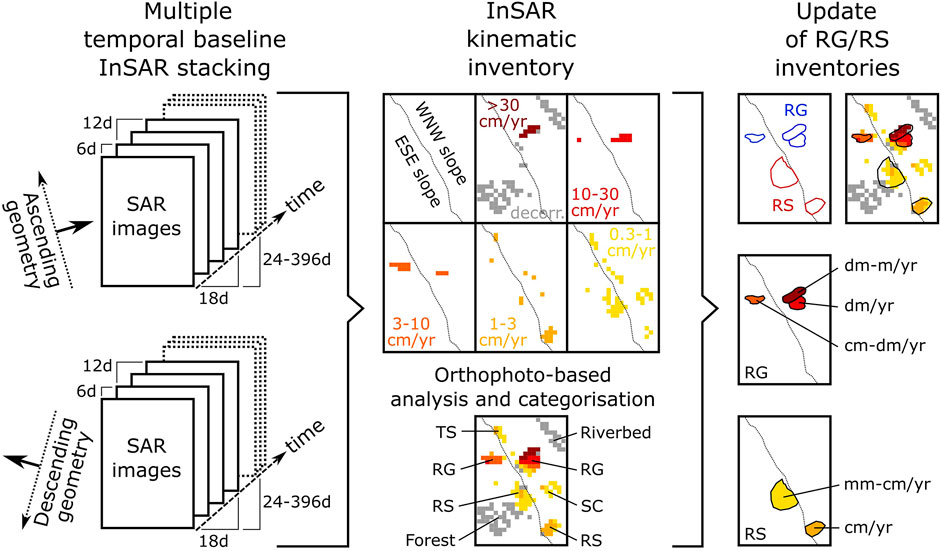
FIGURE 2. Methodological sketch. Acronyms/Abbreviations refer to Synthetic Aperture Radar (SAR), SAR Interferometry (InSAR), decorrelation (decorr.), rock glacier (RG), rockslide (RS), talus/scree deposit (TS), solifluction/cryoturbation (SC).
Multiple Temporal Baseline InSAR Stacking
InSAR results have been processed using the NORCE GSAR software (Larsen et al., 2005). All seasonal (June to October) and 1-year pairs were first generated leading to two sets of 2,705 (track 58) and 2,533 (track 95) interferograms. The spatial baseline has not been restricted, the effective maximum being under the critical baseline limit. Interferograms were preselected based on a measure of the signal stability (mean coherence >0.4), leading to two sets of 1,221 (track 58) and 1,308 (track 95) interferograms. The noise level was reduced by applying a spatially adaptive coherence-dependent Goldstein filter (Goldstein and Werner, 1998; Baran et al., 2003). The contribution from the stratified atmosphere was mitigated (Cavalié et al., 2007; Lauknes, 2011b) using a 10 m DEM (NMA, 2016). A similar calibration point at a location expected to be stable has been used in both geometries (69°30’52’’/20°25’45’’, black star in Figure 4). Unwrapping was performed using the SNAPHU software (Chen and Zebker, 2002). Interferograms affected by large unwrapping errors were discarded.
We used a weighted averaging method based on multiple unwrapped interferograms (InSAR stacking, e.g. Sandwell and Price, 1998), to mitigate atmospheric artefacts and provide an estimate of the assumed linear velocity. Although the results are expressed as mean annual velocities, they are based on snow-free scenes, which exaggerate the importance of the summer seasons. InSAR stacking has been processed with five complementary ranges of temporal intervals between the SAR acquisitions (temporal baselines BT, Table 1), to combine different detection capabilities. Large BT (e.g. 1 year) provide good sensitivity to low displacement rates. Small BT (e.g. 6 days) allows for higher detectable maximal velocities. In 54–150 days and 336–396 days stacks, fast moving areas are decorrelated but the results are only used for velocities <3 cm/yr. In the 6 days stack, the noise level is expected to be higher, but the results are only used for velocities >30 cm/yr. The procedure is performed both for ascending and descending datasets, leading to a set of 10 velocity maps. The large number of interferograms in each stack (56–326, Table 1) contributes to mitigate the effects from turbulences in the troposphere. Additionally, the results are spatially smoothed using a 10 km filter to remove remaining large-scale atmospheric/ionospheric phase trends.
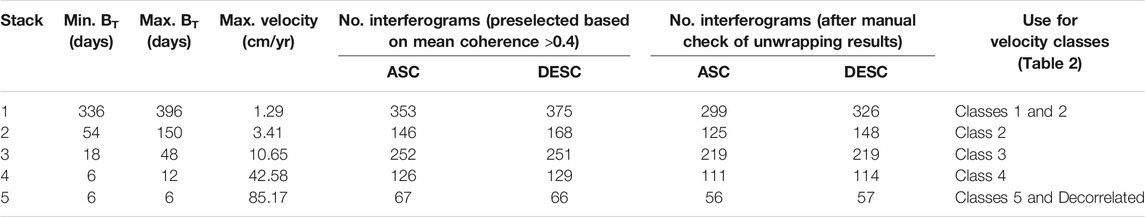
TABLE 1. Summary of the InSAR processing settings for the five stacks in each SAR geometry. Acronyms refer to ASC (ascending), DESC (descending), BT (temporal baseline, i.e. time interval between SAR acquisitions).
InSAR Kinematic Inventory
The InSAR kinematic inventory is a catalogue of moving areas assigned to six mean annual velocity classes. The processing strategy has been designed for a semi-quantitative mapping at a regional scale. To document velocity on both east- and west-facing slopes, ascending and descending results were combined. The velocity classes are meant to document half a magnitude order, as recommended by the International Permafrost Association (IPA) Action Group on rock glaciers inventories and kinematics (RGIK, 2020; RGIK, 2021b).
Five classes are based on the InSAR velocity values (classes 1 to 5, Table 2). When a pixel is covered by results from different stacks or geometries, the selected value corresponds to the highest velocity class to keep the most adequate information in respect to the LOS and the detection capability. This accounts for velocity underestimation on slopes facing towards the radar and phase ambiguities using long BT in fast-moving areas. The maximum detection capability for displacement between two neighbouring pixels corresponds to a quarter of the wavelength of the sensor (5.6 cm for Sentinel-1) during the time interval used to build the interferograms. For a stack including interannual interferograms (336–396 days BT, stack 1 in Table 1), phase ambiguities can occur when the velocity is over ca. 1.3 cm/yr. The results of this stack were used for the class 1, i.e. 0.3–1 cm/yr (Table 2). For a stack including only 6 days interferograms (stack 5 in Table 1), the detection capability rises to ca. 85 cm/yr. The results of this stack were used for the class 5, i.e. > 30 cm/yr (Table 2). The similar rationale was applied to the intermediate velocity classes 2–4 (Table 2).
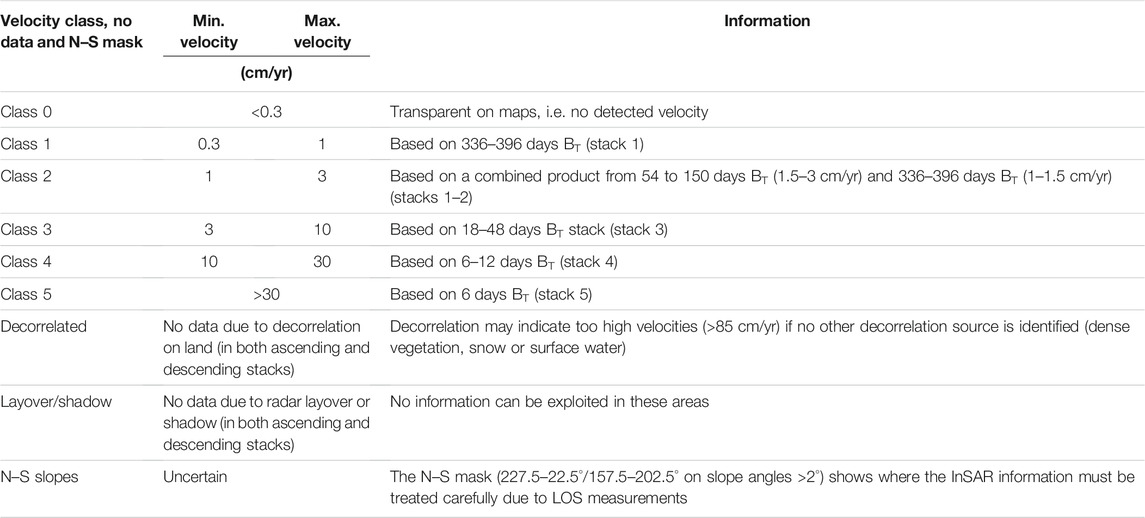
TABLE 2. Velocity classification based on InSAR results from five stacks in both ascending and descending geometries (Table 1). Acronyms refer to BT (temporal baseline, i.e. time interval between SAR acquisitions) and LOS (line-of-sight).
Three additional classes were generated (Table 2). The class “Decorrelated” corresponds to the pixels under the coherence thresholds both in ascending and descending results using the stack 5 (6 days BT). Fjord and large lakes were removed to focus on land. Decorrelation is typically caused by 1) dense vegetation, 2) snow or surface water, 3) too high velocities (>85 cm/yr). Over specific landforms with morphologic signs of high activity, if there is no visual sign indicating that 1) or 2) are the decorrelation causes (based on orthophotos, NMA, 2020b), the third hypothesis can be reasonably kept. The class “Layover/Shadow” shows where no information can be exploited from any SAR geometry. The class “N–S slopes” consists of a semi-opaque mask of the North- and South-facing slopes (compass directions 337.5–22.5°/157.5–202.5° on slope angles >2°) highlighting where InSAR is likely to provide underestimated values if the horizontal component of the true displacement vector is large. This mask corresponds to ca. 21% of the land area (1,313 km2). When mapping all together the five velocity classes and the three additional classes, the transparent areas can reasonably be considered as under the detection limit (<0.3 cm/yr), corresponding to no or very low velocity (class 0). The multiple temporal baseline InSAR stacking applied here does not allow for an accurate discrimination of velocities under this limit.
Based on the InSAR kinematic inventory, we analysed and categorised the identified moving pixels. The main InSAR moving areas consist of clusters of typically >10 pixels (ca. 160,000 m2) from similar or adjacent classes. They were first manually located with a point without interpreting which process induces the velocity. This procedure is not meant to be exhaustive but aims to provide a representative sample of what InSAR is able to detect in the study area. Due to the focus on slope processes, only pixels on slopes stepper than 5° were considered at this stage. Secondly, each identified location was associated with a category of periglacial landform through a visual interpretation of orthophotos (NMA, 2020b). Six main categories have been chosen for this purpose (Figure 3): rock glacier (RG), rockslide (RS), glacier/moraine (GM), talus/scree deposit (TS), solifluction/cryoturbation (SC), composite (CO). The expected dominant movement type associated with these landforms are: permafrost creep (for RG), rock mass sliding/deformation (for RS), glacial flow or ice-core deformation/melting (for GM), superficial displacement of debris (for TS), thaw subsidence, frost creep and gelifluction (for SC). A seventh category (UD: undefined) is used when no clear process is identified. The CO class is further divided into RS + S (rockslide + superficial), RG + S (rock glacier + superficial) and RS + RG (rockslide + rock glacier). Superficial here means either talus/scree deposit or solifluction/cryoturbation. The dominant velocity class was associated to each identified area and moving areas significantly overlapped by the “N–S slopes” mask were flagged as “uncertain”.
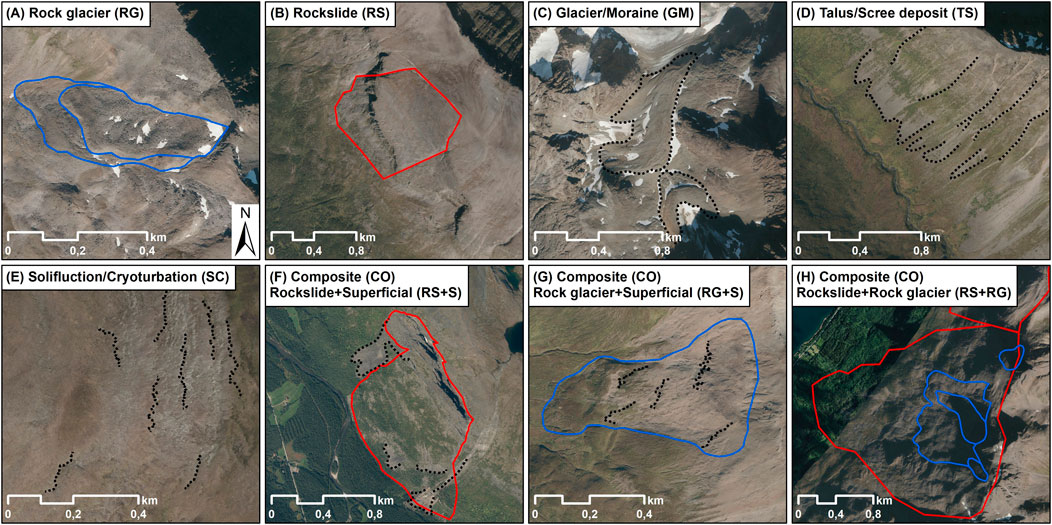
FIGURE 3. Orthophotos with examples of the landform categories. Locations (A–H) of these detailed maps are shown in Figures 1, 4. The lines highlight the indicative morphologic delineations (blue: rock glaciers; red: rockslides, dashed black: others morphologic features, in (C): debris-covered glacier and ice-cored moraine; in (D) and (F): gullies and talus cones; in (E) and (G): solifluction lobes). Norge i bilder orthophotos from NMA (2020b).
Update of the Rock Glacier and Rockslide Inventories
Based on the InSAR kinematic inventory, the initial RG and RS inventories were updated by 1) including a kinematic attribute to a previously identified landform, when there is no significant limitation on the reliability of the attribution; 2) updating the delineation when the InSAR results fit morphologic evidence that were not considered in the initial inventories; 3) adding newly detected objects, when RG/RS/CO categories have been identified but are missing in the initial inventories. The delineation may have been significantly updated, but no landform has at this stage been removed, assuming that no detected InSAR velocity is not a sufficient criterion to discard a landform initially inventoried based on morphologic evidence.
The kinematic attribute assigned to rock glaciers follows “order of magnitude” categories (e.g. cm/yr, dm/yr, m/yr). The criteria for the assignment of the kinematic attribute, based on the velocity classes of the InSAR moving areas, are following the recent recommendations from the IPA Action Group on rock glacier inventories and kinematics (RGIK, 2021b). Translation rules from velocity classes to kinematic attributes are explained in RGIK (2020) and are meant to account for some spatial and temporal heterogeneities over the inventoried landforms. The dominant category is used if several velocity classes are present over one landform. If decorrelation is likely due to velocity above the threshold (Section 4.2; Table 2), the attribute “m/yr” is used. Confusion with movement related to other processes, such as thaw subsidence, must be avoided. Isolated moving pixels or heterogenous combination of velocity classes (min/max ratio over 1:5) are typically considered as unlikely to represent the rock glacier creep (RGIK, 2020). In these cases, the category “undefined” is chosen. If a landform is to a large extent located on N–S slopes, the reliability is low and the kinematic attribute remains “undefined”. The categorisation of the rock glacier activity is also updated, following the new recommended classes (active, transitional, relict; RGIK, 2021b). In general, units with kinematic attribute <0.3 cm/yr or mm–cm/yr associated with other superficial processes (e.g. solifluction) are interpreted as relict. Units with mm–cm/yr to cm/yr kinematic attribute are interpreted as transitional. Landforms documented with cm–dm/yr to m/yr kinematics are interpreted as active. Morphologic criteria are also taken into account (RGIK, 2021b). According to the new delineations, one rock glacier system can be composed of a single unit or multiple units (coalescent or adjacent). Landforms initially inventoried as single unit may be divided into two or more units if the kinematics match morphologic evidence of multiple lobes. The type of geomorphological unit located directly upslope is also documented, as recommended by RGIK (2021b). The relevant categories for this study are “talus-connected”, “landslide-connected”, “glacier-connected”, “glacier forefield-connected” and “poly-connected”. It should be noted that the spatial connection to an upslope unit does not necessarily mean that there is a dynamic or genetic connection (RGIK, 2021b).
For rockslides, similar categories of kinematic attributes were used. However, the detected velocity cannot always be associated with the deep-seated rock sliding/deformation, because other processes take place in the superficial part of the inventoried landforms. A rockslide is kinematically categorised only if the signal is assumed to correspond to the velocity of the rock mass (over a rock plateau or in absence of superficial deposits). The kinematic attribute remains “undefined” if superficial processes are likely to dominate the InSAR signal, e.g. when talus/scree deposits, solifluction lobes or rock glaciers are superimposed. The applied stacking technique does not allow for detection capability <0.3 cm/yr. However, multi-temporal InSAR based on a Persistent Scatterers Interferometry (PSI) algorithm can be used for this purpose. Based on the open-access Norwegian Ground Motion Mapping Service (InSAR Norway, insar. ngu.no; NGU, 2020c; Dehls et al., 2019), an additional category “mm/yr” is added to document slow-moving landforms.
Results
InSAR Classified Products
The multiple temporal baseline InSAR stacking method led to the identification of moving pixels with velocities >0.3 cm/yr (classes 1–5) corresponding to ca. 2% of the land area (152 km2) (Supplementary Table S3, rows 1–2). Ca. 72% of the land area (4,527 km2) are under the detection limit of 0.3 cm/yr. Ca. 24% of the land area (1,525 km2) are decorrelated in 6 days due to vegetation, snow, surface water or too high velocity. Areas affected by layover/shadow in both ascending/descending geometries cover ca. 1% of land area (57 km2). The fraction of areas documented by moving pixels slightly increases when discarding N–S slopes (Supplementary Table S3, rows 3–4).
Figure 4 shows the distribution of all classified InSAR results in the study area. Each landform category is presented on separated maps in supplementary material (Supplementary Figures S4–S10). A high density of moving areas is detected on the Njárgavárri/Badjánvárri mountain slope along Kåfjorddalen, where the moving areas match the delineation of the initial RG/RS inventories at several locations (Figure 4, lower-right inset). This is especially clear for a large rock glacier complex, which is homogenously covered by the 10–30 cm/yr velocity class. This area has also been documented by Eriksen et al. (2017a), who measured similar velocity ranges. High velocity is also detected over Ádjet mountain slope along Skitbotndalen (Figure 4, upper-left inset), with several locations covered by the >30 cm/yr velocity class. Over two initially inventoried rock glaciers, the class “Decorrelated” covers the frontal parts of the lobes, highlighting that these areas are moving over the threshold of 85 cm/yr. These rock glaciers have been studied in detail by Eriksen et al. (2018), who documented velocities up to tens of m/yr, with an acceleration the past decades.
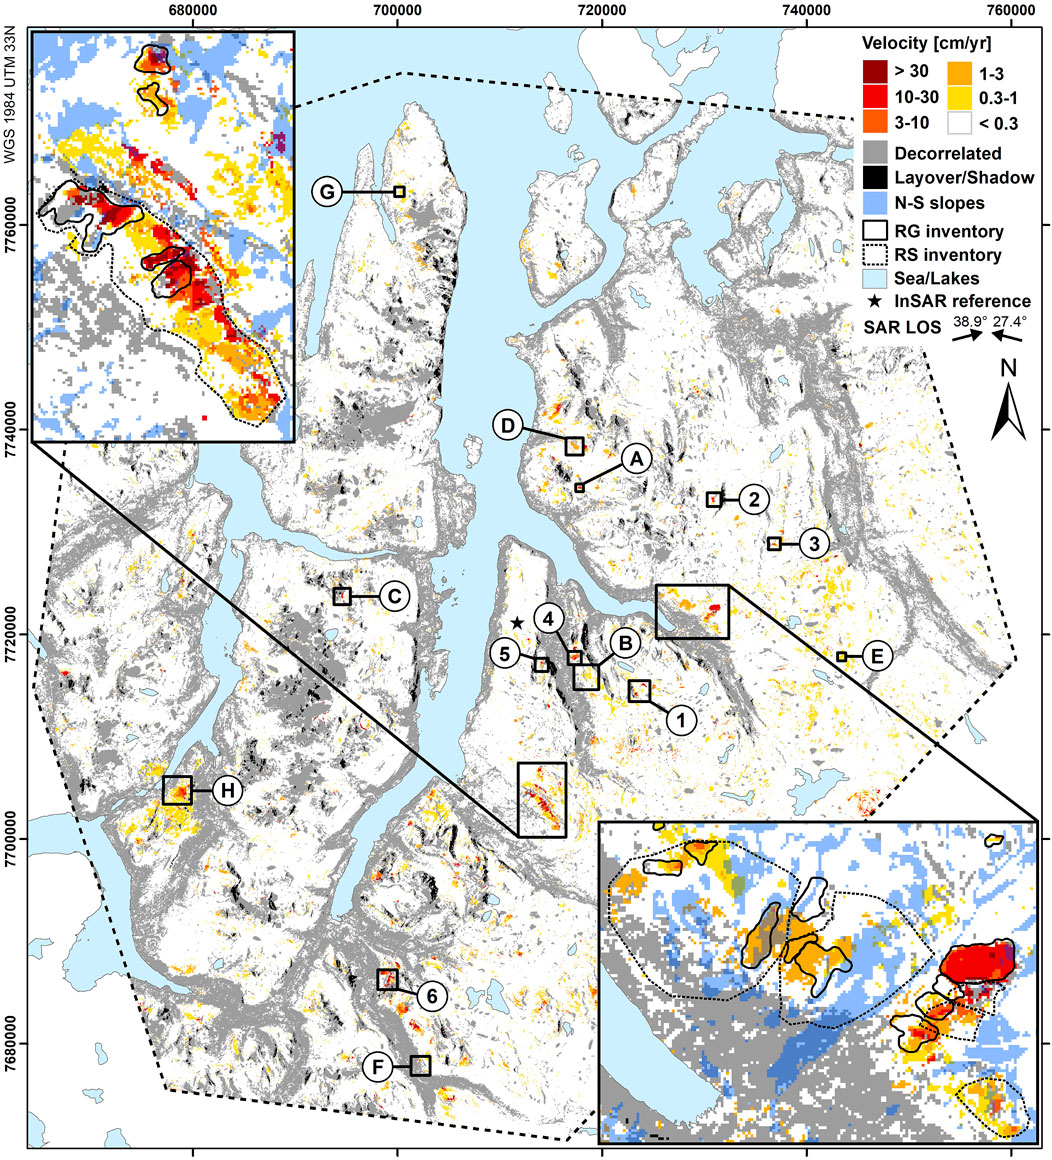
FIGURE 4. Classified InSAR results and detailed views over Ádjet in Skibotndalen (upper-left) and Njárgavárri/Badjánvárri in Kåfjorddalen (lower-right). Polygons in detailed maps: initial inventories of rock glaciers (RG, back solid lines) and rockslides (RS, black dashed lines). Note that the N–S slopes mask is here displayed only on the detailed maps for the sake of visualization. Locations (A–H) and (1–6) are the areas detailed in Figures 6, 8, 10. Arrows in legend: line-of-sight (LOS) orientations. Sea and lakes from NMA (2020a).
The analysis of the InSAR kinematic inventory led to the identification of 763 moving areas that have been associated with the six main landform categories (Figure 5). Moving areas identified on N–S slopes are inventoried but the velocity is likely to be underestimated. The attributed class therefore remains “uncertain”. Clusters of multiple and composite processes are identified in Piggtind (between Lakselvdalen and Sørfjord), Manndalen, Northern Kåfjord, as well as in Skibotndalen and Signaldalen (Figure 5). Fast-moving glacier/moraine (GM) landforms are mostly identified in the Lyngen peninsula (between Storfjord/Lyngenfjord and Ullsfjord). The flat-topped terrain in the eastern part of the study area is dominated by low velocity solifluction/cryoturbation (SC) processes. Figure 6 shows detailed maps with examples of InSAR results from each landform category (similar locations as Figure 3).
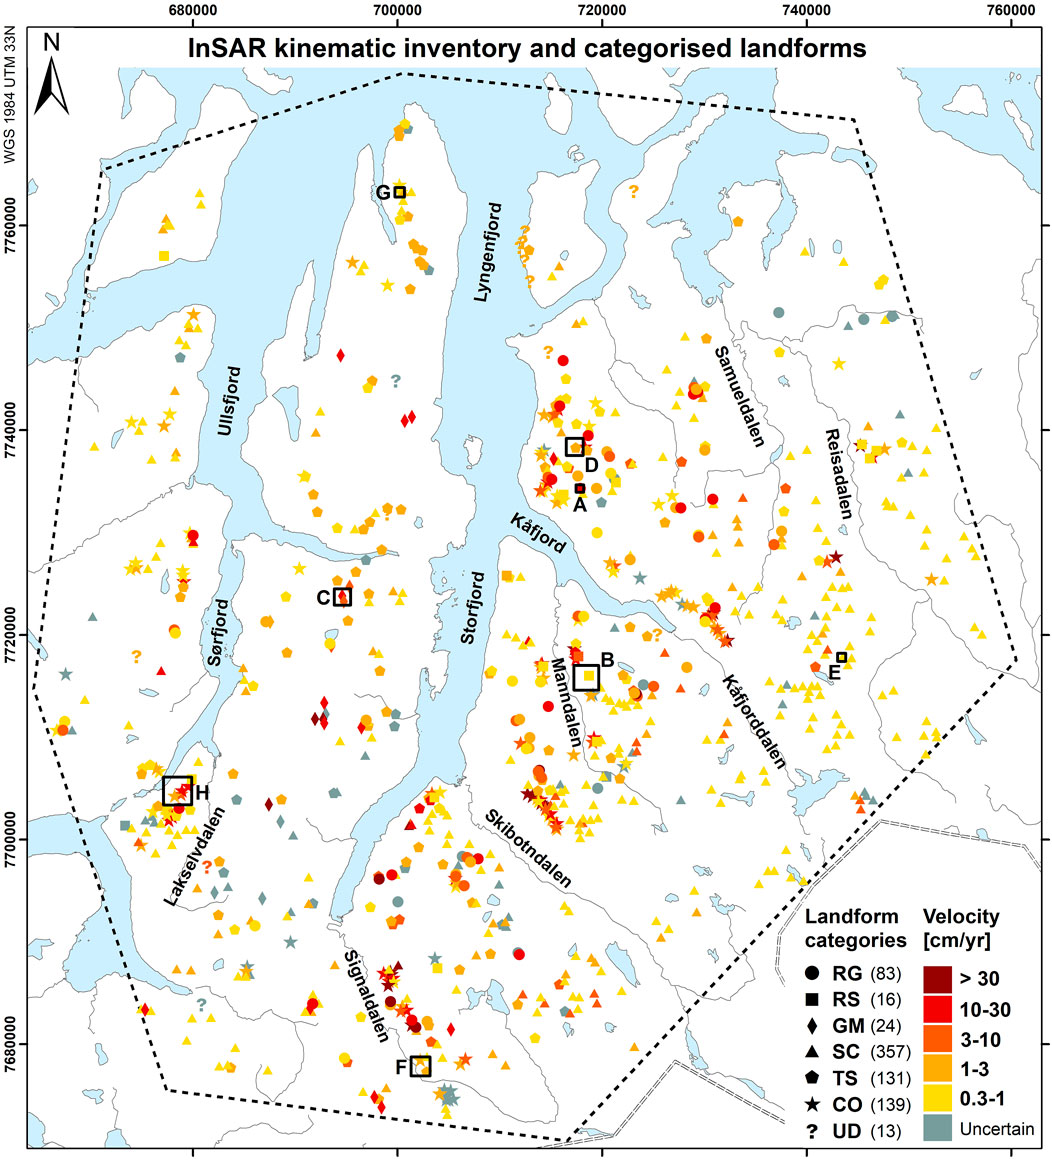
FIGURE 5. InSAR kinematic inventory: slope movement categorised by landform type. Acronyms refer to rock glacier (RG), rockslide (RS), glacier/moraine (GM), talus/scree deposit (TS), solifluction/cryoturbation (SC), composite (CO) and undefined (UD). Numbers in parentheses in the legend are the total numbers of identified areas for each landform category. Grey symbols correspond to areas where slope movement has been detected and the landform type categorised, but the velocity is uncertain due to location on N-S slopes. Locations (A–F) are the areas detailed in Figures 3, 6. Sea, lakes, rivers and border from NMA (2020a).
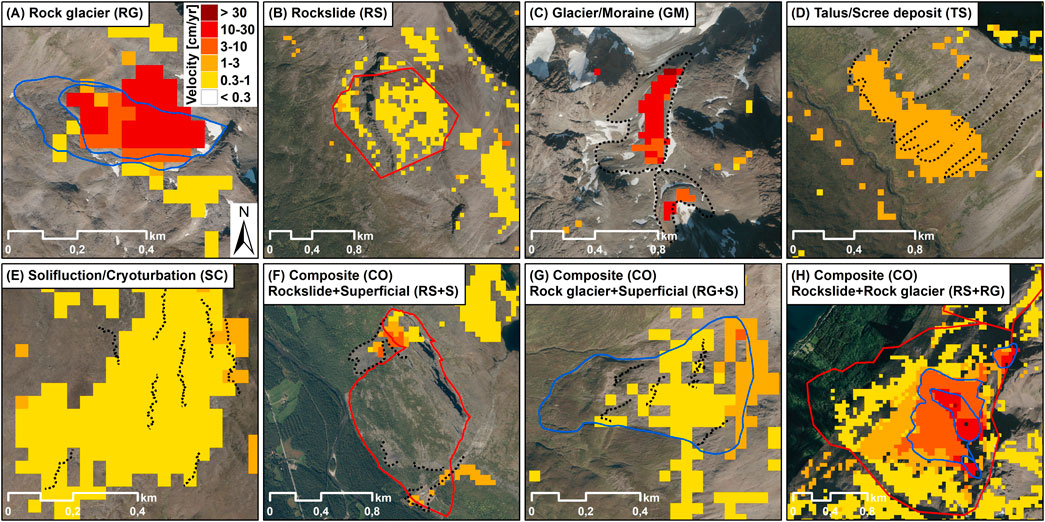
FIGURE 6. Classified InSAR results for each landform category (based on Figure 3). Locations (A–H) are shown in Figures 4, 5. The lines highlight indicative morphologic delineations (blue: rock glaciers; red: rockslides, dashed black: others morphologic features, in (C): debris-covered glacier and ice-cored moraine; in (D): gullies and talus cones; in (E) and (G): solifluction lobes). Note that the classes “Decorrelated”, “Layover/Shadow”, and “N-S slopes” are not displayed for the sake of visualization. Norge i bilder orthophotos from NMA (2020b).
The large number of identified moving areas categorised by landform type provides a representative sample to compare their velocity ranges. The number of moving areas attributed to each category varies greatly (Figure 7A). Among the 763 locations, 357 (47%) are attributed to solifluction/cryoturbation (SC) processes. Many landforms are also identified for the composite category (139 CO, 18%), the talus/scree deposits (131 TS, 17%) and the rock glaciers (83 RG, 11%). Among the CO landforms, the combination of rockslides and rock glaciers (RS + RG), as well as rockslides and superficial (RS + S), are dominating with 58 and 70 landforms, respectively. RS and GM include only 16 and 24 landforms (2–3%), respectively. The velocity ranges clearly vary depending on the landform category (Figure 7B). In > 60% of the documented cases, GM has velocity ≥10 cm/yr. TS, SC and RS are dominated by low velocities (>70% with 0.3–3 cm/yr). RG has the largest variety of velocity ranges, but ca. 50% of the landforms have velocities >3 cm/yr. Velocities of the composite category vary depending on the CO type (Figure 7C). CO RS + RG has overall the same velocity distribution as RG, highlighting that the signal on these landforms is likely dominated by the rock glacier creep. CO RG + S mostly consists of relict rock glaciers with superficial processes (SC or TS) and is dominated by low velocities. CO RS + S is an intermediate case with velocity ranges clearly higher than the RS category, highlighting that the detected velocity of these landforms can not only be explained by the movement of the rock mass. The 13 moving areas that could not be associated to specific landforms remain undefined (UD). Some are due to shadow, snow or distortions on orthophoto images. Others, located in areas surrounding by decorrelated pixels, are possibly due to local unwrapping errors.
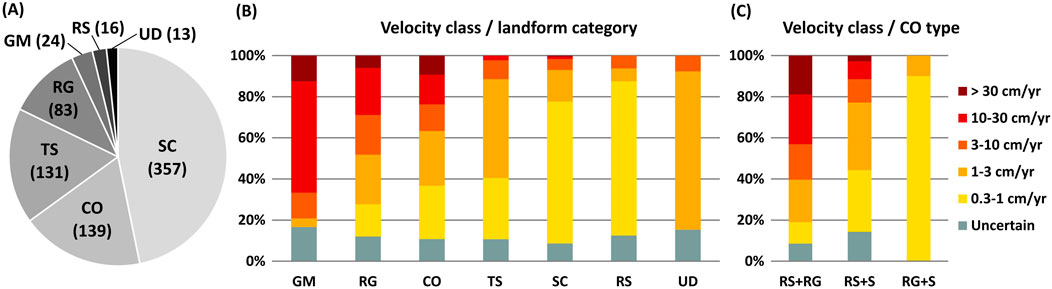
FIGURE 7. Statistics of the dominant velocity classes per landform category. (A) Number of identified landforms by landform category. (B) Velocity class by landform category. (C) Velocity class by composite type. Acronyms refer to rock glacier (RG), rockslide (RS), glacier-moraine (GM), talus/scree deposit (TS), solifluction/cryoturbation (SC), composite (CO), undefined (UD) and superficial (S). In grey: areas where slope movement has been detected and the landform type categorised but the velocity is uncertain due to location on N–S slopes.
Update of the Rock Glacier Inventory
The RG inventory consists of 340 systems (54 newly detected), including 290 single units and 124 units within 50 RG systems (414 units in total). In some cases, the update consisted in revising the delineation of the landforms or dividing previously inventoried single units into multi-units within a system, when the variability of the kinematics matchs morphologic evidence (Figure 8, examples 1–2). In other cases, newly identified landforms categorised as RG or CO RS + RG/RG + S (InSAR kinematic inventory, Section 5.1) were added to the inventory (Figure 8, example 3). A kinematic attribute <0.3 cm/yr (no detected velocity) is assigned to 240 and 21 units remain kinematically undefined (highly heterogeneous, no data or mostly located on N–S slopes). The remaining 153 units have kinematics between mm–cm/yr and m/yr (Figure 9, pie chart). The kinematic attributes contribute to the update of the activity assessment. In total, 92 units are estimated as active, 104 as transitional and 218 as relict. The distribution of the activity attribute is shown in Supplementary material (Supplementary Figure S11).
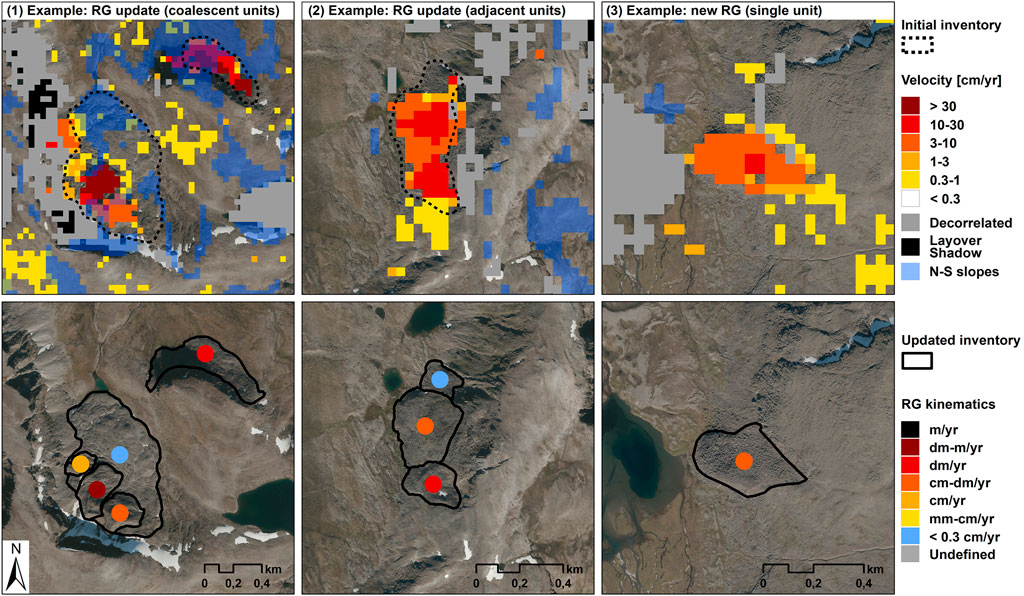
FIGURE 8. Update of the rock glacier (RG) inventory. Examples of (1) coalescent units within two systems, (2) adjacent units within one system, (3) newly detected single unit. Upper panel: classified InSAR results and initial inventory. Lower panel: updated inventory with associated kinematic attribute for each unit. Locations of these detailed maps are shown in Figure 9. Norge i bilder orthophotos from NMA (2020b).
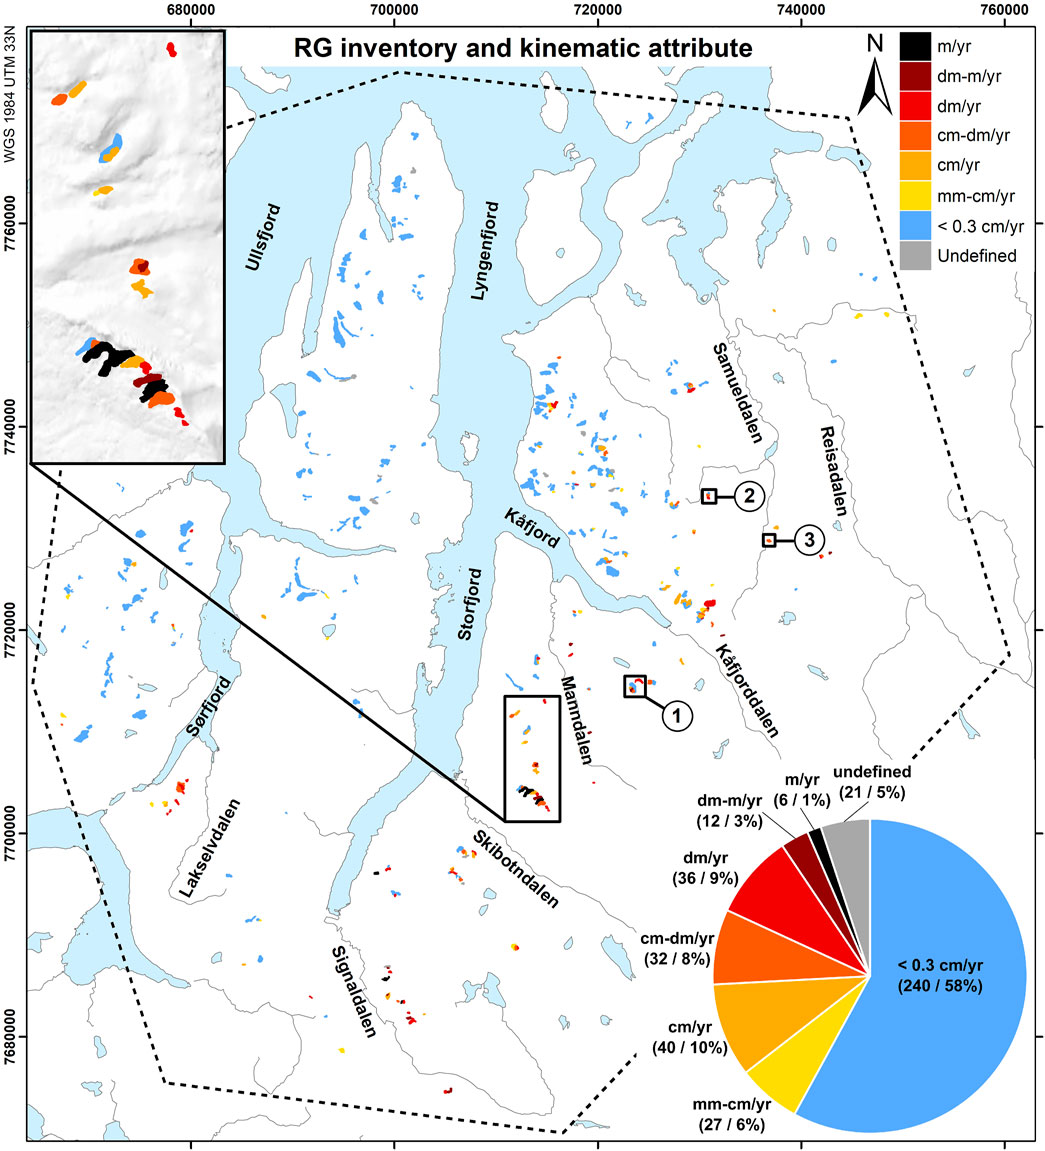
FIGURE 9. Updated rock glacier (RG) inventory consisting of 414 units in 340 systems and variability of the kinematic attribute in the study area. Inset map (upper-left corner): detailed view over an area including several landforms with variable kinematic attributes. Pie chart (lower-right corner): kinematic attributes for all inventoried RG units. Numbers 1–3 are the locations of examples shown in Figure 8. Sea, lakes, rivers and reference names from NMA (2020a).
The kinematic attribute is spatially distributed with a clear NW–SE trend, with lower creep rates towards the NW part of the study area (Figure 9). A high density of rock glaciers with variable kinematics is found between Skibotndalen, Kåfjord and Samueldalen (Figure 9, inset map). Several active landforms are also inventoried in Piggtind (between Lakselvdalen and Sørfjord) and Signaldalen. The type of upslope unit is also documented: 285 rock glacier units are talus-connected, 67 are landslide-connected, 6 are glacier-connected and 12 are glacier-forefield connected. The category “poly-connected” is used for 44 units combining a talus and landslide connection, or a talus, glacier and/or glacier-forefield connection. The importance of both categories “landslide-connected” and “poly-connected” highlight the challenge of multiple and combined processes in this study area. The distribution of the attribute documenting the type of upslope unit is shown in supplementary material (Supplementary Figure S12).
Update of the Rockslide Inventory
The RS inventory consists of 117 landforms (20 newly detected). In many cases, the InSAR detects velocity both related to rock mass sliding/deformation and processes taking place superficially (CO RS + RG or RS + S in InSAR kinematic inventory, Section 5.1). When a homogenous velocity is located in an area that can reliably be attributed to the RS kinematics based on morphologic criteria (e.g. over top rock plateaus), a kinematic attribute has been attributed (Figure 10, examples 4–5). When superficial processes are masking out the potential signal from the rock mass, the kinematic attribute remains undefined (Figure 10, example 6).
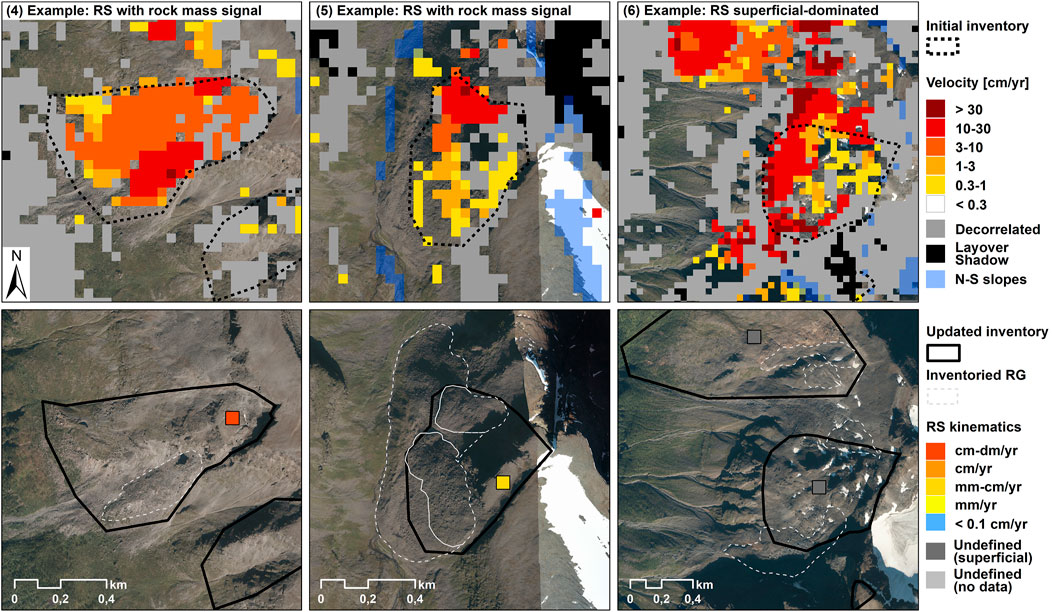
FIGURE 10. Update of the rockslide (RS) inventory. (4–5) Examples of composite landforms where the InSAR signal can reliably be attributed to the movement to the rock mass at specific locations (e.g. top rock plateaus). (6) Example of composite landform where the InSAR results are dominated by superficial processes masking the potential signal from the rock mass. Locations of these detailed maps are shown in Figure 11. Norge i bilder orthophotos from NMA (2020b).
High density of RS can be seen along Kåfjord, Kåfjordalen, Manndalen and Storfjord-Lyngenfjord (Figure 11, inset map). As for the RG inventory, several landforms are also identified in Piggtind (between Lakselvdalen and Sørfjorden) and Signaldalen. The inventory includes 24 RS with kinematics in mm–cm/yr, cm/yr or cm–dm/yr ranges. Taking advantage of the complementary data available on the Norwegian Ground Motion Mapping Service InSAR Norway (Section 4.3), a mm/yr kinematic attribute is additionally assigned to 16 landforms. Over 50% of the landforms remain undefined, 17 RS due to unexploitable data, and 45 RS due to superficial processes masking the potential signal from the rock mass (Figure 11, pie chart).
FIGURE 11. Updated rockslide (RS) inventory consisting of 117 landforms and variability of the kinematic attribute in the study area. Inset map (upper-left corner): detailed view over an area including several landforms with variable kinematic attributes. Pie chart (lower-right corner): kinematic attributes for all inventoried RS. Locations 4–6 are the examples shown in Figure 10. Sea, lakes, rivers and reference names from NMA (2020a).
When comparing the InSAR kinematics with in-situ measurements for 20 RS, we see that 15 RS fall into the expected categories, three are not comparable and two are mismatching. Two RS are inventoried in the cm/yr and cm–dm/yr categories: Jettan along Storfjord and Gámánjunni-3 in Manndalen. These are two high-risk objects continuously monitored, for which the InSAR results fit with the in-situ mean velocities (1–3 cm/yr for Jettan and 3–10 cm/yr for Gámánjunni 3). Three RS are mostly under the 0.1 cm/yr detection limit, four RS have mm/yr velocities and six RS have mm–cm/yr velocities. Three landforms are not comparable due to undefined InSAR kinematics and for two others, there is a mismatch between the dGNSS and InSAR measurements. Falsnesfjellet 1 along Storfjord has <0.1 cm/yr InSAR kinematics but a dGNSS velocity of a few mm/yr. This case may indicate underestimation due to LOS measurements, but also highlights the different spatio-temporal properties of the dGNSS and InSAR measurements. In Gámánjunni-1 in Manndalen, we find the opposite discrepancy between dGNSS and InSAR with no significant dGNSS velocity but mm–cm/yr InSAR kinematics. This may indicate that the dGNSS points are not located in representative areas to document the behaviour of the whole rock mass. Detailed maps showing the locations of the discussed RS are shown in supplementary material (Supplementary Figure S2).
Discussion
InSAR Classified Products: Potential and Limitations
Validation possibilities are constrained by the few complementary datasets available in the study area. For rock glaciers and solifluction lobes, other kinematic measurements have been performed based on complementary optical and radar sensors. In Skibotndalen, Kåfjord, Manndalen and Nordnes, the documented velocities are in agreement with our results (Eriksen et al., 2017a; 2017b; 2018). When comparing the InSAR kinematics with in-situ data for 20 RS, we identified two cases where dGNSS and InSAR velocities do not match. One cause of mismatch is that InSAR is likely to underestimate the velocity if the displacement direction significantly deviates from the LOS. For slow landforms, this can typically be interpreted as not moving, although a few mm/yr are measured by dGNSS. Another reason is that InSAR provides averaged values over 40 m pixels based on snow-free periods only, while dGNSS data are point measurements based on the entire year. If the velocity is heterogenous over the landform or the dGNSS point is not representative of the whole mass, the remotely sensed and in-situ measurements may document different elements of the landform. If the seasonal patterns lead to a velocity decrease in winter, InSAR provides a higher averaged value than dGNSS. Despite these elements, we could see that 15 out of 17 comparable RS are similarly categorised, which is considered as acceptable given the differences of measurement properties.
However, there are five limitations that need to be further discussed:
1) The results are presented as annual velocities for all landforms although the results are based on snow-free images only. Seasonal variations are expected, especially for landforms driven by ground freeze/thaw processes (Gruber, 2020). On slopes, gravitational downslope displacement can be combined with cyclic processes (frost heave and thaw subsidence, e.g. on solifluction lobes, Harris et al., 2008). Rock glaciers may have strong intra-annual velocity variations, with acceleration and deceleration that sometimes exceed 50% of the annual average (Delaloye and Staub, 2016). These seasonal patterns are driven by changes in temperature and water supply (Kenner et al., 2017; Cicoira et al., 2019). Velocity variations of rockslide are typically comparatively smaller and more spread over the year as many external drivers may impact the strength degradation, internal shearing and progressive failure of rock bridges (Eberhardt et al., 2016), although seasonal influence in relation with freeze/thaw cycles has also been evidenced in periglacial environments (Blikra and Christiansen, 2014; Keuschnig et al., 2015). Based on InSAR, the differentiation of gravitational/irreversible and seasonal/reversible components of the movement and the quantification of the seasonal variations of velocity can be performed by analysing time series (Dini et al., 2019; Rouyet et al., 2019; Strozzi et al., 2020). This was beyond the scope of the current study, focusing on the inventory, the distribution and the relative comparison of movement magnitude. It is however important to keep in mind that the kinematics may be overestimated on landforms accelerating in summer.
2) When considering only E–W slopes (compass directions 22.5–257.5°/202.5–227.5°), the fraction of areas documented by moving pixels slightly increases (ca. 3%), while class 0 (<0.3 cm/yr) decreases (ca. 70%) (Section 5.1). This shows that the velocity is underestimated on N–S facing slopes due the measurements along LOS, which justify the use of the N–S mask to highlight parts of the landscape with lower reliability. It should however be noted that the applied thresholds (compass directions 22.5–257.5°/202.5–227.5°) are not exhaustively masking out all areas where a N–S movement component can occur, as NE, NW, SE and SE slope orientations are still included. For a better documentation of the true displacement vector, multi-geometry methods can be applied (Eriksen et al., 2017a; Eckerstorfer et al., 2018; Rouyet et al., 2019).
3) The multiple temporal baseline InSAR stacking procedure has a detection limit of 0.3 cm/yr that is not fully optimised for relatively slow rockslides (Section 5.3). The Norwegian Ground Motion Mapping Service (InSAR Norway) with submillimetric detection capability is more adapted for slow-moving landforms, and higher-resolution PSI-based results also improve the identification of small areas not affected by superficial processes. Conversely, InSAR Norway is not designed for velocities over cm–dm/yr, which shows the importance of combining different InSAR processing techniques for documenting all expected landform types (Lauknes, 2011a; Barboux et al., 2015).
4) Although 20 new RS were included in the inventory based on InSAR velocity, the kinematics could not be reliably determined for 16 of them due the presence of superficial processes likely dominating the InSAR signal (Section 5.3). It highlights that remote sensing information has always to be treated carefully when applied in complex environments encompassing a large range of processes, partly overlapping. The technique measures surface displacements, that are not necessarily caused by the process one specific user is interested in. In the case of rockslides, the results have still been valuable to identify hotspots, later interpreted as including a deep rock deformation. Even if not kinematically assigned, these sites may be further investigated by geologists in the future, to assess the hazard and the potential risk for population and infrastructure. Unclear InSAR signal is also affecting the characterisation of the RG kinematics. For 21 landforms, the kinematic attribute remains undefined (Section 5.2). In some cases, the heterogeneities of the detected velocity are likely due to other processes than the downslope creep, such as localised or uneven ice melting from permafrost degradation.
5) A kinematic approach is not standalone when inventorying periglacial landforms. This is especially obvious when considering relict RG or very slow RS that could not have been detected based on InSAR only. The results show the value of combining morphologic and kinematic information to characterise slope processes.
InSAR Kinematic Inventory and Categorised Landforms
The kinematic inventory shows that the velocity ranges and spatial distribution of the different types of slope processes vary greatly within the study area (Section 5.1). The solifluction/cryoturbation (SC) category is the dominant landform type (47% of the 763 identified moving areas), which is as expected in a region at the interface between seasonal frost and isolated to discontinuous permafrost. Solifluction can be found below the regional limit for discontinuous permafrost, but usually above the limit of sporadic permafrost, i.e. 500–800 m a.s.l in Kåfjord area (Hjort et al., 2014). The identified SC moving areas are widely distributed in the eastern part of the study area, towards the Finnish and Swedish borders, where the altitude of the permafrost limit decreases and the average elevation of the flat-topped terrain is ca. 600–1,000 m a.s.l. Velocities within the 0.3–1 cm/yr and 1–3 cm/yr classes are dominating the SC category, which is in the expected range for mountainous and subarctic areas (Smith, 1987; Matsuoka, 2001; Gruber, 2020). Similar velocities have been documented by two-dimensional TerraSAR-X InSAR results in the same region (Nordnesfjellet, South of Kåfjord) (Eriksen et al., 2017a).
The composite (CO) category is the second largest identified in the area (18%), comprising a combination of rockslides, rock glaciers and superficial processes (RS + RG, RS + S, RG + S). The high frequency of these co-occurring landforms highlights the challenge and complexity of interpreting ground velocity in a highly dynamic region. The co-occurrence of these processes infers some degree of interaction, for example in the case of the combination of rockslide and rock glacier (RS + RG). It indicates that fractured/disaggregated rock material and rock fall deposits in RS inventoried areas contribute to feed rock glaciers. Sediment input is recognized as an important controlling factor of the rock glacier dynamics (Delaloye et al., 2013; Müller et al., 2016). Rock slope deformation within the permafrost zone may favour the development/preservation of rock glaciers, which emphasizes the general co-dependency of landform genesis in peri-/paraglacial landscapes (Ballantyne, 2002; Wilson, 2009; Luckmann, 2017). The CO RS + RG category encompasses a large range of velocity, mostly >3 cm/yr, similarly to the standalone RG category, while RS has clearly lower rates. This shows that for composite landforms, RG tends to mask out the signal from the rock mass and the InSAR velocity is dominated by contributions from superficial processes. Interestingly, velocities for CO RS + RG are also slightly higher than the standalone RG category, which seems to indicate that the presence of a deep rock deformation has an influence on rock glacier dynamics.
Talus/scree deposits (TS) are distributed on the steepest slopes in the area. Although InSAR is not able to detect abrupt rockfall and avalanche occurring almost instantaneously and leading to decorrelation, the gradual displacement of the sediments over the deposits themselves can be captured (mostly 0.3–3 cm/yr). The glaciers/moraines (GM) category includes only 24 landforms, which can easily be explained by the loss of InSAR coherence (decorrelation) on debris-free glacial surfaces (due to snow, ice melt and/or too high velocity). The documented GM are moving at high rates (mostly 10–30 cm/yr or >30 cm/yr). They are mainly located in the Lyngen peninsula, characterised by the highest elevations of the study area and covered by large glacier systems (Andreassen and Winsvold, 2012; Winsvold et al., 2014). The category includes debris-covered glaciers and ice-cored moraines, for which the detected velocity is possibly caused by a combination of processes (glacial flow, ice melt, creep/superficial erosion and debris redistribution). On debris-covered glaciers, the measurements do not necessarily represent the glacial flow, but may include a significant vertical component (subsidence due to ice melt) (Thompson et al., 2016).
Rock Glaciers and Rockslides: Distribution and Controlling Factors
By focusing on two specific types of periglacial previously inventoried landforms in the study area, the advantages of both a morphologic and a kinematic approach have been combined (Sections 5.2–5.3). The updated inventories allow for studying the relations between the landform distribution, the kinematics and the topo-climatic factors. The mean elevation and the creep rate of the inventoried rock glaciers (RG) increase toward the continental interior (Figure 12A). The western and central parts of the area are dominated by relict RG (kinematic attribute <0.3 cm/yr), located at low altitude. The highest parts of the terrain are either permafrost-free (e.g. in the westernmost part of the study area), or occupied by large glacial systems (e.g. Lyngen peninsula). The occurrence of active landforms increases towards SE. Most of the active landforms are located above 600 m a.s.l. A cluster of active RG with kinematics between cm/yr and m/yr is found at 65–85 km along a NW–SE profile following the continental gradient. These RG are mostly located above 800 m a.s.l. (Figure 12A), corresponding to the area East from Storfjord-Lyngenfjord, where permafrost limit has been reported at similar elevations (Farbrot et al., 2013; Gisnås et al., 2017). A similar cluster is found for the rockslides (RS) (Figure 12B), but the elevation/continentality trend is less pronounced, which indicates that the distribution of these landforms is likely controlled by other factors. Most of RS with mean elevations above 800 m a.s.l remain undefined kinematically, mostly due the dynamics of superimposed periglacial processes (such as RG) that mask out the signal of the rock mass. The analysis of the mean slope angle and slope orientation highlights a cluster of RG and RS landforms on west-facing slopes (Figures 12C–D). Low-angled RG are mostly relict (kinematic attribute <0.3 cm/yr) (Figure 12C).
FIGURE 12. Rock glacier (RG) and rockslide (RS) distribution and topo-climatic factors. Left: Relation between kinematic attribute, mean elevation and continentality for the inventoried RG (A) and RS (B). X-axis: Distance along NW–SE continental gradient (landforms projected along profile P–P’, Figure 1). Right: Relation between kinematic attribute, slope angle and slope orientation for the inventoried RG (C) and RS (D). Mean elevation, slope angle and orientation are based on a 10 m DEM (NMA, 2016).
The control of geological factors is studied by analysing the proportion of inventoried landforms within the major lithology types, based on geological maps from the Geological Survey of Norway (NGU, 2020a; Zwaan, 1988; Zwaan et al., 1998). For sake of simplification, the initial map has been divided into three main categories based on their lithologies and the assumed strength of the rock mass, inspired by the classification applied by Erener and Düzgün. (2010): 1 massive rocks (such as gabbro, tonalite and peridotite), 2) strongly foliated rocks (such as mica shist, quartz schist and phyllite), and 3) weakly foliated rocks (such as marble, metasandstone and quartzite) (Figure 13A). Comparing the fraction of landforms falling into each geological category with the overall distribution in the land area, we see that both RG and RS are clearly over-represented in strongly foliated rocks (Figure 13B). This category corresponds to 40% of the land area, but 283 RG units (68% of the inventoried sites) and 90 RS (77% of the inventoried sites) take place in this rock type. The mean slope orientation at the sites is also analysed, which highlights an over-representation of landforms on west-facing slopes (225–315° compass dip direction). While 28% of the land area have a W-orientation, 249 RG units (60%) and 70 RS (60%) are represented in this category. This can indicate a topo-climatic influence, but is also consistent with the general architecture of trusted nappe complex, controlling the orientation of the dominant foliation, the major faults, joints and shear zones (Figure 13A, black lines). It is in line with the documented evidence of structural control of rock slope deformation in the area (Braathen et al., 2004; Blikra et al., 2006; Osmundsen et al., 2009; Bunkholt et al., 2012; Vick et al., 2020). It also concurs with the conclusions of other studies highlighting the significance of geological preconditioning factors in the development of both rock glaciers (Johnsen et al., 2007; Falaschi et al., 2014; Onaca et al., 2017) and rockslides (Crosta et al., 2013; Stead and Wolter, 2015; Pedrazzini et al., 2016; Dini et al., 2020).
FIGURE 13. Rock glacier (RG) and rockslide (RS) distribution and geological factors. (A) Simplified geological map, classified into 1135 three main rock types (massive, strongly foliated and weakly foliated) and structural information 1136 (major faults, joints and shear zones) from a 1:250 000 geological map of the area (NGU, 2020a; 1137 Zwaan, 1988; Zwaan et al., 1998). (B) Pie charts comparing the fraction of rock type and slope 1138 orientation for all land areas and RG/RS landforms. Slope orientation is based on a 10 m DEM 1139 (NMA, 2016).
Here we proposed a first attempt of discussion about the distribution, dynamics and controlling factors of RG and RS in Northern Norway, focusing on climatic, topographic and geological variables. The updated regional inventories including a kinematic information constitute new valuable datasets to be exploited in future studies about the controls of slope processes in subarctic environments. Comprehensive rock glaciers inventories can be further used to complement the kilometric global permafrost products (Obu et al., 2019) and refine the mapping of permafrost zones in mountainous regions, as also discussed by Marcer et al. (2017) and Colucci et al. (2019). The relationship between environmental factors, landform distribution and ground velocity can bring forward our understanding of geomorphological processes in cryo-conditioned landscapes. It may provide complementary datasets to constrain or validate landscape evolution modelling (Lilleøren et al., 2012; Hilger et al., 2021). Analysing jointly RG and RS distribution and kinematics may also highlight new findings about the significance of composite landforms and combined processes in mountainous landscapes.
Conclusion
In this study, we developed semi-quantitative classified InSAR products to summarize kinematic information about slope movements and investigated periglacial processes in a mountainous area of Northern Norway. The methodology combines some of the strengths of commonly used InSAR techniques, to semi-automate the analysis, identify moving areas and cover a large range of ground velocities. Although the procedure takes benefit of a large set of satellite images, it summarizes several velocity maps into products easily exploitable by nonexperts. Complementing six velocity classes with three additional layers emphasizes the main typical InSAR limitations in mountainous environments and allows for differentiating the areas where there is no or low velocity, areas with no data and those where the available information must be threated carefully.
Based on the results, three main conclusions can be drawn:
1) Moving areas were identified and categorised by landform types (rock glaciers, rockslide, glaciers/moraines, talus/scree deposits, solifluction/cryoturbation and composite landforms). The InSAR kinematic inventory shows that the velocity ranges and spatial distribution of the different types of slope processes vary greatly within the study area.
2) InSAR products contributed to update the existing inventories of rock glaciers and rockslides. Delineations and units’ division were refined, and newly detected landforms (54 rock glaciers and 20 rockslides) included in the databases. The updated inventories consist of 414 rock glacier units within 340 systems and 117 rockslides. A kinematic attribute documenting the magnitude order of the mean annual ground velocity was assigned to each inventoried landform.
3) Topo-climatic factors control the spatial distribution of the rock glaciers. Mean elevation of the rock glaciers increases towards the continental interior with a dominance of relict landforms in the NW and an increased occurrence of active landform towards the SE. Rock glaciers and rockslides are mostly located on W-facing slopes and in areas characterised by strongly foliated rocks. This distribution highlights the importance of geological preconditioning controls for both landform types.
Our study emphasizes the complementarity of kinematic and morphologic approaches for the inventory of slope processes in complex periglacial environments. It shows the value of simplifying complex InSAR datasets for geoscientific applications. With the development of national to multi-national InSAR mapping services, the ability to identify moving areas over entire mountain ranges is dramatically increasing. However, relating the detected velocities to their causes remains a challenging task at large scale, due to the variety of processes occurring in mountainous regions and the combination of landforms at similar locations, such as rock glaciers and scree deposits overlying or spatially connected to rockslides. Further research towards a more comprehensive use of InSAR to categorise the ground velocity and relate detected moving areas to specific landforms is needed to scale up the exploitation of InSAR for geomorphological studies, cryospheric science and geohazard assessment.
Data Availability Statement
The datasets presented in this study can be found in the Pangaea repository: https://doi.pangaea.de/10.1594/PANGAEA.930856.
Author Contributions
LR, LB, and TL discussed and developed the original idea. LR processed the InSAR results, with contribution from YL. LR analysed the InSAR inventory and updated the inventories, with contributions from KL, MB, and RD. RD leads the IPA Action Group “Rock glacier inventories and kinematics”, defining international recommendations towards standardized inventories and time series. KL and MB led the development of the initial inventories. MB compiled the dGNSS data. LR led the interpretation and manuscript writing. KL, RD, and BE contributed to the discussion related to rock glaciers. MB, LV, and LB contributed to the discussion related to rockslides. YL and TL contributed to the discussion of InSAR results. All co-authors have commented on the manuscript.
Funding
LR PhD study is funded by the Research Council of Norway (FrostInSAR project nr. 263005). The kinematic inventory and update of the rock glacier inventory has been supported by the ESA Climate Change Initiative (CCI) Permafrost CCN2 project (4000123681/18/I-NB)(https://climate.esa.int/en/projects/permafrost/). The development of the GSAR processing chain and previous research applying InSAR in periglacial environments have been supported by the Norwegian Space Centre, the Research Council of Norway (project nr. 212022) and the European Space Agency (project nr. 4000106830 and 4000119115).
Conflict of Interest
The authors declare that the research was conducted in the absence of any commercial or financial relationships that could be construed as a potential conflict of interest.
Publisher’s Note
All claims expressed in this article are solely those of the authors and do not necessarily represent those of their affiliated organizations, or those of the publisher, the editors and the reviewers. Any product that may be evaluated in this article, or claim that may be made by its manufacturer, is not guaranteed or endorsed by the publisher.
Acknowledgments
We acknowledge the whole CCI Permafrost team for its work on delivering remotely sensed ECV products documenting permafrost state. We are grateful to the International Permafrost Association for its support to the Action Group “Rock glacier inventories and kinematics”, which is defining international recommendations towards standardized rock glacier inventories and time series of permafrost creep rate as climate change indicator (https://www3.unifr.ch/geo/geomorphology/en/research/ipa-action-group-rock-glacier/). Sentinel-1 scenes were provided by the EU Copernicus data service (2015–2019). We thank Henrik Sandbakken and the students of the SGG.00251 UNIFR course for commenting on an early version of the manuscript.
Supplementary Material
The Supplementary Material for this article can be found online at: https://www.frontiersin.org/articles/10.3389/feart.2021.681088/full#supplementary-material
References
Andreassen, L. M., and Winsvold, S. H. (2012). Inventory of Norwegian Glaciers. NVE Report 38, 236 pp., Norges Vassdrags- og Energidirektorat. Available at: http://publikasjoner.nve.no/rapport/2012/rapport2012_38.pdf.
Augland, L. E., Andresen, A., Gasser, D., and Steltenpohl, M. G. (2014). Early Ordovician to Silurian Evolution of Exotic Terranes in the Scandinavian Caledonides of the Ofoten-Troms Area - Terrane Characterization and Correlation Based on New U-Pb Zircon Ages and Lu-Hf Isotopic Data. Geol. Soc. Lond. Spec. Publications 390 (1), 655–678. doi:10.1144/SP390.19
Ballantyne, C. K. (2002). A General Model of Paraglacial Landscape Response. The Holocene 12 (3), 371–376. doi:10.1191/0959683602hl553fa
Baran, I., Stewart, M. P., Kampes, B. M., Perski, Z., and Lilly, P. (2003). A Modification to the Goldstein Radar Interferogram Filter. IEEE Trans. Geosci. Remote Sensing 41 (9), 2114–2118. doi:10.1109/TGRS.2003.817212
Barboux, C., Delaloye, R., and Lambiel, C. (2014). Inventorying Slope Movements in an Alpine Environment Using DInSAR. Earth Surf. Process. Landforms 39 (15), 2087–2099. doi:10.1002/esp.3603
Barboux, C., Strozzi, T., Delaloye, R., Wegmüller, U., and Collet, C. (2015). Mapping Slope Movements in Alpine Environments Using TerraSAR-X Interferometric Methods. ISPRS J. Photogrammetry Remote Sensing 109, 178–192. doi:10.1016/j.isprsjprs.2015.09.010
Berardino, P., Fornaro, G., Lanari, R., and Sansosti, E. (2002). A New Algorithm for Surface Deformation Monitoring Based on Small Baseline Differential SAR Interferograms. IEEE Trans. Geosci. Remote Sensing 40 (11), 2375–2383. doi:10.1109/TGRS.2002.803792
Bergh, S. G., Eig, K., Kløvjan, O. S., Henningsen, T., Olesen, O., and Hansen, J. A. (2007). The Lofoten-Vesterålen continental Margin: a Multiphase Mesozoic-Palaeogene Rifted Shelf as Shown by Offshore-Onshore Brittle Fault-Fracture Analysis. Norw. J. Geol. 87 (1), 29–58.
Berthling, I. (2011). Beyond Confusion: Rock Glaciers as Cryo-Conditioned Landforms. Geomorphology 131, 98–106. doi:10.1016/j.geomorph.2011.05.002
Blikra, L. H., Longva, O., Braathen, A., Anda, E., Dehls, J. F., and Stalsberg, K. (2006). Rock Slope Failures in Norwegian Fjord Areas: Examples, Spatial Distribution and Temporal Pattern. Landslides Massive Rock Slope Fail., 475–496. doi:10.1007/978-1-4020-4037-5_26
Blikra, L. H., Henderson, I., and Nordvik, T. (2009). Faren for fjellskred fra Nordnesfjellet i Lyngenfjorden, Troms [In Norwegian]. NGU report 2009.026, Available at: https://hdl.handle.net/11250/2664691.
Blikra, L. H., and Kristensen, L. (2013). “Monitoring Concepts and Requirements for Large Rockslides in Norway,” in Landslide Science and Practice (Berlin, Heidelberg: Springer), 193–200. doi:10.1007/978-3-642-31445-2_25
Blikra, L. H., and Christiansen, H. H. (2014). A Field-Based Model of Permafrost-Controlled Rockslide Deformation in Northern Norway. Geomorphology 208, 34–49. doi:10.1016/j.geomorph.2013.11.014
Blikra, L. H., Christiansen, H. H., Kristensen, L., and Lovisolo, M. (2015). “Characterization, Geometry, Temporal Evolution and Controlling Mechanisms of the Jettan Rock-Slide, Northern Norway,” in Engineering Geology for Society and Territory (Cham: Springer), 2, 273–278. doi:10.1007/978-3-319-09057-3_40
Bodin, X., Krysiecki, J.-M., Schoeneich, P., Le Roux, O., Lorier, L., Echelard, T., et al. (2017). The 2006 Collapse of the Bérard Rock Glacier (Southern French Alps). Permafrost Periglac. Process. 28 (1), 209–223. doi:10.1002/ppp.1887
Böhme, M., Bunkholt, H., Dehls, J., Oppikofer, T., Hermanns, R., Dalsegg, E., et al. (2016). Geologisk Modell Og Fare-Og Risikoklassifisering Av Det Ustabile Fjellpartiet Gamanjunni 3 I Manndalen, Troms [in Norwegian]. NGU report 2016.031. Geological Survey of Norway. Available at: https://hdl.handle.net/11250/2664288.
Böhme, M., Hermanns, R. L., Gosse, J., Hilger, P., Eiken, T., Lauknes, T. R., et al. (2019). Comparison of Monitoring Data with Paleo–Slip Rates: Cosmogenic Nuclide Dating Detects Acceleration of a Rockslide. Geology 47, 1–4. doi:10.1130/G45684.1/4655152/g45684.pdf
Bouali, E. H., Oommen, T., and Escobar-Wolf, R. (2018). Mapping of Slow Landslides on the Palos Verdes Peninsula Using the California Landslide Inventory and Persistent Scatterer Interferometry. Landslides 15 (3), 439–452. doi:10.1007/s10346-017-0882-z
Braathen, A., Blikra, L. H., Berg, S. S., and Karlsen, F. (2004). Rock-slope Failures in Norway; Type, Geometry, Deformation Mechanisms and Stability. Norw. J. Geol. 84, 67–88.
Bunkholt, H., Redfield, T. F., Osmundsen, P. T., Oppikofer, T., Hermanns, R. L., and Dehls, J. F. (2012). “Landslide Processes in Hard Rock in Troms, Norway,” in Landslides and Engineered Slopes. Editors E. Eberhardt, C. Froese, and K. Turner, (Florida, US: CRC), 855–861.
Cavalié, O., Doin, M.-P., Lasserre, C., and Briole, P. (2007). Ground Motion Measurement in the Lake Mead Area, Nevada, by Differential Synthetic Aperture Radar Interferometry Time Series Analysis: Probing the Lithosphere Rheological Structure. J. Geophys. Res. 112 (B3). doi:10.1029/2006JB004344
Chen, C. W., and Zebker, H. A. (2002). Phase Unwrapping for Large SAR Interferograms: Statistical Segmentation and Generalized Network Models. IEEE Trans. Geosci. Remote Sensing 40 (8), 1709–1719. doi:10.1109/TGRS.2002.802453
Christiansen, H. H., Etzelmüller, B., Isaksen, K., Juliussen, H., Farbrot, H., Humlum, O., et al. (2010). The thermal State of Permafrost in the Nordic Area during the International Polar Year 2007-2009. Permafrost Periglac. Process. 21 (2), 156–181. doi:10.1002/ppp.687
Cicoira, A., Beutel, J., Faillettaz, J., and Vieli, A. (2019). Water Controls the Seasonal Rhythm of Rock Glacier Flow. Earth Planet. Sci. Lett. 528, 115844. doi:10.1016/j.epsl.2019.115844
Colucci, R. R., Forte, E., Žebre, M., Maset, E., Zanettini, C., and Guglielmin, M. (2019). Is that a Relict Rock Glacier? Geomorphology 330, 177–189. doi:10.1016/j.geomorph.2019.02.002
Corner, G. D. (2005). “Scandes Mountains,” in The Physical Geography of Fennoscandia. Editor M. Seppälä (Oxford, UK: Oxford University Press), 468.
Crosta, G. B., Frattini, P., and Agliardi, F. (2013). Deep Seated Gravitational Slope Deformations in the European Alps. Tectonophysics 605, 13–33. doi:10.1016/j.tecto.2013.04.028
Crosta, G. B., Agliardi, F., Rivolta, C., Alberti, S., and Dei Cas, L. (2017). Long-term Evolution and Early Warning Strategies for Complex Rockslides by Real-Time Monitoring. Landslides 14 (5), 1615–1632. doi:10.1007/s10346-017-0817-8
Dehls, J. F., Larsen, Y., Marinkovic, P., Lauknes, T. R., Stodle, D., and Moldestad, D. A. (2019). “INSAR.No: A National Insar Deformation Mapping/Monitoring Service in Norway -- from Concept to Operations”, in Proceedings of IGARSS 2019, IEEE International Geoscience and Remote Sensing Symposium, Yokohama, Japan, July 28-Aug 2, 2019, 5461–5464. doi:10.1109/IGARSS.2019.8898614
Delaloye, R., Lambiel, C., Lugon, R., Raetzo, H., and Strozzi, T. (2007). “Typical ERS InSAR Signature of Slope Movements in a Periglacial Mountain Environment (Swiss Alps),” in Proceedings Envisat Symposium 2007 (Switzerland: Montreux), 23–27.
Delaloye, R., Lambiel, C., and Gärtner-Roer, I. (2010). Overview of Rock Glacier Kinematics Research in the Swiss Alps. Geogr. Helv. 65 (2), 135–145. doi:10.5194/gh-65-135-2010
Delaloye, R., Morard, S., Barboux, C., Abbet, D., Gruber, V., Riedo, M., et al. (2013). “Rapidly Moving Rock Glaciers in Mattertal,” in Mattertal–ein Tal in Bewegung, Publikation zur Jahrestagung der Schweizerischen Geomorphologischen Gesellschaft. Editor C. Graf (Birmensdorf: Eidg. Forschungsanstalt für Wald, Schnee und Landschaft WSL), 29, 21–31.
Delaloye, D., and Staub, B. (2016). “Seasonal Variations of Rock Glacier Creep: Time Series Observations from the Western Swiss Alps”, in Proceedings of the XI. International Conference on Permafrost, Potsdam, Germany, June 20–24, 2016.
Delaloye, D., Lambiel, C., Staub, B., Kummert, M., Morra di Cella, U., and Pogliotti, P. (2017). Accelerating versus Decelerating Rock Glaciers in the Context of Ongoing Climate Warming, Asian Conference on Permafrost, Sapporo, Japan, July 2–6, 2017.
Dini, B., Daout, S., Manconi, A., and Loew, S. (2019). Classification of Slope Processes Based on Multitemporal DInSAR Analyses in the Himalaya of NW Bhutan. Remote Sensing Environ. 233, 111408. doi:10.1016/j.rse.2019.111408
Dini, B., Aaron, J., Manconi, A., De Palezieux, L., Leith, K., and Loew, S. (2020). Regional‐Scale Investigation of Preconditioning Factors of Rock Slope Instabilities in NW Bhutan. J. Geophys. Res. Earth Surf. 125 (9), e2019JF005404. doi:10.1029/2019JF005404
Eberhardt, E., Preisig, G., and Gischig, V. (2016). “Progressive Failure in Deep-Seated Rockslides Due to Seasonal Fluctuations in Pore Pressures and Rock Mass Fatigue, Landslides and Engineered Slopes. Experience, Theory and Practice,” in, Proceedings of the 12th International Symposium on Landslides, Napoli, Italy, June 12–19 2016, 121–136. doi:10.1201/b21520-13
Eckerstorfer, M., Eriksen, H. Ø., Rouyet, L., Christiansen, H. H., Lauknes, T. R., and Blikra, L. H. (2018). Comparison of Geomorphological Field Mapping and 2D-InSAR Mapping of Periglacial Landscape Activity at Nordnesfjellet, Northern Norway. Earth Surf. Process. Landforms 43 (10), 2147–2156. doi:10.1002/esp.4380
Erener, A., and Düzgün, H. S. B. (2010). Improvement of Statistical Landslide Susceptibility Mapping by Using Spatial and Global Regression Methods in the Case of More and Romsdal (Norway). Landslides 7 (1), 55–68. doi:10.1007/s10346-009-0188-x
Eriksen, H. Ø., Lauknes, T. R., Larsen, Y., Corner, G. D., Bergh, S. G., Dehls, J., et al. (2017a). Visualizing and Interpreting Surface Displacement Patterns on Unstable Slopes Using Multi-Geometry Satellite SAR Interferometry (2D InSAR). Remote Sensing Environ. 191, 297–312. doi:10.1016/j.rse.2016.12.024
Eriksen, H. Ø., Bergh, S. G., Larsen, Y., Skrede, I., Kristensen, L., Lauknes, T. R., et al. (2017b). Relating 3D Surface Displacement from Satellite- and Ground-Based InSAR to Structures and Geomorphology of the Jettan Rockslide, Northern Norway. Njg 97 (4), 283–303. doi:10.17850/njg97-4-03
Eriksen, H. Ø., Rouyet, L., Lauknes, T. R., Berthling, I., Isaksen, K., Hindberg, H., et al. (2018). Recent Acceleration of a Rock Glacier Complex, Ádjet, Norway, Documented by 62 Years of Remote Sensing Observations. Geophys. Res. Lett. 45 (16), 8314–8323. doi:10.1029/2018GL077605
Etzelmüller, B., Patton, H., Schomacker, A., Czekirda, J., Girod, L., Hubbard, A., et al. (2020). Icelandic Permafrost Dynamics since the Last Glacial Maximum - Model Results and Geomorphological Implications. Quat. Sci. Rev. 233, 106236. doi:10.1016/j.quascirev.2020.106236
Falaschi, D., Castro, M., Masiokas, M., Tadono, T., and Ahumada, A. L. (2014). Rock Glacier Inventory of the Valles Calchaquíes Region (∼ 25°S), Salta, Argentina, Derived from ALOS Data. Permafrost Periglac. Process. 25 (1), 69–75. doi:10.1002/ppp.1801
Farbrot, H., Isaksen, K., Etzelmüller, B., and Gisnås, K. (2013). Ground thermal Regime and Permafrost Distribution under a Changing Climate in Northern Norway. Permafrost Periglac. Process. 24 (1), 20–38. doi:10.1002/ppp.1763
Ferretti, A., Prati, C., and Rocca, F. (2001). Permanent Scatterers in SAR Interferometry. IEEE Trans. Geosci. Remote Sensing 39 (1), 8–20. doi:10.1109/36.898661
Geertsema, M., Clague, J. J., Schwab, J. W., and Evans, S. G. (2006). An Overview of Recent Large Catastrophic Landslides in Northern British Columbia, Canada. Eng. Geology 83 (1-3), 120–143. doi:10.1016/j.enggeo.2005.06.028
Gisnås, K., Etzelmüller, B., Farbrot, H., Schuler, T. V., and Westermann, S. (2013). CryoGRID 1.0: Permafrost Distribution in Norway Estimated by a Spatial Numerical Model. Permafrost Periglac. Process. 24 (1), 2–19. doi:10.1002/ppp.1765
Gisnås, K., Etzelmüller, B., Lussana, C., Hjort, J., Sannel, A. B. K., Isaksen, K., et al. (2017). Permafrost Map for Norway, Sweden and Finland. Permafrost Periglac. Process. 28 (2), 359–378. doi:10.1002/ppp.1922
Goldstein, R. M., and Werner, C. L. (1998). Radar Interferogram Filtering for Geophysical Applications. Geophys. Res. Lett. 25 (21), 4035–4038. doi:10.1029/1998GL900033
Gruber, S. (2020). Ground Subsidence and Heave over Permafrost: Hourly Time Series Reveal Interannual, Seasonal and Shorter-Term Movement Caused by Freezing, Thawing and Water Movement. The Cryosphere 14 (4), 1437–1447. doi:10.5194/tc-14-1437-2020
Gruber, S., and Haeberli, W. (2009). “Mountain Permafrost,” in Permafrost Soils (Berlin, Heidelberg: Springer), 33–44. doi:10.1007/978-3-540-69371-0_3
Harris, C., Kern-Luetschg, M., Murton, J., Font, M., Davies, M., and Smith, F. (2008). Solifluction Processes on Permafrost and Non-permafrost Slopes: Results of a Large-Scale Laboratory Simulation. Permafrost Periglac. Process. 19 (4), 359–378. doi:10.1002/ppp.630
Hermanns, R., Oppikofer, T., Anda, E., Blikra, L., Böhme, M., Bunkholt, H., et al. (2013). Hazard and Risk Classification for Large Unstable Rock Slopes in Norway. Ital. J. Eng. Geology Environ. Book Ser. 6, 245–254. doi:10.4408/IJEGE.2013-06.B-22
Hermanns, R. L., Oppikofer, T., Böhme, M., Dehls, J. F., Yugsi Molina, F. X., and Penna, I. M. (2016). “Rock Slope Instabilities in Norway: First Systematic hazard and Risk Classification of 22 Unstable Rock Slopes from Northern, Western and Southern Norway”, in Landslides and Engineered Slopes. Experience, Theory and Practice–Proceedings of the 12th International Symposium on Landslides, Napoli, Italy, June 12-19 2016. doi:10.1201/b21520-133
Hilger, P., Hermanns, R. L., Czekirda, J., Myhra, K. S., Gosse, J. C., and Etzelmüller, B. (2021). Permafrost as a First Order Control on Long-Term Rock-Slope Deformation in (Sub-)Arctic Norway. Quat. Sci. Rev. 251, 106718. doi:10.1016/j.quascirev.2020.106718
Hjort, J., Ujanen, J., Parviainen, M., Tolgensbakk, J., and Etzelmüller, B. (2014). Transferability of Geomorphological Distribution Models: Evaluation Using Solifluction Features in Subarctic and Arctic Regions. Geomorphology 204, 165–176. doi:10.1016/j.geomorph.2013.08.002
Ikeda, A., Matsuoka, N., and Kääb, A. (2008). Fast Deformation of Perennially Frozen Debris in a Warm Rock Glacier in the Swiss Alps: An Effect of Liquid Water. J. Geophys. Res. 113 (F1). doi:10.1029/2007JF000859
Isaksen, K., Sollid, J. L., Holmlund, P., and Harris, C. (2007). Recent Warming of Mountain Permafrost in Svalbard and Scandinavia. J. Geophys. Res. 112 (F2). doi:10.1029/2006JF000522
Jaboyedoff, M., Penna, I., Pedrazzini, A., Baroň, I., and Crosta, G. B. (2013). An Introductory Review on Gravitational-Deformation Induced Structures, Fabrics and Modeling. Tectonophysics 605, 1–12. doi:10.1016/j.tecto.2013.06.027
Johnson, B. G., Thackray, G. D., and Van Kirk, R. (2007). The Effect of Topography, Latitude, and Lithology on Rock Glacier Distribution in the Lemhi Range, central Idaho, USA. Geomorphology 91 (1-2), 38–50. doi:10.1016/j.geomorph.2007.01.023
Kääb, A., Huggel, C., Fischer, L., Guex, S., Paul, F., Roer, I., et al. (2005). Remote Sensing of Glacier- and Permafrost-Related Hazards in High Mountains: an Overview. Nat. Hazards Earth Syst. Sci. 5, 527–554. doi:10.5194/nhess-5-527-2005
Kääb, A., Frauenfelder, R., and Roer, I. (2007). On the Response of Rockglacier Creep to Surface Temperature Increase. Glob. Planet. Change 56 (1-2), 172–187. doi:10.1016/j.gloplacha.2006.07.005
Kääb, A., Strozzi, T., Bolch, T., Caduff, R., Trefall, H., Stoffel, M., et al. (2021). Inventory and Changes of Rock Glacier Creep Speeds in Ile Alatau and Kungöy Ala-Too, Northern Tien Shan, since the 1950s. The Cryosphere 15, 927–949. doi:10.5194/tc-15-927-2021
Karjalainen, O., Luoto, M., Aalto, J., Etzelmüller, B., Grosse, G., Jones, B. M., et al. (2020). High Potential for Loss of Permafrost Landforms in a Changing Climate. Environ. Res. Lett. 15, 104065. doi:10.1088/1748-9326/abafd5
Kenner, R., Phillips, M., Beutel, J., Hiller, M., Limpach, P., Pointner, E., et al. (2017). Factors Controlling Velocity Variations at Short-Term, Seasonal and Multiyear Time Scales, Ritigraben Rock Glacier, Western Swiss Alps. Permafrost Periglac. Process. 28 (4), 675–684. doi:10.1002/ppp.1953
Keuschnig, M., Hartmeyer, I., Höfer-Öllinger, G., Schober, A., Krautblatter, M., and Schrott, L. (2015). “Permafrost-related Mass Movements: Implications from a Rock Slide at the Kitzsteinhorn, Austria,” in Engineering Geology for Society and Territory (Cham: Springer), 1, 255–259. doi:10.1007/978-3-319-09300-0_48
Kristensen, L., Czekirda, J., Penna, I., Etzelmüller, B., Nicolet, P., Pullarello, J. S., et al. (2021). Movements, Failure and Climatic Control of the Veslemannen Rockslide, Western Norway. Landslides 18 (6), 1963–1980. doi:10.1007/s10346-020-01609-x
Larsen, Y., Engen, G., Lauknes, T. R., Malnes, E., and Høgda, K. A. (2005). A Generic Differential Interferometric SAR Processing System, with Applications to Land Subsidence and Snow-Water Equivalent Retrieval, in Proceedings of Fringe 2005 Workshop, Frascati, Italy, November 28-December 2, 2005, (ESA SP-610), 61.
Larsen, Y., Marinkovic, P., Dehls, J., Bredal, M., Bishop, C., Jøkulsson, G., et al. (2020). European Ground Motion Service: Service Implementation Plan and Product Specification Document. Copenhagen: EU-EEA Delegation Agreement Copernicus Land Monitoring Service, 166 pp. Available at: https://land.copernicus.eu/pan-european/european-ground-motion-service.
Lauknes, T. R., Piyush Shanker, A., Dehls, J. F., Zebker, H. A., Henderson, I. H. C., and Larsen, Y. (2010). Detailed Rockslide Mapping in Northern Norway with Small Baseline and Persistent Scatterer Interferometric SAR Time Series Methods. Remote Sensing Environ. 114 (9), 2097–2109. doi:10.1016/j.rse.2010.04.015
Lauknes, T. R. (2011a). Rockslide Mapping in Norway by Means of Interferometric SAR Time Series Analysis Ph.D. Thesis. Tromsø, Norway: The Arctic University of Norway UiT.
Lauknes, T. R. (2011b). InSAR Tropospheric Stratification Delays: Correction Using a Small Baseline Approach. IEEE Geosci. Remote Sensing Lett. 8 (6), 1070–1074. doi:10.1109/LGRS.2011.2156381
Lilleøren, K. S., and Etzelmüller, B. (2011). A Regional Inventory of Rock Glaciers and Ice‐cored Moraines in norway. Geografiska Annaler: Ser. A, Phys. Geogr. 93, 175–191. doi:10.1111/j.1468-0459.2011.00430.x
Lilleøren, K. S., Etzelmüller, B., Schuler, T. V., Gisnås, K., and Humlum, O. (2012). The Relative Age of Mountain Permafrost - Estimation of Holocene Permafrost Limits in Norway. Glob. Planet. Change 92-93, 209–223. doi:10.1016/j.gloplacha.2012.05.016
Lilleøren, K. S., Etzelmüller, B., Gärtner-Roer, I., Kääb, A., Westermann, S., and Guðmundsson, Á. (2013). The Distribution, Thermal Characteristics and Dynamics of Permafrost in Tröllaskagi, Northern Iceland, as Inferred from the Distribution of Rock Glaciers and Ice-Cored Moraines. Permafrost Periglac. Process. 24, 322–335. doi:10.1002/ppp.1792
Liu, L., Millar, C. I., Westfall, R. D., and Zebker, H. A. (2013). Surface Motion of Active Rock Glaciers in the Sierra Nevada, California, USA: Inventory and a Case Study Using InSAR. The Cryosphere 7, 1109–1119. doi:10.5194/tc-7-1109-2013
Luckman, B. H. (2017). “Glacier Landscapes in the Canadian Rockies,” in Landscapes and Landforms of Western Canada (Cham: Springer), 241–255. doi:10.1007/978-3-319-44595-3_17
Marcer, M., Bodin, X., Brenning, A., Schoeneich, P., Charvet, R., and Gottardi, F. (2017). Permafrost Favorability index: Spatial Modeling in the French Alps Using a Rock Glacier Inventory. Front. Earth Sci. 5, 105. doi:10.3389/feart.2017.00105
Matsuoka, N. (2001). Solifluction Rates, Processes and Landforms: a Global Review. Earth-sci. Rev. 55 (1-2), 107–134. doi:10.1016/S0012-8252(01)00057-5
Müller, J., Vieli, A., and Gärtner-Roer, I. (2016). Rock Glaciers on the Run - Understanding Rock Glacier Landform Evolution and Recent Changes from Numerical Flow Modeling. The Cryosphere 10 (6), 2865–2886. doi:10.5194/tc-10-2865-2016
NCCS (2021). Observations and Weather Statistics, Stations Skibotn II, Tromsø–Langnes, Hekkingen Fyr and Botnhamn, 2010–2020 Daily and Yearly Air Temperature and Precipitation. Pune: Norwegian Centre for Climate Services NCCS. Available at: https://seklima.met.no/observations/(accessed 06 01, 2021).
NGU (2020a). Bedrock Maps, Berggrunn Data N250, Geological Survey of Norway. Available at: https://kartkatalog.geonorge.no/. Map viewerhttps://geo.ngu.no/kart/berggrunn_mobil/.
NGU (2020b). Unstable Rock Slope Inventory Map, Geological Survey of Norway. Map viewer, Available at: https://geo.ngu.no/kart/ustabilefjellparti_mobil/?lang=eng.
NGU (2020c). InSAR Norway, Geological Survey of Norway. Available at:www.insar.no. Map viewerhttps://insar.ngu.no/.
NMA (2011). Aerial Images 2006-07-28, 2006-08-20, 2006-08-24, 2011-08-16, 2011-08-17, Norwegian Mapping Authority. Available at: https://www.norgeibilder.no/.
NMA (2016). DTM 10 Terrengmodell (UTM33), Norwegian Mapping Authority. Available at: https://kartkatalog.geonorge.no/.
NMA (2020a). Toporaster 4 WMS, Norwegian Mapping Authority. Available at: https://kartkatalog.geonorge.no/.
NMA (2020b). Norge I Bilder WMTS (Euref89 UTM33). Aerial Images 2016-07-22, 2016-08-18, 2016-08-19, 2016-07-22, 2017-07-23. Norwegian Mapping Authority. Available at: https://www.norgeibilder.no/.
Obu, J., Westermann, S., Bartsch, A., Berdnikov, N., Christiansen, H. H., Dashtseren, A., et al. (2019). Northern Hemisphere Permafrost Map Based on TTOP Modelling for 2000-2016 at 1 Km2 Scale. Earth-Science Rev. 193, 299–316. doi:10.1016/j.earscirev.2019.04.023
Onaca, A., Ardelean, F., Urdea, P., and Magori, B. (2017). Southern Carpathian Rock Glaciers: Inventory, Distribution and Environmental Controlling Factors. Geomorphology 293, 391–404. doi:10.1016/j.geomorph.2016.03.032
Oppikofer, T., Nordahl, B., Bunkholt, H., Nicolaisen, M., Jarna, A., Iversen, S., et al. (2015). Database and Online Map Service on Unstable Rock Slopes in Norway - from Data Perpetuation to Public Information. Geomorphology 249, 69–81. doi:10.1016/j.geomorph.2015.08.005
Osmundsen, P. T., Henderson, I., Lauknes, T. R., Larsen, Y., Redfield, T. F., and Dehls, J. (2009). Active normal Fault Control on Landscape and Rock-Slope Failure in Northern Norway. Geology 37 (2), 135–138. doi:10.1130/G25208A.1
Østrem, G., and Ostrem, G. (1964). Ice-cored Moraines in Scandinavia. Geografiska Annaler 46 (3), 282–337. doi:10.1080/20014422.1964.1188104310.2307/520383
Patton, A. I., Rathburn, S. L., and Capps, D. M. (2019). Landslide Response to Climate Change in Permafrost Regions. Geomorphology 340, 116–128. doi:10.1016/j.geomorph.2019.04.029
Pedrazzini, A., Humair, F., Jaboyedoff, M., and Tonini, M. (2016). Characterisation and Spatial Distribution of Gravitational Slope Deformation in the Upper Rhone Catchment (Western Swiss Alps). Landslides 13, 259–277. doi:10.1007/s10346-015-0562-9
RGIK (2020). “Kinematics as an optional attribute in standardized rock glacier inventories (Version 2.1)”, IPA Action Group Rock glacier inventories and kinematics, 10 pp. Available at: https://bigweb.unifr.ch/Science/Geosciences/Geomorphology/Pub/Website/IPA/Guidelines/KinematicsAttribute/200429_KinematicsAttribute_V2.1.pdf.
RGIK (2021a). “Rock Glacier Kinematics as an associated parameter of ECV Permafrost (Version 2.1)”, Barboux C., Delaloye R., and Pellet C. (eds.), IPA Action Group Rock glacier inventories and kinematic, 14 pp. Available at: https://bigweb.unifr.ch/Science/Geosciences/Geomorphology/Pub/Website/IPA/RGK/210708_RockGlacierKinematics_V2.1.pdf
RGIK (2021b). “Towards standard guidelines for inventorying rock glaciers. Baseline Concepts (Version 4.2),” IPA Action Group Rock glacier inventories and kinematics, 13 pp. Available at: https://bigweb.unifr.ch/Science/Geosciences/Geomorphology/Pub/Website/IPA/CurrentVersion/Current_Baseline_Concepts_Inventorying_Rock_Glaciers.pdf.
Roer, I., Haeberli, W., Avian, M., Kaufmann, V., Delaloye, R., Lambiel, C., et al. (2008). “Observations and Considerations on Destabilizing Active Rock Glaciers in the European Alps”, in Proceedings of the 9th International Conference on Permafrost, Fairbanks, Alaska, June 29–July 3, 2008, 1505–1510.
Rosi, A., Tofani, V., Tanteri, L., Tacconi Stefanelli, C., Agostini, A., Catani, F., et al. (2018). The New Landslide Inventory of Tuscany (Italy) Updated with PS-InSAR: Geomorphological Features and Landslide Distribution. Landslides 15 (1), 5–19. doi:10.1007/s10346-017-0861-4
Rouyet, L., Lauknes, T. R., Christiansen, H. H., Strand, S. M., and Larsen, Y. (2019). Seasonal Dynamics of a Permafrost Landscape, Adventdalen, Svalbard, Investigated by InSAR. Remote Sensing Environ. 231, 111236. doi:10.1016/j.rse.2019.111236
Sandwell, D. T., and Price, E. J. (1998). Phase Gradient Approach to Stacking Interferograms. J. Geophys. Res. 103 (B12), 30183–30204. doi:10.1029/1998JB900008
Scapozza, C. (2015). Investigation on Protalus Ramparts in the Swiss Alps. Geographica Helvetica 70 (2), 135–139. doi:10.5194/gh-70-135-2015
Scotti, R., Brardinoni, F., Alberti, S., Frattini, P., and Crosta, G. B. (2013). A Regional Inventory of Rock Glaciers and Protalus Ramparts in the central Italian Alps. Geomorphology 186, 136–149. doi:10.1016/j.geomorph.2012.12.028
Smith, D. J. (1987). Solifluction in the Southern Canadian Rockies. Can. Geographer 31 (4), 309–318. doi:10.1111/j.1541-0064.1987.tb01656.x
Sollid, J. L., and Sørbel, L. (1992). Rock Glaciers in Svalbard and Norway. Permafrost Periglac. Process. 3 (3), 215–220. doi:10.1002/ppp.3430030307
Sollid, J. L., and Torp, B. (1984). “Glasialgeologisk Kart over Norge, 1:1 000 000 [in Norwegian],” in Nasjonalatlas for Norge (Oslo: Geografisk Institutt, Oslo Universitet).
Stead, D., and Wolter, A. (2015). A Critical Review of Rock Slope Failure Mechanisms: the Importance of Structural Geology. J. Struct. Geology. 74, 1–23. doi:10.1016/j.jsg.2015.02.002
Stoffel, M., Tiranti, D., and Huggel, C. (2014). Climate Change Impacts on Mass Movements - Case Studies from the European Alps. Sci. Total Environ. 493, 1255–1266. doi:10.1016/j.scitotenv.2014.02.102
Strozzi, T., Caduff, R., Jones, N., Barboux, C., Delaloye, R., Bodin, X., et al. (2020). Monitoring Rock Glacier Kinematics with Satellite Synthetic Aperture Radar. Remote Sensing 12 (3), 559. doi:10.3390/rs12030559
Thompson, S., Benn, D. I., Mertes, J., and Luckman, A. (2016). Stagnation and Mass Loss on a Himalayan Debris-Covered Glacier: Processes, Patterns and Rates. J. Glaciol. 62 (233), 467–485. doi:10.1017/jog.2016.37
Tolgensbakk, J., and Sollid, J. L. (1988). Kåfjord, Kvartærgeologi Og Geomorfologi. 1:50-000 [in Norwegian]. 1634 Ii. Oslo: Geografisk Instiutt, Universitetet i Oslo.
Vick, L. M., Böhme, M., Rouyet, L., Bergh, S. G., Corner, G. D., and Lauknes, T. R. (2020). Structurally Controlled Rock Slope Deformation in Northern Norway. Landslides 17, 1745–1776. doi:10.1007/s10346-020-01421-7
Villarroel, C., Tamburini Beliveau, G., Forte, A., Monserrat, O., and Morvillo, M. (2018). DInSAR for a Regional Inventory of Active Rock Glaciers in the Dry Andes Mountains of Argentina and chile with sentinel-1 Data. Remote Sensing 10 (10), 1588. doi:10.3390/rs10101588
Wang, X., Liu, L., Zhao, L., Wu, T., Li, Z., and Liu, G. (2017). Mapping and Inventorying Active Rock Glaciers in the Northern Tien Shan of China Using Satellite SAR Interferometry. The Cryosphere 11 (2), 997–1014. doi:10.5194/tc-11-997-2017
Wasowski, J., and Bovenga, F. (2014). Investigating Landslides and Unstable Slopes with Satellite Multi Temporal Interferometry: Current Issues and Future Perspectives. Eng. Geology 174, 103–138. doi:10.1016/j.enggeo.2014.03.003
Wilson, P. (2009). Rockfall Talus Slopes and Associated Talus-Foot Features in the Glaciated Uplands of Great Britain and Ireland: Periglacial, Paraglacial or Composite Landforms? Geol. Soc. Lond. Spec. Publications 320 (1), 133–144. doi:10.1144/SP320.9
Winsvold, S. H., Andreassen, L. M., and Kienholz, C. (2014). Glacier Area and Length Changes in Norway from Repeat Inventories. The Cryosphere 8, 1885–1903. doi:10.5194/tc-8-1885-2014
Zwaan, K. B. (1988). Bedrock Geology Map Nordreisa, M 1:250 000 [In Norwegian: Berggrunnsgeologisk Kart]. Trondheim: Geological Survey of Norway.
Zwaan, K. B., Farseth, E., and Grogan, P. (1998). Bedrock Geology Map Tromsø, M 1:250 000 [In Norwegian: Bergrunnsgeologisk Kart]. Trondheim: Geological Survey of Norway.
Keywords: slope movements, InSAR, periglacial, permafrost, subarctic, Norway, rock glacier, rockslide
Citation: Rouyet L, Lilleøren KS, Böhme M, Vick LM, Delaloye R, Etzelmüller B, Lauknes TR, Larsen Y and Blikra LH (2021) Regional Morpho-Kinematic Inventory of Slope Movements in Northern Norway. Front. Earth Sci. 9:681088. doi: 10.3389/feart.2021.681088
Received: 15 March 2021; Accepted: 25 October 2021;
Published: 25 November 2021.
Edited by:
Alun Hubbard, Aberystwyth University, United KingdomReviewed by:
Lukas U. Arenson, BGC Engineering, CanadaThomas Oommen, Michigan Technological University, United States
Copyright © 2021 Rouyet, Lilleøren, Böhme, Vick, Delaloye, Etzelmüller, Lauknes, Larsen and Blikra. This is an open-access article distributed under the terms of the Creative Commons Attribution License (CC BY). The use, distribution or reproduction in other forums is permitted, provided the original author(s) and the copyright owner(s) are credited and that the original publication in this journal is cited, in accordance with accepted academic practice. No use, distribution or reproduction is permitted which does not comply with these terms.
*Correspondence: Line Rouyet, liro@norceresearch.no