Feasibility Study of an Earthquake Early Warning System in Eastern Central Italy
 Chiara Ladina
 Simone Marzorati
 Alessandro Amato
 Marco Cattaneo1
- 1Istituto Nazionale di Geofisica e Vulcanologia, Osservatorio Nazionale Terremoti, Ancona, Italy
- 2Istituto Nazionale di Geofisica e Vulcanologia, Osservatorio Nazionale Terremoti, Roma, Italy
An earthquake early warning system (EEWS) is a monitoring infrastructure that allows alerting strategic points (targets) before the arrival of strong shaking waves during an earthquake. In a region like Central Italy, struck by recent and historical destructive earthquakes, the assessment of implementation of an EEWS is a significant challenge due to the proximity of seismic sources to many potential targets, such as historical towns, industrial plants, and hospitals. In order to understand the feasibility of an EEWS in such an area, we developed an original method of event declaration simulation (EDS), a tool for assessing the effectiveness of an EEWS for existing seismic networks, improving them with new stations, and designing new networks for EEW applications. Values of the time first alert (TFA), blind zone radius (BZ), and lead time (LT) have been estimated with respect to selected targets for different network configurations in the study region. Starting from virtual sources homogeneously arranged on regular mesh grids, the alert response was evaluated for actual and improved seismic networks operating in the area, taking into account the effects of the transmission and acquisition systems. In the procedure, the arrival times of the P wave picks, the association binder, the transmission latencies, and the computation times were used to simulate the configuration of PRESTo EEWS, simulating both real-time and playback elaborations of real earthquakes. The NLLOC software was used to estimate P and S arrival times, with a local velocity model also implemented in the PRESTo EEWS. Our results show that, although Italy’s main seismic sources are located close to urban areas, the lead times calculated with the EDS procedure, applied to actual and to improved seismic networks, encourage the implementation of EEWS in the study area. Considering actual delays due to data transmission and computation time, lead times of 5–10 s were obtained simulating real historical events striking some important targets of the region. We conclude that EEWSs are useful tools that can contribute to protecting people from the harmful effects of earthquakes in Italy.
1 Introduction
In the past twenty years, EEWSs have been implemented in different regions of the world and are considered a useful tool to reduce seismic risk (Satriano et al., 2011b). EEWSs were developed with different approaches, methodologies, and combining new experiences. At present, many countries have operational or prototype EEWSs. Allen et al. (2009b) described the status of EEW in the world and the principal operating systems at that time. Other examples include EEWS in Japan (Odaka et al., 2003), Taiwan (Wu and Teng, 2002; Hsiao et al., 2009), Mexico (Suarez et al., 2009), Turkey (Erdik et al., 2003; Alcik et al., 2009), and Romania (Böse et al., 2007). The principal active systems are based on the software ElarmS (Allen and Kanamori, 2003; Allen et al., 2009a) and ShakeAlert (Kohler et al., 2020) in California, on Virtual Seismologist in California and Switzerland (Cua et al., 2009), in Europe (Clinton et al., 2016), and in particular PRESTo in Italy (Iannaccone et al., 2010; Satriano et al., 2011a).
Major developments have led to two main types of systems: a regional alert system and an on-site system (Satriano et al., 2011b; Zollo et al., 2014). The regional system, based on the use of a regional network that records seismic events, aims to detect, locate, and determine the magnitude of an event starting from the analysis of a few seconds of the first arrivals of the P waves recorded at the stations (Picozzi, 2012). The on-site system consists of a single sensor or more sensors near or inside the target structure to be alerted. In this system the P-wave recordings to the sensor are used to predict the peak ground motion at the site (Colombelli et al., 2015). This approach could be considered useful for sites located within the BZ of a regional EEW system, allowing for a useful warning before the arrival of strong shaking waves. Caruso et al. (2017) proposed a P-wave-based EEW approach called on-site alert level (SAVE). Many studies combined the two EEW approaches (Zollo et al., 2010; Colombelli et al., 2012a); these systems combine local parameters and predicted ground motions at a regional scale to provide reliable and rapid estimates of the seismic source and the expected damage zone (Colombelli et al., 2015).
The approaches for regional EEW can be classified as the “point-source” (simply the source as a concentrated volume) or “finite fault” (a more sophisticated and realistic characterization of the source, considering the entire fault area). Most studies have used the “point-source” demonstrating the reliability of this approach for the magnitude estimation of small to moderate events. However, it has been shown that this approach is not always accurate for strong earthquakes (magnitude> 6.5–7), due to the saturation of the P-wave parameters. Several authors (for example, Colombelli et al., 2012b) estimated the magnitude over time windows longer than the recorded P-wave and/or the S-wave signal to obtain more accurate final values. These magnitude calculations are reliable at the cost of requiring more data and time (Velazquez et al., 2020). In our study, the selected earthquakes have a moderate magnitude (≤ 6.5) and were considered as point sources.
Potentially, an EEWS can produce and transmit alert messages to different end-users to allow them to adopt several types of safety measures in a few seconds. The main benefits of an EEWS include public warning, first responder mobilization, and safety of health care and utility infrastructures, transit systems, and workplaces (Allen and Melgar, 2019). Whereas in most cases evacuation of buildings is unrealistic, due to the short time available to act; a portion of the affected population can receive the alert and take safety measures in certain types of structures and infrastructures (Iervolino et al., 2008).
Receiving an alert message increases personal situational awareness and yields a more rapid response, especially in well-trained people who can take precautionary and protective actions like “Drop-Cover-Hold on”, suspending delicate medical procedures, or slowing down a train ride. In shaking areas, a time of 10 s allows people to protect themselves and prepare for evacuation (Fujinawa and Noda, 2013). A time interval of 5–7 s could be enough to trigger automatic mitigation actions (Cauzzi et al., 2016) at power plants, energy sector grids, and utilities infrastructures to prevent explosions, combustions, loss of water, flooding, fatal collisions, and elevator interruptions. Social studies have demonstrated that receiving alert messages even a few seconds before the shaking occurs help people to prepare and react in the proper way (Dunn et al., 2016; Becker et al., 2020a).
The elongated shape of the Italian peninsula, combined with the small damage area for moderate, but often destructing Apenninic earthquakes (M6-7), determine small distances between sources and potential EEW targets. For this reason, in many cases the time to start safety actions may be too short. Therefore, an evaluation of the feasibility of an EEW implementation is needed in this area. A first theoretical evaluation was performed by Olivieri et al. (2008) with RSN (National Seismic Network, IV, INGV Seismological Data Center, 2006) and by Picozzi et al. (2015) using the RAN seismic network (Italian strong motion network) managed by the National Civil Protection (Gorini et al., 2010), whose stations are mostly not connected in real-time.
Our study area extends for about 200 × 200 km in eastern central Italy and is characterized by the following two main seismic zones: 1) a NNW-SSE seismic zone elongated in the Appennines, where several moderate to strong earthquakes have occurred in the past and 2) a coastline-offshore seismic zone (Figure 1a), with less frequent and on average weaker seismicity. Figure 1b shows the target points chosen in the study compared to the individual and composite seismogenic sources from the DISS catalog (DISS Working Group, 2018). An individual seismogenic source (ISS) is a simplified, three-dimensional representation of a rectangular fault plane, whereas a composite seismogenic source (CSS) is a simplified, three-dimensional representation of a crustal fault containing an unspecified number of seismogenic sources that cannot be singled out. The area analyzed in our study is affected by different fault systems. We select as targets the cities with at least 40,000 inhabitants or with a significant cultural value. The selected cities are Ancona, Pesaro, Macerata, Ascoli Piceno, Fermo, Fabriano, Urbino, San Benedetto del Tronto, Civitanova Marche, Senigallia, Jesi, Perugia, Foligno, and Terni (Table 1).
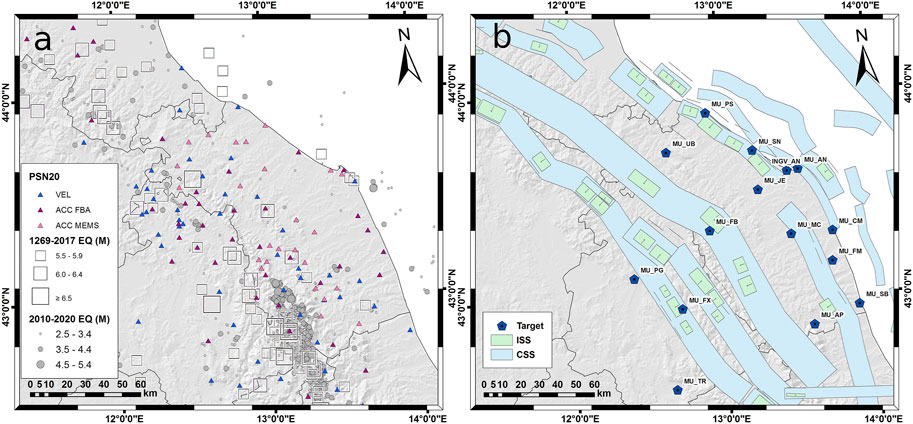
FIGURE 1. Seismicity, seismic network, different fault zones, and selected targets of the study area. a) PSN20: Permanent Seismic Network in the year 2020. Blue triangles: velocimetric sensors. Purple triangles: FBA high performance accelerometer sensors. Pink triangles: MEMS accelerometer. Black squares: 1219–2019 EQ, moderate to strong earthquakes (M ≥ 5.5) extracted from CPTI15 database (Rovida et al., 2021). Grey circles: earthquakes recorded by the seismic network from 2010 to 2020 in the magnitude range 2.5 ≤ M ≤ 5.4. b) Pentagon: Targets. ISS: individual seismogenic source. CSS: composite seismogenic source (see text for explanation, DISS Working Group (2018)).

TABLE 1. Target: city code. Place: extended name of cities.
In the study area, an EEWS based on PRESTo software has been operating since 2015. The system was based on permanent seismic networks managed by the INGV (National Institute of Geophysics and Vulcanology) composed by different sensors: velocimeters (short period and broad-band), high performance accelerometers, and MEMS. The seismic network in this area includes the RSN, a more dense local network (namely, the Alto Tiberina Near Fault Observatory—Taboo (Chiaraluce et al., 2014)), and some seismic stations installed for regional monitoring (Cattaneo et al., 2017). A first evaluation of the performance of the EEWS was made analyzing the seismic sequence of 2016–2017 (Festa et al., 2018). The system has been continuously operating over the years, without changing configuration, with some temporary interruptions.
In this work, the feasibility of a regional EEWS was evaluated by developing a procedure of event declaration simulation (EDS) for estimating the time useful to activate safety actions. The EDS procedure can be used for different applications: 1) to assess the feasibility of an EEWS in a specific area with an operating seismic network; 2) to plan the integration of new stations into an existing network; 3) to design a new network for an EEWS; and finally, 4) to assess the feasibility of an EEWS varying network density and trigger parameters. Regarding 3) and 4), the EDS can create virtual networks for the areas of interest and allow to plan investments and installations in advance.
The study was mainly based on the calculation of the time first alert (TFA)—the instant in which the event is declared starting from the coincidence of P phases at the stations, the blind zone radius (BZ)—the area in which no safety action can be carried out, and the lead time (LT)—the useful time to initiate safety actions on the targets. In the paper, we first propose a description of the method, of the parameters setting to obtain realistic simulations, and of the EDS validation with PRESTo EEWS. Then, an EDS application in eastern central Italy is showed, discussing the results of the TFA, BZ, and LT mapping in terms of feasibility and limits of the EEW implementation.
2 Event Declaration Simulation Method
The developed EDS is composed by a chain of subroutines including NonLinLoc modules (nonlinear location, or NLLoc; Lomax et al., 2009) in the preparatory phase and homemade python scripts in the core of the simulation that emulates some parameters similar to the PRESTo software. The NLLOC package is a well-known and widely used nonlinear inversion code, consisting of a set of programs and where it is possible to integrate an existing velocity model, travel-time calculation and probabilistic solution, for visualization of 3D volume data and location results (http://alomax.free.fr/nlloc/).
The procedure of event declaration simulation needs the following inputs: arrival times of the P phases to the seismic stations, arrival time of the S phases to the targets, a binding configuration and latencies of the real-time data transmission vectors (Figure 2). To obtain the arrival time of P and S phases, a velocity model, a seismic network, a seismic source, and target locations are required.
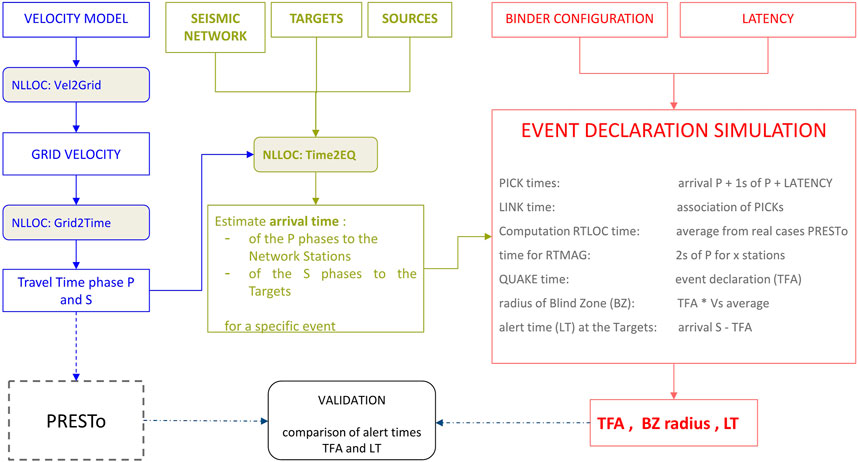
FIGURE 2. Flow chart of the EDS method. Left (blue): P and S travel time calculation with NonLinLoc software modules (Lomax et al., 2009). Middle (green): P and S arrival time relative at seismic stations and targets respectively. Right (red): input parameters and elements of the EDS core. Bottom: terms of the validation.
Figure 2 shows the most important steps of the simulation procedure, exemplifying the main blocks of the procedure from the inputs to the three outputs: TFA, BZ, and LT.
Starting from a velocity model and using the NLLoc Vel2Grid module, it is possible to create a defined grid of velocities, covering the volume of the study area. Then, the NLLoc Grid2Time module calculates the travel times from node points of the 3D velocity grid to the location of the seismic stations. The so obtained travel times are the same in use in the PRESTo system to locate the real seismic events.
The procedure estimates the arrival times of the P phases to the seismic stations and arrival times of the S phases to the targets, taking advantage of the NLLoc Time2EQ module, given the locations of seismic stations, seismic source and targets.
In the core of the simulation, the expected TFA, BZ, and LT are calculated starting from P and S arrival times, binder configuration (coincidences), and data latencies (Figure 2).
The simulated parameters conceptually emulate some parameters of the PRESTo software.
“PICK time” is defined as the time of the P phase trigger at each seismic station, the sum of the estimated P phase arrival, the accumulation of 1 s of P waveform for the phase picker and the latency of the data packet. “LINK time” signs the moment when a certain number of PICKs are included in a relative small space and time interval and the binder declares an association. The simulation considers a “computation time” useful to locate the supposed event and the accumulation of 2 s of P waveform to compute the magnitude. The “computation time” and the time to compute the magnitude are inferred from real-time application of the PRESTo system implemented in the study area, collecting the log outputs relative to RTLOC and RTMAG modules (Zollo et al., 2010; Satriano et al., 2011b).
The integration of simulated parameters allows to calculate the “QUAKE time” (TFA) as the needed time to declare the event, summed to the “LINK time”. The BZ is estimated multiplying the TFA times the average of the S velocity in the travelled volume. Finally, the useful time (LT) to initiate actions to secure the targets is obtained from the difference between the arrival time of S phase at the targets and the TFA.
3 Event Declaration Simulation Configuration
The aim of this work is to assess the feasibility of an EEWS in eastern central Italy where a dense seismic network operates, and the main characteristics of the seismicity are well-known (Figure 1a, b). The study area is inhabited by about 2.5 million people, distributed in some main cities with population ranging from tens of thousands up to one hundred thousand inhabitants, and in several small historical villages where few hundred people live. Moreover, in most of the target towns and villages, both along the coasts and in the inner Umbria and Marche regions, residents increase dramatically during the summer and other vacation periods.
One of the starting points of the analysis is the velocity model of the volume crossed by seismic waves. A grid of 300 km × 300 km, 67 km thick, starting from 3 km above sea level was created, that could include all the seismicity of the region. A step of 1 km divides nodes of the grid and the central origin geographic point is 43.25 N – 13.00 E. To make the simulation more reliable, we chose a modified version of a 1D velocity model calculated for the region from an instrumental earthquakes catalog (De Luca et al., 2009), preserving the Vp/Vs ratio equal to 1.85 and inserting a gradient between velocity layers (Supplementary Table 1).
The configuration of the INGV seismic network has been evolving over the years. From 2015, when PRESTo software was installed for real-time monitoring and EEW testing, the number of stations has been increasing. Moreover, during the seismic sequence of the year 2016 (Chiaraluce et al., 2017) an emergency temporary seismic network was installed to densify the permanent network (Moretti et al., 2016; SISMIKO, 2020). Therefore, we set four seismic network configurations for EDS:
- PSN15: Permanent Seismic Network of the year 2015
- TSN16: Temporary Seismic Network of the 2016 seismic emergency (added to PSN15)
- PSN20: Permanent Seismic Network of the year 2020 (including PSN15)
- ASN20: Accelerometric Seismic Network of the year 2020.
The PSN15 is the same network configuration implemented in the real time PRESTo instance and contributed to validate EDS, to estimate data latencies and test performance of the PRESTo system in Festa et al. (2018). TSN16 was used to test the response of the network with a significant increase of the density of the PSN15 up to a station inter-distance of about 5 km in the epicentral area of the 2016–2017 seismic sequence. PSN20 contributed to augment dataset of the EDS validation comparing results with a playback instance of the PRESTo software. The ASN20 helped to estimate the network response if we consider only accelerometric components, corresponding to a reduction of the network density, balanced by the certainty of unclipped records. A list of the seismic stations belonging to each network is inserted in Supplementary Table 2.
The EDS is also able to manage arbitrary virtual networks, composed by scattered or equally spaced grid of stations to design network response in uncovered areas.
Also for the sources, we can input a single seismic source or a set of sources, scattered or equally spaced. The location of a single source, for example, is useful to reproduce the response of the seismic network in terms of TFA for an historical or a recent significant event. Furthermore, for the same event, the EDS returns LT relative to the main cities of the region. Extending the principle to a grid of equally spaced sources, the EDS can map the three output parameters (TFA, BZ, and LT) over the whole region. This approach allows classifying areas characterized by small or large TFA and BZ relative to the events’ epicenters. In this work, for a first mapping of TFA and BZ, we choose a grid of sources 5 km spaced at depth of 10 km. The LT was estimated for all the selected cities (Table 1).
The number of triggered stations and the time interval for association are the main parameters for the set of the binder, the module that allows to declare an event. In the EDS, the binder configuration emulates the “Binder” of PRESTo software parameters (PRESTo, 2013). We adopt the setup used in the real-time PRESTo instance for choosing the values of binder parameters in the EDS (Table 2). The number of at least six stations in coincidence (STA_CO) inside a time window of 3 s (SEC_CO) is a good compromise between the heterogeneous density of the seismic network and the requirement of a rapid response of the system considered the distances of targets from the sources. The SEC_AS parameter is set to 10 s, a value that avoids the effect of the shift of a good location during grid search in the playback PRESTo instance with respect to the results of the real-time instance with SEC_AS = 15 s. The AVEL_MIN, AVEL_MAX, VEL_SPA, VEL_DIST parameters design a cone inside which the coincidence picks must fall.
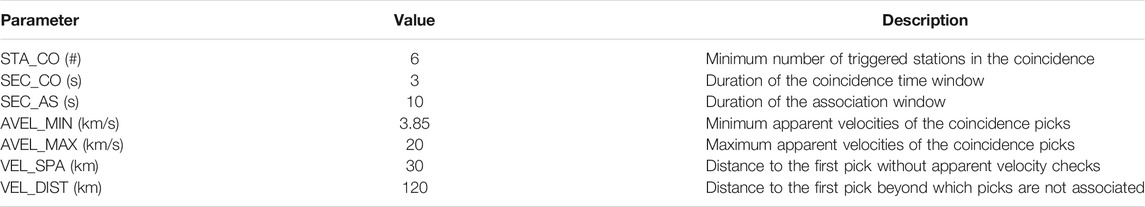
TABLE 2. Configuration Parameters of the EDS binder.
A key factor to take into account for an EEWS is the data latency due to the communication protocol (Satriano et al., 2011a). The latency affects the alert times of the EEWS which can only be activated when a good part of the data is available in nearly true real-time. The seismic data of the stations in eastern central Italy are transmitted by different types of transmission vectors: TCP/IP, WiFi, GPRS/UMTS, and Satellite (SAT-LIBRA and KA-SAT). At the time of the analysis, LTE routers were not available. Starting from the PRESTo log files, the real latency data for 86 seismic stations for the period 2015–2019 were collected. The long time window of the analysis allowed in some cases to assess the improved performance of the stations after the change of the transmission protocol. An average value of the latency for each type of transmission vectors was calculated by the geometric mean to exclude outliers, that is, values significantly out of the trend, referred to a malfunction of the station. The results of the latency classification are listed in Table 3 with the average values calculated and the number of stations used. Considering the main transmission vectors used in the network of this study, it is possible to make some considerations. As expected, the stations with a satellite time division multiple access carrier system (i.e., SAT-LIBRA) are those with the greatest latency and are not good for EEW application in small areas, but in our case few stations are equipped with this type of satellite transmission. Instead, another satellite system (i.e., KA-SAT) returns an average of 2.64 s, an acceptable value for EEW applications. The TCP/IP, WiFi, and GSM/UMTS latencies range between 1.86 and 2.83 s. The best value is for direct connection TCP/IP from remote stations. TCP/IP connections from other acquisition centers connected with a mixed copper-fiber line return a slight worsening. The transmission by WiFi backbone gives back a latency of 2.07 s, confirming suitable use for EEW systems. The WiFi system is not a public system, but a system dedicated to civil protection services, available thanks to the Regione Marche authority through an agreement with INGV. Each system used for data transmission (TCP/IP, WiFi, and GSM/UMTS, Satellite) could suffer temporary blackout of the communication lines. In case of a strong earthquake the redundancy of the transmission lines used in the network should reduce the risk of data blackout.
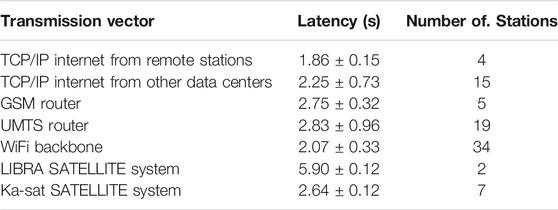
TABLE 3. Transmission vector, mean and standard deviation of data latency, and number of stations used for each type.
Besides transmission times, another important parameter for an efficient EEWS is the computing time, defined as the difference between the association time of the stations and the computed TFA.
During this time, in the real-time system, the location and magnitude are estimated and the event is declared. The EDS does not simulate the earthquake location process and the magnitude estimate. So, the computing times inserted in our simulation are extracted from a statistics of the real-time PRESTo instance. The time difference between “QUAKE time” and “LINK time” was calculated and compared on a dataset of 91 events (Supplementary Table 3) detected in real-time by the PRESTo system and re-simulated by EDS. The events, belonging to the INGV bulletin, were selected from August 2016 to May 2020, with magnitude 3.0 ≤ Mw ≤ 6.0. These events were detected by the system in real-time for the same period in the study area. The calculation times, taken from the system files in real-time, were distributed according to a lognormal curve (Figure 3). The calculated values are mode equal to 0.29 s, median equal to 0.42 s, and average 0.51 s. Following these results, a value of 0.30 s was chosen as the average computation time for the simulation.
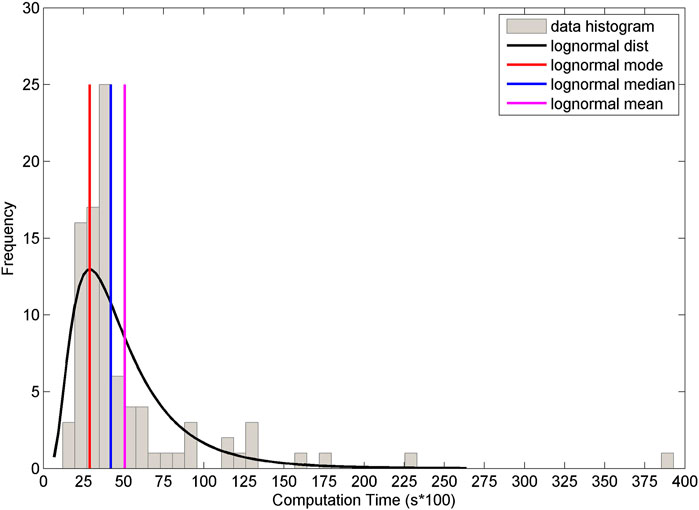
FIGURE 3. Statistic of the computation time values.
4 Event Declaration Simulation Validation
The simulation procedure was validated comparing the first time of the alerts (TFA) of the EDS with first “QUAKE time” of the PRESTo instances. In the comparison with real time outputs of the PRESTo system, the values of mean latencies belonging to different transmission vectors are inserted in the EDS. Differently, for the comparison with PRESTo playback outputs, a zero latency was set in EDS. These two approaches help to increase the reliability of the validation, excluding that results are affected by a bad estimate of the latencies.
Figure 4 shows a detail of the processing of Mw 5.4 October 26, 2016 event and the comparison of arrival times relative to P phases of the triggered stations, the TFA and the arrival of S phases useful to calculate the LT at the target INGV_AN in the city of Ancona (epicentral distance 88 km). The black marks represent an operator review of the P phases at the triggered stations and the S phase at the target station (cT0). The black point represents the origin time of the located event, taken into account for the EDS test. The red marks are relative to PRESTo instances (cT1, cT3), while the blue marks are relative to EDS (cT2, cT4, cT5).
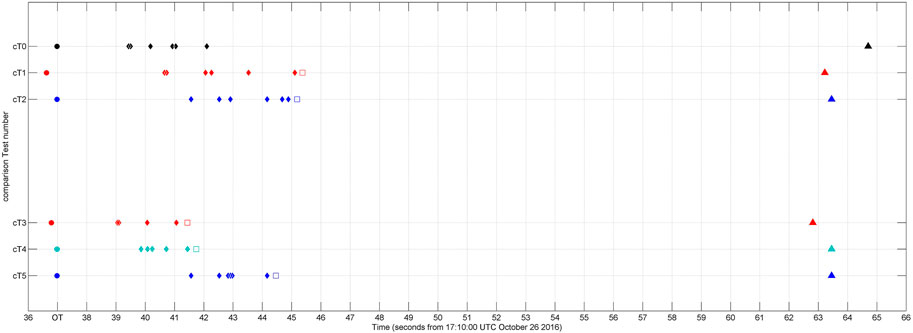
FIGURE 4. Comparison of arrival times relative to Mw 5.4 October 26, 2016 earthquake. Circles: Origin Time. Diamonds: P phase arrival times of the triggered stations. Squares: TFA. Triangles: S phase arrival times at INGV_AN target in city of Ancona (88 km epicentral distance). cT0: arrival times of human event revision. cT1: PRESTo real time instance with PSN15. cT2: EDS with real latency and with PSN15. cT3: PRESTo playback instance with PSN15 and TSN16. cT4: EDS with zero latency and PSN15 + TSN16. cT5: EDS with real latency with PSN15 + TSN16.
The arrival times of operator reviewed P phases are lesser than the PRESTo and EDS real time tests where the data latencies are present. The reviewed arrival time is more similar for the tests in playback where zero latency is setting up but a 1 s of P waveform analysis remains.
The comparison of the TFA between PRESTo and EDS is very good for the two approaches, that is, real-time (cT1 vs cT2) and playback (cT3 vs cT4). The effect of the data latencies in the real time case imply a delay of about 3 s of the TFA with respect to the last P phase arrival time of the human reviewed case. This result is coherent with the values of the mean latencies calculated for the different transmission protocol ranging between 2 and 3 s inserted in the test, and 1 s needed to process the P waveform. The playback version of the test return a little early TFA respect to the last reviewed P phase, both for PRESTo and EDS, but the difference is small, 0.7 and 0.4 s respectively. Finally, the EDS allows to estimate a theoretical TFA adding emergency temporary seismic stations, active in epicentral area at the time of the earthquake, and stations data latencies (cT5). The effect on TFA is about 1 s of the advance respect the PRESTo real-time case (cT1), simply for the early achievement of the station coincidence determined by an augmented network density in the epicentral area. The values of S phase arrival times of PRESTo and EDS are coherent thanks to the same modeling of velocity volume used for travel time computation. From the good simulation of the TFA and S phase arrival at the target by EDS, a good estimate of the LT follows.
For a general validation of the TFA estimated with EDS, we selected 20 seismic events with 3.0 ≤ Mw ≤ 6.5, all elaborated also by PRESTo playback instance and 16 events by real-time instance. The selected events are scattered over the study area and over time, with the aim to insert in these tests different and unfavorable states of the network in terms of station inter-distances. The events belong to a time window from August 24, 2016, to January 28, 2020, with the hypocentral depth between 6.8 and 33.3 km (Supplementary Table 4). The time window includes some major events of the 2016 Central Italy sequence, located in the southern sector of the region, while the other events were chosen in order to perform tests in the northern part of the region.
Table 4 summarizes the results of EDS estimates of TFA compared with real-time and playback PRESTo instances obtained by setting up the PSN15 configuration network. Moreover, the playback configuration (zero latency) was used to return a TFA mean difference, adding PSN16 emergency temporary station data relative to 2016–2017 events and the PSN20 network configuration for more recent events.
TABLE 4. Results of the TFA comparison relative to real time and in playback PRESTo instances.
The TFA validation results return mean values lower than 1.0 s. The negative sign indicates an early TFA of the EDS, ascribable to non-simulation of the recursive recalculation of the location and magnitude that occurs in some real cases (PRESTo system) with the arrival of new data. The results of PSN15 real-time and playback cases (validation test 1 and 2) are similar, confirming a reliable simulation for both data latencies and station triggering, respectively. The last case (validation test 3) takes advantage of using 2016 temporary stations and latest installed stations, therefore the network density augmented in a part of analysis. The third test shows a better result, reducing the mean and the uncertainty of TFA difference.
The success of the EDS validation tests allows to perform simulations useful to quantify the EEW response of the actual seismic networks operating in eastern central Italy and to estimate the LT for the main cities in the region.
5 Event Declaration Simulation Applications, Results and Discussion
The EDS was developed to evaluate the EEW response of INGV seismic network in eastern central Italy in terms of TFA, BZ, and LD, but it is useful also to reproduce and design the feasibility of the system in different or not yet monitored areas.
The first possible application allowed by EDS is the response of a seismic network relative to one single seismic event with the aim of assessing LT for a set of targets.
Considering the hypocentral location of the Mw 6.0 August 24, 2016, event, we have simulated the response of four network configurations (Table 5), assessing the LT for the main cities of the study area (Figure 5). During the analysis, the calculation of the BZ is performed by multiplying the TFA by the average Vs estimated at the last station useful for coincidence. The TFA value is calculated as the arrival time of the P wave at the last station, added to the latency value and the estimated computing time of the system. Vs is calculated as the product of mean Vp at the last station for coincidence by the ratio Vs/Vp (De Luca et al., 2009, reported in Supplementary Table 1). In the first test (SST1), we used the PSN15 seismic network, the existing network at the time of the event. The second test (SST2) was performed inserting all stations of the TSN16, simulating the presence of the whole emergency network. This temporary seismic network was installed after the earthquake of August 24, 2016. The third test (SST3) represents the unfavorable case of a network consisting of only the current accelerometric INGV stations (ASN20). The last test (SST4) is an example of the design of a virtual arbitrary seismic network with the station inter-distance of 5 km. The calculated mean latency was associated to the PSN15 stations used for the latency statistics, a 2.75 s GSM/UMTS mean latency was associated to the TSN16 stations, and the mean latency was associated at new stations not present in PSN15, depending on their transmission vector. The virtual network with the inter-distance of 5 km was designed like a GSM/UMTS network and a mean latency of 2.75 s was applied to all virtual stations.
TABLE 5. Results of tests with single source and different network configurations.
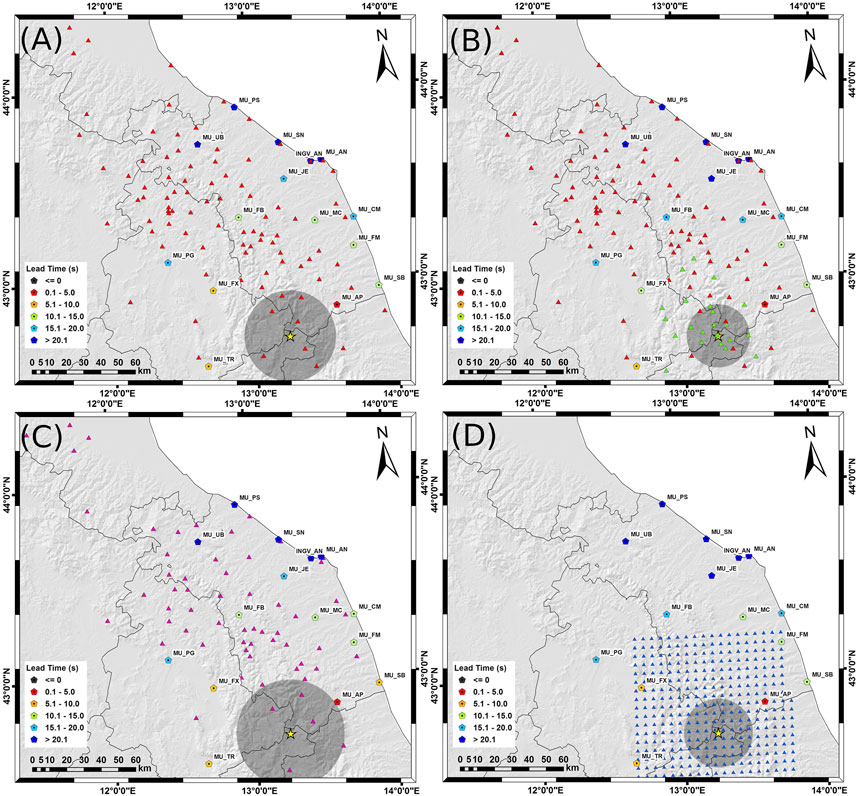
FIGURE 5. EDS of the EEW response relative to a single source. Yellow star: location of the Mw 6.0 August 24, 2016 earthquake. Gray circle: Blind Zone. Pentagon: Targets. Legend: color map of the LT (s) linked to the targets. (A) SST1 test. Red triangles: PSN15 network. (B) SST2 test. Red triangles: PSN15 network; green triangles: TSN16. (C) SST3 test. Purple triangles: ASN20. (D) SST4 test. Blue triangles: 5 km inter-distance virtual network.
The network response in terms of TFA varies in dependence of the seismic station distribution and of network density around the epicentral area (Figure 5). The addition of TSN16 to PSN15 around the seismic event causes a reduction of TFA from 8.7 to 6.3 s (gain of 2.4 s) and a reduction of the blind zone (BZ) radius from 26.5 to 18.3 km (Table 5). In the third case, the sparse distribution of the accelerometric stations around the epicentral area causes a worsening of the network response with respect to the other two tests and TFA and BZ jump to 9.8 s and 31.4 km respectively. In the SST3 test, the MU_AP target has not safely time for activate protection actions, being on the BZ border, and MU_SB, MU_FX, and MU_TR targets have less than 10 s of LT (Figure 5C and Table 6). The sample SST4 returns similar values of the SST2 test (Table 5 and Table 6), strengthening the idea that the EDS can represent a tool for design an improvement of the EEWS starting from an existent seismic network or a new EEWS imaging an entirely new network in uncovered areas.
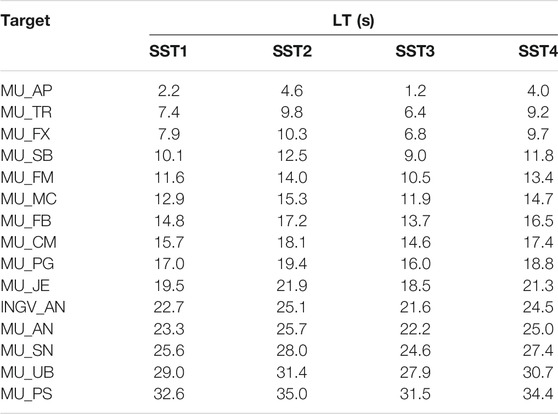
TABLE 6. Results of LT for selected targets. Target: city code. Place: extended name of cities. LT: Values of LT in seconds referred to the test in Table 4.
The EDS is also a tool to map the TFA, BZ, and LT over the territory. Indeed, it is possible to configure the procedure including a set of sources, every combined with a TFA and a BZ value. Moreover, it is possible to obtain LT linked to each epicentral location referred to a single target.
The example to explain the use of EDS to mapping EEW parameters is showed in Figure 6, where the PSN20 is applied. In the left column, a set of locations referred to the main historical seismic events of Mw ≥ 5.5 from 1269 to 2017 AD that hit the region is presented (Figure 6A), extracted from CPTI15 catalog (Rovida et al., 2021). In the right column, a grid of sources with inter-distance of 5 km, depth of 10 km and covering the whole region is depicted (Figure 6B). The example of historical events answers the question of which TFA and BZ would occur with the actual seismic network if seismic events repeat in the same locations. Each historical epicentral location is mapped in terms of TFA and BZ (Figures 6C, E). Smaller TFA (red points) are mapped where the network is denser in inland areas at the center of the network. For southern inland events and coastal events (yellow dots), the EEWS provides less protection which is significantly reduced for northern events (green dots) where TFA greater than 10 s results in BZ with a radius greater than 30 km.
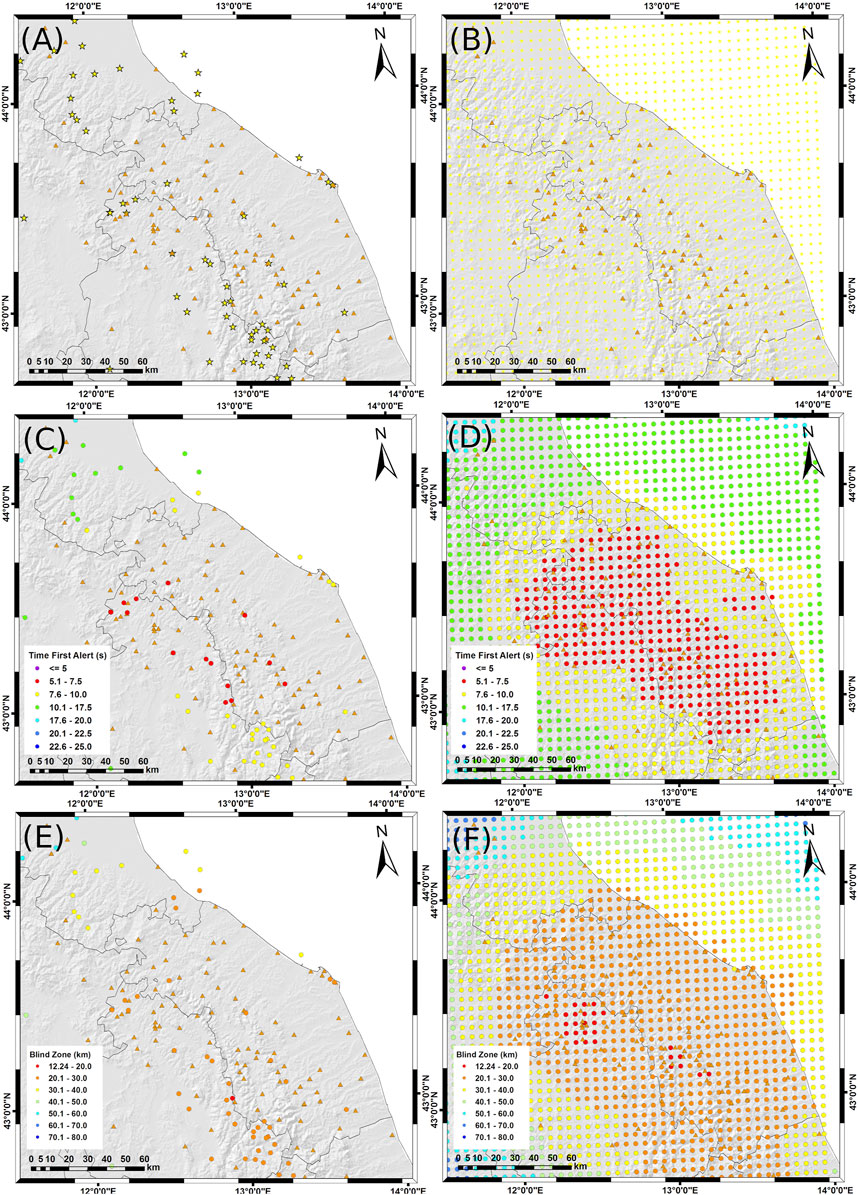
FIGURE 6. TFA and BZ mapping. (A): historical events from CPTI15 v3.0 Mw ≥ 5.5 from1269 to 2017 AD, depth 10 km before 1997. (B): virtual grid of sources distant of 5 km and depth of 10 km. (C): mapping of TFA with historical events. (D): mapping of TFA with virtual grid. (E): mapping of BZ with historical events. (F): mapping of BZ with virtual grid.
The same principle can be extended to the whole territory, mapping TFA (Figure 6D), and BZ (Figure 6F) with the grid of sources. The map of the TFA depicts the edges of the areas within which, if a seismic event occurs, the EEWS responds with a TFA threshold. In particular, for the eastern part of central Italy, with the actual INGV network, an EEWS could produce TFA less than 7.5 s for a large inland area that includes part of the most active seismic zones. Around the Adriatic coast, the seismic network is less dense and an earthquake that occurs off-shore is out of the network. Therefore, the coastal and off-shore TFAs are shorter than those in the inland zones. Besides, the elongated distribution of the seismic stations next to the coast could cause bad locations and estimate of the magnitude by the EEWS, worsening even more the protection provided by the alarm. Also, the northern part of the region is lacking stations and the resulting TFA are similar to the off-shore values. For the largest part of the region, a BZ ranging between 20 and 30 km from the epicenter would not be protected by a warning. The BZ radius increases up to over 30–40 km for the off-shore locations and the EEW system could not produce a TFA for coastal cities. To overcome this problem, offshore seismometers would be extremely useful.
The EDS allows exporting results of the TFA values to map LT referred to a single target. The LT map helps to link places of hypothetical epicenters and the time available for safety actions at the target. For example, the map in Figure 7 shows the LT available for the city of Fabriano (in particular for the location of the city Hall, MU_FB target). The color map shows the values of LT in equally spaced sources, located at 10 km depth. The black dots limit the epicenters for which the city of Fabriano falls in the BZ. Indeed, in this zone the LT is negative (≤0 s). The area marked with red dots corresponds to a 0 s < LT ≤ 5 s where an alarm could be provided but security actions are unlikely. In the orange area (5 s < LT ≤ 10 s) triggering automatic actions would be possible (Cauzzi et al., 2016). Besides the orange area (LT > 10 s), trained people can take precautionary and protective actions (Fujinawa and Noda, 2013) and the probability of a successful alert increases significantly (Becker et al., 2020b).
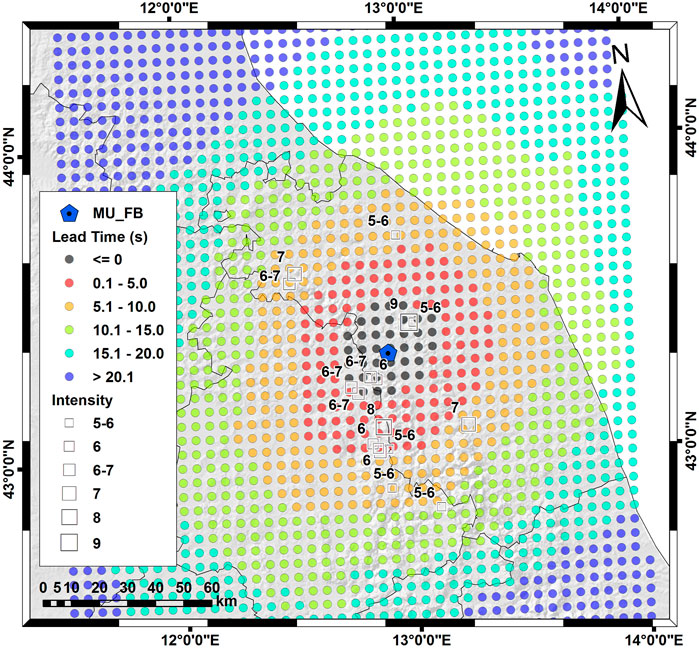
FIGURE 7. LT mapping for city of Fabriano and historical destructive earthquake. Blue pentagon: place of city of Fabriano (MU_FB target). Colored circles: values of LT in seconds. Squares: CPTI15 v3.0 historical earthquakes and macroseismic intensity (DBMI15 v3.0, Locati et al., 2021) estimated for the city of Fabriano.
This argument makes sense in particular for those earthquakes that could damage the target. Therefore, the destructive earthquakes for the city of Fabriano, extracted from CPTI15 catalog (Rovida et al., 2021), overlap the LT map in Figure 7. Clearly, most of the events fall in black and red areas, since the MU_FB target is placed close to the inland active seismic zone (Figure 1) and the EEWS would be almost useless. However, some historical events that caused damages with a macroseismic intensity from five to six to 7, fall in the orange area where automatic actions are possible. For the southernmost event (Mw 6.5 on October 30, 2016), an EEWS could have provided an alert 10 s before the arrival of the first S seismic waves to the city of Fabriano, a good LT to take several safety actions.
6 Conclusion
The feasibility of an EEWS derives from the design of a seismic network with respect to the seismic sources located within or around it. EEWSs are today an effective contribution to the problem of seismic risk mitigation, but few countries have operational systems (Satriano et al., 2011b). Implementation of EEWSs in Italy is a challenge. Italy is an elongated peninsula, with its central part crossed by a mountain chain that is seismically active and runs very close to urbanized areas. Therefore, the simulations of seismic networks contribute in the field of territorial safety by identifying the time in which some types of protection actions could be activated.
In this work, we have developed a simulation procedure (EDS), useful to estimate the feasibility of an EEWS and showed some applications in eastern central Italy, where INGV manages a dense seismic network. A validation process was performed by comparing results of simulations with real-time and playback instances of the EEW PRESTo system implemented in the same region (Festa et al., 2018).
EDS is a tool to simulate different seismic network responses reproducing the physical contest of a specific historical or recent earthquake; moreover, EDS is a tool to map EEW parameters (TFA, BZ, and LT) to classify the whole territory in terms of areas where it is possible to activate safety actions. With EDS, it is possible to model real seismic networks inserting actual or theoretical data latencies due to different transmission vectors and to design new seismic networks in uncovered areas.
As expected, the results of the EDS application in eastern central Italy highlights short, but still useful, alert times for innermost land and coastal areas overlooking the active seismic zones. However, we have shown that most of the currently used transmission vectors have latencies between 2 and 3 s, an acceptable value for seismic early warnings. The quantitative estimate of TFA, BZ, and LT supplies useful information to project an improvement of the EEWS with the aim to reduce as much as possible the TFA. Modern approaches include the use of low-cost sensors for a greater diffusion of the seismic monitoring throughout the territory, and the development of networks oriented toward smart cities using fast protocols and connectivity (Ladina et al., 2016; Pierleoni et al., 2018; D’Alessandro et al., 2019). In the area of the 2016 Central Italy sequence, we have estimated a gain of about 2.5 s of LT, adding the 2016 emergency temporary stations (station inter-distance about 5 km) over the permanent network, with a data latency similar to GPRS connections. The result was repeated setting a virtual network in a station grid with a constant inter-distance of 5 km and a mean data latency of 2.6 s to demonstrate the ability to project an EEWS in uncovered areas and to obtain realistic times of the first alert.
Although the Italian territory is mostly characterized by seismic sources next to urbanized areas, the lead times calculated with EDS procedure encourage the opportunity of implementing an EEWS for several interesting targets. Simulating historical events, a LT between 5 and 10 s was reproduced for some of these targets. We conclude that automatic safety actions, situational awareness and a more rapid response by well-trained people are a realistic goal in eastern central Italy.
We are aware that the study presented here has some limitations, first of all the system performance is evaluated analyzing mainly the rapidity of an EWS, whereas no evaluation assessment is made on the reliability of the earthquake impact prediction. This implies that the evaluation of the shaking could be inaccurate or even lead to false or missed alerts. However, the goal of our analysis was to determine whether an EWS could be a viable solution to reduce seismic exposure in certain regions of Italy, and in which conditions (network geometry, transmission times, etc.). Our results are encouraging provided that some technological issues are considered and that people’s awareness of seismic risk is increased. Further studies will be dedicated to a more thorough assessment of EWS.
The development of a widespread monitoring infrastructure near the main seismic sources, the massive training of citizens, and the collaboration with civil protection authorities could improve the scenarios simulated in this work, making an EEWS really effective in protecting people from the harmful effects of earthquakes in Italy.
Data Availability Statement
The raw data supporting the conclusions of this article will be made available by the authors, without undue reservation.
Author Contributions
Conceptualization; methodology; validation; data analysis and curation: CL, SM; data analysis supervision: AA, MC; writing-original draft preparation; writing-review and editing: CL, SM, AA, MC. All authors contributed to manuscript, read and approved the submitted version.
Funding
This work has been carried out within the Project ART-IT (Allerta Rapida Terremoti in Italia), funded by the Italian Ministry of University and Research (Progetto Premiale 2015, DM. 850/2017), and supported also by the Agreement between Civil Protection Department of the Regione Marche and INGV.
Conflict of Interest
The authors declare that the research was conducted in the absence of any commercial or financial relationships that could be construed as a potential conflict of interest.
Publisher’s Note
All claims expressed in this article are solely those of the authors and do not necessarily represent those of their affiliated organizations, or those of the publisher, the editors and the reviewers. Any product that may be evaluated in this article, or claim that may be made by its manufacturer, is not guaranteed or endorsed by the publisher.
Acknowledgments
The authors thank Mario Locati for support with DBMI15 v2.0, Luca Elia for suggestion and explanations with PRESTo configuration, and Simona Colombelli for the suggestions about the details of the work.
Supplementary Material
The Supplementary Material for this article can be found online at: https://www.frontiersin.org/articles/10.3389/feart.2021.685751/full#supplementary-material
References
Alcik, H., Ozel, O., Apaydin, N., and Erdik, M. (2009). A Study on Warning Algorithms for Istanbul Earthquake Early Warning System. Geophys. Res. Lett. 36, L00B05. doi:10.1029/2008GL036659
Allen, R. M., Brown, H., Hellweg, M., Khainovski, O., Lombard, P., and Neuhauser, D. (2009a). Real-time Earthquake Detection and hazard Assessment by ElarmS across California. Geophys. Res. Lett. 36, L00B08. doi:10.1029/2008GL036766
Allen, R. M., Gasparini, P., Kamigaichi, O., and Böse, M. (2009b). The Status of Earthquake Early Warning Around the World: An Introductory Overview. Seismological Res. Lett. 80 (5), 682–693. doi:10.1785/gssrl.80.5.682
Allen, R. M., and Kanamori, H. (2003). The Potential for Earthquake Early Warning in Southern California. Science 300, 786–789. doi:10.1126/science.1080912
Allen, R. M., and Melgar, D. (2019). Earthquake Early Warning: Advances, Scientific Challenges, and Societal Needs. Annu. Rev. Earth Planet. Sci. 47, 361–388. doi:10.1146/annurev-earth-053018-060457
Becker, J. S., Potter, S. H., Prasanna, R., Tan, M. L., Payne, B. A., Holden, C., et al. (2020b). Scoping the Potential for Earthquake Early Warning in Aotearoa New Zealand: A Sectoral Analysis of Perceived Benefits and Challenges. Int. J. Disaster Risk Reduction 51, 101765. doi:10.1016/j.ijdrr.2020.101765
Becker, J. S., Potter, S. H., Vinnell, L. J., Nakayachi, K., McBride, S. K., and Johnston, D. M. (2020a). Earthquake Early Warning in Aotearoa New Zealand: a Survey of Public Perspectives to Guide Warning System Development. Humanit Soc. Sci. Commun. 7. doi:10.1057/s41599-020-00613-9
Böse, M., Ionescu, C., and Wenzel, F. (2007). Earthquake Early Warning for Bucharest, Romania: Novel and Revised Scaling Relations. Geophys. Res. Lett. 34, L07302. doi:10.1029/2007GL029396
Caruso, A., Colombelli, S., Elia, L., Picozzi, M., and Zollo, A. (2017). An On-Site Alert Level Early Warning System for Italy. J. Geophys. Res. Solid Earth 122. doi:10.1002/2016JB013403
Cattaneo, M., Frapiccini, M., Ladina, C., Marzorati, S., and Monachesi, G. (2017). A Mixed Automatic-Manual Seismic Catalog for Central-Eastern Italy: Analysis of Homogeneity. Ann. Geophys. 60, 6. doi:10.4401/ag-7333
Cauzzi, C., Behr, Y., Le Guenan, T., Douglas, J., Auclair, S., Woessner, J., et al. (2016). Earthquake Early Warning and Operational Earthquake Forecasting as Real-Time hazard Information to Mitigate Seismic Risk at Nuclear Facilities. Bull. Earthquake Eng. 14, 2495–2512. doi:10.1007/s10518-016-9864-0
Chiaraluce, L., Amato, A., Carannante, S., Castelli, V., Cattaneo, M., Cocco, M., et al. (2014). The Alto Tiberina Near Fault Observatory (Northern Apennines, Italy). Ann. Geophys. 57, 3. doi:10.4401/ag-6426
Chiaraluce, L., Di Stefano, R., Tinti, E., Scognamiglio, L., Michele, M., Casarotti, E., et al. (2017). The 2016 Central Italy Seismic Sequence: A First Look at the Mainshocks, Aftershocks, and Source Models. Seismological Res. Lett. 88 (3), 757–771. doi:10.1785/0220160221
Clinton, J., Zollo, A., Marmureanu, A., Zulfikar, C., and Parolai, S. (2016). State-of-the Art and Future of Earthquake Early Warning in the European Region. Bull. Earthquake Eng. 14, 2441–2458. doi:10.1007/s10518-016-9922-7
Colombelli, S., Amoroso, O., Zollo, A., and Kanamori, H. (2012a). Test of a Threshold-Based Earthquake Early-Warning Method Using Japanese Data. Bull. Seismological Soc. America 102, 1266–1275. doi:10.1785/0120110149
Colombelli, S., Caruso, A., Zollo, A., Festa, G., and Kanamori, H. (2015). A P Wave‐based, On‐site Method for Earthquake Early Warning. Geophys. Res. Lett. 42, 1390–1398. doi:10.1002/2014GL063002
Colombelli, S., Zollo, A., Festa, G., and Kanamori, H. (2012b). Early Magnitude and Potential Damage Zone Estimates for the Great Mw 9 Tohoku-Oki Earthquake. Geophys. Res. Lett. 39, a–n. doi:10.1029/2012gl053923
Cua, G., Fischer, M., Heaton, T., and Wiemer, S. (2009). Real-time Performance of the Virtual Seismologist Earthquake Early Warning Algorithm in Southern California. Seismological Res. Lett. 80, 740–747. Number 5. doi:10.1785/gssrl.80.5.740
D’Alessandro, A., Costanzo, A., Ladina, C., Buongiorno, F., Cattaneo, M., Falcone, S., et al. (2019). Urban Seismic Networks, Structural Health and Cultural Heritage Monitoring: The National Earthquakes Observatory (INGV Ltaly) Experience. Front. Built Environ. doi:10.3389/fbuil.2019.00127
De Luca, G., Cattaneo, M., Monachesi, G., and Amato, A. (2009). Seismicity in Central and Northern Apennines Integrating the Italian National and Regional Networks. Tectonophysics 476, 121–135. doi:10.1016/j.tecto.2008.11.032
DISS Working Group (2018). Database of Individual Seismogenic Sources (DISS), Version 3.2.1: A Compilation of Potential Sources for Earthquakes Larger Than M 5.5 in Italy and Surrounding Areas. Istituto Nazionale di Geofisica e Vulcanologia. Available at: http://diss.rm.ingv.it/diss/. doi:10.6092/INGV.IT-DISS3.2.1
Dunn, P. T., Ahn, A. Y. E., Bostrom, A., and Vidale, J. E. (2016). Perceptions of Earthquake Early Warnings on the U.S. West Coast. Int. J. Disaster Risk Reduction 20, 112–122. doi:10.1016/j.ijdrr.2016.10.019
Erdik, M., Fahjan, Y., Ozel, O., Alcik, H., Mert, A., and Gul, M. (2003). Instabul Earthquake Rapid Response and the Early Warning System. Bull. Earthquake Eng. 1 (1), 157–163. doi:10.1023/A:1024813612271
Festa, G., Picozzi, M., Caruso, A., Colombelli, S., Cattaneo, M., Chiaraluce, L., et al. (2018). Performance of Earthquake Early Warning Systems during the 2016-2017 Mw 5-6.5 Central Italy Sequence. Seismol. Res. Lett. 89, 1–12. doi:10.1785/0220170150
Fujinawa, Y., and Noda, Y. (2013). Japan's Earthquake Early Warning System on 11 March 2011: Performance, Shortcomings, and Changes. Earthquake Spectra 29 (S1), S341–S368. doi:10.1193/1.4000127
Gorini, A., Nicoletti, M., Marsan, P., Bianconi, R., De Nardis, R., Filippi, L., et al. (2010). The Italian strong Motion Network. Bull. Earthquake Eng. 8, 1075–1090. doi:10.1007/s10518-009-9141-6
Hsiao, N.-C., Wu, Y.-M., Shin, T.-C., Zhao, L., and Teng, T.-L. (2009). Development of Earthquake Early Warning System in Taiwan. Geophys. Res. Lett. 36, L00B02. doi:10.1029/2008GL036596
Iannaccone, G., Zollo, A., Elia, L., Convertito, V., Satriano, C., Martino, C., et al. (2010). A Prototype System for Earthquake Early-Warning and Alert Management in Southern Italy. Bull. Earthquake Eng. 8, 1105–1129. doi:10.1007/s10518-009-9131-8
Iervolino, I., Galasso, C., and Manfredi, G. (2008). “Information-dependent lead-time Maps for Earthquake Early Warning in the Campania Region,” in The 14th World Conference on Earthquake Engineering, Beijing, China, October 12-17, 2008.
INGV Seismological Data Centre (2006). Rete Sismica Nazionale (RSN). Italy: Istituto Nazionale di Geofisica e Vulcanologia (INGV). doi:10.13127/sd/x0fxnh7qfy
Kohler, M. D., Smith, D. E., Andrews, J., Chung, A. I., Hartog, R., Henson, I., et al. (2020). Earthquake Early Warning ShakeAlert 2.0: Public Rollout. Seismol. Res. Lett. 91 (3), 1763–1775. doi:10.1785/0220190245
Ladina, C., Marzorati, S., Monachesi, G., Cattaneo, M., Frapiccini, M., and Castelli, V. (2016). Strong-motion Observations Recorded in Strategic Public Buildings during the 24 August 2016 Mw 6.0 Amatrice (central Italy) Earthquake. Ann. Geophys. 59. Fast Track 5 (2016): The Amatrice seismic sequence: preliminary data and results. doi:10.4401/ag-7194
Locati, M., Camassi, R., Rovida, A., Ercolani, E., Bernardini, F., Castelli, V., et al. (2021). Database Macrosismico Italiano (DBMI15), versione 3.0. Istituto Nazionale di Geofisica e Vulcanologia (INGV). doi:10.13127/DBMI/DBMI15.3
Lomax, A., Michelini, A., and Curtis, A. (2009). “Earthquake LocationEarthquake Location, Direct, Global-Search Methods,” in Encyclopedia of Complexity and System Science (New York: Springer), 2449–2473. doi:10.1007/978-0-387-30440-3_150
Moretti, M., Pondrelli, S., Margheriti, L., Abruzzese, L., Anselmi, M., Arroucau, P., et al. (2016). SISMIKO: Emergency Network Deployment and Data Sharing for the 2016 central Italy Seismic Sequence. Ann. Geophys. 59.Fast Track 5. doi:10.4401/ag-7212
Odaka, T., Ashiya, K., Tsukada, S., Sato, S., Ohtake, K., and Nozaka, D. (2003). A New Method of Quickly Estimating Epicentral Distance and Magnitude from a Single Seismic Record. Bull. Seismological Soc. America 93 (1), 526–532. doi:10.1785/0120020008
Olivieri, M., Allen, R. M., and Wurman, G. (2008). The potential for earthquake early warning in Italy using ElarmS. Bull. Seismol. Soc. Am. 98 (1), 495–503. doi:10.1785/0120070054
Picozzi, M. (2012). An Attempt of Real-Time Structural Response Assessment by an Interferometric Approach: A Tailor-Made Earthquake Early Warning for Buildings. Soil Dyn. Earthquake Eng. 38, 109–118. doi:10.1016/j.soildyn.2012.02.003
Picozzi, M., Zollo, A., Brondi, P., Colombelli, S., Elia, L., and Martino, C. (2015). Exploring the Feasibility of a Nationwide Earthquake Early Warning System in Italy. J. Geophys. Res. Solid Earth 120, 2446–2465. doi:10.1002/2014JB011669
Pierleoni, P., Marzorati, S., Ladina, C., Raggiunto, S., Belli, A., Palma, L., et al. (2018). Perfarmance Evaluation of a Low-Cost Sensing Unit for Seismic Applications: Field Testing during Seismic Events of 2016-2017 in Central Ltaly. IEEE Sensor Joumal 18, 16. doi:10.11O9/JSEN.2018.285006510.1109/jsen.2018.2850065
PRESTo, (2013). Probabilistic and Evolutionary Early Warning SysTem. Available at: http://www.prestoews.org (Accessed March 25, 2021).
Rovida, A., Locati, M., Camassi, R., Lolli, B., Gasperini, P., and Antonucci, A. (2021). Catalogo Parametrico dei Terremoti Italiani (CPTI15), versione 3.0. Istituto Nazionale di Geofisica e Vulcanologia (INGV). doi:10.13127/CPTI/CPTI15.3
Satriano, C., Elia, L., Martino, C., Lancieri, M., Zollo, A., and Iannaccone, G. (2011a). PRESTo, the Earthquake Early Warning System for Southern Italy: Concepts, Capabilities and Future Perspectives. Soil Dyn. Earthquake Eng. 31, 137–153. doi:10.1016/j.soildyn.2010.06.008
Satriano, C., Wu, Y.-M., Zollo, A., and Kanamori, H. (2011b). Earthquake Early Warning: Concepts, Methods and Physical Grounds. Soil Dyn. Earthquake Eng. 31, 106–118. doi:10.1016/j.soildyn.2010.07.007
SISMIKO (2020). Coordinamento Delle Reti Sismiche mobile in Emergenza. Available at: http://sismiko.ingv.it (Accessed March 25, 2021).
Suarez, G., Novelo, D., and Mansilla, E. (2009). Performance Evaluation of the Seismic Alert System (SAS) in Mexico City: A Seismological and a Social Perspective. Seismological Res. Lett. 80 (5), 707–716. doi:10.1785/gssrl.80.5.707
Velazquez, O., Pescaroli, G., Cremen, G., and Galasso, C. (2020). A Review of the Technical and Socio-Organizational Components of Earthquake Early Warning Systems. Front. Earth Sci. 8, 533498. doi:10.3389/feart.2020.533498
Wu, Y.-M., and Teng, T. L. (2002). A Virtual Subnetwork Approach to Earthquake Early Warning. Bull. Seismological Soc. America 92 (5), 2008–2018. doi:10.1785/0120010217
Zollo, A., Amoroso, O., Lancieri, M., Wu, Y.-M., and Kanamori, H. (2010). A Threshold-Based Earthquake Early Warning Using Dense Accelerometer Networks. Geophys. J. Int. 183, 963–974. doi:10.1111/j.1365-246X.2010.04765.x
Zollo, A., Colombelli, S., Elia, L., Emolo, A., Festa, G., Iannaccone, G., et al. (2014). “An Integrated Regional and On-Site Earthquake Early Warning System for Southern Italy: Concepts, Methodologies and Performances,” in Book: Early Warning for Geological Disasters, Advanced Technologies in Earth Sciences, 117–137. doi:10.1007/978-3-642-12233-0_7
Keywords: earthquakes, early warning, seismic networks, seismic risk reduction, simulation
Citation: Ladina C, Marzorati S, Amato A and Cattaneo M (2021) Feasibility Study of an Earthquake Early Warning System in Eastern Central Italy. Front. Earth Sci. 9:685751. doi: 10.3389/feart.2021.685751
Received: 25 March 2021; Accepted: 05 July 2021;
Published: 20 August 2021.
Edited by:
Simona Colombelli, University of Naples Federico II, ItalyReviewed by:
Ali Pinar, Boğaziçi University, TurkeyHimanshu Mittal, Ministry of Earth Sciences, India
Aldo Zollo, University of Naples Federico II, Italy
Copyright © 2021 Ladina, Marzorati, Amato and Cattaneo. This is an open-access article distributed under the terms of the Creative Commons Attribution License (CC BY). The use, distribution or reproduction in other forums is permitted, provided the original author(s) and the copyright owner(s) are credited and that the original publication in this journal is cited, in accordance with accepted academic practice. No use, distribution or reproduction is permitted which does not comply with these terms.
*Correspondence: Chiara Ladina, chiara.ladina@ingv.it