On the Validity of the Relationship 1/T = 1/TB+1/TS+1/TD in NMR Techniques With Regards to Permeability Estimation of Natural Porous Media
 Jesús Díaz-Curiel
 Bárbara Biosca
 Lucía Arévalo-Lomas
 María Jesús Miguel
 Raúl Loayza-Muro
- 1Department of Energy and Fuels, Universidad Politécnica de Madrid, Madrid, Spain
- 2Spanish Ministry of Science and Innovation, Madrid, Spain
- 3Laboratory of Ecotoxicology, Faculty of Sciences and Philosophy, Universidad Peruana Cayetano Heredia, Lima, Perú
One of the most relevant feature of geophysical techniques based on nuclear magnetic resonance is their ability to estimate the permeability of natural porous media, since other geophysical techniques, as the use of the formation factor and neutron well-logs, allow to quantify the volume of water in the media. Permeability is conventionally obtained from decay time of the total resonance signal. However, the fluid in the pores of a medium normally has different mobility degree that can be differentiated by the NMR results. Therefore, a detailed estimation of permeability requires decomposing the total resonance signal as a function of the decay times corresponding to the three mechanisms that contribute to the signal: the intergranular free fluid, the surface layer, and the diffusion relaxation mechanism. The relationship currently used to make this decomposition states that the exponential decay rate attributed to the total resonance signal is the sum of the three existing decay rates. We demonstrate that this relationship is not generally applicable in porous media, showing the contradiction with the much more widely accepted relationships as well as computation examples from three typical decay rates in a single pore and from sandstone with bulk and surface relaxation mechanisms. Consequently, we conclude that the assertion whereby the permeability of any porous medium does not depend on the decay time of the free fluid is an overstatement, since it only applies to very small pore sizes.
Introduction
Besides quantifying the water content, the second historical feature of nuclear magnetic resonance (NMR) techniques is their ability to estimate the permeability of porous media, which is one of the most relevant petrophysical parameters obtained by different methods, both laboratory and field. In Geophysics, NMR techniques have historically demonstrated their validity to estimate permeability from well-logging measurements and, in the last 2 decades, this method has increased its implementation in surface geophysical prospecting (Legchenko et al., 2002; Roy and Lubczynski, 2003; Hertrich, 2008; Yaramanci and Müller-Petke, 2009; Legchenko et al., 2011; Behroozmand et al., 2015; Larsen et al., 2020). Other interesting applications of NMR are fluid typing, estimating of pore size distribution, and characterization of the contribution of pore types to other petrophysical properties of porous media (Mardon et al., 1996; Golsanami et al., 2021), although they are not analyzed in this study.
The key of the ability to estimate permeability resides in analyzing not only the NMR response of the medium but also its relaxation along micro-intervals-times. So, this estimation requires decomposing the total resonance relaxation into the three existing mechanisms: the inter-granular free fluid “B” (termed “bulk” since Korringa et al., 1962), the surface layer “S,” and the diffusion relaxation “D.” This decomposing is especially important given the different relationship of decay times corresponding to each mechanism with the permeability of the medium analyzed. So, for sandstones the total resonance signal is close to the free fluid response; however, in the case of high clay content as in shales, the relative volume of the surface layer in the total volume is closer to the porosity occupied by “free” fluid, and the surface layer response progressively achieve influence in the total resonance signal. The measured NMR response provide a curve of amplitude versus time which first outcome is a total relaxation time, it is necessary counting with a relationship between this and the different relaxation times of each of these mechanisms. As of today, the criteria adopted for the decomposition of total resonance rate remain a crucial issue for the analysis of the relaxation curve (Lewis et al., 2015; Luo et al., 2015; Petrov and Stapf, 2017).
The evolution suffered in last decades by the theoretical relations of NMR method, has taken to generalize that the exponential decay rate currently attributed to the total resonance response is the sum of the three decay rates, or in relationship form: 1/T1 = 1/T1B+1/T1S for the longitudinal relaxation and 1/T2 = 1/T2B+1/T2S+1/T2D for transverse relaxation.
For transverse relaxation, spot measurements of T2 at frequencies typically 10–25 MHz, field-cycling measurements over the frequency range 0.01–20 MHz (T1), and 2D correlation T2-T2 measurements probe different dynamics. Among these dynamics, this work focuses on the application in petrophysical studies for the determination of permeability in natural porous media. The time constants in this case may differ considerably from those of applications in biological media (see Figure 1). However, specific experimental frequency range and/or measurement type are not considered relevant in order to evaluate the validity of the criticized relationship.
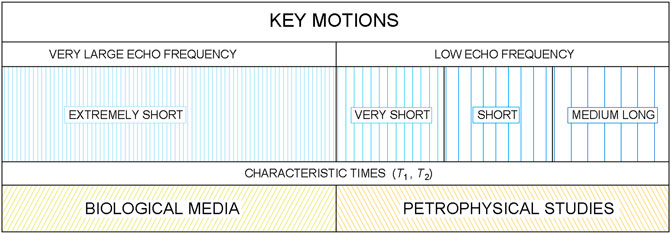
FIGURE 1. Schematic diagram illustrating the key motions and associated time constants.
The aim of this work is to recommend not using this relationship, which lack is demonstrated showing the contradiction with the much more widely accepted relationships as well as a computation example from three typical decay rates. The discussed issues about permeability focus on applications of one-dimensional time NMR measurements, not considering the increasing applications of two-dimensional NMR developments T1-T2, T1–D–T2, etc., mainly target on very small pore sizes (Bernin and Topgaard, 2013; Fleury and Romero-Sarmiento, 2016; Faux and McDonald, 2018; Maneval et al., 2019; Li et al., 2020). Hereafter, the influence of temperature on the relationship in question, and some especial conditions as the presence of paramagnetic particles in the pore fluid is not considered.
Background
To decompose the spectrum of the longitudinal relaxation time T1, Bloembergen et al. (1948) defined a correlation time τC characteristic of the random motion, thereby simplifying the calculation of the mean value of the correlation function used by these authors. Korringa et al. (1962) later considered the presence of two migration processes, one within the surface layer and the other from the surface layer to the free fluid in the pore. They described the migration within the “surface layer” by a transition time or correlation time τS, and the transition from the surface layer to the bulk by a time τ. They established an equivalence between the relaxation time in the surface layer T1S, the relaxation time T1B corresponding to the bulk mechanism outside the surface layer, and the observable relaxation time T1, given by the following relationship,
where VS and VB represent the volume of the surface layer and the bulk region, respectively. These terms are related by VS+VB = VPOR, where VPOR = V·Ø is the pore volume, V is the total volume, and Ø is the total porosity. In this analysis, the influence of the proton resonance fields of each region (VS and VB) upon one another is not the only process considered. Indeed, proton migration would have the effect of molecular displacement beyond the sub-atomic instance.
Seevers (1966) used the notation rS=(T1S+τS)−1 and the inverse (1/T1−1/T1B)−1 to estimate permeability. In this calculation, assuming a homogeneous system, Seevers (1966) replaced VS with SSgr·h·V (1−Ø), where SSgr is the specific surface of the grains and h is the thickness of the fluid layer influenced by the surface, and he applied VB ≈ V·Ø = VPOR when VS « VB. This last approximation has been later used in many works, even in cases in which the spectral inverse Laplace decomposition of the relaxation curve shows that the difference between VB and VS is not large enough to omit the term VS in VPOR.
Most subsequent publications have adopted the view that τS is always negligible with regard to T1S, so that:
where SPOR is the pore surface area. For some authors, the water must sample each environment during the timescale of the T1 or T2 measurement for Eq. 2 to be valid.
Seevers (1966) already considered the fact that the temporal amplitude of the total resonance signal ANMR(t) is the sum of the temporal exponentials corresponding to the two mechanisms, weighted by the relative amplitude of each in the total porosity:
where ØN = VN/VPOR represents the relative porosity of each region (surface and free fluid).
On the other hand, the use of precise instruments for the determination of the transverse relaxation time T2 could be considered widespread by the final decade of the 20th century. Analysis of these transverse relaxation times included the presence of diffusion relaxation. This is given by an exponential function which decay time, thereinafter T2D = T2MG, is equal to 3/(D·G2·γ2·tcp2), where D is the diffusion coefficient, G the magnetic gradient in z direction, γ the gyromagnetic ratio of 1H, and tcp the Carr-Purcell pulse spacing (Carr and Purcell, 1954). T2MG was found to have much lower typical values than T2S (Brownstein and Tarr, 1979). The diffusion relaxation’s dependence on a high gradient of the static field (and the presence of minerals with high magnetic susceptibility), as determined in that work, illustrates why this phenomenon was established to be significant only for transverse relaxation times.
Regarding the implications derived from the T2 CPMG measurement system (Carr and Purcell, 1954; Meiboom and Gill, 1958), in 1990 it was stablished (see reference in Straley et al., 1994) that the NMR signal measured at the peaks of the echoes is the product of the exponentials given by the relationship (Kenyon, 1997):
Where ANMR(t) is the temporal amplitude of the total resonance signal. As for T1, the T2 of the total NMR signal is obtained by the logarithmic mean, that is equivalent to fitting the total decay curve to a single exponential, ANMR(t) ≈ A(t = 0)·exp (–t/T2).
If Equation 4 is considered to adequately represent the CPMG measurement system, it would be correct (by taking logarithms) to accept the relationship for the relaxation rate of the total resonance signal given by:
Obviously, if the characteristics of the analyzed medium and the measurement conditions are not appropriate (strong external field and the presence of minerals with enough magnetic properties) to produce the diffusion relaxation, the rate of this resonance mechanism would not appear in Eqs 4, 5.
Many publications in the recent decades state, whether directly or through citations, that the components of NMR, the ones corresponding to the free fluid porosity, to the surface layer, and to the diffusion relaxation, are produced in parallel, and hence, that Eq. 5 can be applied generally (Hürlimann and Venkataramanan, 2002; Al-Mahrooqi et al., 2006; Keating and Knight, 2007; Daigle and Dugan, 2009; Grunewald and Knight, 2011; Behroozmand et al., 2015).
After the above background overview, the authors of this communication agree that the three NMR mechanisms occur in parallel, but disagree that it implies Eq. 5. Therefore, the objective of this paper is to demonstrate that Eq. 5 is not suitable for use in permeability estimations. To achieve this goal, the methods employed have been to show the contradiction with the much more widely accepted relationships and to show a computation example from three typical decay rates, which proves that the sum of the three exponential signals does not comply with Eq. 5.
The influence of Eq. 5 on the permeability estimation lies in that most used relationships to estimate permeability are the Schlumberger Doll Research (SDR) (Kenyon et al., 1988) and the Timur-Coates (T-C) (Timur, 1969; Coates et al., 1999). The SDR is based on the mean decay time of the total resonance signal, while in the T-C the estimation of the free-fluid volume (FFI) is based on the assumption that the producible fluids reside in larger pores (Coates et al., 1999). However, given that the decay time corresponding to the intergranular free fluid is typically ten times greater than that corresponding to the surface layer, if Eq. 5 is considered correct, the free fluid decay rate is currently neglected (Latour et al., 1995; Weller et al., 2010; Grunewald and Knight, 2011; Osterman et al., 2016, among many others). This removal may lead to the assumption that the permeability of a medium does not depend on the free fluid decay time. In addition, this approach contrasts with the fact that relaxation time of the total resonance signal already provides an appropriate value for the estimation of the permeability, generally dependent on the content of free fluid, although it can correspond to surface relaxation for very small pore sizes.
Evidences of the Weakness of the Criticized Relationship
The main question raised is whether the distribution over time of the resonance total signal is equal to the sum of exponentials (used for T1 in older studies) or to the product (assumed for T2 since 1990). The values of T1 and T2, which most authors consider to be of the same order of magnitude for water saturated media T1/T2 ∼ 1.5 (in hydrocarbon saturated media this ratio ranges from 5 to 15), lead to conclude that T1 and T2 distribution must correspond to similar decomposition. From the result of algebraic operation, if the resonance total signal were the sum (in-parallel mechanisms), the total decay time would be close to the longest decay time, and if it were the product (in-series mechanisms), the total decay time would be close to the shortest time. Thus, If it were the product, in water-saturated media, where the wetting layer is present, the decay time of the resonance total signal would be close to the surface decay time (tens of ms), which for the authors’ knowledge, is contradicted by the results shown in the literature. The total relaxation time extracted from well logs when there is a significant presence of producible water, is similar to that for the free fluid (few hundred of ms) (see Figure 5A).
Therefore, the logic of the decomposition of the relaxation curve ANMR(t) leads to that must be realized by the sum of exponentials, which can be expressed in the form,
where IMG, IS and IB address the relative amplitude of each relaxation mechanism in the analyzed fluid volume.
In this communication, we state that Eq. 5 is not adequate for two reasons. The first reason is that, as NMR in porous media is a phenomenon in which the three mechanisms are produced in parallel, we stated this implies that NMR relaxation must be considered as a sum of exponential functions. That is, Eq. 6 is considered to be more appropriate, since essentially maintains the same conceptual decomposition as Eq. 3, and is the current basis for the decomposition in porous media of the total relaxation curve in the main NMR effects [the determination of the distribution of the ANMR(t) relaxation curve is not the subject of this communication]. Thus, if Eq. 6 is correct, which in this work is considered indisputable, it is mathematically impossible to consider that Eq. 4 is also correct, and therefore, to consider Eq. 5 valid.
Both Equations 4, 6 are presented in most works as relationships for a single pore, not specifically reflecting that they apply to the decomposition of the signal corresponding to all the pores of a porous medium.
Regarding Equation 4, for multiple pores of radius sizes R, Kleinberg and Horsfield (1990) considered a Gaussian distribution around a central value R0, given by exp (-R/R0)2, so that the total NMR signal for multiple pores is given by:
In this equation, the exponential function corresponding to the magnetic gradient relaxation was substituted by the expression that relates its decay rate with the molecular diffusion coefficient. For the statement of Eq. 7, Kleinberg and Horsfield (1990) defined ρ2 = h/T2S (named “relaxivity” since Howard et al., 1993) and considered ρ2/h = ρ2·(SPOR/VPOR) which is equal to 3·ρ2/R for spherical grains. In Eq. 7, the exponential functions of bulk and diffusion relaxations do not depend on pore radius. From a theoretical standpoint, the influence of pore size on relaxation rates can be seen in Faux and McDonald (2018); besides remarking the surface relaxation at distance of a few nm and the influence of measurement frequency on T1 values, the bulk relaxation dependence on pore type and size is also showed.
One aspect that has strongly influenced the meaning of the decomposition of the T2 distribution, has been its correlation with the pore sizes in the medium (Loren and Robinson, 1970; Vogeley and Moses, 1992; Howard et al., 1993; Straley et al., 1994; Kenyon et al., 1995). Following Coates et al. (1999), the multi-exponential decomposition in water-saturated media reveals the distribution of pore sizes and each T2 value corresponds to each pore size, some authors consider that the T2 distribution only reflects the size of each pore. In contrast, we consider that the T2 distribution directly shows the weight of each exponential; in some cases, this distribution can be correlated with the pore size, but always reflects the existing relaxation mechanisms. Thus, as in the conventional conception for a saturated granular medium with a wetting fluid, e.g., water, the distribution values for times around hundreds of seconds are “proportional” to the fraction of pores with grain sizes larger than 4 μm (silts, sands and gravels), and the distribution values for low times are “proportional” to the amount of small pores. This is the reason why there are local maxima, or at least an inflection point, in the most frequent T2 distribution curves in sandstones (see examples in Figures 2, 3, 5). Disregarding magnetic gradient relaxation, these local maxima do not occur because two main pore sizes are common (bimodal grain size distribution), but because there are two main relaxation mechanisms.
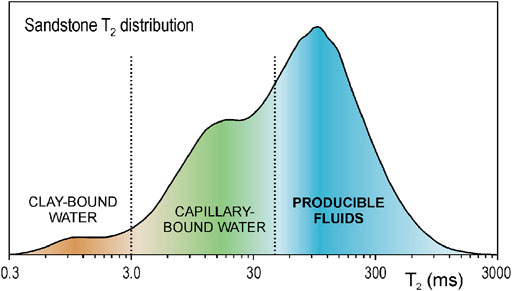
FIGURE 2. T2 distribution of a representative sandstone sample (adapted from Allen et al., 2000), in which the central value of the different relaxation mechanisms is indicated by graduated colors.
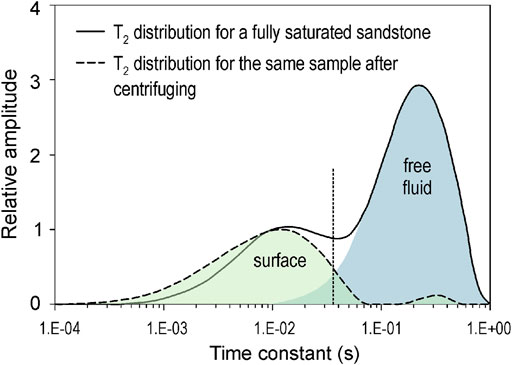
FIGURE 3. T2 distribution of a sandstone sample before and after extracting free fluids (adapted from Straley et al., 1994).
In the external reviews of this study, the extension to all the pores of a porous medium starts from A(t) = Σj (Aj·exp (−t/T2j)), where j denotes each pore. Then, in the absence of magnetic gradient relaxation, if contrary to that supported in this communication, the relationship 1/T2j = 1/T2Sj+1/T2Bj is considered valid, it would follow that Aj·exp (−t/T2j) = Aj·exp (−t/T1Sj)·exp (−t/T1Bj). The latter relationship would indicate that in each pore, the two mechanisms -surface and bulk-are not additive processes, but the relaxation mechanisms occur in series. The general extension of this relationship for multiple pores would be:
However, this signal does not match with the Laplace decomposition, whose conventional expression is given for the different decay times by:
Moreover, the T2 distribution addressed in Eq. 8 would reflect only the decomposition into different pore sizes, and from the product of exponentials, T2B and T2S could not be extracted (nor T2MG in the case of this mechanism occurs).
Therefore, when analyzing a porous medium in which there are different pore sizes, the generalization of the decomposition of the total NMR signal into the sum of exponentials is given by:
where IB, IS, and IMG are the relative amplitudes stated for Eq. 6, which are typically obtained by inverse Laplace transform, and j denotes the different spaces involved in each pore for each relaxation mechanism. Eq. 10 maintain the same decomposing showed in Equation 2 from Behroozmand et al. (2015) (Eq. 11), although in that work the magnetic field relaxing in the transverse direction with relaxation times T2j are not specifically related to the different relaxation mechanism.
Using properly the T2 CPMG system, although the transverse total resonance curve is the result of successive spots, this curve is not the series of juxtaposed values, but the concatenation of the values that reflect the state of relaxation of the resonance at times separated by a specific time interval. This fact is that justifies that the transverse total resonance curve shown in literature cases on sandstones (see Figure 5A) presents a T2 (time for which the value of the curve drops to 1/e of its initial value) close to that corresponding to bulk relaxation.
Equation 10 does not means that the observed transverse relaxation rate will be given by the weighted sum of bulk, surface and diffusion relaxation rates.
When the three relaxation mechanisms are considered in a single pore, the Laplace spectrum results in the sum of three type Dirac delta functions. Otherwise, if a porous medium with different pore sizes is analyzed (truly more realistic), the part of Laplace spectrum corresponding to each relaxation mechanism will be wider, and the result is the sum of three distributions centered on each relaxation mechanism. An example of the distribution of the three relaxation mechanisms provided by Eq. 10 is shown in Figure 2 (adapted from Allen et al., 2000).
Hence, except for the relationship criticized, the renowned foundations on the decomposition of the total signal, especially the results obtained in practical cases through the inverse Laplace transform, show that this decomposition consists of the sum of the different resonance processes, whether for a single pore size or for multiple sizes.
Unlike Equation 4, the physical significance assumed in this work to consider that the different relaxation mechanisms occur in parallel, is that they are produced by the same external fields. Each resonance mechanism occurs in its corresponding time interval although it may be overlapped, and the relative amplitude of each, by its own character, is weighted in the normalized curve of the total resonance response. However, each NMR decay rate does not significantly depend on the others as it happens with intensity in an electrical circuit when the current meets several resistors in parallel. As a representative example of this disengagement, figure 10 from Straley et al. (1994) of a sandstone sample has been selected (see Figure 3). T2 distribution of the surface relaxation for the centrifuged sample at 100 psi vs. air (the free fluid is then negligible) results very similar to the part of T2 distribution corresponding to the surface when the sandstone is fully saturated.
The second reason for disagreement with Eq. 4 is the corresponding Eq. 5, because in most real cases of porous media, none of the “measurable” relaxation times T1 or T2 meet Equation 1/T(1,2) = ∑(1/T(1,2)N), where N indicates the three relaxation mechanisms (B, S and MG).
This fact is easily verified by means of any practical example on a single pore, such as that shown in Figure 4. The values used for this example are IMG = 0.1 with T2MG = 5 ms for the diffusion relaxation, IS = 0.4 with T2S = 30 ms for the surface layer, and IB = 0.5 with T2B = 270 ms for the free fluid, which are typical values for sandstones (see the similar values used in Figure 1 from Timur, 1969, and see also Straley et al., 1994; Allen et al., 2000; Mohnke, 2014; Osterman et al., 2016). As it can be seen in Figure 4, the “observable” value of 1/T2 (the obtained rate when total NMR curve is fitting to an exponential function) is 1/255 = 0.0039 ms, while the result of 1/TB+1/TS+1/TMG = 0.20 + 0.033 + 0.0037 = 0.237 ms is 100 times higher, demonstrating that it is generally not possible to adopt Eq. 5.
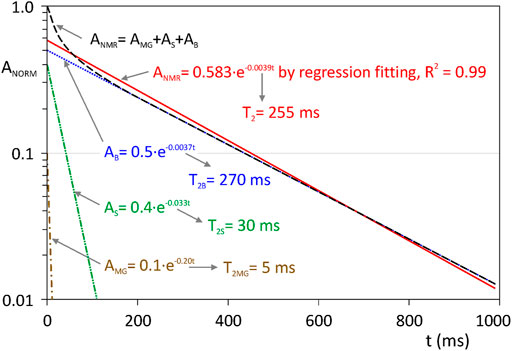
FIGURE 4. Plot of three mono-exponential functions corresponding to the bulk, surface and diffusion relaxation, together the total signal (sum of three). –·–·– Diffusion relaxation (IMG = 0.1, T2MG = 5 ms); –··–··– Surface relaxation (IS = 0.4, T2S = 30 ms); ······ Bulk relaxation (IB = 0.5, T2B = 270 ms); – – – Sum of relaxation mechanisms; –––– Fit to exponential function.
The same would occur if only two relaxation mechanisms were considered or if several relaxation times are considered for each mechanism. Thus, the conclusion is the same for the three exponentials of the single pore model, as for the nB+nS+nMG exponentials of a multiple pore sample. In short, it is mathematically obvious that if a given curve is the sum of more than two exponentials functions with clearly differentiated decay times, the rate showed by the curve is not equal to the sum of rates of each exponential function.
In spite of the above, it should be noted that as the distribution of the VS and VB fractions exhibit a progressively greater difference, the decay of the total relaxation curve would become more similar to the decay time corresponding to the free porosity. It is necessary to exclude the cases in which measurements are carried out within a total time span close to the time of surface relaxation, and where the relative volume of the surface layer in the total volume is close to the porosity of the “free” fluid (which is the case for high clay content). It should also be noticed that although Eq. 5 appears to indicate that longer decay times (TB » TS » TMG) have less influence on the slope of the average straight line on a logarithmic scale, in practice the mean relaxation time TML is more similar to the longer decay time.
Results on Permeability Estimation
According to the last paragraphs of Background section, it is concluded that it is too bold to state that the permeability of a porous medium is independent of the free fluid decay time, because 1/T ≠ 1/TS. That statement is only true if the area corresponding to the free fluid under the Laplace spectrum of the total resonance signal is negligible compared to the area corresponding to the surface layer (very small pores).
In order to evaluate the error that the criticized equation can produce in the permeability estimation, the T2 distribution of the work of Kenyon et al. (1995), p. 3, has been taken as an example (see Figure 5). In Figure 5A) the signal amplitude of the total resonance signal together with fitting curve to the digitizing data are shown. Considering the CMR porosity Ø for the total resonance signal (equal to the area under the T2 distribution) and the corresponging porosity ØB and ØS for the bulk and surface mechanisms (see Figure 5B), the values Ø = 0.29, ØB = 0.225, and ØS = 0.064 are obtained. Fitting the total resonance signal to a monoexponential function T2 = 0.170 s, and fitting the signals corresponging to the bulk and surface mechanisms, the decay rates obtained are T2B = 0.180 s and T2S = 0.020 s. Using the powers established by Kenyon et al. (1988) to estimate the permeability from logarithmic-mean T2, k = constant·Ø4·T22, and taking constant = 50, the resulting value is k = 1.01·10–2 darcy. However, if only the T2S component is considered because 1/T2B«1/T2S, the resulting permeability value would be k = 3.1·10–7 darcy. The fact that the ratio between these values (independently of the factor 50 adopted) reaches four orders of magnitude, demonstrates the importance of the present study for permeability estimation with NMR techniques.
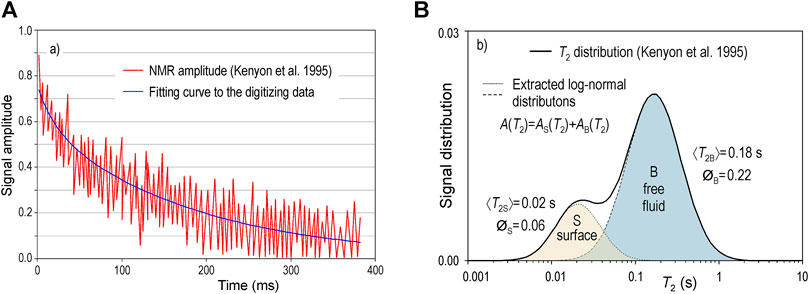
FIGURE 5. Example of a T2 distribution adapted from Kenyon et al. (1995). (A) signal amplitude and fitting curve to the digitizing data. (B) signal distribution.
The results presented in Figure 5A) are a verification that the decay time of the total signal is similar to the bulk relaxation time, contrary to would occur if criticized equation was correct.
Discussion and Conclusion
The concepts and relationships established in Brownstein and Tarr (1979) for the decomposition of the NMR response have been used in some publications; however, in this study it is considered that they do not apply to porous geological media. Brownstein and Tarr (1979) established that the amplitude of the different modes of surface relaxation is differentiated in fast, intermediate and slow regions, considering the occurrence of molecular diffusion, the absence of both, the volume-like sinks and the gradient of the external field. These modes are given as a function of the value M·a/D, where M is the average surface magnetization on the active surface, a the characteristic length of each geometry (flat, spherical and cylindrical), and D the molecular diffusion coefficient. Thus, in the so-called fast diffusion region, for which M·a/D«1, the amplitude of the lowest mode corresponding to the highest decay time T0 is much higher than the others, so that the total signal of NMR is completely dominated by the lowest mode. In the slow-diffusion region, the majority of the relative intensity still corresponds to the lowest mode and the higher modes contribute a few tens of percent following Brownstein and Tarr (1979). With this model, for which details of volume and surface-like “sinks” are unimportant (Brownstein and Tarr, 1979), the obtained relaxation times are in the order of several ms. However, it must be noted that the magnetic moment per unit volume is given in that work by multiplying a series of constants by the orthogonal spatial eigenfunctions. The final result for the total nuclear magnetization given in Equation 10 of Brownstein & Tarr, produces the same Laplace spectrum as that obtained by Eq. 10 in this work, so both solutions are equivalent.
The results of Results On Permeability Estimation section, it is verified that to extract more information from the T2 distribution, and then ruling out the bulk relaxation because 1/T2 ≈ 1/T2S, provides permeability values very different than the value directly obtained from measured T2. In practice of the most works, especially in industry, the permeability values obtained from this T2 providing satisfactory results. Although in this study, the example presented is considered very representative of typical values in sandstones, more validation of the proposed claims could be done by laboratory works.
In conclusion, the steps in the theoretical development of the expression of the NMR relaxation amplitude with time are unimportant if the exponential decay rate attributed to the total NMR signal is ultimately considered as the sum of the existing decay rates, the values of which are clearly different. Moreover, the characteristics of the measurement system do not matter if the dependence of the echo time, the wait time and the record time in the results are disregarded. If these parameters are adequately selected, the relationship 1/T = 1/TB+1/TS+1/TMG is not complied.
The criticized relationship has become irrefutable due to its widespread use, but no mathematical demonstration has been found to support that the total transverse NMR is the product of the three relaxation mechanisms. However, two very different evidences demonstrate that considering the rate of the total signal NMR equal to the sum of rates from each mechanism is not adequate.
Data Availability Statement
The original contributions presented in the study are included in the article/supplementary material, further inquiries can be directed to the corresponding author.
Author Contributions
JD-C has contributed in Conceptualization, Methodology, Writing—Original Draft, Investigation and Supervision. BB has contributed in Writing—Review & Editing, Formal analysis and Resources. LA-L has contributed in Writing – Review & Editing, Formal analysis and Visualization. MM has contributed in Review & Editing, and Visualization. RL-M has contributed in Review & Editing.
Funding
Part of this study was funded through the DENSOIL (CTM 2016-77151-C2-2-R) research grant from the Government of Spain (Ministerio de Economía y Competitividad) and the CARESOIL-CM (P2018/EMT-4317) research grant from the Regional Government of Madrid (Comunidad de Madrid).
Conflict of Interest
The authors declare that the research was conducted in the absence of any commercial or financial relationships that could be construed as a potential conflict of interest.
Publisher’s Note
All claims expressed in this article are solely those of the authors and do not necessarily represent those of their affiliated organizations, or those of the publisher, the editors and the reviewers. Any product that may be evaluated in this article, or claim that may be made by its manufacturer, is not guaranteed or endorsed by the publisher.
References
Allen, D., Flaum, C., Ramakrishnan, T. S., Bedford, J., Castelijns, K., and Fairhurst, D. (2000). Trends in NMR Logging. Oilfield Rev. 12 (3), 2–19.
Al-Mahrooqi, S. H., Grattoni, C. A., Muggeridge, A. H., Zimmerman, R. W., and Jing, X. D. (2006). Pore-scale Modelling of NMR Relaxation for the Characterization of Wettability. J. Pet. Sci. Eng. 52 (1-4), 172–186. doi:10.1016/j.petrol.2006.03.008
Behroozmand, A. A., Keating, K., and Auken, E. (2015). A Review of the Principles and Applications of the NMR Technique for Near-Surface Characterization. Surv. Geophys. 36 (1), 27–85. doi:10.1007/s10712-014-9304-0
Bernin, D., and Topgaard, D. (2013). NMR Diffusion and Relaxation Correlation Methods: New Insights in Heterogeneous Materials. Curr. Opin. Colloid Interf. Sci. 18 (3), 166–172. doi:10.1016/j.cocis.2013.03.007
Bloembergen, N., Purcell, E. M., and Pound, R. V. (1948). Relaxation Effects in Nuclear Magnetic Resonance Absorption. Phys. Rev. 73 (7), 679–712. doi:10.1103/PhysRev.73.679
Brownstein, K. R., and Tarr, C. E. (1979). Importance of Classical Diffusion in NMR Studies of Water in Biological Cells. Phys. Rev. A. 19 (6), 2446–2453. doi:10.1103/PhysRevA.19.2446
Carr, H. Y., and Purcell, E. M. (1954). Effects of Diffusion on Free Precession in Nuclear Magnetic Resonance Experiments. Phys. Rev. 94 (3), 630–638. doi:10.1103/PhysRev.94.630
Coates, G. R., Xiao, L., and Prammer, M. G. (1999). NMR Logging Principles and Applications. Houston (USA): Halliburton Energy Services. Publication H02308.
Daigle, H., and Dugan, B. (2009). Extending NMR Data for Permeability Estimation in fine-grained Sediments. Mar. Pet. Geology. 26 (8), 1419–1427. doi:10.1016/j.marpetgeo.2009.02.008
Faux, D. A., and McDonald, P. J. (2018). Nuclear-magnetic-resonance Relaxation Rates for Fluid Confined to Closed, Channel or Planar Pores. Phys. Rev. E 96, 063110. doi:10.1103/physreve.98.063110
Fleury, M., and Romero-Sarmiento, M. (2016). Characterization of Shales Using T1-T2 NMR Maps. J. Pet. Sci. Eng. 137, 55–62. doi:10.1016/j.petrol.2015.11.006
Golsanami, N., Zhang, X., Yan, W., Yu, L., Dong, H., Dong, X., et al. (2021). NMR-based Study of the Pore Types' Contribution to the Elastic Response of the Reservoir Rock. Energies 14, 1513. doi:10.3390/en14051513
Grunewald, E., and Knight, R. (2011). A Laboratory Study of NMR Relaxation Times in Unconsolidated Heterogeneous Sediments. Geophysics 76 (4), G73–G83. doi:10.1190/1.3581094
Hertrich, M. (2008). Imaging of Groundwater with Nuclear Magnetic Resonance. Prog. Nucl. Magn. Reson. Spectrosc. 53 (4), 227–248. doi:10.1016/j.pnmrs.2008.01.002
Howard, J. J., Kenyon, W. E., and Straley, C. (1993). Proton Magnetic Resonance and Pore Size Variations in Reservoir Sandstones. SPE Form. Eval. 8, 194–200. doi:10.2118/20600-PA
Hürlimann, M. D., and Venkataramanan, L. (2002). Quantitative Measurement of Two-Dimensional Distribution Functions of Diffusion and Relaxation in Grossly Inhomogeneous fields. J. Magn. Reson. 157 (1), 31–42. doi:10.1006/jmre.2002.2567
Keating, K., and Knight, R. (2007). A Laboratory Study to Determine the Effect of Iron Oxides on Proton NMR Measurements. Geophysics 72 (1), E27–E32. doi:10.1190/1.2399445
Kenyon, W. E., Day, P. I., Straley, C., and Willemsen, J. F. (1988). A Three-Part Study of NMR Longitudinal Relaxation Properties of Water-Saturated Sandstones. Soc. Pet. Eng. Form. Eval. 3 (3), 622–636. doi:10.2118/15643-pa
Kenyon, W. E., Kleinberg, R. L., Straley, C., Gubelin, G., and Morriss, C. (1995). Nuclear Magnetic Resonance Imaging – Technology for the 21st century. Oilfield Rev. 7 (3), 19–33.
Kenyon, W. E. (1997). Petrophysical Principles of Applications of NMR Logging. Log Analyst. 38 (2), 21–43.
Kleinberg, R. L., and Horsfield, M. A. (1990). Transverse Relaxation Processes in Porous Sedimentary Rock. J. Magn. Reson. 88 (1990), 9–19. doi:10.1016/0022-2364(90)90104-H
Korringa, J., Seevers, D. O., and Torrey, H. C. (1962). Theory of Spin Pumping and Relaxation in Systems with a Low Concentration of Electron Spin Resonance Centers. Phys. Rev. 127 (4), 1143–1150. doi:10.1103/physrev.127.1143
Larsen, J. J., Liu, L., Grombacher, D., Osterman, G., and Auken, E. (2020). Apsu - A New Compact Surface Nuclear Magnetic Resonance System for Groundwater Investigation. Geophysics 85 (2), JM1–JM11. doi:10.1190/geo2018-0779.1
Latour, L. L., Kleinberg, R. L., Mitra, P. P., and Sotak, C. H. (1995). Pore-size Distributions and Tortuosity in Heterogeneous Porous media. J. Magn. Reson. Ser. A 112 (1), 83–91. doi:10.1006/jmra.1995.1012
Legchenko, A., Baltassat, J. M., Beauce, A., and Bernard, J. (2002). Nuclear Magnetic Resonance as a Geophysical Tool for Hydrogeologists. J. Appl. Geophys. 50 (1-2), 21–46. doi:10.1016/S0926-9851(02)00128-3
Legchenko, A., Descloitres, M., Vincent, C., Guyard, H., Garambois, S., Chalikakis, K., et al. (2011). Three-dimensional Magnetic Resonance Imaging for Groundwater. New J. Phys. 13 (2), 025022. doi:10.1088/1367-2630/13/2/025022
Lewis, R. T., Djurhuus, K., and Seland, J. G. (2015). Characterising Oil and Water in Porous media Using Decay Due to Diffusion in the Internal Field. J. Magn. Reson. 259, 1–9. doi:10.1016/j.jmr.2015.07.004
Li, J., Jiang, C., Wang, M., Lu, S., Chen, Z., Chen, G., et al. (2020). Adsorbed and Free Hydrocarbons in Unconventional Shale Reservoir: A New Insight from NMR T1-T2 Maps. Mar. Pet. Geol. 116, 104311. doi:10.1016/j.marpetgeo.2020.104311
Loren, J. D., and Robinson, J. D. (1970). Relations between Pore Size Fluid and Matrix Properties, and NML Measurements. Soc. Pet. Eng. J. 10 (3), 268–278. doi:10.2118/2529-PA
Luo, Z.-X., Paulsen, J., and Song, Y.-Q. (2015). Robust Determination of Surface Relaxivity from Nuclear Magnetic Resonance DT2 Measurements. J. Magn. Reson. 259, 146–152. doi:10.1016/j.jmr.2015.08.002
Maneval, J. E., Nelson, M. L., Thrane, L. W., Codd, S. L., and Seymour, J. D. (2019). A Two-Region Transport Model for Interpreting T1-T2 Measurements in Complex Systems. J. Magn. Reson. 308, 106592. doi:10.1016/j.jmr.2019.106592
Mardon, D., Prammer, M. G., and Coates, G. R. (1996). Characterization of Light Hydrocarbon Reservoirs by Gradient-NMR Well Logging. Magn. Reson. Imaging 14 (7-8), 769–777. doi:10.1016/S0730-725X(96)00162-2
Meiboom, S., and Gill, D. (1958). Modified Spin‐Echo Method for Measuring Nuclear Relaxation Times. Rev. Sci. Instr. 29 (8), 688–691. doi:10.1063/1.1716296
Mohnke, O. (2014). Jointly Deriving NMR Surface Relaxivity and Pore Size Distributions by NMR Relaxation Experiments on Partially Desaturated Rocks. Water Resour. Res. 50 (6), 5309–5321. doi:10.1002/2014WR015282
Osterman, G., Keating, K., Binley, A., and Slater, L. (2016). A Laboratory Study to Estimate Pore Geometric Parameters of Sandstones Using Complex Conductivity and Nuclear Magnetic Resonance for Permeability Prediction. Water Resour. Res. 52 (6), 4321–4337. doi:10.1002/2015WR018472
Petrov, O. V., and Stapf, S. (2017). Parameterization of NMR Relaxation Curves in Terms of Logarithmic Moments of the Relaxation Time Distribution. J. Magn. Reson. 279, 29–38. doi:10.1016/j.jmr.2017.04.009
Roy, J., and Lubczynski, M. (2003). The Magnetic Resonance Sounding Technique and its Use for Groundwater Investigations. Hydrogeol. J. 11 (4), 455–465. doi:10.1007/s10040-003-0254-8
Seevers, D. O. (1966). “A Nuclear Magnetic Method for Determining the Permeability of Sandstones,” in Transactions on SPWLA 7th Annual Logging Symposium, Tulsa Oklahoma, May 1966. paper L.
Straley, C., Rossini, D., Vinegar, H., Tutunjian, P., and Morriss, C. (1994). “Core Analysis by Low Field NMR. Society of Core Analysts Paper SCA-9404,” in Proceedings of the 1994 International Symposium of the Society of Core Analysts. Stavanger, Norway. Later publ. Log Analyst, 38, 84–93.
Timur, A. (1969). Pulsed Nuclear Magnetic Resonance Stxudies of Porosity, Movable Fluid, and Permeability of Sandstones. J. Pet. Tech. 21 (6), 775–786. doi:10.2118/2045-PA
Vogeley, J. R., and Moses, c. O. (1992). 1HNMR Relaxation and Rock Permeability. Geochim. Cosmochim. Acta 56 (7), 2947–2953. doi:10.1016/0016-7037(92)90372-P
Weller, A., Nordsiek, S., and Debschütz, W. (2010). Estimating Permeability of sandstone Samples by Nuclear Magnetic Resonance and Spectral-Induced Polarization. Geophysics 75 (6), E215–E226. doi:10.1190/1.3507304
Keywords: nuclear-magnetic-resonance, permeability, decay rates, free fluid, bulk
Citation: Díaz-Curiel J, Biosca B, Arévalo-Lomas L, Miguel MJ and Loayza-Muro R (2021) On the Validity of the Relationship 1/T = 1/TB+1/TS+1/TD in NMR Techniques With Regards to Permeability Estimation of Natural Porous Media. Front. Earth Sci. 9:688686. doi: 10.3389/feart.2021.688686
Received: 31 March 2021; Accepted: 17 August 2021;
Published: 31 August 2021.
Edited by:
Lars Ehm, Stony Brook University, United StatesReviewed by:
David Faux, University of Surrey, United KingdomNaser Golsanami, Shandong University of Science and Technology, China
Shuangfang Lu, China University of Petroleum, China
Copyright © 2021 Díaz-Curiel, Biosca, Arévalo-Lomas, Miguel and Loayza-Muro. This is an open-access article distributed under the terms of the Creative Commons Attribution License (CC BY). The use, distribution or reproduction in other forums is permitted, provided the original author(s) and the copyright owner(s) are credited and that the original publication in this journal is cited, in accordance with accepted academic practice. No use, distribution or reproduction is permitted which does not comply with these terms.
*Correspondence: Jesús Díaz-Curiel, j.diazcuriel@upm.es