Four Years of Earthquake Early Warning in Southern Iberia: 2016–2019
 Marta Carranza1
  Maurizio Mattesini
 Aldo Zollo
 Irene Torrego
- 1Instituto Geográfico Nacional, Madrid, Spain
- 2Departamento de Física de la Tierra y Astrofísica, Universidad Complutense de Madrid, Madrid, Spain
- 3Instituto de Geociencias (UCM-CSIC), Facultad de Ciencias Físicas, Madrid, Spain
- 4Dipartimento di Fisica Ettore Pancini, Universitá Federico II, Naples, Italy
The performance of an earthquake early warning system (EEWS) for southern Iberia during the period of 2016–2019 is analyzed. The software PRESTo (PRobabilistic and Evolutionary early warning SysTem; the University of Naples Federico II, Italy) operating at the Universidad Complutense de Madrid has detected 728 events (2 < Mw < 6.3), with 680 earthquakes occurring in southern Iberia. Differences between the EEWS origin time and epicenter and those of the Instituto Geográfico Nacional (IGN) catalog are less than 2 s and 20 km, respectively, for 70% of the detected earthquakes. The main differences correspond to the EEWS magnitude that is underestimated for earthquakes that occurred at the west of the Gibraltar Strait (Mw differences larger than 0.3 for 70%). To solve this problem, several relationships have been tested, and a modification to those that currently use PRESTo is proposed. Other improvements, such as to densify the network or to use 3D Earth models, are proposed to decrease the time needed to issue the alert and avoid the false alerts (19 events over a total of 728 events). The EEWS has estimated the depth for 680 events and compared to those from the IGN (491 events). The performance of PRESTo during the 2020–2021 Granada swarm is analyzed. The hypocentral locations for the three largest earthquakes are close to those from the IGN (differences from 1 to 7 km for the epicenter and 0 s for the time origin), although there are some differences in their magnitude estimations that varies from 0.2 to 0.5. The PRESTo first times are 17, 25, and 41 s after the origin time. This study shows that the actual PRESTo EEWS configured for the southern Iberia may generate effective warnings despite the low seismicity rate in this region. To decrease the warning time, the geometry and density of the seismic network must be improved together with the use of 3D Earth models and on-site system approaches.
Introduction
Many large earthquakes have occurred in southern Iberia, located at the plate boundary between Eurasia and Africa, some of which caused severe damage and generated devastating tsunamis [Lisbon 1755, Imax = X; Saint Vincent Cape (SVC), 1969 Mw = 7.8; Boumerdes 2003, Mw = 6.8; Figure 1]. The 20th century has not been very seismically active, with a deficit of large earthquakes (Buforn et al., 2015). During the period 2000–2020, three moderate earthquakes (5.0 < Mw < 6.5) have occurred in this region, resulting in serious damage: the 2004 Al Hoceima, Morocco (Mw = 6.4, Ait Brahim et al., 2004), and the 2011 Lorca, Spain (Mw = 5.1, Morales et al., 2014), or social alarm, such as the one observed in the 2016 Alboran Sea (Mw = 6.4, Buforn et al., 2017; Stich et al., 2020). To mitigate the damage generated by earthquakes in the region, the Universidad Complutense de Madrid (UCM) has led two projects to study the feasibility of an earthquake early warning system (EEWS) in the region, namely, the ALERTES (2011–2013) and the ALERTES-RIM (2014–2016) projects, with the participation of the Real Instituto y Observatorio de la Armada, San Fernando (ROA), and the Institut Geologic de Catalunya (IGC, actually ICGC) (Buforn et al., 2016; Carranza et al., 2017).
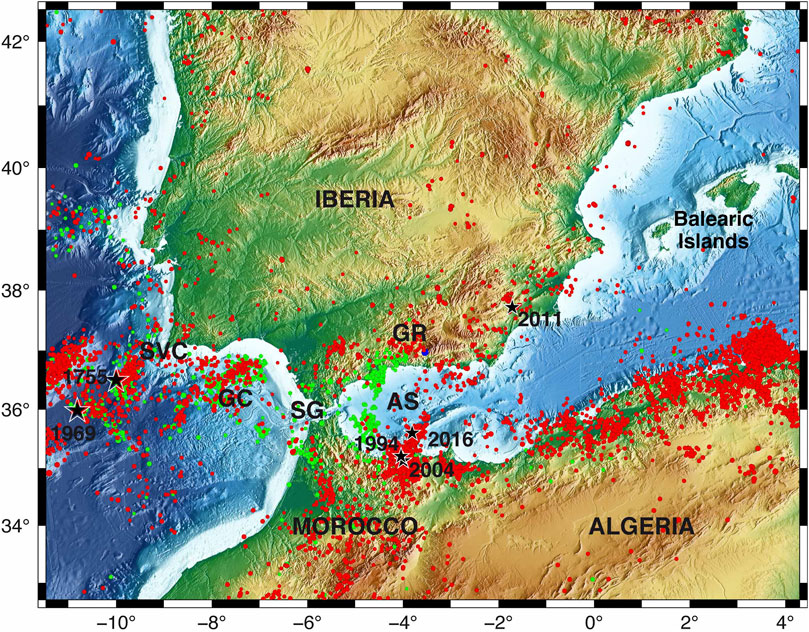
FIGURE 1. Seismicity of the Ibero–Maghrebian Region for the period of 2000–2019 (M ≥ 3.0) taken from the IGN catalog (https://www.ign.es/web/ign/portal/sis-catalogo-terremotos). Red circles correspond to shallow earthquakes (h < 40 km), green to intermediate depths (40 < h < 150 km), and blue to deep events (h > 150 km). Stars show the epicenters of large or recent earthquakes. SG = Strait of Gibraltar, SVC = Saint Vincent Cape, GC = Gulf of Cadiz, AS = Alboran Sea, and GR = Granada.
The aim of an EEWS is to provide warnings within a few seconds after the occurrence of an earthquake prior to the arrival of the strong shaking, S-wave, at a target site. An EEWS uses data from a seismic network, together with the implementation of an algorithm capable of performing a real-time analysis of seismograms through telemetry, to determine the location, origin time, and magnitude. From the first few seconds of signal receipt, generally 3 s, the system ideally generates a warning before the arrival of the S wave motion at a target location (Wu and Kanamori, 2005; Zollo et al., 2010).
The elapsed time between the warning and the S-wave arrival, known as the lead time, is the time available to take actions designed to reduce the damage. However, there is a region known as the blind zone in which the S-wave arrives before the warning is issued (Satriano et al., 2011). The EEWS estimates the earthquake magnitude from several alert parameters obtained from the first seconds of the P-wave. The basic hypothesis is that these parameters provide enough information about the size of the earthquake (Wu and Kanamori, 2005; Zollo et al., 2006). Typically, EEWSs have two different configurations: a regional configuration, where the seismic network is located between the epicenter and the targets to trigger a warning, or an on-site configuration, in which the stations are located at the target site of the warning. These two configurations can be integrated into the same EEWS, which is especially useful in regions with more than one seismogenic zone, such as southern Iberia (Zollo et al., 2010).
Since 2011, the ALERTES and ALERTES-RIM projects have allowed us to study the feasibility of establishing an EEWS in the Ibero–Maghrebian region (IMR) that encloses southern Iberia and northern Morocco and Algeria. Carranza et al. (2013) obtained the relationships for the IMR that correlate the alert parameters Pd and τc with the magnitude and the peak ground velocity, respectively. Pazos et al. (2015) tested the performance of three different software platforms (Earthworm, SeisComP3, and PRESTo) during the simulation of four representative earthquakes that occurred in SW Iberia. In October 2015, an EEWS based on PRESTo software (Probabilistic and Evolutionary early warning SysTem, Satriano et al., 2011; Zollo et al., 2016) was installed at the Universidad Complutense of Madrid (Spain). Carranza et al. (2017) have analyzed the first five months (October 2015–February 2016) of the system’s real-time performance, discussing the hypocentral location and the magnitude obtained by the EEWS in comparison with the values provided by the Instituto Geográfico Nacional (IGN). These authors have included a detailed study of lead times provided by PRESTo for the 2016 Alboran Sea earthquakes and the 2016 southwest SVC (Mw 4.5) earthquakes.
In this article, we discuss the performance of PRESTo in the IMR for the period of 2016–2020. An important point of this study is to check the performance of an EEWS in a region of moderate magnitude earthquakes where large shocks are separated by long time intervals and where for the studied period, 2016–2019, only one shock has Mw = 6.4. To improve the PRESTo results, we tested different relationships to obtain the magnitude and possible modifications to the EEWS. In this study, we also discuss the PRESTo performance during the recent seismic sequence in Granada, where a swarm of earthquakes (more than 1900 small events, M < 3.0 and 31 earthquakes with 3.0 > M > 4.5) occurred from December 2020 to mid-February 2021.
The EEWS at the Ibero–Maghrebian Region
The EEWS was configured for a part of the IMR boundary box 32.7°N to 40.75°N and 11.47°W to 4.3°E (Figure 1) using a 2-km × 2-km grid. The PRESTo platform (Satriano et al., 2011; www.prestoews.org) developed by the RISSC Lab (the Experimental and Computational Seismology Laboratory of the Physics Department at the University of Naples Federico II, Naples, Italy) was installed on a Linux machine at the Universidad Complutense of Madrid (Dept. Física de la Tierra y Astrofísica). This software uses a regional approach where the seismic stations are deployed around the source region and the targets to protect, and its configuration has been adapted to the characteristics of IMR (for further details, see Carranza, 2016; Carranza et al., 2013, Carranza et al., 2017). The SeisComP3 software package and the SeedLink communication protocol are used to continuously receive the real-time signal of the stations, 39 velocity broadband seismic stations installed in the IMR: 26 from the Instituto Geográfico Nacional (IGN, https://doi.org/10.7914/SN/ES), 13 from the Western Mediterranean network (WM, https://doi.org/10.14470/JZ581150), and 2 from the Instituto Português do Mar e da Atmosfera (IPMA, https://doi.org/10.7914/SN/PM) network (Figure 2).
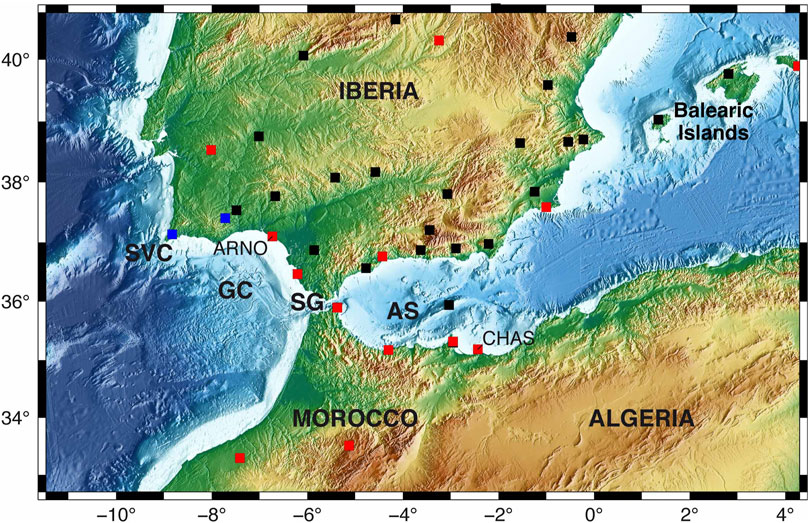
FIGURE 2. PRESTo receiving stations. Black squares = IGN, red = WM, blue = IPMA stations. SVC = Saint Vincent Cape; GC = Gulf of Cadiz; SG = Strait of Gibraltar; and AS = Alboran Sea.
The regional velocity grid model used for determining the hypocentral locations was generated from the NonLinLoc software package (Lomax et al., 2009). It is derived from the 1D velocity model used by the IGN catalog (Carreño et al., 2003). Our EEWS declares an event when a minimum of five stations are triggered. The maximum standby time, defined as the time which the EEWS is waiting for a fifth station detecting the earthquake since the first detection, is set to 45 s. All the arrivals detected within 3 min, after the first pick, are associated with the same event. Once the earthquake’s hypocenter is located, PRESTo measures the de Pd parameter in the first 2 and 4 s of the P wave (previously integrated and filtered with a two-pole high-pass Butterworth filter with a corner frequency of 0.075 Hz). The magnitude is estimated from the empirical relationship proposed by Carranza et al. (2017) for the IMR and normalized to a reference distance of 10 km
Here, Pd (peak ground displacement) is in cm and R is the hypocentral distance in km. The parameters calculated by PRESTo are updated as more stations detect the earthquake, up to 40 s after the first assessment. An alert is given for magnitudes larger than 5, and then an email is sent to some selected users. We have fixed this Mw threshold because earthquakes with such a magnitude have produced economic losses and human victims (the 2011 Lorca Mw = 5.1 earthquake).
We have also studied the time needed to issue the first warning after the origin time. The alert time can be affected by delays in the data transmission between the seismic stations and the reception center. This time delay (Δt) is estimated as the difference between the theoretical fastest alert and the observed alert time. The theoretical fastest alert is obtained as the time at the fifth station detecting the earthquake plus a 3-s window for measuring Pd.
Data and Results
The PRESTo software installed at UCM began its operations on October 9, 2015, and 768 earthquakes were detected until December 31, 2019. In that study, we analyzed the results from January 1, 2016, to December 31, 2019. Figure 3A shows the cumulative number of events detected by the EEWS versus time. Nearly half were detected in 2016 due to an increase in the seismicity of the region caused by the Alboran Sea seismic sequence (main shock January 25, Mw = 6.4). Since 2017, the seismicity has decreased, and the number of detected events is similar to that before 2016.
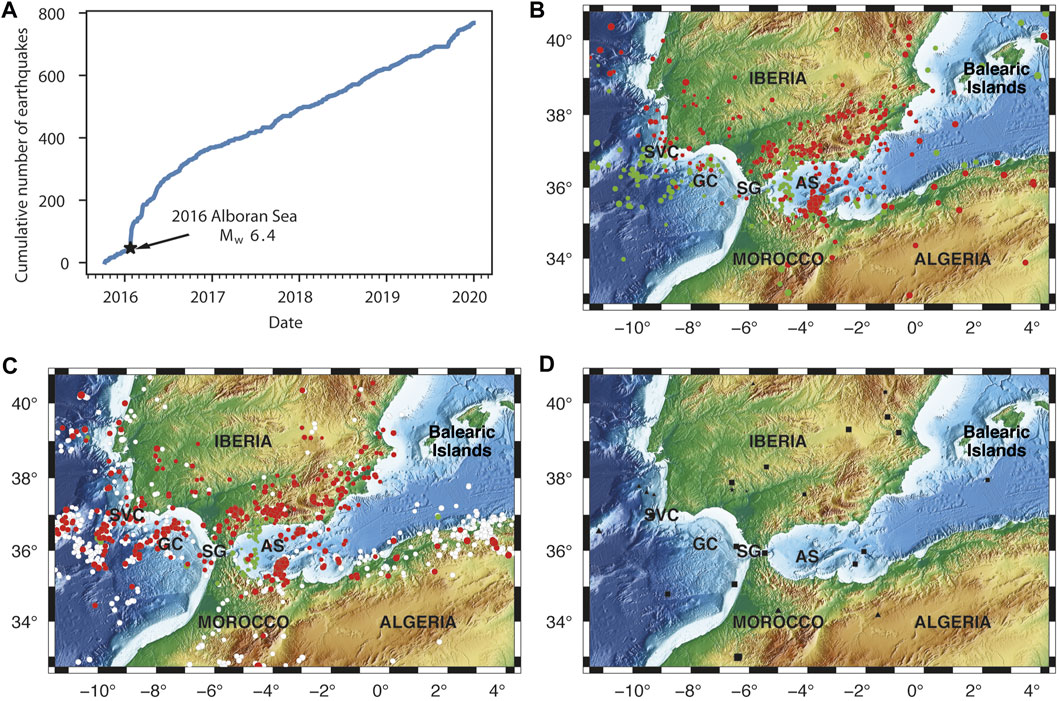
FIGURE 3. (A) Cumulative number of earthquakes detected by PRESTo from October 2015 to December 2019. (B) Epicenters detected by PRESTO from 2016 to 2019. (C) Comparison between the epicenters detected by PRESTo and IGN (in red) and only by IGN (white). (D) PRESTo false detections (black squares), explosions in mines (stars), or lost earthquakes (triangles). Acronyms same as those in Panel 1.
For the period 2016–2019, PRESTo detected 728 events, of which 680 (93.4%) corresponded to earthquakes located inside the IMR (Figure 3B and 2.0 < Mw < 6.3). We carried out a comparison of our results with the hypocentral locations and magnitudes obtained by the IGN. Previously, we homogenized the magnitudes estimated by the IGN to Mw using different scales (Carranza et al., 2013; Cabañas et al., 2015).
In Figure 3C, the distribution of epicenters located by PRESTo is represented by red circles, while white circles are the epicenters located by the IGN and not detected by the EEWS. We observe that the most undetected earthquakes occurred in northern Algeria, where the EEWS is not configured due to the lack of seismic stations (Figure 2), northern Morocco, where only few stations are available, or in the SVC-GC region that is characterized by offshore epicenters. For the detected earthquakes, the EEWS has obtained similar magnitudes and epicenters of the IGN (differences on a median are less than 0.3 and 12 km, respectively). When moving to the western side of the Gibraltar Strait, the number of earthquakes detected by the system is lower than the number of IGN locations, and in general, the PRESTo hypocenters are deeper. In northern Algeria, the number of earthquakes detected by EEWS is less (27%) than that of the IGN; however, we must remember that PRESTo has not been configured for Algeria.
The EEWS also detected seven events that correspond to mine explosions, and nineteen were false detections corresponding to teleseismic events with an Mw larger than 5.0. Six of these false detections are earthquakes that occurred outside the network and were located by PRESTo at the border region with an azimuth (that varies from 6° to 10°) roughly corresponding to the real azimuth. Seven false detections were large teleseismic earthquakes (6.0 < Mw < 7.1) that occurred at intermediate depths (50 km < h < 300 km) or very deep depths (h ≅ 500 km), such as those in Argentina or the Flores Sea. The percentage of false detections is rather low, 2.6% (19 events over a total of 728), and the Mw estimated by PRESTo for the 19 false detections varies from 2.5 to 4.7, which is lower than the magnitude’s threshold used to generate an alert (M = 5). Twenty-two earthquakes occurred in other zones of the Iberian Peninsula or in the Atlantic Ocean (Figure 3D). This means that 6.6% of the detected events correspond to false detections.
In Figure 4, we show the comparison of the PRESTo results and IGN locations plotting the difference between the IGN- and PRESTo-estimated parameters. We plotted the results for the region east of the Gibraltar Strait (EGS) earthquakes (536 events) in blue and those to the west of the Gibraltar Strait (WGE) earthquakes (144 events) in red.
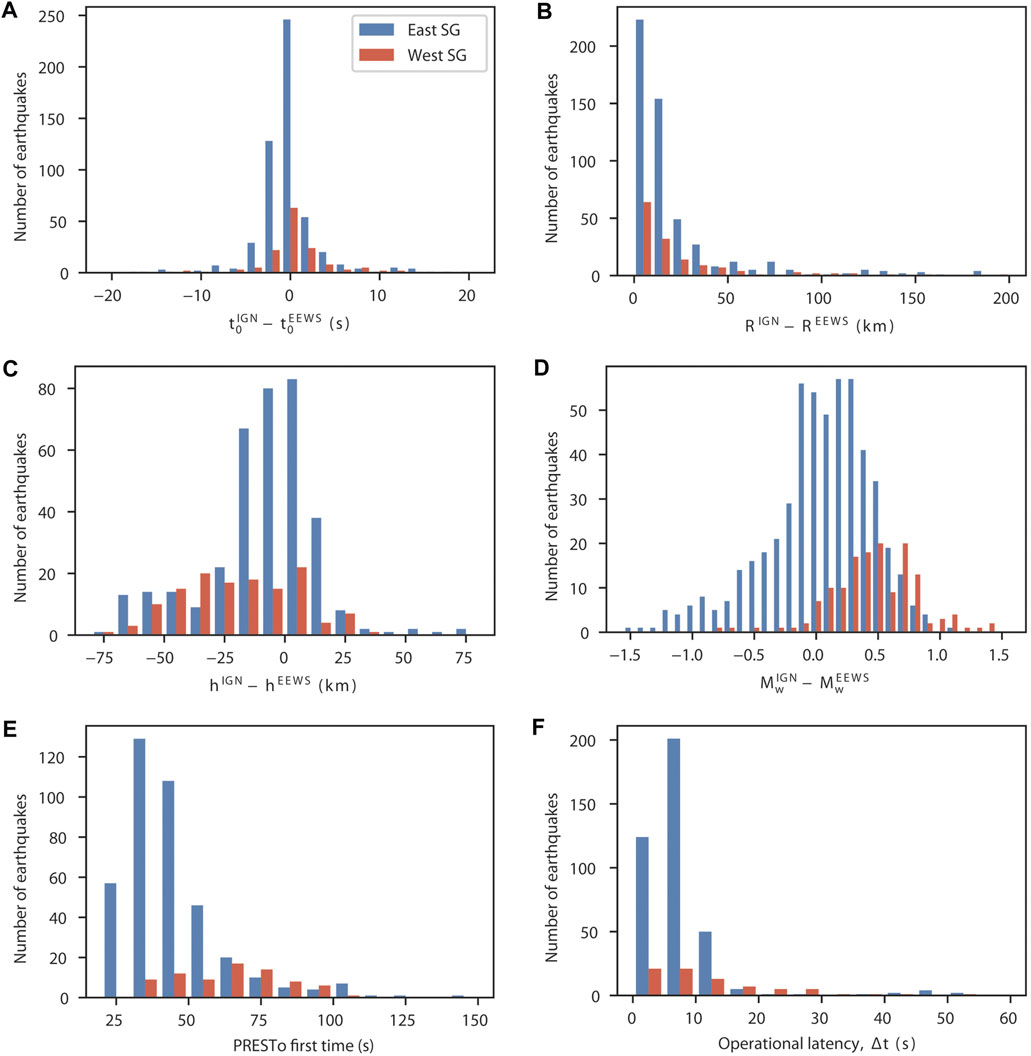
FIGURE 4. Comparison between IGN and PRESTo final estimations: (A) difference on origin time, (B) epicenter, (C) on depth, (D) on Mw, (E) PRESTo first time estimation, and (F) the operational latency. Red bars correspond to earthquakes located in the western Strait of Gibraltar, and blue bars correspond to earthquakes located in the eastern Strait of Gibraltar (SG).
The final PRESTo origin time estimation has a difference less than or equal to 2 s for 69% of the events, which increases up to 88% for differences lower than 5 s (Figure 4A). No significant difference was identified between the WGS and EGS earthquakes. For the WGS events, only one had a time difference larger than 20 s (33 s). For the EGS region, 17 earthquakes (less than 3%) had time differences larger than 20 s. Of them, 7 occurred in Algeria (3.8 < Mw < 4.6), 4 were part of a swarm that occurred in Jaen at the northern border of the EEWS region (Mw > 3.5), and PRESTo wrongly located earthquakes in the Balearic Islands. Finally, and six earthquakes occurred in Murcia or Alicante (eastern border of the EEWS region).
The difference in the modulus of the epicentral location (Figure 4B) is lower than 20 km for 70% of the EEWS-detected earthquakes, and there is no difference for WSG and ESG earthquakes. Five earthquakes have differences ranging from 600 to 880 km, which corresponds to earthquakes incorrectly located in the Balearic Islands and with time differences larger than 20 s. These differences in the location and, consequently, the magnitude may be due to the area coverage by the grid, which is relatively large.
The comparison of focal depth could only be carried out for 491 over a total of 680 earthquakes due to the lack of this parameter in the IGN estimations (Figure 4C). For some events with a focus offshore in the WGS region, the IGN either estimates the depth or it needs to use a fixed depth value. As a general tendency, PRESTo has obtained deeper foci than the IGN. While 75% of the EGS earthquakes have depth differences less than 20 km, this percentage suddenly decreases to 44% for the WGS events.
Differences in Mw estimated by PRESTo and IGN are shown in Figure 4D. There is a different behavior between WGS earthquakes, most of which have positive values and negative EGS values. For 55.0% of the EGS earthquakes, the Mw difference is less than or equal to 0.3, and the distribution has a larger dispersion moving toward negative values. For the WSG events, 70% have an Mw difference larger than 0.3, and the distribution is displaced to positive values and centered on 0.5 s. If we assume that the IGN magnitudes are correct (which is not necessarily true), then Figure 4D implies that PRESTo underestimates the magnitude of the WGS events.
The PRESTo first time (PET) and operational latency time are given in Figures 4E,F, respectively. Due to a problem with the system clock, only data from January 2016 to July 2018 are available. The PET for the EGS region varies from 20 to 50 s for most events, while for the WGS region, the PETs are somehow larger (from 30 to 100 s), with an average value of approximately 66 s. The operational latency is less than 10 s for most EGS events and slightly larger for the WGS region.
Performance of PRESTo for Period 2016–2019
From January 2016 to December 2019, PRESTo detected 680 earthquakes that occurred in the EEWS-defined region. The number of events with magnitudes 4 < Mw < 5 detected by our EEWS is 59 versus the 95 shocks given by the IGN (https://www.ign.es/web/ign/portal/sis-catalogo-terremotos). The 36 earthquakes lost by PRESTo correspond to the 2016 Alboran aftershocks (8 events, Carranza et al., 2017), Algerian earthquakes (18 events), or Alboran intermediate depth events (3 shocks, h > 40 km), and 7 are earthquakes not detected by PRESTo. The 680 events detected by our EEWS have small differences with IGN determinations of the origin time, that is, less than 0.2 s for approximately 50% of earthquakes, and epicentral location, that is, less than 20 km for approximately 70% of events. The EEWS estimated the focal depth for the 680 earthquakes, while the IGN only estimated this parameter for 491 shocks, providing a clear indication of the good performance of PRESTo. Depth differences between the IGN and our EEWS are sometimes greater than 20 km. However, for offshore earthquakes, in particular, those for the Gulf of Cádiz and Saint Vincent Cape regions, depth is the worst estimated parameter by the IGN. For the 2007/02/12 SW Saint Vincent Cape earthquake (Mw = 5.9), the IGN estimated h = 65 km, while detailed studies for this earthquake estimated depths ranging from 30 to 40 km (Stich et al., 2007; Custodio et al., 2012; Pro et al., 2013). Additionally, for Mw = 5 (23–01–2016), PRESTo has estimated h = 76 km, and the IGN h = 55 ± 44 km (Carranza et al., 2017). Therefore, for EGS earthquakes, we can conclude that focal depth estimations are more accurate. For the Alboran 2016 (Mw = 6.4) earthquake, PRESTo estimated h = 18 versus 12 km from the IGN and 7 km from slip inversion (Buforn et al., 2017). A refined depth is important, for example, the Lorca earthquake produces a large damage because of its shallow depth (h = 7 km), but in southern Iberia (Durcal, southern of Granada city) deep earthquakes (h ≈ 650 km) also occur with moderate-to-large magnitude such as the 1954 (Mw = 7.8) and 2010 (Mw = 6.2) Granada earthquakes. The deep earthquakes do not produce damage, and consequently, the EEWS should not generate an alert for them.
The largest differences between PRESTo and IGN estimations are retained in the values of Mw, and this is the basic parameter needed to give an alert. First, we can consider that the final magnitude estimated by PRESTo is more reliable than the first estimation (using only five stations) because generally, it has been obtained using more stations. If we assume that the IGN magnitudes are correct, we conclude that for WGS events, PRESTo underestimates Mw (Figure 4D), which is the zone where the largest earthquakes have occurred (Figure 1).
Application to the 2020–2021 Granada Seismic Swarm
In December of 2020, a seismic crisis began in Granada (Figure 1) as a swarm of earthquakes, which was still active as this paper was being written. It is worth noting that in this zone, on December 25th, 1884, the last great damaging earthquake occurred in Spain (Imax = IX−X, Udías and Muñoz, 1979, Figure 5). We present the performance of PRESTo for this swarm. The swarm began on December 1, 2020, and lasted until February 19, 2021, during which more than 1900 earthquakes occurred, five with Mw > 4.0 and two with Imax = V−VI (EMS−98). The earthquakes produced serious damage in the area located west of the city of Granada (https://www.ign.es/resources/sismologia/noticias/InformeIGN_SantaFe.pdf).
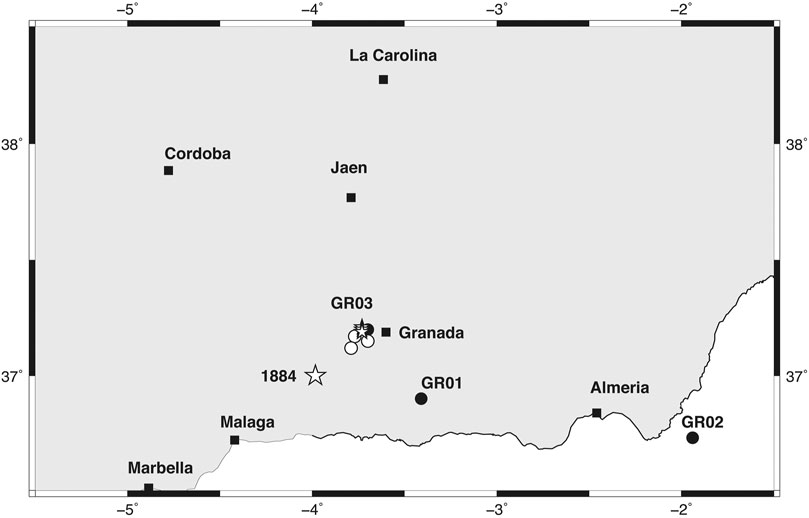
FIGURE 5. The Granada 2020–21 swarm. Black circles show the first PRESTo estimation, white circles show the final estimation, and white stars represent the IGN-derived epicenters and the 1884 epicenter (Imax = IX-X).
During the swarm, PRESTo detected 12 earthquakes, three of which corresponded to the largest shocks that occurred on January 26th at 21 h 36 m (GR01), 21 h 44 m (GR02), and 21 h 54 m (GR03). Two other large shocks (January 23rd and January 28th, both Mw = 4.4) occurred when the EEWS was not operating due to electric power supply problems. In Table 1, we present the origin time (t0), hypocenter, and magnitude (Mw) estimated by PRESTo (first alert time and the end of the process, 40 s later) and the IGN estimations for GR01, GR02, and GR03 (Figures 5, 6). The t0 estimated at the PRESTo first detection is lower than that given by the IGN for GR01 and GR02 and equal for GR03. However, at the end of the process, the time origin is equal.
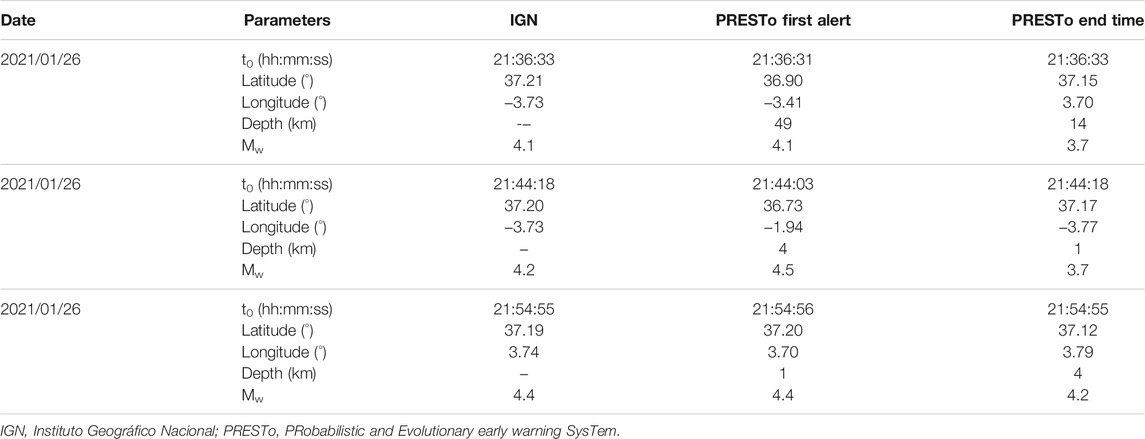
TABLE 1. Origin time, hypocentral location, and magnitude obtained by IGN and PRESTo (first alert and end time) for the Granada 2021 swarm.
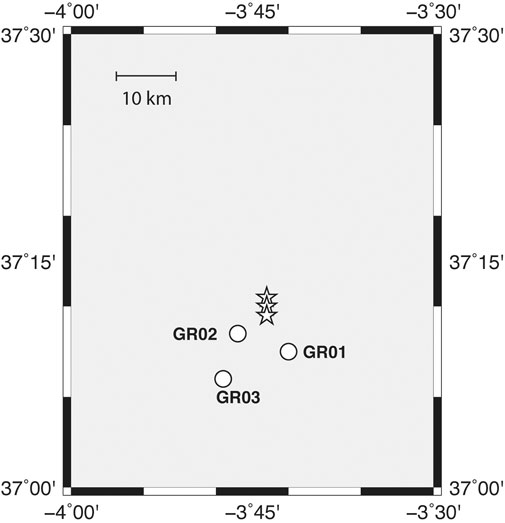
FIGURE 6. PRESTo final epicenters (white circles) and IGN (white stars).
The minor difference on the epicentral location corresponds to the largest event GR03. One observes that the first epicentral location (black circle, Figure 5) is similar in latitude to that of the IGN, with the difference being approximately 1 km in latitude and 4 km in longitude. The final PRESTo epicentral location (white circle Figures 5, 6) barely varies from the initial value (Table 1), with a difference in latitude with respect to the IGN location (white star Figures 5, 6) increasing to 6 km and a similar enhancement along the longitudinal direction (5 km). For GR01, the first epicentral location of the epicenter is located SE of the IGN location, with a difference of 31 km in latitude that decreases to 4 km for the final PRESTo estimation and a difference in longitude of 32 km for the first estimation that is reduced to 3 km for the final PRESTo estimation.
The GR02 event has the worst results. The first PRESTo estimation locates the epicenter offshore at 200 km in the SSE direction to the IGN epicenter, with a 47-km difference in latitude and a 183-km difference in longitude (Figure 6). The final estimation reduces this difference to 1 km in latitude and 4 km in longitude (Figure 6). The low number of stations in the east direction (Figure 2A) may explain why a larger error is found in the longitude (Carranza et al., 2017).
Depth has been estimated by PRESTo (14 km for GR01 and 1 km for GR02 and Gr03 at the final estimation), while the IGN does not provide this parameter. PRESTo estimated Mw 4.1, 4.5, and 4.4 for GR01, GR02, and GR03, respectively, at the first alert and Mw 3.7, 3.7, and 4.2 at the end of the process (40 s later), implying an error of 0.3–0.4 with respect to the IGN Mw estimations. The first PRESTo estimation of 17, 25, and 41 s was given for GR01, GR02, and GR03, respectively, after the origin time and experienced a 3-s theoretical delay in the data transmission. This warning time could have been shorter if some new stations installed in the Granada region were included in the EEWS.
Discussion
The comparison between the EEWS results and those of the IGN catalog shows that the major differences are on magnitude, with a different behavior for WGS and ESG earthquakes. An important point is that the IGN catalog uses three different magnitude scales. For earthquakes with offshore epicenter, such as the SVC-GC region (Figure 1), the scale is mb, while for those that occurred in southern Spain or the Alboran Sea is mbLg and for larger earthquakes is Mw (https://www.ign.es/web/resources/docs/IGNCnig/SIS-Tipo-Magnitud.pdf). Thus, we have homogenized the magnitudes estimated by the IGN to Mw by using the relationship proposed by Carranza et al. (2013) and Cabañas et al. (2015). The converted values are still found within an error of ±0.3 Mw, which is the median value for the difference between IGN and EEWS magnitudes (Carranza et al., 2017).
Carranza (2016) proposed two different relationships to estimate the Mw for WGS and EGS earthquakes in base of the observed differences (Figure 4D). Using these two equations in PRESTo instead of Eq. (1) for earthquakes in WGS and EGS during the period of 2016–2019, the results not only do improve but actually give higher differences. The same happens with another relationship for the whole IMR normalized to a reference distance of 200 km proposed by Carranza (2016), which does not give better results.
Finally, we consider the coefficient accuracy (Carranza et al., 2013), which is given as follows:
This correlation equation was computed with the mean value of the binned data (ΔMw = 0.3 bins) and weighted by the standard deviation of each mean value. From this expression, we observe that the independent term has the larger error (0.6), so we have checked different values for this term on Eq. 1. The best results have been obtained for the following relationship:
In Figures 7A,B, we plotted the Mw difference between the IGN magnitudes and PRESTo magnitudes using Eq. 1 (blue bars) or Eq. 3 (red bars). For the WGS region, the Mw differences decrease from −0.3 to 0.6 vs. −0.6 to 0.8 and are more centered. For the EGS region, we observe a similar behavior; the difference decreases from −0.9 to 0.9 vs. −0.3 to 0.7. From Figures 7A,B, we observe that a simple static correction of 0.2 to the PRESTo-derived magnitude would provide an excellent fit of the IGN magnitude. Besides, the EEWS gives Mw estimations on a real time, while the IGN catalog is continuously revised. In fact, there are differences between the first IGN earthquake estimation and those of the catalog, where more stations were added with respect to the first estimation. For the largest and damaging earthquakes occurred in the period 2000–2020 [2004 Alhoceima, Morocco, Mw = 6.4; 2011 Lorca, Spain Mw = 5.1; 2016 Alboran Sea (Mw = 6.4) the EEWS results (simulation and real time) are very close to those from the IGN catalog (Mw = 6.6, 4.9 and 6.5, respectively) (Carranza et al., 2017)].
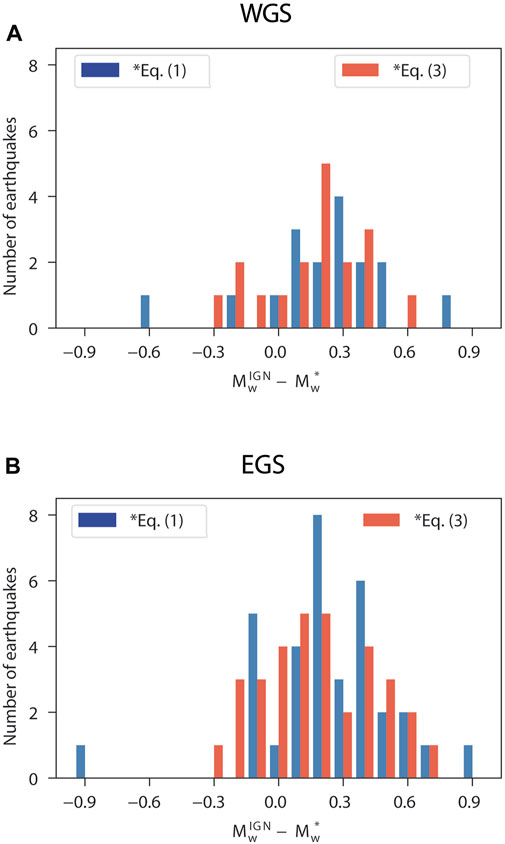
FIGURE 7. Differences between the IGN and EEWS magnitude estimations for earthquakes that occurred in the western Strait of Gibraltar (A) and the eastern Strait of Gibraltar (B).
For the Granada 2020–2021 swarm, we observe a similar behavior for the EEWS estimated Mw values, with a difference of 0.3–0.4 with respect to those from the IGN.
A possible explanation for the differences in magnitude between the WGS and EGS regions is the low magnitude of the data (Mw < 5.0). In the studied period, only one earthquake (2016 Alboran shock Mw = 6.4) had a magnitude larger than 6.0, 11 had Mw > 5.0, but three of them occurred in Algeria, where the EEWS was not configured. Another issue is the poor azimuthal coverage of the stations used; most of them are located on the Iberian Peninsula (29 stations), with three on the Balearic Islands and only 7 in northern Africa (Figure 2), while many of the earthquakes have offshore focuses (Figure 1). This deficient azimuthal coverage may explain the large differences in the origin time, or epicenter, between the IGN and PRESTo estimations. This earthquake mislocation, in particular, due to an average 20–25 km depth differences (Figure 4C) can reasonably explain the magnitude discrepancy (
Depending on R, (
The three Granada largest swarm earthquakes were felt over a wide area, with maximum EMS-98 intensities of IV-V for GR01 and GR02 and V-VI for GR03. In Table 2, we list the lead times for the seven largest towns closest to the epicenter (11 < R < 127 km) for both the first detection and end times. Granada and Jaen (Figure 6) are located inside the blind zone for the first detection due to their proximity to the epicenter (11 and 63 km, respectively). However, for Malaga (87 km), there is a 2-s lead time, which increases to 11 s for La Carolina, Córdoba (119 km), and Almeria (121 km) or 13 s for Marbella. However, these seven towns are inside of the no-warning zone waiting until the end of the process.
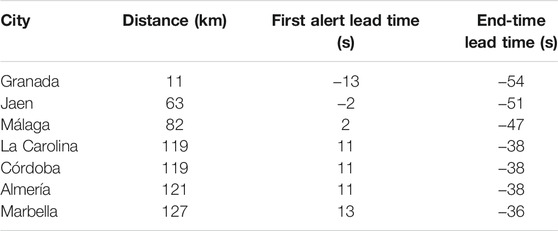
TABLE 2. Lead times at the seven cities closest to the epicenter for the largest Granada 2021 earthquakes.
The 2020–2021 Granada swarm shows that the EEWS has worked despite the low-moderate magnitude of the targeted earthquakes. Our EEWS is a regional system designed for large earthquakes and not probed for a situation similar to the Granada swarm. Nonetheless, we believe we can improve the efficiency of the Granada swarm.
For our regional EEWS, Carranza (2016) has estimated the potential damage zone (PDZ, alert zone), which is the area where the EEWS predicts a peak ground shaking level that could produce damage. In terms of intensity, this damage level corresponds to I=VII, strong perceiving shaking moderate damage that the USGS shake-maps associate with PGA = 21.5% g and PGV = 20 cm/s. Carranza (2016) has used two different relationships to estimate the PDZ for magnitudes 5 to 8 (Table 3): 1) the one of Wald et al. (1999) that was proposed for the United States and 2) the one of Faenza and Michelini (2010) introduced for Italy. For the 2011 Lorca earthquake (Mw = 5.1), the observed maximum intensity was VII (EMS-98) for a zone of 7 km around the epicenter, which is in agreement to the values shown in Table 3. For the 2016 Alboran earthquake (Mw = 6.4), with focus offshore, the observed maximum intensity was in Melilla (I=VI) located at 84 km from the epicenter. From Table 3, we conclude that for this Mw = 6.4, the radius of PDZ must be 12 km for the study by Wald et al. (1999) and 33 km for the study by Faenza and Michelini (2010). These values are in agreement to the observed intensity (VI) at 84 km. Unfortunately, we do not have other earthquakes with intensity equal to or larger than VII. However, we can safely conclude that in our regional EEWS, both the magnitude and the location of earthquakes used to map in real time the PDZ through an a priori GMPE are in agreement to the observed intensities.
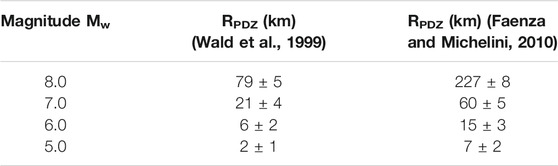
TABLE 3. Radius of potential damage zone (PDZ) for different magnitudes (Carranza, 2016).
The warning time is a critical value in an EEWS. The PRESTo end time of the detected earthquakes varies between 20 and 50 s for earthquakes in the EGS region and between 30 and 100 s in the WGS region. This difference is mainly due to the location of the epicenter with respect to the seismic network. To improve the EEWS results, we must increase the number of stations used. In the last years, the WM, IGN, and IPMA have installed new stations. We plan to add some of these stations to the EEWS, including, for instance, the TARIF station (WM) installed at the SG. Another solution is the use of a more detailed Earth model, including 3D models. The largest earthquakes in this region occur at SW of Saint Vincent Cape, such as the Lisbon 1755 (Imax = X) or the 1969 (Mw = 7.8) earthquakes (Figure 1), both with the marine focus and tsunami. It is a tectonically very complex region where the transition from oceanic to a continental crust starts. The use of 1D Earth models limits the accuracy on the hypocentral location and time origin. The present version of PRESTo estimates the hypocenter and the origin time by using a nonlinear algorithm (NonLinLoc software, Lomax 2009) and a 1D Earth model. However, the algorithm has already implemented the possibility to use a 3D Earth model. Recent studies for the hypocentral location in this region show that the use of 3D Earth models improves the estimation of focal parameters (Cabieces et al., 2020). It is understood that if we manage to improve the origin time and hypocenter, both the R parameter (Eq. 3) and the Mw will be also enhanced.
The use of an on-site method is another possible choice to improve the EEWS. A regional EEWS needs a minimum number of stations to declare an event (5 stations in our configuration), and the signal is transmitted from the stations to a “control” center where it is analyzed. As our network is sparse and disperse, and the largest and damaging earthquakes are located offshore (at 200 km from the coast), we expect that an on-site EEWS would reduce the time needed to issue a warning at a site as only one station is needed, and, furthermore, the latency time will decrease to 0.
Finally, the use of OBS telemetry would further help to reduce the lead time. This would be an optimal solution, but unfortunately not feasible at the moment due to the high cost of the equipment, maintenance, and data transmission.
Conclusion
The analysis of our EEWS performance between the periods of 2016 and 2019 shows that PRESTo detected 55 Mw > 4.0 earthquakes of 95 that occurred in southern Iberia, confirming the preliminary results shown by Carranza et al. (2017). The lost earthquakes are aftershocks of the Mw = 6.4 Alhoceima 2016, and earthquakes occurred in Algeria, where the EEWS is not configured or where the system was not operating. The origin time and the epicentral location are generally adequately determined, with low differences with respect to the IGN determinations (less than 0.2 s and 18 km, respectively, of the median values). The difference between the PRESTo estimated magnitudes and the IGN catalog lowers with the use of the modified relationship proposed in this study. Notably, we found a lower number of lost earthquakes or false detections.
One possible solution to the problems found could be deploying new stations in northern Africa. For the offshore foci west of Saint Vincent Cape, the use of a permanent real-time OBS would be an optimal solution.
The use of a more detailed 3D Earth model developed for the region could also improve the epicentral locations, depths, and origin times determined by the EEWS.
It is also necessary to improve the relationships for magnitude estimation. For this, we have modified and tested different relationships used on the EEWS, but more data and larger earthquakes are still needed to enhance the results.
The Granada 2020–21 swarm has demonstrated that an EEWS is useful and can provide alerts, even for moderate magnitude earthquakes. However, for this type of seismicity, it would be more efficient to use an on-site EEWS to reduce the number of lost aftershocks and the time needed to issue a warning. This could be achieved by using a shorter time window.
Data Availability Statement
The raw data supporting the conclusions of this article will be made available by the authors, without undue reservation.
Author Contributions
MC configured PRESTo, developed the relationships, and proposed its modifications. MM and EB have prepared the manuscript, tables, and part of figures. IT has prepared the data analysis and part of figures. All authors have contributed to the interpretation and discussion.
Funding
This work has been partially supported by the Spanish Ministerio de Economia, Industria y Competitividad, project CGL2017-86097-R, and the Comunidad de Madrid, project CT105/19/PEJD-2019-PRE/AMB-16483.
Conflict of Interest
The authors declare that the research was conducted in the absence of any commercial or financial relationships that could be construed as a potential conflict of interest.
Publisher’s Note
All claims expressed in this article are solely those of the authors and do not necessarily represent those of their affiliated organizations, or those of the publisher, the editors and the reviewers. Any product that may be evaluated in this article, or claim that may be made by its manufacturer, is not guaranteed or endorsed by the publisher.
Acknowledgments
The authors wish to thank the Real Insituto y Observatorio de la Armada (ROA), the Instituto Geográfico Nacional (IGN), and the IPMA for the real-time data reception. The authors thank the reviewer for their comments and suggestions.
References
Ait Brahim, L., Nakhcha, C., Tadili, B., El Mabret, A., and Jabour, N. (2004). Structural Analysis and Interpretation of the Surface Deformations of the February 24th, 2004 Al Hoceima Earthquake. CSEM-EMSC NewsLetter 21, 10–12.
Buforn, E., Pazos, A., Roca, A., Carranza, M., Martín Dávila, J. M., Udías, A., et al. (2016). ALERTES: An Earthquake Early Warning System for the Ibero-Maghrebian Región. Cahiers du Centre Européen de Géodynamique et de Séismologie 31, 31–40.
Buforn, E., Pro, C., Sanz de Galdeano, C., Cantavella, J. V., Cesca, S., Caldeira, B., et al. (2017). The 2016 South Alboran Earthquake (Mw= 6.4): A Reactivation of the Ibero-Maghrebian Region? Tectonophysics 712-713, 704–715. doi:10.1016/j.tecto.2017.06.033
Buforn, E., Udías, A., and Pro, C. (2015). Large Earthquakes at the Ibero-Maghrebian Region: Basis for an EEWS. Pure Appl. Geophys. 172 (9), 2387–2396. doi:10.1007/s00024-014-0954-0
Cabañas, L., Rivas-Medina, A., Martínez-Solares, J. M., Gaspar-Escribano, J. M., Benito, B., Antón, R., et al. (2015). Relationships between M W and Other Earthquake Size Parameters in the Spanish IGN Seismic Catalog. Pure Appl. Geophys. 172 (9), 2397–2410. doi:10.1007/s00024-014-1025-2
Cabieces, R., Buforn, E., Buforn, E., Cesca, S., and Pazos, A. (2020). Focal Parameters of Earthquakes Offshore Cape St. Vincent Using an Amphibious Network. Pure Appl. Geophys. 177, 1761–1780. doi:10.1007/s00024-020-02475-3
Carranza, M., Buforn, E., Colombelli, S., and Zollo, A. (2013). Earthquake Early Warning for Southern Iberia: APwave Threshold-Based Approach. Geophys. Res. Lett. 40 (17), 4588–4593. doi:10.1002/grl.50903
Carranza, M., Buforn, E., and Zollo, A. (2017). Performance of a Network‐Based Earthquake Early Warning System in the Ibero‐Maghrebian Region. Seismological Res. Lett. 88 (6), 1499–1507. doi:10.1785/0220170081
Carranza, M. (2016). Sistema de alerta sísmica temprana para el sur de la Península Ibérica: determinación de los parámetros de la alerta. Ph. D. Thesis. Madrid: Universidad Complutense de Madrid.
Carreño, E., López, C., Bravo, B., Expósito, P., Gurria, E., and García, O. (2003). Sismicidad de la Península Ibérica en la época instrumental: 1985-2002. In Física de la Tierra. Madrid: Servicio de Publicaciones, Universidad Complutense, Vol. 15, 73–91. Available at: https://revistas.ucm.es/index.php/FITE/article/view/FITE0303110073A.
Colombelli, S., and Zollo, A. (2015). Fast Determination of Earthquake Magnitude and Fault Extent from Real-timeP-Wave Recordings. Geophys. J. Int. 202, 1158–1163. doi:10.1093/gji/ggv217
Colombelli, S., Zollo, A., Festa, G., and Picozzi, M. (2014). Evidence for a Difference in Rupture Initiation between Small and Large Earthquakes. Nat. Commun. 5, 3958. doi:10.1038/ncomms4958
Custodio, S., Cesca, S., and Heimann, S. (2012). Fast Kinematic Waveform Inversion and Robustness Analysis: Application to the 2007 Mw 5.9 Horseshoe Abyssal Plain Earthquake Offshore Southwest Iberia. Bull. Seismological Soc. America 102, 361–376. doi:10.1785/0120110125
Faenza, L., and Michelini, A. (2010). Regression Analysis of MCS Intensity and Ground Motion Parameters in Italy and its Application in ShakeMap. Geophys. J. Int. 180, 1138–1152. doi:10.1111/j.1365-246x.2009.04467.x
Lomax, A., Michelini, A., and Curtis, A. (2009). EarthquakeEarthquake LocationEarthquake Location , Direct, Global-SearchGlobal-Search Methods, in Encyclopedia of Complexity and System Science, 5, (Springer, New York), 2449–2473, doi:10.1007/978-0-387-30440-3_150
Morales, J., Cantavella, J. V., de Lis Mancilla, F., Lozano, L., Stich, D., Herraiz, E., et al. (2014). The 2011 Lorca Seismic Series: Temporal Evolution, Faulting Parameters and Hypocentral Relocation. Bull. Earthquake Eng. 12, 1871–1888. doi:10.1007/s10518-013-9476-x
Pazos, A., Romeu, N., Lozano, L., Colom, Y., López Mesa, M., Goula, X., et al. (2015). A Regional Approach for Earthquake Early Warning in South West Iberia: A Feasibility Study. Bull. Seismological Soc. America 105, 560–567. doi:10.1785/0120140101
Pro, C., Buforn, E., Bezzeghoud, M., and Udías, A. (2013). The Earthquakes of 29 July 2003, 12 February 2007, and 17 December 2009 in the Region of Cape Saint Vincent (SW Iberia) and Their Relation with the 1755 Lisbon Earthquake. Tectonophysics 583, 16–27. doi:10.1016/j.tecto.2012.10.010
Satriano, C., Elia, L., Martino, C., Lancieri, M., Zollo, A., and Iannaccone, G. (2011). PRESTo, the Earthquake Early Warning System for Southern Italy: Concepts, Capabilities and Future Perspectives. Soil Dyn. Earthquake Eng. 31 (2), 137–153. doi:10.1016/j.soildyn.2010.06.008
Stich, D., Mancilla, F., Pondrelli, S., and Morales, J. (2007). Source Analysis of the February 12th 2007, Mw 6.0 Horseshoe Earthquake: Implications for the 1755 Lisbon Earthquake. Geophs. Res. Lett. 34. doi:10.1029/2007GL0300127
Stich, D., Martín, R., Morales, J., López-Comino, J. A., and Mancilla, F. L. (2020). Slip Partitioning in the 2016 Alboran Sea Earthquake Sequence (Western Mediterranean). Front. Earth. Sci. 8, 587356. doi:10.3389/feart.20210.3389/feart.2020.587356
Udías, A., and Muñoz, D. (1979). The Andalusian Earthquake of 25 December 1884. Tectonophysics 53, 291–299. doi:10.1016/0040-1951(79)90074-x
Wald, D. J., Quitoriano, V., Heaton, T. H., and Kanamori, H. (1999). Relationships between Peak Ground Acceleration, Peak Ground Velocity, and Modified Mercalli Intensity in California. Earthquake Spectra 15, 557–564. doi:10.1193/1.1586058
Wu, Y.-M., and Kanamori, H. (2005). Rapid Assessment of Damage Potential of Earthquakes in Taiwan from the Beginning of P Waves. Bull. Seismological Soc. America 95, 1181–1185. doi:10.1785/0120040193
Zollo, A., Amoroso, O., Lancieri, M., Wu, Y.-M., and Kanamori, H. (2010). A Threshold-Based Earthquake Early Warning Using Dense Accelerometer Networks. Geophys. J. Int. 183, 963–974. doi:10.1111/j.1365-246x.2010.04765.x
Zollo, A., Emolo, A., Festa, G., Picozzi, M., Elia, L., Martino, C., et al. (2016). Concept, Implementation and Testing of PRESTo: Real-Time Experimentation in Southern Italy and Worldwide Applications,” in EGU General Assembly 2016. (Vienna, Austria: Abstract) 17–22.
Keywords: EEWS, southern Iberia, magnitude, Granada 2020–21 swarm, PRESTo
Citation: Carranza M, Mattesini M, Buforn E, Zollo A and Torrego I (2021) Four Years of Earthquake Early Warning in Southern Iberia: 2016–2019. Front. Earth Sci. 9:696191. doi: 10.3389/feart.2021.696191
Received: 16 April 2021; Accepted: 06 July 2021;
Published: 26 August 2021.
Edited by:
Mitsuyuki Hoshiba, Japan Meteorological Agency, JapanReviewed by:
Dayi Chen, Central Weather Bureau, TaiwanCopyright © 2021 Carranza, Mattesini, Buforn, Zollo and Torrego. This is an open-access article distributed under the terms of the Creative Commons Attribution License (CC BY). The use, distribution or reproduction in other forums is permitted, provided the original author(s) and the copyright owner(s) are credited and that the original publication in this journal is cited, in accordance with accepted academic practice. No use, distribution or reproduction is permitted which does not comply with these terms.
*Correspondence: Elisa Buforn, ebufornp@ucm.es