Mapping Hydrothermal Alteration at the Fentale-Dofan Magmatic Segment of the Main Ethiopian Rift
 Martina Raggiunti
 Derek Keir
 Carolina Pagli
- 1Dipartimento di Scienze della Terra, Università di Pisa, Pisa, Italy
- 2Dipartimento di Scienze della Terra, Università degli Studi di Firenze, Firenze, Italy
- 3School of Ocean and Earth Science, University of Southampton, Southampton, United Kingdom
The Main Ethiopian Rift (MER) is characterized by extensional tectonics and volcanism, associated with active hydrothermal systems, hydrothermal alteration and fumarolic deposits. The spatial distribution of these hydrothermal products and their link with faults and rock types provides important clues to what controls fluid flow in the subsurface. However, little is known about this in the East African Rift. We address this issue with a multidisciplinary approach in the Fentale-Dofan magmatic segment of the MER, an area characterized by intense volcanic and tectonic activity and a geothermal prospect. Primarily we conduct mapping of hydrothermal alteration and fumarolic deposits, and rock lithologies using a surface feature classification technique of multispectral satellite images. Then we interpret the map using a new database of faults and active hydrothermal manifestations such as hot-springs and fumaroles. We find that the surface hydrothermal alteration and deposits are mainly focused near Fentale and the Dofan Volcanic Complex (DVC). At DVC the hydrothermal products are focused on rhyolites on the western side of the volcano, in an area of intense NNE striking, rift parallel faults. At Fentale volcano the hydrothermal products are mainly associated with ignimbrite and show a circular pattern around the volcanic edifice, but also in places follow the NNE striking faults. At Fentale, the more complex association of hydrothermal products and active manifestations around the edge of the ignimbrite suggests formation contacts may also localize fluid flow in places. At both volcanoes the association between hydrothermal products with either the rhyolites and ignimbrites is likely due to them being relatively easily altered (in comparison to basalt), and also their brittle nature allows for fracturing through which localized fluid flow can occur (as opposed to the sediments). The general pattern of hydrothermal products suggests a stronger structural influence at the DVC with respect to Fentale. The presence of hydrothermal products and active hydrothermal manifestations, along with other lines of evidence such as locus of subsurface dike intrusion at the volcanic centres, suggest that discrete and localized magma reservoirs beneath Fentale and the DVC are the heat source for hydrothermal circulation. Our study also demonstrates that geology, including hydrothermal deposits, can be successfully mapped using automated remote sensing based classification.
Introduction
The Main Ethiopian Rift (MER) is a magma-rich extensional setting with well-developed fault and fracture networks, volcanic systems, and associated hydrothermal manifestations such as fumaroles and hot springs (e.g., Hunt et al., 2017; Wilks et al., 2017) (Figure 1). The circulation of hydrothermal fluids through the fracture network and rock porosity causes changes in the mineralogy, texture and chemistry of rocks and results in the formation of hydrothermal alteration. Also, minerals deposited from gaseous emissions due to a decrease in temperature and pressure can also form fumarolic deposits (Rowland and Sibson, 2004; van der Meer et al., 2014). These hydrothermal products are commonly rich in clay minerals such as micas, chlorites and kaolinite and strongly reflect radiation in the visible and infrared parts of the spectrum (Oluwadebi et al., 2013), while having different optical and spectral characteristics compared to the majority of other rock types. Our aim is to understand the controls on subsurface fluid flow in an active continental rift zone using a multidisciplinary approach of ground truthed remote sensing to map the hydrothermal mineralization, combined with analyses of tectonic, volcanic and currently active hydrothermal manifestations. Mapping these deposits and comparing them to geological and structural maps allows us to interpret the controls on hydrothermal circulation, a topic of economic relevance because the knowledge can inform on the loci of active geothermal sites which could be exploited for energy and mineral production. This is especially important in the MER in which geothermal energy potential is estimated at 700 MWe and offers a sustainable, low carbon energy source that could help to diversify beyond the currently dominant hydropower (Teklemariam et al., 2000). In addition, hydrothermal alterations are associated with epigenetic ore minerals which may have economic value (Oluwadebi et al., 2013).
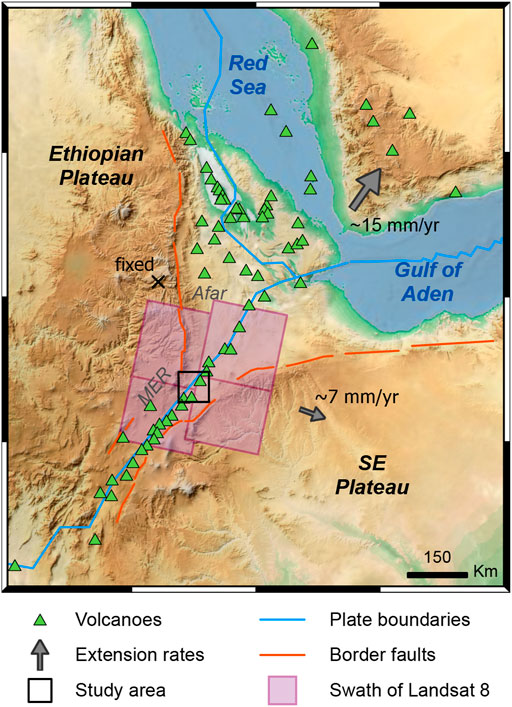
FIGURE 1. Tectonic setting of the East African Rift. Solid blue lines show the plate boundaries while solid red line show Oligocene–Miocene border faults. The green triangles are the Holocene volcanoes, pink squares are the footprint of Landsat 8 images and black square is the study area. The arrows show the motion of the Arabian Plate and the Somalian Plate respect to fixed Nubian Plate.
Mapping of hydrothermal products using remote sensing has previously been applied elsewhere in the East African Rift. For example, Achieng et al. (2017) mapped hydrothermal products parallel to the rift faults at Paka volcano (Kenyan Rift Valley) using Landsat-7 ETM images. In the MER, Oluwadebi et al. (2013) performed airborne image mapping with laboratory analysis of the reflectance spectroscopy measurement on rock samples from Berecha—Tullu Moye and the maps produced show distinctive areas of alteration mostly in volcanic rocks (rhyolites and basalts) and along a complex fault network. In the same region, Darge et al. (2019) investigated the geothermal potential of the Tullu Moye geothermal prospect by calculating land surface emissivity to retrieve the surface temperature from Landsat 8 images. They found that the distribution of thermal anomalies correlates closely with the faults in the area. A similar approach is used by Braddock et al. (2017) on Aluto volcano (Ethiopia). This study investigated the temporal changes in fumarole temperature using ASTER images. It concludes that the hottest fumaroles on Aluto volcano do not show any significant temperature variation over time suggesting that the system is fed by a stable hydrothermal system and it is not affected by deformation processes.
In order to better understand the distribution of hydrothermal products and interpret the structural control, we collected all the available field data regarding the hydrothermal manifestations at Dofan and Fentale volcanoes (Figure 2), and used these data, coupled with a geological map obtained from ground truth systematic remote sensing classification of surface lithologies, to map the hydrothermal products in the study area. We show that our method is effective in characterizing lithologies over large areas and it allows us to make a complete geological map including the distribution of hydrothermal deposits. We found that at Dofan the pattern of hydrothermal products is concentrated on the western side of the volcanic complex mainly along NNE striking rift parallel faults. In contrast at Fentale, the hydrothermal products are found in a concentric pattern around the volcano spatially associated with NNE striking faults and also near the contact between ignimbrite and the sedimentary sequences. We interpret that hydrothermal circulation as heavily influenced by distribution of aquifers offered by porous rock types, but also heavily controlled by faulting of the volcanic system.
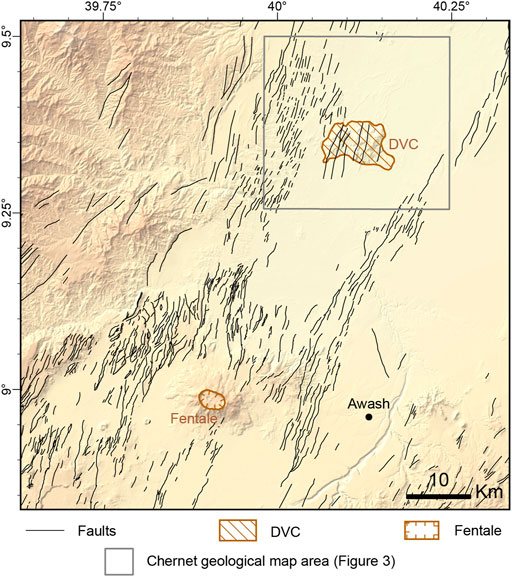
FIGURE 2. Study area. The solid black lines are the faults. South of 9.2° of latitude the faults were derived from the Agostini et al. (2011b) database. North of 9.2° they are traced using a combination of the SRTM data in map view and from creation of topographic profiles.
Geology
Tectonic Setting
The MER is a magma-rich continental rift that is ∼50 km-wide, and extends for ∼500 km from southern Afar to Lake Chamo in southern Ethiopia (Figure 1). The rift is bordered by ∼NE-striking, ∼60 km-long, mid-Miocene faults which create scarps ranging from a few hundred meters to 2 km-high (e.g., Wolfenden et al., 2004; Corti et al., 2018), and that separate the rift valley floor from the Ethiopian and Southeast plateaus on the rift flank (Figure 1). These border faults are interpreted to have accommodated most of the crustal extension during the early stages of rifting in the MER (Wolfenden et al., 2004). Since the Miocene, active faulting is thought to have migrated in-rift to a dense network of Quaternary-Recent faults, that are <20 km-long, with vertical offsets of <100 m (Keir et al., 2015; Muirhead et al., 2016; Siegburg et al., 2020).
Rifting of the MER started between ∼10 and 20 Ma and has evolved through several stages of rifting, faulting and magmatism (Woldegabriel et al., 1990; Chernet et al., 1998; Wolfenden et al., 2004). During the early stages of rifting border faults formed and dominated extension (Agostini et al., 2011a). Later, between 6.6 and 3 Ma the locus of tectonic strain migrated from the border faults to narrow ∼15 km-wide, 60 km-long zones of faulting and magmatism, known in the literature as the Wonji Fault Belt (Mohr and Gouin, 1976) or magmatic segments (Ebinger and Casey, 2001; Beutel et al., 2010; Agostini et al., 2011b). At present, the narrow magmatic segments are thought to accommodate most of the tectonic extension through localized magma intrusion and faulting (Ebinger and Casey, 2001). The current rate and direction of extension have been estimated from a combination of plate kinematic reconstruction (e.g., Chu and Gordon, 1999), GPS measurements (Fernandes et al., 2004; Kogan et al., 2012; Birhanu et al., 2016), earthquake focal mechanisms (Keir et al., 2006; Lavayssiére et al., 2019) and structural geology (e.g., Wolfenden et al., 2004; Corti et al., 2020) providing additional constraints on the direction of extension. From these data a general consensus emerges of an extension rate of 5–7 mm/y and extension direction of ∼N85°-105°E. The MER is affected by widespread seismic activity. In the southern MER south of 8°N, earthquakes are distributed in a 50 km-wide zone that includes the border faults (Ayele, 2000). Towards the central and northern MER, the seismicity is general more localized to the magmatic segments such as the Fentale-Dofan magmatic segment (Beutel et al., 2010; Mazzarini et al., 2013). In the MER the seismicity is mostly concentrated in the uppermost 20 km of the crust (Keir et al., 2006; Muluneh et al., 2021).
Extension in the MER is also associated with intense volcanic activity. Before the start of rifting in the MER, widespread flood basaltic volcanism is thought to be caused by the Afar mantle plume. This mostly basaltic volcanism produced the Ethiopian Flood Basalts which mostly erupted at ∼29–31 Ma (Kieffer et al., 2004) but also with younger pulses such as at ∼24 Ma in the region of where the MER joins with Afar (Chernet et al., 1998). Near the northern MER these are unconformably overlying Mesozoic sediments or directly on Precambrian metamorphic basement (Chernet et al., 1998). Dominant basaltic activity renewed at ∼10 Ma, and since ∼7 Ma during the late Miocene, Pliocene, and Plio Quaternary, basaltic and rhyolitic volcanism occurred mainly in the rift valley floor (Chernet et al., 1998; Kurz et al., 2007).
In the MER, the heat supplied by magma at depth interacts with aquifers leading to vigorous hydrothermal manifestations such as hot springs or fumaroles. These manifestations are focused in the magmatic segments where faulting and fracturing are intense, especially in proximity to the Quaternary-Recent volcanic systems (e.g., Keir et al., 2009; Hunt et al., 2017). For multiple volcanic systems in the MER such as Aluto, Fentale, and Dofen the geochemistry of hydrothermal manifestations indicates that fluids are mostly sourced from rainwater (Darling et al., 1996; Rango et al., 2010). However, parts of the data such as δ13C measurements in thermal waters indicate sources of CO2 from mantle or from metamorphic decarbonation (Kebede et al., 2008), and therefore a deeper more magmatic origin for at least some of the volatile phases has been suggested. The general hydrogeologic setting of the MER has aquifers that are spatially discontinuous and heavily controlled by the volcanic geology and closed drainage system created by the rift valley (Kebede et al., 2010; Pürschel et al., 2013). Two major hydrologic systems are recognized in the area. Quaternary deposits and Quaternary-Recent basalts in the rift floor form shallow aquifers, while deeper aquifers are contained in the Nazret Group. The Nazret Group is composed of Pliocene fractured ignimbrite interbedded with sediments, rhyolites, and minor basaltic lava. The depth of the aquifer increases from the rift escarpment where depths range from just below surface to 40 m, to the rift floor where it can reach up to 290 m below ground level (Kebede et al., 2008; Pürschel et al., 2013; Haji et al., 2021).
The Fentale-Dofan Magmatic Segment
Our study area is located in the northern sector of the MER (Figure 2), and covers an area ∼50 km-wide and 40 km-long and centred on the Fentale-Dofan magmatic segment. The Fentale-Dofan magmatic segment is a half-graben bounded along its eastern flank by 60–80 m high scarps (Casey et al., 2006), and is characterized by intense fumarolic activity and abundance of hot springs (Mohr and Gouin, 1976; Pürschel et al., 2013).
At the northern end of the magmatic segment is the ∼50 km2 Dofan volcanic complex (DVC) that is a shield volcano that rises 450 m above the rift floor and is elongated in a WNW-ESE direction. The latest eruption occurred during the Holocene (Global Volcanism Program, 2013). The DVC has a morphology heavily influenced by the tectonic extension and faulting. This is particularly evident in the south where the DVC is faulted by a series of sub-parallel NNE-SSW striking faults with lengths <10 km and with scarps of a few tens of meters to ∼300 m-high. These faults form a ∼NNE-SSW striking graben in the central part of the volcanic complex. Also, the central sector has an across rift (WNW-ESE) alignment of craters and cones. The complex is formed from Pleistocene trachy-basaltic lava flows exposed on the eastern and western flanks (Chernet, 2005). These are followed by mostly rhyolite flows and domes of the middle Pleistocene which built the main volcanic massif. In the Holocene, volcanic activity has also occurred, with two rhyolite domes being assembled in the eastern side of the complex and basalt flows associated with scoria cones in the northern part (Chernet, 2005).
Southwest of the DVC there is the Fentale strato-volcano that has a maximum elevation of 600 m above the rift floor (Figure 2). The most recent of the basaltic flows occurred around AD 1810, as reported in historic reports (Temtime et al., 2020). It has a summit caldera of elliptical shape that is approximately 3.5 km-wide, 300 m-deep and elongated in a WNW-ESE direction. The south of Fentale caldera is cut by a series of extensional fissures with NNE-SSW strike, parallel to the dominant fault trend of the Wonji Fault Belt (Williams et al., 2004). Southwards they grade into normal faults or are covered by recent basalt flows, and northward they die up to the flank of the volcano and do not cut the caldera wall on the other side (Williams et al., 2004). The volcanic edifice is composed at its base by Pleistocene trachytes and pantelleritic rhyolites outcropping in the southern foot of the volcano (Williams et al., 2004). The main edifice of the volcano is composed of upper Pleistocene rhyolite and obsidian flows with rare pumice tuff horizons (Gibson, 1974; Williams et al., 2004). Intense fumarolic activity occurs on the caldera floor and it has been interpreted as evidence of a shallow magma chamber (Teklemariam and Kebede, 2010).
In the study area hydrothermal deposits are very common and widespread and usually formed by calcite, silica, chlorite, clays, and iron oxides (Gebregzabher, 1986). In the Dofan area, Chernet (2005) recognized both active hydrothermal activity as well as deposits associated with currently inactive systems. The active hydrothermal activity is characterized by fumaroles and hot springs, and usually spatially associated with faults and deposits characterized by hydrothermal minerals like kaolinite, illite, cholorite, smectite, pyrophillite, hematite, pyrite, quartz, calcite, anydrite, allunite, and native sulphur. A significant amount of fossil hydrothermal activity is manifested as travertine deposits, focused on the western side of the DVC (Chernet, 2005). At Fentale the hydrothermal activity has been mapped from several authors in association with the recent faults of the Wonji Fault Belt, with subsurface fluid flow interpreted to be controlled by these faults (Pürschel et al., 2013). A major limitation of the current state of knowledge is that previous understanding of the distribution of hydrothermal deposits was achieved using spatially incomplete field mapping, so the aim of this research is to use remote sensing techniques to make a comprehensive map of all the hydrothermal deposits.
Data and Methods
For this work, we used a multidisciplinary approach to create a map of hydrothermal deposits and lithologies. We initially used the literature to collect the distribution of known active hydrothermal manifestations such as fumaroles and hot springs, along with known hydrothermal deposits identified in the field. Based on this information and along with the main rock types from previous geological mapping, we classify Landsat 8 satellite images over the study area in order to map both hydrothermal deposits and lithologies. We also updated the existing fault map over the entire study area to interpret controls on hydrothermal manifestations.
We created a unique catalogue of 519 hydrothermal manifestations from the existing literature that covers the whole MER (UNDP, 1973; ELC-Electroconsult, 1987; Hunt et al., 2017) (Supplementary Table S1). A database of 356 features is from Hunt et al. (2017) and composed of 88 fumaroles, 182 hot springs and 86 thermal vents and sites of warm ground (localized near Tullu Moye volcano). An additional 80 features, of which 46 are fumaroles and 34 hot springs are sourced from ELC-Electroconsult (1987). Finally, 83 features consisting of 43 fumaroles and 40 hot springs are from UNDP (1973). Of the 519 features in the database, 84 of these are localized in our study area, of which 21 fumaroles are from Hunt et al. (2017), 10 fumaroles from ELC-Electroconsult (1987), and 1 fumarole from the UNDP (1973). In addition, 35 hot springs are from Hunt et al. (2017), 16 hot springs from ELC-Electroconsult (1987), and 1 hot spring from UNDP (1973). The hydrothermal manifestations in the catalog are mainly focused near the DVC, in the caldera of Fentale and the surrounding area in proximity to major faults. The field recognition of these features was mainly linked to accessible areas or sites of expected economic interest.
For the fault map (Figure 2), we used the database by Agostini et al. (2011b), which covers the rift from ∼5.5°N to ∼9.2°N. Our study area extends from ∼8.83°N to ∼9.5°N and is therefore only partially covered by the fault database. To address this, we mapped the missing faults in the north of our study area using the SRTM DEM (USGS EROS Archive-Digital Elevation-Shuttle Radar Topography Mission) with a resolution of 1 arc-sec (∼30 m), in map view and using topographic cross sections. We also used the structural mapping from the ELC-Electroconsult (1987) and UNDP (1973) as a starting point for the new structural analysis.
We then conducted a remote sensing surface classification aimed at mapping all the hydrothermal products from both active and extinct systems as well as the main lithologies of the rift valley. For the remote sensing classification, we used multispectral images acquired by the Landsat 8 mission, which carries the Operational Landsat Imager (OLI) and the Thermal Infrared Sensor (TIRS) (Figure 1). The Landsat 8 images are acquired in a total of 11 different spectral bands and each acquired scene on the ground has a size of 185-by-180 km (further information is available on the Landsat 8 mission page of the NASA web site: https://landsat.gsfc.nasa.gov/landsat-8/landsat-8-overview). The Landsat 8 images are available at several levels of processing. In our case we used the “Terrain Precision Correction -L1TP” that provides radiometrically calibrated and orthorectified images. We selected a total of four images in order to fully cover our study area as show in Figure 1, where the two western images are acquired on January 19, 2020 and the eastern images are acquired on February 29, 2020. We selected these images because they are recent and offer low level of cloud coverage of <5%.
To then mosaic and classify the images, we used ERDAS Imagine Software, which is a widely used software package developed by ERDAS Inc. for remote sensing analyses and satellite image classification (e.g., Li et al., 2011; Darge et al., 2019). The software ingests the Landsat 8 format images. After loading the images we mosaiced them into a single image that covers the whole study area with a pixel size of 30*30 m. We then performed the supervised classification of the freely available Landsat 8 multispectral image by creating spectral signatures of the different classes of lithologies and the hydrothermal mineralization. The supervised classification workflow involves selecting training pixels for each class and extracting their spectral signatures. Then, each pixel in the image is assigned to a class based on their spectral similarities and a classification algorithm (Campbell and Wynne, 2011; Herbei et al., 2015).
In our case, we selected several pixels to represent each class based on previously made geological maps (UNDP, 1973; ELC-Electroconsult (1987); Chernet, 2005) and hydrothermal manifestations (Supplementary Table S1). The software then evaluated the specific spectral content of the training pixels and extracted the spectral signatures for each class. For our classification, we used Landsat 8 OLI spectral bands 1–7, spanning from visible to infrared wavelengths. Based on the catalogue of hydrothermal manifestations that we compiled (Supplementary Table S1) we chose sites where there is also clear visible surface alteration in the optical image and used these to select training pixels of the hydrothermal products. The spectral signatures of these sites were then used to find similar signatures across the whole image. We also used the geological map by Chernet (2005) to identify other classes corresponding to the main lithologies present in the area (Figure 3). To select sites representative of each class we created polygons, with dimension of a few pixels, and we extracted their spectral signatures which were then used for digital classification of the entire satellite image. For the image classification, we tested two of the commonly used algorithms, the maximum likelihood and minimum distance classifiers available in ERDAS Imagine. The maximum likelihood classification algorithm is a parametric classifier used for supervised classification. The algorithm computes a weighed distance of unknown measurement to one to the known classes, so the unknown measurement is assigned to the class in which it has the highest probability of belonging (Otukei and Blaschke, 2010). The minimum distance classifier (MDC) computes class mean using training samples and assigns pixels to the nearest class. This method is more efficient when the training pixels are not numerous (Sharma et al., 2018). After classification, we used the ArcGIS Pro Software to apply a majority filter to reduce the noise.
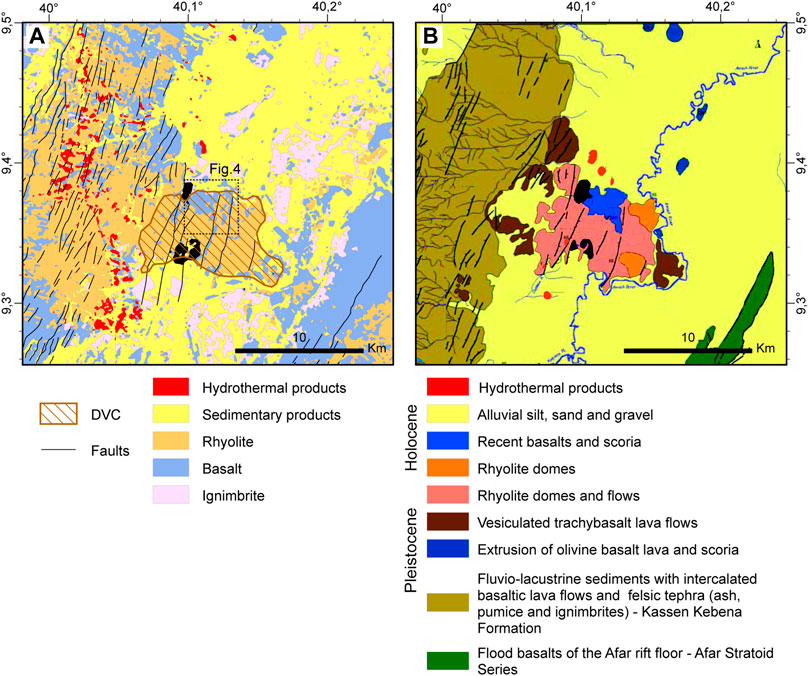
FIGURE 3. (A) Lithological map form supervised classification of Landsat 8 multispectral image of the Dofan area. In the image the area that corresponds to the photos in Figure 4 is shown. (B) Geological map from field observations by Chernet (2005). In both images the hydrothermal deposits are mapped in red.
Initially, we tested the classification over a limited area around Dofan only and using five classes (Figure 3). These are basalts, rhyolites, ignimbrites, and sediments, similar to the range of rock types in the geological map of Chernet (2005), and also the hydrothermal deposits. We also tested both the minimum distance and maximum likelihood classifiers and found that minimum distance better matched the geological map of Chernet (2005) (Supplementary Figure S1). Then we expanded our classification to the entire Fentale-Dofan segment assuming the same previous classes (basalts, rhyolites, ignimbrites, and sediments, hydrothermal deposits) and using the minimum distance classifier (Figure 5A). Since a number of the classes have overlapping spectral signatures we tested the robustness of the mapping by conducting the classification with three classes distinguishing only between hydrothermal deposits, volcanic, and sedimentary rocks (Figure 5C).
The approach used by us has been possible because the study area has poor vegetation coverage that is focused in the rift on sedimentary products. Since surface reflectivity is mainly controlled by lithology we could apply a relatively simple approach that did not involve a large number of elaborations.
Results
Five Classes Lithological Map of Dofan Area
The results of our initial five classes classification on a relatively small area in Dofan is shown in Figure 3A. The resulting classified map shows sedimentary products in a ∼15-km wide, NNE-striking swath along the rift axial basin but interrupted by the volcanic products of the DVC rising above the sedimentary plain in the central part of the area. Basalts and rhyolites are mapped in the northern part of DVC, while the rest of the DVC is dominated by mostly rhyolites. To the south-east of the DVC we find basalts and rhyolites and to the west of the DVC we find mainly rhyolites, along with basalts, and some sediments. The ignimbrites class in the DVC area is not widespread.
We compare our classified lithological map to the geological map by Chernet (2005) (Figure 3B), which presents formations of rocks ranging between rhyolite, basalt, and ignimbrite with ages from Miocene to Recent, and fluvio-lacustrine sediments mainly of volcanogenic origin (Chernet, 2005). The lithological map that we created (Figure 3A) is generally in good agreement with the geological map by Chernet (2005) (Figure 3B). On the western side of the DVC, corresponding to the intensely faulted area, the Chernet (2005) map has the Kessem Kebena Formation (NQ), a succession of fluvio-lacustrine sediments intercalated with basaltic lava and felsic tephra. This is comparable to our classification which identifies in the same area a complex mix of sediments, basalts, and rhyolites. In the DVC itself, we observe a very good agreement between the map by Chernet (2005) and our classification, with both having rhyolites and basalts in the same areas. Also, the sediments are similar in both maps and mainly occupy the axial part of the rift. However, the limited ignimbrites along the rift axis in our map are not reported by Chernet (2005). On the eastern side we mapped basalts in a ∼3–4 km-wide, NNE-striking swath flanked to the east by rhyolites. The basalts we map correspond to flood basalt of Afar Stratoid Series mapped by Chernet (2005), though we map them with larger dimensions.
We also mapped hydrothermal deposits and we describe these in detail in the next section. However Chernet (2005) also reports in his maps some deposits north and south of the DVC (the red deposits in Figure 3B) which we also identify in our map (red deposits in Figure 3A). As a further test of the rigour of our classification mapping we also compare to field photos. In Figure 4 we have reported two photos taken at the DVC including rhyolite, basalt and a hydrothermal deposit found by our automated classifier. From the photo and our mapped hydrothermal alteration there is a very good agreement between the rocks and hydrothermal deposits, and this allow us to have confidence in the robustness of the methods used.
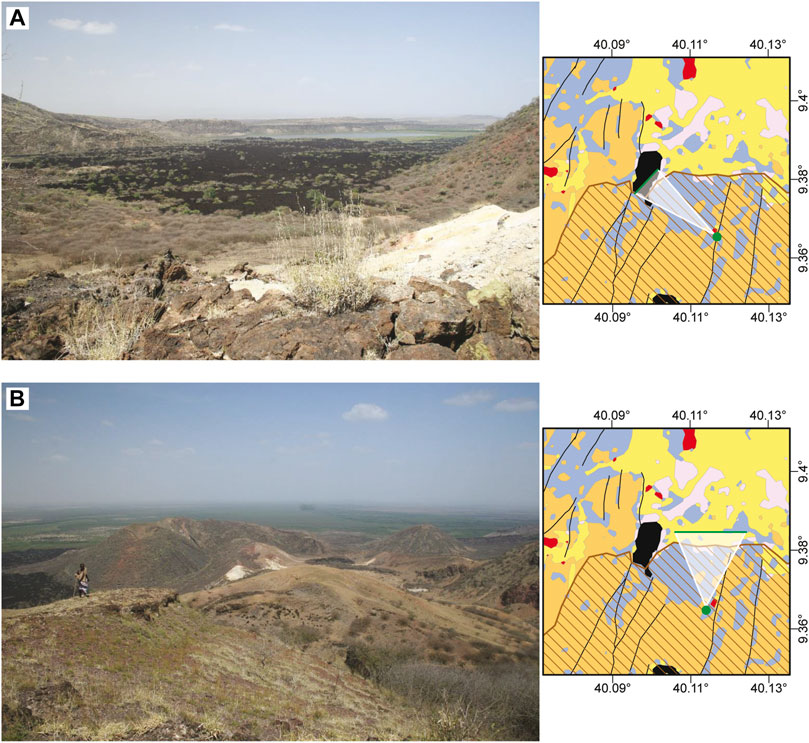
FIGURE 4. Photos taken at the DVC by Julie Roland. In the location maps on the right side the location from where the photos were taken is shown (green dot) and the correspondent horizons (green lines) in photos. (A) Was taken near the in proximity of hydrothermal alterations (red inmap and white in photo) that appear close-up while in the background the young basalts (blue in map and black in photo) are visible. (B) Was taken from a more southerly point, and it reports on the left side the young basalts (blue in map and black in photo), on central part the hydrothermal alterations (red in map and white in photo) and on the background the rift valley.
Generally the lithologies identified by the remote-sensing based map and the geological formations from the map by Chernet (2005) in Figure 3 are in good agreement. We therefore extended the remote-sensing based classification to the whole study area, including Dofan and Fentale and assuming five and three classes. We then interpret the maps with the additional aid of our compiled archive of active hydrothermal manifestations (Supplementary Table S1).
Five and Three Classes Lithological Map of Fentale-Dofan Segment
In Figure 5A we show our classification results assuming five classes (hydrothermal deposits, basalts, rhyolites, ignimbrites, and sedimentary rocks), alongside (Figure 5) the geological map of the area by ELC (1987). The five classes classification shows mainly ignimbrites, basalts and some sediments on the western side of the rift. In the same area the ELC geologic map has two formations. There is a formation of undifferentiated pre-middle Miocene, including flood basalts, sediments, epi-metamorphic basement, and minor intrusive bodies. Closer to the rift axis on the western side we then map mainly basalts, rhyolites, and some ignimbrites in the south in the same swath as the ELC geological map maps a formation of undifferentiated basic and silicic rocks of 9–2 Ma age.
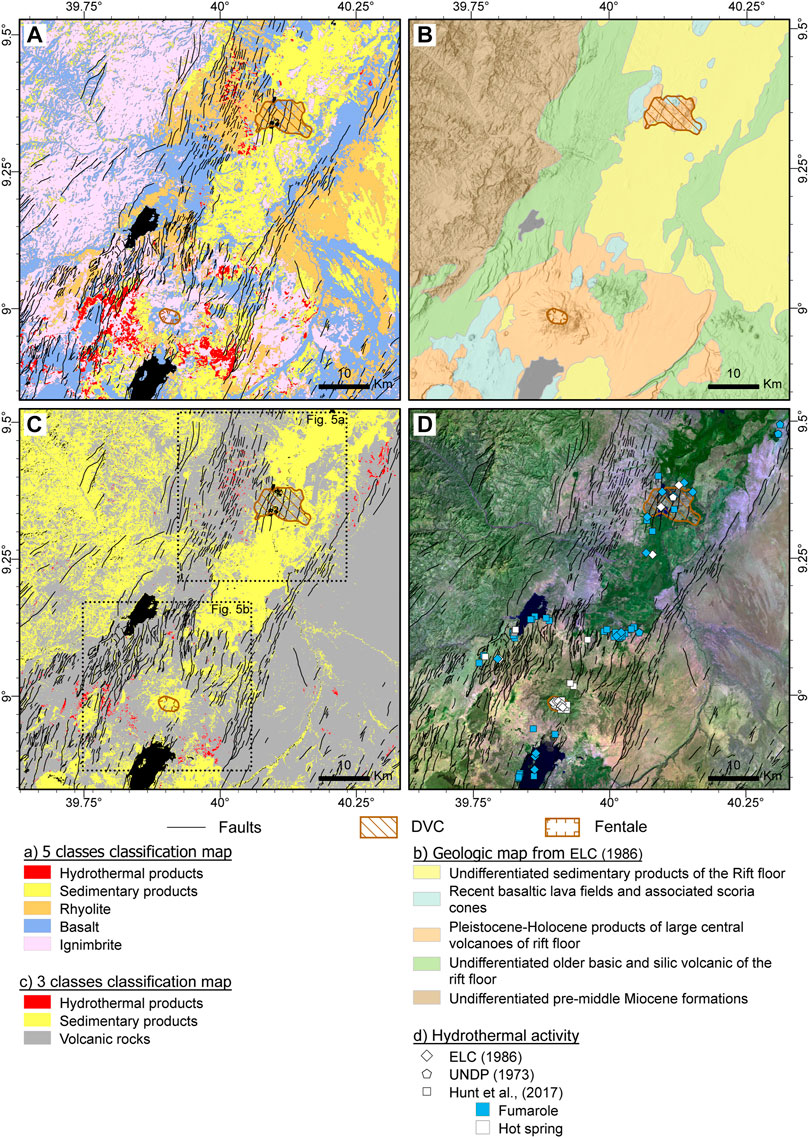
FIGURE 5. (A) Classified Landsat 8 image assuming five classes: geothermal deposits, basalts, ignimbrites, rhyolites, and sedimentary products. (B) Geologic map from ELC-Electroconsult (1987). (C) Classified Landsat 8 image assuming three classes: volcanic rocks, sedimentary rocks and geothermal deposits. (D) Map of hot springs and fumaroles overlaid on a Landsat 8 color-composite image 7, 6, 2.
Along the rift axis we recognized two sectors. These are the DVC mainly composed of rhyolites and basalts and only scattered ignimbrites, and then Fentale volcano mainly composed of ignimbrites and basalts with rare rhyolites. The ELC geologic map of the same area shows Pleistocene-Holocene products of large central rift floor volcanoes, recent basaltic lavas, and undifferentiated sedimentary products. On the eastern side of the rift segment we find sediments, rhyolites with an elongated distribution east of DVC, while east of Fentale our map is dominated by ignimbrites, basalts and less common rhyolites (Figure 5B). The comparison between the two maps demonstrates that our lithologic classification based on satellite image (Figure 5A) is in a good agreement with geological map (Figure 5B).
Then in Figure 5C we show our lithologic map assuming only three classes (hydrothermal deposits, volcanic and sedimentary rocks). The three classes classification generally shows volcanic rocks in the locations where basalts, rhyolites and ignimbrites were mapped assuming five classes. However, on the western flank of the Fentale-Dofan segment where ignimbrites and the basalts where mapped assuming five classes, the three classes map identifies mainly sediments. This is likely because it is a mixed formation with a less distinctive spectral signature compared to the other volcanic rocks. This formation is made of recent volcanic rocks but also epimetamorphic basement and sedimentary rocks (ELC, 1987).
Using our classifications, we obtained two spatial patterns of hydrothermal deposits, Figure 5A for the five classes classification and Figure 5C for the three classes classification. Both maps show a similar pattern with a concentration of hydrothermal alteration in the vicinity of both Dofan and Fentale volcanoes. However, the size of the hydrothermal deposits is generally smaller in the three classes map (Figure 5C). The exception to this is the area east of DVC where the three classes image map shows a larger number of hydrothermal deposits compared to the five classes map. The different size of the hydrothermal deposits in the two maps is likely caused by some overlaps of the spectral signatures of the hydrothermal deposits with both the ignimbrites and rhyolites.
Regardless of the number of the classes assumed, the majority of the hydrothermal deposits near the DVC are found on the western side of the volcanic complex, in an intensely faulted area. The mapped deposits are discretized in many little alteration areas next to or at the lateral tips of the faults. In the south-west of the DVC the hydrothermal alteration steps eastward following the contact between the volcanic rock and the sedimentary products, in a less faulted area. Similarly, on the eastern side of the rift axis, hydrothermal deposits occur along the main axial bounding faults (Figures 5A,C). At the DVC the hydrothermal deposits are mainly in the rhyolites.
In contrast near Fentale, the spatial distribution of hydrothermal deposits is more spatially extensive and complex than near the DVC, the easternmost and westernmost hydrothermal deposits of Fentale are aligned along the rift valley faults, striking NNE. In the vicinity of the volcano, the deposits instead occur in un-faulted regions and define a curved pattern either following the ignimbrites or at the contact between the ignimbrites and sediments. Overall at Fentale, the hydrothermal deposits form a ring shape around the volcano with this pattern being particularly evident on the western and southern sides (Figures 5C, 6B). Both at DVC and Fentale, the hydrothermal deposits occur only in volcanic rocks and not in the sedimentary rocks (Figure 5C).
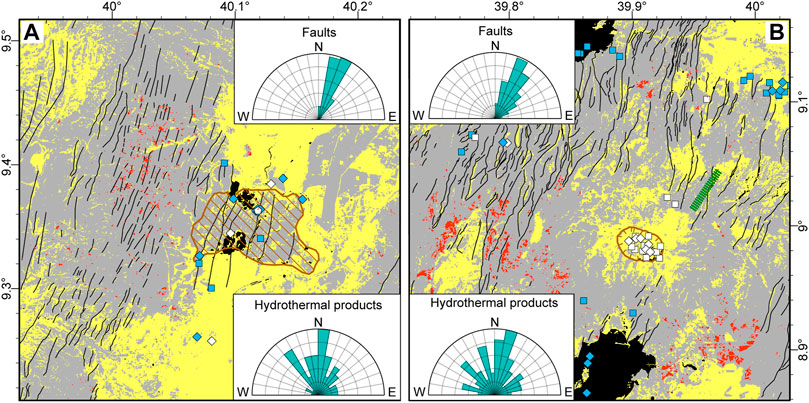
FIGURE 6. Three classes classification maps. (A) DVC (B) Fentale volcano (legend see Figure 5C) In both maps are reported the hydrothermal feature of the compiled database and in the Fentale area (B) in green is reports also the localization of the 2015 dike intrusion. For each area are reported the rose diagrams (on the left for DVC and on the right for Fentale) that display the orientation of hydrothermal deposits in red and fault orientation in blue. To obtain the hydrothermal deposits, we simplified the polygon that represent these deposits and with ArcGIS we have calculated their elongation.
Finally, in Figure 5D we show the active hydrothermal manifestations from our compiled database (Supplementary Table S1). The hydrothermal manifestations are focused on two main areas corresponding to the DVC and Fentale volcano. At the DVC they are observed along the faults that cut the volcanic complex or along lineaments aligned with the faults. At Fentale, the hydrothermal manifestations are focused in three main areas. North of Fentale there is a quasi-circular distribution around the volcano at the edge of an intensely faulted area. This circular pattern is also seen in the distribution of hydrothermal deposits albeit it is most evident south of Fentale (Figures 5A,C). Along the rift axis south of Fentale, active hydrothermal manifestations are in the area affected by the NNE-SSW striking axial fault network. Thirdly, hydrothermal manifestations are common in the inside of the main caldera where hot springs are common.
Discussion
In general, hydrothermal activity can be defined as the interaction between an aquifer and a heat source supplied by volcanic activity or geothermal heat. Hydrothermal activity causes alterations that can be defined as complex processes where original minerals in the rocks are replaced by new minerals. In this process the chemical reactants are delivered by hydrothermal fluids that remove the aqueous reaction products (Reed, 1997).
Using a multidisciplinary approach that combines a dataset of over 80 mapped active hydrothermal manifestations together with classification of satellite images, we were able to systematically map hydrothermal deposits over the entire Fentale-Dofan segment. We found sites where there is correspondence between hydrothermal manifestations and visible deposits on optical images, and we then used their spectral content to find similar deposits in the whole image. To constrain our results, the first classification has been made on a restricted area where there are available data, so we classified the area around Dofan to compare the results with the geological map of Chernet (2005) (Figure 3). Given the good agreement between our classification and the Chernet (2005) map, we extended the classification to the whole study area of the Fentale-Dofan magmatic segment (Figure 5). Similarly, the classification of the whole study area was compared to the geological map by ELC-Electroconsult (1987) (Figure 5).
Our maps and the lithologic maps from the literature are very similar but with some discrepancies. One major discrepancy is in the five classes classification for the Afar Stratoid Series, which in our map is larger in extent than the previous maps (Figures 3, 5). However, after checking the satellite optical image and considering the topography of the area, we are confident that the extent of the basalt in our map is correct. The second major difference is in the three classes classification, on the western side of the rift where we mapped sediments on the surface whereas in five classes classification we mapped ignimbrites and basalts (Figure 5). This is due to the mixed composition of the formation that implies a less defined classification.
In general, we find that the hydrothermal products in the Dofan area are focused in the rhyolites along the western side of the rift and mainly along and at the tips of the NNE striking faults. At Fentale the pattern is more complex with the hydrothermal products arranged in a circular pattern in association with ignimbrites in proximity to the volcano, and then also associated to the NNE striking rift parallel faults further away (Figures 5B,C). In both cases, the hydrothermal products occur in volcanic rocks that are mapped as older than the Pliocene, rather than in the youngest Quaternary to Recent rocks (Figure 5C). In Figure 6 we compare of the elongation directions of the hydrothermal products, calculated by simplifying the polygons of the products and calculating the elongation direction, and the fault directions in DVC and Fentale volcano. At Dofan, the faults primarily strike in a NNE direction with strikes ranging between 0° and 40°. Elongation direction of the hydrothermal products shows a greater variability in strike but with the dominant direction being between 0 and 10°, comparable to the faults. At Fentale volcano we find a similar orientation of the faults and the dominant direction of the hydrothermal deposits, testifying that a fault control is still present. However, superposed to the primary trend, the remaining hydrothermal products are oriented in all directions, consistent with a circular distribution visible from the map. We therefore interpret that in DVC the fault systems are one of the most important factors that influence the localization of hydrothermal deposits, while at Fentale the localization of the hydrothermal deposits is also influenced by the circular distribution of the ignimbrites.
Our mapped hydrothermal products do not simply follow the known active hydrothermal manifestations from the literature. This may be due to a number of reasons. Firstly, the hydrothermal manifestations collected from the literature are the active manifestations (such as active fumarole and hot springs) recognized in field campaigns that were likely not spatially complete but carried out mainly in areas with easy access or of economic interest. In addition, it is also possible that some hydrothermal manifestations from the literature are very young and/or in rock types such as basalt that are less easily altered, and have not developed large enough hydrothermal products that can be recognized by our satellite image analysis (Landsat 8 pixel size is 30 m). Another explanation is that rock types such as glassy rhyolite (obsidian) alter into deposits with spectral characteristics different from the rest of the hydrothermal deposits in the study area. This could explain why the fumaroles in the Fentale caldera where obsidian is common do not correspond to mapped hydrothermal products.
From the localization of these hydrothermal deposits and comparison with the geological map by ELC-Electroconsult (1987) we can see that they are focused on the Miocene and Pliocene formations (Figure 5). The general hydrogeologic setting of the MER has the deepest aquifers in the Pliocene ignimbrite (belonging to Nazret Group) and shallow aquifers in the youngest Quaternary basalts (Kebede et al., 2008; Pürschel et al., 2013). The relative paucity of hydrothermal deposits and active systems associated with the youngest basalts lead us to interpret that they are linked to the deepest aquifers.
An important control on the formation of hydrothermal deposits is from tectonic activity, as intense faulting and fracturing increases the permeability, creating preferential pathways for the fluids to circulate hence controlling the localization of hydrothermal deposits. The study area is characterized by extensional stress that causes the formation of intensely faulted and fractured areas with high permeability. This is strongly suggested by the spatial association between the hydrothermal sites and faults and fractures. In our study we find that the hydrothermal deposits are mainly superimposed on the oldest volcanic rocks, consistent with the hypothesis that these older formations are more fractured than the younger rock because they have a longer deformation history. At the same time the fracturing capacity of the rocks depends on the clay content, with increased clay content reducing the fracturing capacity (Guo et al., 2015), so the sedimentary units will be less fractured than the volcanic units. This is especially pronounced with the lack of fracturing and hydrothermal deposits in the sedimentary sequences and for this reason the hydrothermal deposits are focused on the fractured zones on the volcanic rocks (Figure 5B).
Using the spectral properties of the hydrothermal deposits we can try to constrain their composition. The mapped hydrothermal deposits are well defined in band 6 (SWIR1, wavelength of 1.57–1.65 μm) and in band 7 (SWIR2, wavelength of 2.11–2) (Supplementary Figure S2), indicating that these deposits are made of minerals with diagnostic spectral reflectance in the SWIR range like minerals containing primarily hydroxyl groups. Apart from phyllosilicate, Al(OH) and Mg(OH) bearing minerals, many OH-bearing sulphates, ammonium-bearing minerals, and the carbonate family also can be recognized at this wavelength (Huntington, 1996).
At the beginning of this paper, we defined the hydrothermal activity as interaction between water and a heat source. The spatial association of hydrothermal deposits and active systems near both Dofan and Fentale volcanoes suggests that the shallow magma plumbing system beneath these volcanoes is the likely heat source. Direct constraints on the depth and position of magma reservoirs beneath Fentale and the DVC are lacking, however a number of indirect lines of evidence suggest that magma reservoirs are present beneath both. For Fentale, InSAR measured ground deformation in 2015 is best modelled by slow (likely rhyolitic) dike intrusion along the rift axis (Temtime et al., 2020). It occurred just north-east of Fentale caldera (Figure 6B) with the modelled dike being 6 km-long and between 5.4 and 8 km-deep. The dike originated from Fentale, suggesting that beneath the volcano there is an active chamber, the likely heat source of the hydrothermal system. The dike itself does not correspond to hydrothermal activity or deposits, likely since it is a more ephemeral and minor heat source.
Fault control on hydrothermal fluid circulation has also been inferred in Iceland where thermal spring emergence is observed along faults and fractures (i.e., Arnórsson, 1995). A more complex pathway of fluid circulation was recognized in the Tuapo Volcanic Zone (New Zealand) where Rowland and Sibson (2004) argue that in the basement the hydrothermal fluid flow is focused on faults and fractures, while at shallower levels the flow is focused in Quaternary cover sequence masking the structural control at the depth. In our study area the main controls on the distribution of hydrothermal products are the structures and the rock type. We do not observe hydrothermal products nor manifestations in the sedimentary cover and hence fluid circulation does not occur or is diffuse, with no clear surface evidence.
Conclusion
With a multidisciplinary approach we map the surface hydrothermal alterations in the Fentale-Dofan magmatic segment. We find that the surface hydrothermal alterations are mainly focused near Fentale and Dofan volcanoes. At Dofan the hydrothermal alterations are focused on rhyolites on the western side of the volcano, in an area of intense rift parallel faults. At Fentale volcano the hydrothermal alterations are mainly associated with ignimbrite and show a circular pattern around the volcanic edifice, but also in places follow the NNE striking faults. The association between hydrothermal deposits with either the rhyolites and ignimbrites is likely due to them being relatively easily altered (in comparison to basalt), and also their brittle nature allows for fracturing through which localized fluid flow can occur (as opposed to the sediments). At Fentale, the more complex association of hydrothermal deposits and active manifestations around the edge of the ignimbrite suggests formation contacts may also localize fluid flow in places. The presence of hydrothermal deposits and active hydrothermal manifestations, along with other lines of evidence such as locus of subsurface dike intrusion, suggests that discrete and localized magma reservoirs beneath Fentale and the DVC are the heat source for hydrothermal circulation. Our study also demonstrates that this approach used in areas of lack of vegetation can be a good starting point for spatially extensive geological mapping and detection of zones of hydrothermal deposits.
Data Availability Statement
The catalog of Holocene to Recent volcanoes and age of recent eruptions is available at https://volcano.si.edu/volcano.cfm?vn=221180. The fault database by Agostini et al. (2011a) is available at http://ethiopianrift.igg.cnr.it/utilities_MER.html. The information about Landsat mission is available at https://landsat.gsfc.nasa.gov/landsat-8/landsat-8-overview.
Author Contributions
MR, DK, and CP contributed to conception and design of the study. MR performed the remote sensing analyses, created the figures and wrote the first draft of the manuscript, DK and CP checked and revised it. All the authors contributed to manuscript revision, read and approved the submitted version.
Funding
MR is founded by a PhD scholarship at the University of Pisa. DK and the publication costs were supported by NERC Grant NE/L013932/1.
Conflict of Interest
The authors declare that the research was conducted in the absence of any commercial or financial relationships that could be construed as a potential conflict of interest.
Publisher’s Note
All claims expressed in this article are solely those of the authors and do not necessarily represent those of their affiliated organizations, or those of the publisher, the editors and the reviewers. Any product that may be evaluated in this article, or claim that may be made by its manufacturer, is not guaranteed or endorsed by the publisher.
Acknowledgments
We thank Julie Rowland for the field photographs from Dofan. MR thank CGT of the University of Siena and Salvini for the remote sensing course.
Supplementary Material
The Supplementary Material for this article can be found online at: https://www.frontiersin.org/articles/10.3389/feart.2021.716144/full#supplementary-material
References
Achieng, J., Mutua, J., Mibei, G., Olaka, L., and Waswa, A. K. (2017). Mapping of Hydrothermal Minerals Related to Geothermal Activities Using Remote Sensing and GIS: Case Study of Paka Volcano in Kenyan Rift Valley. J. Geosci. 08 (5), 711–725. doi:10.4236/ijg.2017.85039
Agostini, A., Bonini, M., Corti, G., Sani, F., and Manetti, P. (2011b). Database of the Faults Affecting the Main Ethiopian Rift. Available at: http://ethiopianrift.igg.cnr.it/utilities_MER.html (Accessed February 3, 2021).
Agostini, A., Bonini, M., Corti, G., Sani, F., and Mazzarini, F. (2011a). Fault Architecture in the Main Ethiopian Rift and Comparison with Experimental Models: Implications for Rift Evolution and Nubia-Somalia Kinematics. Earth Planet. Sci. Lett. 301 (3-4), 479–492. doi:10.1016/j.epsl.2010.11.024
Arnórsson, S. (1995). Geothermal Systems in Iceland: Structure and Conceptual Models—I. High-Temperature Areas. Geothermics 24 (5-6), 561–602. doi:10.1016/0375-6505(95)00025-9
Ayele, A. (2000). Normal Left-Oblique Fault Mechanisms as an Indication of Sinistral Deformation between the Nubia and Somalia Plates in the Main Ethiopian Rift. J. Afr. Earth Sci. 31 (2), 359–367. doi:10.1016/s0899-5362(00)00093-2
Beutel, E., van Wijk, J., Ebinger, C., Keir, D., and Agostini, A. (2010). Formation and Stability of Magmatic Segments in the Main Ethiopian and Afar Rifts. Earth Planet. Sci. Lett. 293 (3-4), 225–235. doi:10.1016/j.epsl.2010.02.006
Birhanu, Y., Bendick, R., Fisseha, S., Lewi, E., Floyd, M., King, R., et al. (2016). GPS Constraints on Broad Scale Extension in the Ethiopian Highlands and Main Ethiopian Rift. Geophys. Res. Lett. 43 (13), 6844–6851. doi:10.1002/2016gl069890
Braddock, M., Biggs, J., Watson, I. M., Hutchison, W., Pyle, D. M., and Mather, T. A. (2017). Satellite Observations of Fumarole Activity at Aluto Volcano, Ethiopia: Implications for Geothermal Monitoring and Volcanic hazard. J. Volcanology Geothermal Res. 341, 70–83. doi:10.1016/j.jvolgeores.2017.05.006
Campbell, J. B., and Wynne, R. H. (2011). Introduction to Remote Sensing. New York, NY: Guilford Press.
Casey, M., Ebinger, C., Keir, D., Gloaguen, R., and Mohamed, F. (2006). Strain Accommodation in Transitional Rifts: Extension by Magma Intrusion and Faulting in Ethiopian Rift Magmatic Segments. Geol. Soc. Lond. Spec. Publications 259 (1), 143–163. doi:10.1144/gsl.sp.2006.259.01.13
Chernet, T. (2005). “Geological and Hydrothermal Alteration Mapping of the Dofen Geothermal prospect and Adjacent Western Escarpment (Ethiopia),” in Proceedings of the World Geothermal Congress (Antalya, Turkey, 24–29.
Chernet, T., Hart, W. K., Aronson, J. L., and Walter, R. C. (1998). New Age Constraints on the Timing of Volcanism and Tectonism in the Northern Main Ethiopian Rift-Southern Afar Transition Zone (Ethiopia). J. Volcanology Geothermal Res. 80 (3-4), 267–280. doi:10.1016/s0377-0273(97)00035-8
Chu, D., and Gordon, R. G. (1999). Evidence for Motion between Nubia and Somalia along the Southwest Indian Ridge. Nature 398 (6722), 6467. doi:10.1038/18014
Corti, G., Molin, P., Sembroni, A., Bastow, I. D., and Keir, D. (2018). Control of Pre-rift Lithospheric Structure on the Architecture and Evolution of Continental Rifts: Insights from the Main Ethiopian Rift, East Africa. Tectonics 37 (2), 477–496. doi:10.1002/2017tc004799
Corti, G., Sani, F., Florio, A. A., Greenfield, T., Keir, D., Erbello, A., et al. (2020). Tectonics of the Asela‐Langano Margin, Main Ethiopian Rift (East Africa). Tectonics 39 (8), e2020TC006075. doi:10.1029/2020tc006075
Darge, Y. M., Hailu, B. T., Muluneh, A. A., and Kidane, T. (2019). Detection of Geothermal Anomalies Using Landsat 8 TIRS Data in Tulu Moye Geothermal prospect, Main Ethiopian Rift. Int. J. Appl. Earth Observation Geoinformation 74, 16–26. doi:10.1016/j.jag.2018.08.027
Darling, W. G., Gizaw, B., and Arusei, M. K. (1996). Lake-groundwater Relationships and Fluid-Rock Interaction in the East African Rift Valley: Isotopic Evidence. J. Afr. Earth Sci. 22 (4), 423–431. doi:10.1016/0899-5362(96)00026-7
Ebinger, C. J., and Casey, M. (2001). Continental Breakup in Magmatic Provinces: An Ethiopian Example. Geol 29 (6), 527–530. doi:10.1130/0091-7613(2001)029<0527:cbimpa>2.0.co;2
ELC-Electroconsult, (1987). Geothermal Reconnaissance Study of Selected Sites of the Ethiopian Rift system Geological Report. Milan, Italy: Ethiopian Institute of Geological Surveys, Geothermal Exploration Project.
Fernandes, R. M. S., Ambrosius, B. A. C., Noomen, R., Bastos, L., Combrinck, L., Miranda, J. M., et al. (2004). Angular Velocities of Nubia and Somalia from Continuous Gps Data: Implications on Present-Day Relative Kinematics. Earth Planet. Sci. Lett. 222 (1), 197–208. doi:10.1016/j.epsl.2004.02.008
Gebregzabher, Z. (1986). Hydrothermal Alteration Minerals in Aluto Langano Geothermal wells, Ethiopia. Geothermics 15 (5-6), 735–740. doi:10.1016/0375-6505(86)90086-6
Gibson, I. L. (1974). A Review of the Geology, Petrology and Geochemistry of the Volcano Fantale. Bull. Volcanol 38 (2), 791–802. doi:10.1007/bf02596908
Global Volcanism Program (2013). Volcanoes of the World. (Accessed March 1, 2021). doi:10.5479/si.GVP.VOTW4-2013
Haji, M., Qin, D., Guo, Y., Li, L., Wang, D., Karuppannan, S., et al. (2021). Origin and Geochemical Evolution of Groundwater in the Abaya Chamo basin of the Main Ethiopian Rift: Application of Multi-Tracer Approaches. Hydrogeology J., 29 (3), 1219–1238. doi:10.1007/s10040-020-02291-y
Herbei, M. V., Sala, F., and Boldea, M. (2015). “Using Mathematical Algorithms for Classification of Landsat 8 Satellite Images,” in AIP Conference Proceedings, 22–28 September 2014. (Rhodes, Greece: AIP Publishing LLC).
Hunt, J. A., Zafu, A., Mather, T. A., Pyle, D. M., and Barry, P. H. (2017). Spatially Variable CO2 Degassing in the Main Ethiopian Rift: Implications for Magma Storage, Volatile Transport, and Rift-Related Emissions. Geochem. Geophys. Geosyst. 18 (10), 3714–3737. doi:10.1002/2017gc006975
Huntington, J. F. (1996). The Role of Remote Sensing in Finding Hydrothermal mineral Deposits on Earth. Ciba Found. Symp. 202, 214–215. doi:10.1002/9780470514986.ch12
Kebede, S., Travi, Y., Asrat, A., Alemayehu, T., Ayenew, T., and Tessema, Z. (2008). Groundwater Origin and Flow along Selected Transects in Ethiopian Rift Volcanic Aquifers. Hydrogeol J. 16 (1), 55–73. doi:10.1007/s10040-007-0210-0
Kebede, S., Travi, Y., and Stadler, S. (2010). Groundwaters of the Central Ethiopian Rift: Diagnostic Trends in Trace Elements, δ18O and Major Elements. Environ. Earth Sci. 61 (8), 1641–1655. doi:10.1007/s12665-010-0479-5
Keir, D., Bastow, I. D., Corti, G., Mazzarini, F., and Rooney, T. O. (2015). The Origin of Along-Rift Variations in Faulting and Magmatism in the Ethiopian Rift. Tectonics 34 (3), 464–477. doi:10.1002/2014tc003698
Keir, D., Bastow, I. D., Whaler, K. A., Daly, E., Cornwell, D. G., and Hautot, S. (2009). Lower Crustal Earthquakes Near the Ethiopian Rift Induced by Magmatic Processes. Geochem. Geophys. Geosystems 10 (6). doi:10.1029/2009gc002382
Keir, D., Ebinger, C., Stuart, G., Daly, E., and Ayele, A. (2006). Strain Accommodation by Magmatism and Faulting as Rifting Proceeds to Breakup: Seismicity of the Northern Ethiopian Rift. J. Geophys. Res. Solid Earth 111 (B5). doi:10.1029/2005jb003748
Kieffer, B., Arndt, N., Lapierre, H., Bastien, F., Bosch, D., Pecher, A., et al. (2004). Flood and Shield Basalts from Ethiopia: Magmas from the African Superswell. J. Pet. 45 (4), 793–834. doi:10.1093/petrology/egg112
Kogan, L., Fisseha, S., Bendick, R., Reilinger, R., McClusky, S., King, R., et al. (2012). Lithospheric Strength and Strain Localization in continental Extension from Observations of the East African Rift. J. Geophys. Res. Solid Earth 117 (B3). doi:10.1029/2011jb008516
Kurz, T., Gloaguen, R., Ebinger, C., Casey, M., and Abebe, B. (2007). Deformation Distribution and Type in the Main Ethiopian Rift (MER): a Remote Sensing Study. J. Afr. Earth Sci. 48 (2-3), 100–114. doi:10.1016/j.jafrearsci.2006.10.008
Lavayssière, A., Drooff, C., Ebinger, C., Gallacher, R., Illsley‐Kemp, F., Oliva, S. J., et al. (2019). Depth Extent and Kinematics of Faulting in the Southern Tanganyika Rift, Africa. Tectonics 38 (3), 842–862. doi:10.1029/2018tc005379
Li, N., Frei, M., and Altermann, W. (2011). Textural and Knowledge-Based Lithological Classification of Remote Sensing Data in Southwestern Prieska sub-basin, Transvaal Supergroup, South Africa. J. Afr. Earth Sci. 60 (4), 237–246. doi:10.1016/j.jafrearsci.2011.03.002
Mazzarini, F., Keir, D., and Isola, I. (2013). Spatial Relationship between Earthquakes and Volcanic Vents in the central-northern Main Ethiopian Rift. J. Volcanology Geothermal Res. 262, 123–133. doi:10.1016/j.jvolgeores.2013.05.007
Mohr, P. A., and Gouin, P. (1976). The Ethiopian Rift System. Bull. Geophys. Obs. Addis Ababa. 11, 1–65. doi:10.1029/SP005p0081
Muirhead, J. D., Kattenhorn, S. A., Lee, H., Mana, S., Turrin, B. D., Fischer, T. P., et al. (2016). Evolution of Upper Crustal Faulting Assisted by Magmatic Volatile Release during Early-Stage continental Rift Development in the East African Rift. Geosphere 12 (6), 1670–1700. doi:10.1130/ges01375.1
Muluneh, A. A., Keir, D., and Corti, G. (2021). Thermo-rheological Properties of the Ethiopian Lithosphere and Evidence for Transient Fluid Induced Lower Crustal Seismicity beneath the Ethiopian Rift. Front. Earth Sci. 9 (9), 610165. doi:10.3389/feart.2021.610165
Oluwadebi, A. G., Hecker, C. A., van der Meer, F. D., and Ferrier, G. (2013). Mapping of Hydrothermal Alteration in Mount Berecha Area of Main Ethiopian Rift Using Hyperspectral Data. J. Environ. earth Sci. 3 (12), 115–124.
Otukei, J. R., and Blaschke, T. (2010). Land Cover Change Assessment Using Decision Trees, Support Vector Machines and Maximum Likelihood Classification Algorithms. Int. J. Appl. Earth Observation Geoinformation 12, S27–S31. doi:10.1016/j.jag.2009.11.002
Pürschel, M., Gloaguen, R., and Stadler, S. (2013). Geothermal Activities in the Main Ethiopian Rift: Hydrogeochemical Characterization of Geothermal Waters and Geothermometry Applications (Dofan-Fantale, Gergede-Sodere, Aluto-Langano). Geothermics 47, 1–12. doi:10.1016/j.geothermics.2013.01.001
Rango, T., Petrini, R., Stenni, B., Bianchini, G., Slejko, F., Beccaluva, L., et al. (2010). The Dynamics of central Main Ethiopian Rift Waters: Evidence from δD, δ18O and 87Sr/86Sr Ratios. Appl. Geochem. 25 (12), 1860–1871. doi:10.1016/j.apgeochem.2010.10.001
Reed, M. H. (1997). Hydrothermal Alteration and its Relationship to Ore Fluid Composition. New York, NY: John Wiley, 303–365.
Rowland, J. V., and Sibson, R. H. (2004). Structural Controls on Hydrothermal Flow in a Segmented Rift System, Taupo Volcanic Zone, New Zealand. Geofluids 4 (4), 259–283. doi:10.1111/j.1468-8123.2004.00091.x
Sharma, J., Prasad, R., Mishra, V., Yadav, V., and Bala, R. (2018). Land Use and Land Cover Classification of Multispectral Landsat-8 Satellite Imagery Using Discrete Wavelet Transform. Int. Arch. Photogrammetry, Remote Sensing Spat. Inf. Sci. 42 (5), 703–706. doi:10.5194/isprs-archives-XLII-5-703-2018
Siegburg, M., Bull, J. M., Nixon, C. W., Keir, D., Gernon, T. M., Corti, G., et al. (2020). Quantitative Constraints on Faulting and Fault Slip Rates in the Northern Main Ethiopian Rift. Tectonics 39 (8), e2019TC006046. doi:10.1029/2019tc006046
Teklemariam, M., Beyene, K., AmdeBerhan, Y., and Gebregziabher, Z. (2000). “Geothermal Development in Ethiopia,” in Proceedings, World Geothermal Congress, Kyushun-Tohoku, Japan, May 28–June 10, 2000, 475–480.
Teklemariam, M., and Kebede, S. (2010). Strategy for Geothermal Resource Exploration and Development in Ethiopia. in Proceedings World Geothermal Congress, Bali, Indonesia, April 25–29, 25–30.
Temtime, T., Biggs, J., Lewi, E., and Ayele, A. (2020). Evidence for Active Rhyolitic dike Intrusion in the Northern Main Ethiopian Rift from the 2015 Fentale Seismic Swarm. Geochem. Geophys. Geosystems 21 (6), e2019GC008550. doi:10.1029/2019gc008550
UNDP (1973). Geology, Geochemistry and Hydrology of hot springs of the East African Rift System within Ethiopia. UN: United Nations Development Programme. Technical report, investigation of geothermal resources for power development Ethiopia.
van der Meer, F., Hecker, C., van Ruitenbeek, F., van der Werff, H., de Wijkerslooth, C., and Wechsler, C. (2014). Geologic Remote Sensing for Geothermal Exploration: A Review. Int. J. Appl. earth observation geoinformation 33, 255–269. doi:10.1016/j.jag.2014.05.007
Wilks, M., Kendall, J.-M., Nowacki, A., Biggs, J., Wookey, J., Birhanu, Y., et al. (2017). Seismicity Associated with Magmatism, Faulting and Hydrothermal Circulation at Aluto Volcano, Main Ethiopian Rift. J. Volcanology Geothermal Res. 340, 52–67. doi:10.1016/j.jvolgeores.2017.04.003
Williams, F. M., Williams, M. A. J., and Aumento, F. (2004). Tensional Fissures and Crustal Extension Rates in the Northern Part of the Main Ethiopian Rift. J. Afr. Earth Sci. 38 (2), 183–197. doi:10.1016/j.jafrearsci.2003.10.007
Woldegabriel, G., Aronson, J. L., and Walter, R. C. (1990). Geology, Geochronology, and Rift basin Development in the central Sector of the Main Ethiopia Rift. Geol. Soc. America Bull. 102 (4), 439–458. doi:10.1130/0016-7606(1990)102<0439:ggarbd>2.3.co;2
Keywords: Main Ethiopian Rift, hydrothermal alteration, remote sensing, volcano, faults
Citation: Raggiunti M, Keir D and Pagli C (2021) Mapping Hydrothermal Alteration at the Fentale-Dofan Magmatic Segment of the Main Ethiopian Rift. Front. Earth Sci. 9:716144. doi: 10.3389/feart.2021.716144
Received: 28 May 2021; Accepted: 03 August 2021;
Published: 20 August 2021.
Edited by:
Daniele Trippanera, King Abdullah University of Science and Technology, Saudi ArabiaReviewed by:
Thomas R. Walter, Helmholtz Centre Potsdam, GermanyFederico Galetto, Cornell University, United States
Copyright © 2021 Raggiunti, Keir and Pagli. This is an open-access article distributed under the terms of the Creative Commons Attribution License (CC BY). The use, distribution or reproduction in other forums is permitted, provided the original author(s) and the copyright owner(s) are credited and that the original publication in this journal is cited, in accordance with accepted academic practice. No use, distribution or reproduction is permitted which does not comply with these terms.
*Correspondence: Martina Raggiunti, martina.raggiunti@phd.unipi.it