Magma Migration at Shallower Levels and Lava Fountains Sequence as Revealed by Borehole Dilatometers on Etna Volcano
 Alessandro Bonaccorso
 Luigi Carleo
  Gilda Currenti
- Istituto Nazionale di Geofisica e Vulcanologia, Sezione di Catania - Osservatorio Etneo, Catania, Italy
A main challenge in open conduit volcanoes is to detect and interpret the ultra-small strain (<10–6) associated with minor but critical eruptions such as the lava fountains. Two years after the flank eruption of December 2018, Etna generated a violent and spectacular eruptive sequence of lava fountains. There were 23 episodes from December 13, 2020 to March 31, 2021, 17 of which in the brief period 16 February to 31 March with an intensified occurrence rate. The high-precision borehole dilatometer network recorded significant strain changes in the forerunning phase of December 2020 accompanying the final magma migration at the shallower levels, and also during the single lava fountains and during the entire sequence. The source modeling provided further information on the shallow plumbing system. Moreover, the strain signals also gave useful information both on the explosive efficiency of the lava fountains sequence and the estimate of erupted volume. The high precision borehole dilatometers confirm to be strategic and very useful tool, also to detect and interpret ultra-small strain changes associated with explosive eruptions, such as lava fountains, in open conduit volcanoes.
Introduction
The magma uprising processes leading to volcanic eruptions produce ground deformation and strain changes. Detection of the strain associated both with the preparatory phases and the eruptive events is key in interpreting the ongoing phenomena (i.e., Dzurisin, 2007 and references therein). Very high sensitivity in detecting strain changes allows both highlighting possible precursors and also improving the understanding of the eruptive mechanisms.
The geophysical instruments with the best resolution are currently borehole strain-meters (nominal resolution of 10–10 to 10–11). In volcanic areas the most commonly used types of these instruments are borehole dilatometers that measure the volumetric strain. These monitoring devices provide helpful information in detecting high precision strain changes that accompany the reawakening of volcanic activity, thus improving the understanding of the volcanic processes.
The most famous cases are the eruptions at Hekla volcano (Iceland) in 1991 and 2000 (Linde et al., 1993; Sturkell et al., 2013), in which the strain changes allowed the successful prediction of the eruption onset. Other notable examples of strainmeter results in volcanoes around the world are Mauna Loa, Hawaii (Linde and Sacks, 1995; Johnston et al., 2001; Hurwitz and Johnston, 2003), Montserrat, WI (Voight et al., 2006; Chardot et al., 2010; Linde et al., 2010; Hautmann et al., 2014), Izu-Oshima, Japan (Linde et al., 2016), Campi Flegrei, Italy (Amoruso et al., 2015), and Stromboli, Italy (Bonaccorso et al., 2012; Di Lieto et al., 2020).
At Etna volcano, the major eruptions are characterized by final magma intrusions propagating vertically or radially that feed the flank eruptions, which are capable of producing tens to hundreds of millions of cubic meters of lava flows (Bonaccorso et al., 2004 and references therein). In the last 20 years, eruptions comprising a sequence of lava fountain events have also been an efficient mode of magma emission, especially when these explosive events recur in a brief time, namely days to weeks. In particular, from January 2011 to December 2013 the NSEC summit crater generated 44 lava fountains (Calvari et al., 2018 and references therein). Lava fountains are explosive eruptions that in basaltic volcanoes expel lava fragments to heights from tens to hundreds of meters (e.g. Wolff and Sumner, 2000 and references therein). At Etna, the usual duration of these events ranges from minutes to some hours, and they are also accompanied by summit effusive lava flows. Despite the brief duration, this eruptive activity is often dramatic due to the formation of 10–15 km high eruptive columns that lead to dangerous ash plume dispersal and fall-out (e.g. Calvari et al., 2018 and references therein). In recent decades, the lava fountains have caused several problems to the urban areas of the main city of Catania and the other villages around Etna’s flanks. Moreover, the hazard to aviation often forced the closure of the Catania international airport.
Unlike the magma intrusions that open new paths causing marked deformation and strain, the lava fountains drain magma through the existing internal main conduit of the volcano. This process produces smaller deformations on the ground surface that are not easy to detect by the geodetic networks such as GNSS or by space remote sensing such as InSAR also due to their brevity (i.e. Bonaccorso et al., 2013a). However, highly sensitive instruments, such as deep borehole dilatometers, are usually able to detect small strain changes up to a precision of 10–10 thus providing useful information during this eruptive activity (Currenti and Bonaccorso, 2019). The strain changes detected during the lava fountains of 2011–2013 by high precision borehole dilatometers enabled modelling the shallow deflating source located at a depth ∼0 km below sea level (b.s.l.) (Bonaccorso et al., 2013), interpreted as a shallow and small storage where the gas-rich magma is trapped and then violently ejected through the lava fountains.
In December 2020, Etna underwent a rapid evolution of its activity with seismic swarms forerunning the eruptive phase comprising a sequence of 23 lava fountains from 13 December to 31 March, of which the last 17 events from 16 February to 31 March.
In this work, we present the high-precision strain measurements from the borehole dilatometer network that has enabled tracking the volcano’s eruptive activity. We report how the strain signal can provide useful constraints to investigate and interpret the ongoing phenomena. We show that the strain data constrained the shallow intrusion occurring during the seismic swarm on 19 December and how this represents a crucial turning point preceding the eruptive activity. Moreover, the strain data allowed us to infer the position for the source feeding the single lava fountains during the entire period of the February-March sequence. These results highlight further details on the shallow plumbing system. Finally, the strain signals also provided information on both the explosive efficiency of the lava fountain sequence, useful for evaluating the evolution state of the ongoing phenomenon, and the estimate of the erupted volume.
Etna Volcano Activity Forerunning the 2020-2021 Explosive Activity
After the short and not very voluminous flank eruption in December 2018, caused by the rapid ascent of a vertical dike that caused marked deformations (e.g. Aloisi et al., 2020), the volcano produced mainly summit eruptive activity. From May 2019 to May 2020, there was mainly eruptive activity from the summit craters with discontinuous ash emissions, mild Strombolian activity, and also effusive activity (De Beni et al., 2020). By mid-December 2020 three seismic swarms had occurred at intermediate depths on the 1st (depth 1.3–4 km b.s.l., ML 1.0–2.3), 6th (depth 16–28 km b.s.l. ML 1.6–2.9) and 9 th - 12th of December (depth 2–8 km b.s.l. ML 1.3–2.6). A first lava fountain took place on 13 December, then a shallow seismic swarm (ML 0.8–1.5) occurred under the crater area in the last kilometers below the sea level on 19 December indicating an attempt of fast magma intrusion in the shallower levels. This seismic activity preceded the two fountains close together on 21 and 22 December. Then the crucial phase started on 16 February when a sequence of frequent lava fountains began and erupted a further 17 events until 31 March (INGV-OE, weekly internal reports at https://www.ct.ingv.it/index.php/monitoraggio-e-sorveglianza/prodotti-del-monitoraggio/bollettini-settimanali-multidisciplinari).
Borehole Dilatometers Network and Strain Signals
Network
The dilatometers making up the Etna network measure the volumetric strain of the rock surrounding the sensor. The device is a liquid-filled, 3–4 m long, cylindrical tube installed in a deep (100–200 m) drilled hole. These are the geophysical instruments with the best sensitivity, reaching a nominal resolution of 10–10 to 10–11, with a dynamic range of 140 dB and frequency range of 10–7 to >20 Hz (Roeloffs and Linde, 2007).
The borehole dilatometers at Etna were installed in drilled holes at depths ranging from ∼170 m (DRUV and DEGI stations) to ∼110 m (DMSC and DPDN) (Figure 1A). A detailed description of Etna’s dilatometer network and the important information furnished during previous eruptive activities is provided in Bonaccorso et al. (2016; 2020).
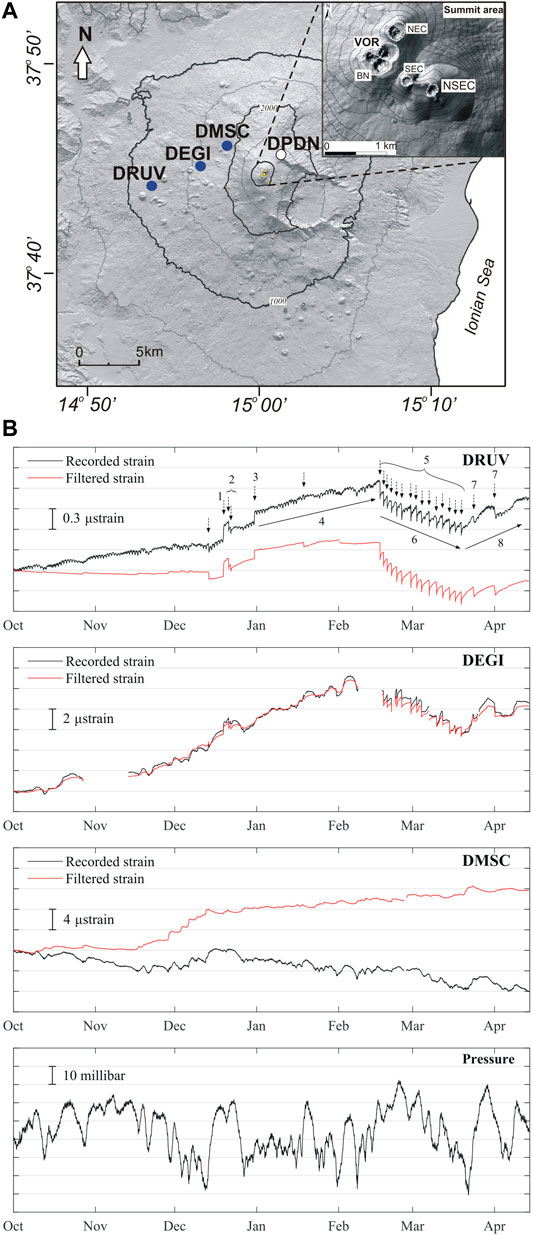
FIGURE 1. (A) Etna borehole dilatometer network. The DPDN station was out of order in the period of this study. (B). Recorded and filtered strain data from October 1, 2020 to April 10, 2021. 1) strain change recorded during the December 19, 2020 seismic swarm below the volcano pile with seismic earthquakes located at shallow depth; 2) two close lava fountains following the seismic swarm of 19 December; 3) pre-swarm strain change recorded on 31 December; 4) recharging compression phase; 5) strain changes during the single lava fountain events, 6) strain changes during the middle term decompression of 16 Feb–19 March as recorded at DRUV and DEGI stations; 7) last events of the lava fountains sequence with longer effusive activity; 8) resumption of compression from 19 March as recorded at DRUV and DEGI stations.
During the investigation period of this study (December 2020 - April 2021) the DPDN station (closer to the summit area at 2.750 m a.s.l.) was out of use. It was not possible to repair as it was unreachable due to snow. The three stations DRUV, DEGI and DMSC, apart from some brief interruptions at DEGI, recorded regularly.
Strain Signals
The response and the accuracy of dilatometers are affected by various installation conditions, among which mechanical rock properties, sensor-rock coupling and local environmental noise. Therefore, in situ instrument calibration is crucial. At DRUV station, installed in very massive rocks with high efficiency in transferring strain to the sensor, three different calibration approaches have been applied by comparing recorded signals with theoretical tides Bonaccorso et al. (2013), synthetic straingrams of teleseismic events Bonaccorso et al. (2016) and strains estimated from seismic array signals (Currenti et al., 2017). The three methods gave comparable calibration coefficient values. DEGI and DMSC stations, less sensitive than DRUV, were calibrated by comparing the amplitudes of teleseismic waves recorded at the stations and at the reference station DRUV. The strain signals are usually affected by disturbing signals mainly due to tidal and atmospheric pressure variations. In order to properly detect strain changes related to volcanic activity, these components are estimated and filtered. The DRUV signal, sensitive to both tidal and pressure variations, is filtered using the BAYTAP-G software (Tamura et al., 1991). The signals recorded at DEGI and DMSC, mainly disturbed by atmospheric pressure variations, are filtered by applying a linear regression to the pressure signal. Tidal and atmospheric pressure parameters are fitted using a sufficiently long dataset, during which the volcano activity was low and there were no other significant perturbations (i.e. rainfall precipitations), in order to avoid spurious signals that may affect the parameter estimates. We then filtered the dataset from September 2020 to April 2021. The recorded and filtered signals together with the atmospheric pressure data are shown in Figure 1B. Offsets and outliers due to both electronic problems and opening of the instrumental control valves were removed. The analysis of the filtered signals highlighted three main phases: a compression phase, up to February 16, 2021; a decompression phase, from 16 February to March 19, 2021 and a final compression phase. Moreover, two significant strain changes, on 19 and 31 December, were detected. The first one (Figure 2A), clearly observable at DRUV and DEGI, occurred in concomitance with a seismic swarm at a shallow depth a few kilometers below the summit crater area. This episode was followed by two lava fountains 2 days later (Figure 2A). The second one, only detected at DRUV (Figure 1), preceded by about 15 h a second seismic swarm that instead occurred more distant from the crater area in the lower western flank at a depth of 9–14 km b.s.l. The decompression phase was characterized by a middle-term decompression and short-term step-like variations at the time of each lava fountain event. A clear detail is provided by the DRUV signal (Figure 2B). A slow compression phase restarted at DRUV and DEGI from 19 March and negative strain changes can again be detected at the time of the last two lava fountains on 24 March and April 1, 2021. It is interesting to note that, during the deflation phase, the strain variation recorded by each individual strainmeter concurrently with all the lava fountains is similar. Moreover, the ratio between the middle term strain variation recorded at DEGI and the one recorded at DRUV is comparable with the strain variation ratio DEGI/DRUV recorded during the other events of this eruptive sequence.
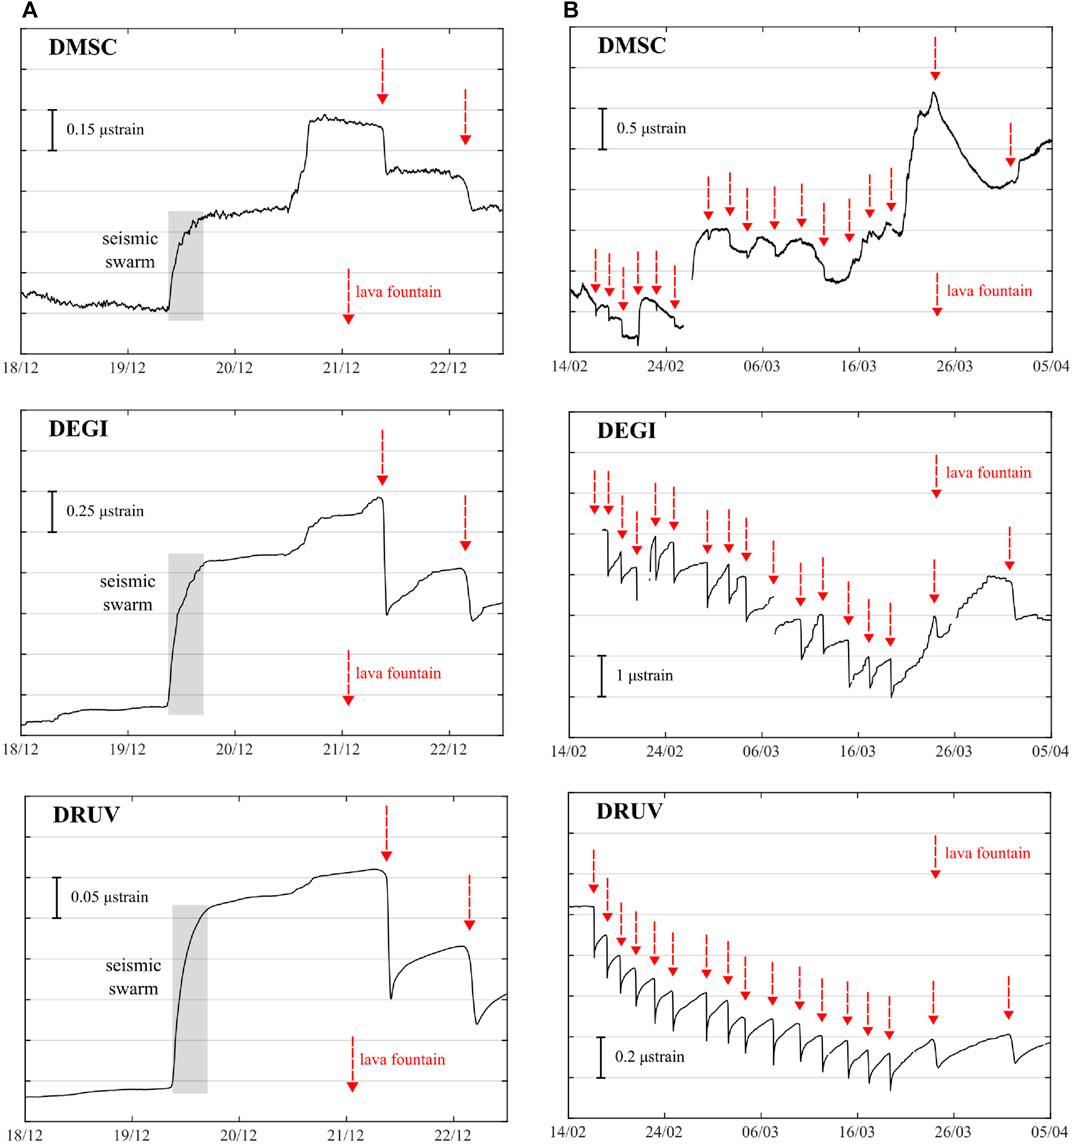
FIGURE 2. (A) Detail of the strain recorded during the December 19, 2020 swarm accompanying the intrusion and during the following first lava fountains on 21-22 December 2020. (B) Detail of the strain changes recorded during the lava fountains sequence from February 16, 2021.
Modeling
The 19 December 2020 Intrusion
The match in time between the occurrence of the seismic swarm and the strain changes recorded at the dilatometer stations on 19 December 2020 is a clear indication of the response of the volcano edifice to a common source. We investigate whether the recorded compression of tenths of microstrain is compatible with the strain exerted by a tensile dislocation due to a shallow dike emplacement. Because of the shallowness of the source, Etna topography could introduce significant distortion in the strain field, which analytical solutions may fail to capture (i.e. Bonaccorso et al., 2005). Therefore, we set up a fully 3D Finite Element (FE) model under COMSOL Multiphysics taking account of the real Etna topography. In addition, elastic medium heterogeneity is introduced by estimating the elastic moduli from seismic tomography investigations (Patanè et al., 2006). Additional information on the FE model is reported in Supplementary Material S1. More details about the model set up can be found in Currenti et al. (2008, 2011). Due to the limited number of available observations, we attempt to provide a first order estimate of the expected strain changes by constraining the source position to the seismic swarm cluster (Barberi et al., 2020), localized below the base of the NSEC (Figures 3A, C). A grid search was run over the depth, length and width parameters to find a solution that fits the observations. The grid search leads to a shallow tensile dislocation developing from -1.3 km b.s.l. to 0.5 km a.s.l. and extending for 1.2 km with an average opening of about 0.3 m. The recorded and expected values at each station are reported in Supplementary Table S2. The general strain pattern confirms a compression at the dilatometer stations, which are located quite far from and outside the main dilatation pattern surrounding the source. The seismic swarm cluster seems to be centered at the bottom of the tensile source, indicating the local pressurization exerted by the penetration of the magma toward the surface. A deeper source would have generated a dilatation at the DMSC station. Discrepancies between the depth of the source and seismic events could be attributable to the half-space assumption (free surface at 1.6 km a.s.l.) in seismic event location. It is worth noting that the engendered displacement at the ground surface is at most 8 and 6 mm in the horizontal and vertical component, respectively, thus confirming the condition that the high frequency GNSS permanent network did not detect any significant displacements greater than the measurement accuracy.
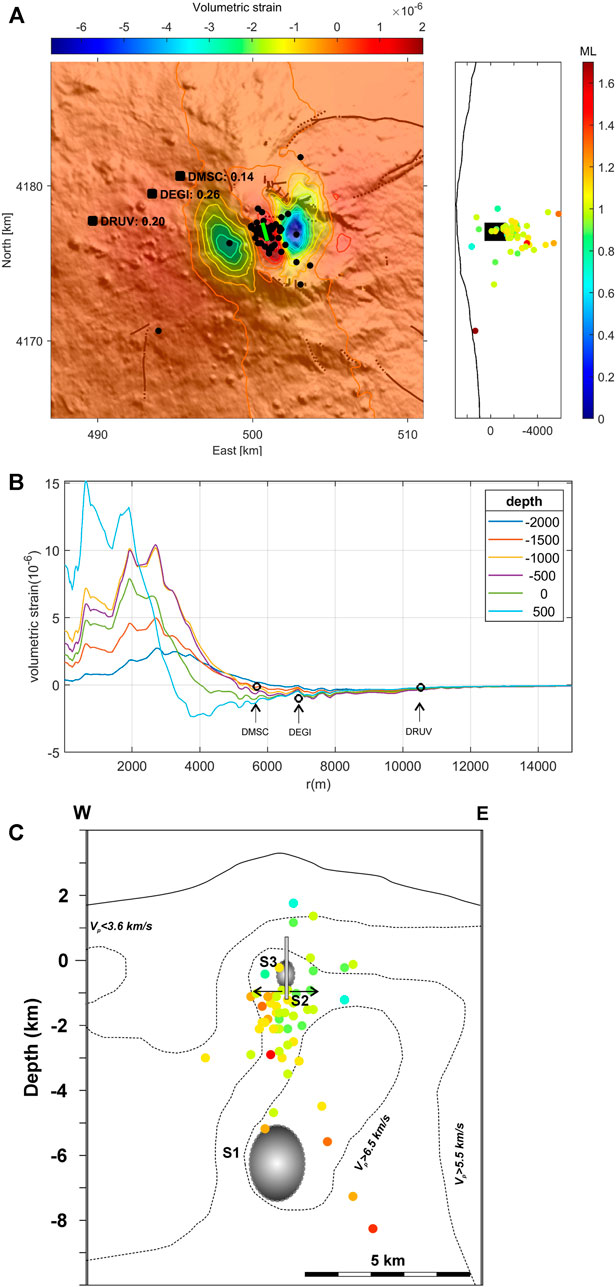
FIGURE 3. (A) Etna map with the strain expected by the tensile source model for the Dec 19, 2020 intrusion. The circles are the locations of the earthquakes of the seismic swarm. On the right, the N-S section indicating the local magnitude ML of the seismic events. (B) FE modelled volumetric strain changes (colored lines) of the prolate source, having aspect ratio 0.5 and volume change 2 × 10⁶ m3, for different depths along a profile running westward from the summit crater area. Volumetric strain changes observed at the dilatometer stations are also reported (black circles). (C) W-E section of Etna and different sources. S1 is the classic intermediate storage (Z ∼6 ± 2 km) modeled several times during the prolonged recharging periods over the last 40 years (i.e. Aloisi et al., 2018; Bonaccorso and Aloisi, 2021). S2 is the tensile source acting on Dec 19, 2020. S3 is the source that constrains the decompression source during the events of the lava fountain sequence. It is in the same position already modeled with the strain for the previous fountains of 2011–2013.
Source of the Lava Fountains
The recurring fast negative strain changes during the lava fountain events are indicative of the decompression related to the magma release. At each of the three available stations, the sign and amplitude of the changes are similar for all the events, with distinct step-like variations of about −0.2, −1 and −0.1 microstrain at DRUV, DEGI and DMSC, respectively. Owing to this recurring pattern and the similar events dynamics at the NSEC, it is reasonable to assume that the decompression source and its action have not changed over time. Thus, we use the elastic FE model to quantify the strain changes generated by a spheroidal magma storage undergoing a contraction. The resemblance with the strain changes observed during the lava fountaining sequences in 2011–2013 (Bonaccorso et al., 2013) again points to a shallow magma accumulation zone under the NSEC. In order to constrain the source location and shape, we carried out a grid search on the depth and eccentricity parameter of a spheroid. Owing to the linearity of equations in elastic regime, the normal displacements at the source boundary are defined by fitting the computed and observed values for each pair of model parameters. Although oblate and prolate sources can generally fit the strain at the dilatometer stations, prolate sources are more suitable, since they induce small displacements (below 1.5 cm) in agreement with the lack of any significant variation above the accuracy of current GNSS measurements (F. Cannavò, personal communication). The main findings point to a shallow vertically elongated magma storage located in the range depth of 0.5–1 km b.s.l. (Figure 3) as the most likely source feeding the lava fountaining events. The fit with the data infers an average normal displacement of the source walls of about 0.8 m leading to a volume change of 2 × 10⁶ m3. The recorded and expected values at each station are reported in Supplementary Table S2.
Discussion
On Etna, frequent seismic swarms are a main mode of the release of the energy that accumulates in the main volcano-tectonic structures (Patanè and Giampiccolo, 2004; Alparone et al., 2015). These swarms can also occur sometime after the eruptions both during periods of slow recharge preceding the eruptions and in periods following the eruptions. Then there is a class of eruptive swarms that accompanies the rapid penetration of magma in the form of dikes that propagate and generate strong associated seismicity such as, for example, the last brief flank eruption of December 2018 (Alparone et al., 2020). Finally, another important class of seismic swarms is that associated with the first intrusion attempts that anticipate and forerun the final magma ascent and summit eruptions. The tensile source modeling of the strain recorded by the borehole dilatometer shows that the seismic swarm of December 19, 2020 falls within this last category, and this swarm testifies to the migration of fresh magma to a shallower level of the plumbing system which then generates the prolonged explosive activity. After this swarm occurred and the eruptive activity began, the strain signals provided valuable information both in the short- (single lava fountains) and middle-term (duration of the entire eruptive sequence of February - March 2021). In particular, the stations DRUV and DEGI clearly recorded the short-term decompression effect (negative strain variations) during fountains by defining the start-end timing of the eruptive phenomenon through the initial-final points of the negative variations, and the eruption intensity from the amplitude of the variation. The strain changes recorded during the single lava fountains and during the discharge phase in February- March infer a vertically elongated source with its centroid positioned near 0.5–1 km b.s.l. confirming the position previously obtained for the lava fountains of 2011–2013 by Bonaccorso et al. (2013). This source represents a small storage area where gas-rich magma is trapped and then violently ejected through lava fountains. Therefore, it is a sort of shallow valve in which the magma is accumulated and then released to generate the lava fountains. This picture is consistent with the recent results obtained from a recent seismic tomography for the period January 2020 - February 18, 2021 (O. Cocina pers. comm.; De Gori et al., submitted). Besides the decrease in the seismic velocity Vp in a large volume centered at 6 km b.s.l. the tomography now also showed a small volume centered at 0–1 km b.s.l. interpreted as the seismic anomaly related to the shallow reservoir that fueled the recent eruptive activity. This anomaly was not present in previous tomographic studies (i.e. Patanè et al., 2006). Therefore, there appears to be a good agreement between the position of the source detected by the recent tomography and that constrained by strain variations. The sketch map with the sources position is shown in Figure3C. In addition to information on the timing and the characteristics of the eruptive activity and associated sources, the strain signals provided useful information on the state of efficiency of the explosive sequence. A critical point is to understand if the fountains are a prelude to a main flank eruption or are a sequence that will cease over time. It is very important to understand the evolution of violent explosive sequences in terms of 1) possible migration of the source and 2) when it would have ended. On the first point, the constant DRUV/DEGI strain amplitude ratio for the different eruptive events of the sequence indicated that the source position during the four episodes remained stable. During the previous 3–5 December 2015 explosive sequence from the main central crater Voragine (VOR in Figure1A), the rapid decreasing of the amplitude changes over time indicated the ending of the explosive sequence (Bonaccorso and Calvari, 2017). For the February–March 2021 sequence, the strain variations over time showed a less rapid but very clear decrease in amplitudes (Figure 4A). This behavior was accompanied by a gradual lengthening of the time elapsed between one fountain and the next (Figure 4B). These two elements, namely the trend of gradual attenuation of the strain amplitude changes and lengthening of the times between two successive events, could represent a useful indicator of a progressively lower efficiency of the eruptive source leading to the waning of the explosive sequence.
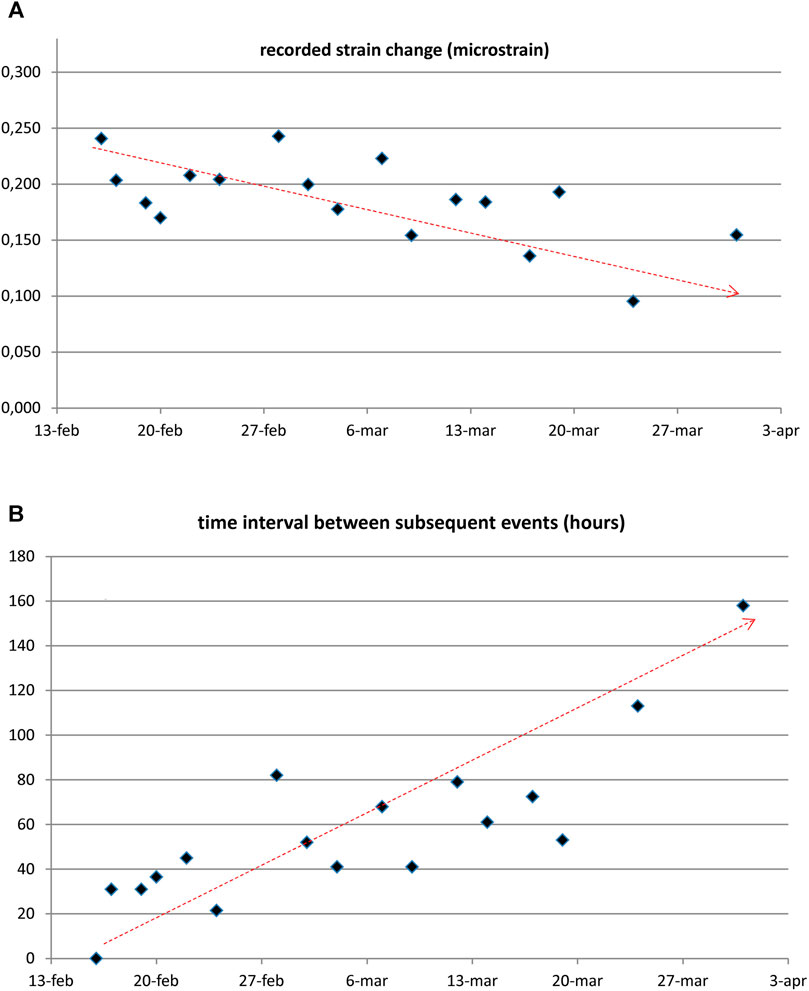
FIGURE 4. (A) strain change amplitudes recorded during the lava fountain events. The changes showed a decrease in amplitudes over time. (B) the time interval between two consecutive lava fountains lengthened over time.
Finally, it is worth noting that the strain is particularly useful to furnish an estimate of the total erupted volumes. From the mean strain changes recorded during the lava fountains of 2011–2013, Bonaccorso et al. (2013) inferred an elongated source, located below the crater area at a depth close to sea level, that deflates and changes its volume by 2 × 10⁶ m3 and, considering the portion due to the compressibility of the magma, the total volume of magma expelled was ∼2.5 × 10⁶ m3. This result was confirmed by the average total (pyroclastic products plus lava flows) volume of magma emitted for the lava fountain during 2011–2013 (De Beni et al., 2015) estimated by two aero-photogrammetric surveys. This is therefore considered as the representative volume for a single lava fountain, producing the mean strain change recorded during the 2011–2013 lava fountains that at DRUV was of 0.15 microstrain. Since the expected strain caused by the contraction of a spheroidal source depends linearly on the source volume change (i.e. Roeloffs and Linde (2007)), we can then use the previous relation at DRUV (i.e. 0.15 microstrain corresponds to 2.5 × 10⁶ m3 emitted lava volume) to estimate the total volume emitted by the NSEC lava fountains from the recorded strain changes. From 13 Dec to March 31, 2020, the total volume discharged, calculated from the strain changes, is approximately 59 × 106 m3 (of which about 52,5 × 10⁶ m3 in the phase of February 16 - March 31). This high rate of eruption volume confirms that, similarly to the 44 lava fountains in 2011–2013, the recent December 2020–February 2021 sequence represents an efficient modality of magma discharge able to emit a total magma volume equivalent to a main effusive flank eruption, then allowing to maintain the balance between arrival and drainage of new magma from depth (Bonaccorso and Calvari, 2013).
Conclusion
The strain signals allowed us to obtain important information on the state of activity of the volcano, on the characteristics of the explosive sequence and on the sources acting in the shallow plumbing system. This result is of great importance because the lava fountains produce very small deformations that are usually not detectable with geodetic techniques. In particular, the strain unambiguously indicated the phase of magma migration at the most superficial levels with the changes recorded during the swarm of 19th December. The strain variations recorded during the single fountains and the deflation phase during the sequence of 16 February - 31 March, respectively, enable constraining the position of the source and updating the shallow plumbing system with new details. Moreover, the strain signal also provides both useful indications on the efficiency of the explosive sequence over time, and on the estimate of the total emitted magma volume.
Data Availability Statement
The raw data supporting the conclusions of this article will be made available by the authors, without undue reservation.
Author Contributions
AB traced the study scheme. AB, LC, and GC worked on data calibration and filtering. GC performed the numerical modeling. AB, LC, and GC contributed in writing the manuscript. AS oversaw the functioning of the stations and their technological development. All the authors shared the discussion of the results.
Funding
The Etna borehole strainmeter network originally benefited by the financial support of the Italian FIRB project “Development of new technologies for the protection and defense of the territory from natural hazards” (acronym FUMO) and PON project “Development of research centers for the study of volcanic areas at high risk and their geothermal potential in the context of Mediterranean geological and environmental dynamic” (acronym VULCAMED). This research benefited from funding provided by the 2019–2021 Agreement between INGV and Italian Presidenza del Consiglio dei Ministri “ Dipartimento della Protezione Civile (DPC), All. B2- WP2 -Task 9 “Ottimizzazione dell’acquisizione dei segnali ad alta precisione degli strainmeter installati in pozzo sull’Etna” (Optimization of the acquisition of high-precision signals from the bore-hole strainmeters installed at Etna volcano). This research also benefited from the EC H2020-FET OPEN project “SiC optical nano-strain-meters for pico-detection in Geosciences” (acronym SiC nano for picoGeo).
Conflict of Interest
The authors declare that the research was conducted in the absence of any commercial or financial relationships that could be construed as a potential conflict of interest.
Publisher’s Note
All claims expressed in this article are solely those of the authors and do not necessarily represent those of their affiliated organizations, or those of the publisher, the editors and the reviewers. Any product that may be evaluated in this article, or claim that may be made by its manufacturer, is not guaranteed or endorsed by the publisher.
Acknowledgments
We sincerely thank the colleagues of the Carnegie Institution of Washington A. Linde and S. Sacks, who actively supported and coordinated the start of the dilatometer installations on Etna and contributed to the first fundamental studies. We thank the colleagues of the Carnegie Institution of Washington M. Acierno and B. Schleigh who implemented the instrumentation and provided useful and precious assistance.
Supplementary Material
The Supplementary Material for this article can be found online at: https://www.frontiersin.org/articles/10.3389/feart.2021.740505/full#supplementary-material
References
Aloisi, M., Bonaccorso, A., Cannavò, F., Currenti, G., and Gambino, S. (2020). The 24 December 2018 Eruptive Intrusion at Etna Volcano as Revealed by Multidisciplinary Continuous Deformation Networks (CGPS, Borehole Strainmeters and Tiltmeters). J. Geophys. Res. Solid Earth 125, e2019JB019117. doi:10.1029/2019JB019117
Aloisi, M., Bonaccorso, A., Cannavò, F., and Currenti, G. M. (2018). Coupled Short- and Medium-Term Geophysical Signals at Etna Volcano: Using Deformation and Strain to Infer Magmatic Processes from 2009 to 2017. Front. Earth Sci. 6, 109. doi:10.3389/feart.2018.00109
Alparone, S., Barberi, G., Giampiccolo, E., Maiolino, V., Mostaccio, A., Musumeci, C., et al. (2020). Seismological Constraints on the 2018 Mt. Etna (Italy) Flank Eruption and Implications for the Flank Dynamics of the Volcano. Terra Nova 32, 334–344. doi:10.1111/ter.12463
Amoruso, A., Crescentini, L., Scarpa, R., Bilham, R., Linde, A. T., and Sacks, I. S. (2015). Abrupt Magma Chamber Contraction and Microseismicity at Campi Flegrei, Italy: Cause and Effect Determined from Strainmeters and Tiltmeters. J. Geophys. Res. Solid Earth 120, 5467–5478. doi:10.1002/2015JB012085
Barberi, G., Ferrari, F., Maiolino, V., Mostaccio, A., Scaltrito, A., Sciotto, M., et al. (2020). Mt. Etna Revised Seismic Catalog from 2020 (EtnaRSC2020) (Version 1) [Data Set]. Rome: Istituto Nazionale di Geofisica e Vulcanologia (INGV). doi:10.13127/etnasc/etnarsc2020
Bonaccorso, A., and Aloisi, M. (2021). Tracking Magma Storage: New Perspectives from 40 Years (1980-2020) of Ground Deformation Source Modeling on Etna Volcano. Front. Earth Sci. 9, 638742. doi:10.3389/feart.2021.638742
Bonaccorso, A., and Calvari, S. (2017). A New Approach to Investigate an Eruptive Paroxysmal Sequence Using Camera and Strainmeter Networks: Lessons from the 3-5 December 2015 Activity at Etna Volcano. Earth Planet. Sci. Lett. 475, 231–241. doi:10.1016/j.epsl.2017.07.020
Bonaccorso, A., Calvari, S., Coltelli, M., Del Negro, C., and Falsaperla, S. (2004). Etna: Volcano Laboratory, Monograph of American Geophysical Union, n.143. Washington DC: American Geophysical Union, 369.
Bonaccorso, A., Calvari, S., Currenti, G., Del Negro, C., Ganci, G., Linde, A., et al. (2013a). From Source to Surface: Dynamics of Etna's Lava Fountains Investigated by Continuous Strain, Magnetic, Ground and Satellite thermal Data. Bull. Volcanol. 75, 690. doi:10.1007/s00445-013-0690-9
Bonaccorso, A., Calvari, S., Linde, A., Sacks, S., and Boschi, E. (2012). Dynamics of the Shallow Plumbing System Investigated from Borehole Strainmeters and Cameras during the 15 March, 2007 Vulcanian Paroxysm at Stromboli Volcano. Earth Planet. Sci. Lett. 357-358, 249–256. doi:10.1016/j.epsl.2012.09.009
Bonaccorso, A., and Calvari, S. (2013). Major Effusive Eruptions and Recent Lava Fountains: Balance between Expected and Erupted Magma Volumes at Etna Volcano. Geophys. Res. Lett. 40, 6069–6073. doi:10.1002/2013GL058291
Bonaccorso, A., Cianetti, S., Giunchi, C., Trasatti, E., Bonafede, M., and Boschi, E. (2005). Analytical and 3-D Numerical Modelling of Mt. Etna (Italy) Volcano Inflation. Geophys. J. Int. 163, 852–862. doi:10.1111/j.1365-246x.2005.02777.x
Bonaccorso, A., Currenti, G., Linde, A., and Sacks, S. (2013). New Data from Borehole Strainmeters to Infer Lava fountain Sources (Etna 2011-2012). Geophys. Res. Lett. 40, 3579–3584. doi:10.1002/grl.50692
Bonaccorso, A., Currenti, G., Linde, A., Sacks, S., and Sicali, A. (2020). Advances in Understanding Intrusive, Explosive and Effusive Processes as Revealed by the Borehole Dilatometer Network on Mt. Etna Volcano. Front. Earth Sci. 7, 357. doi:10.3389/feart.2019.00357
Bonaccorso, A., Linde, A., Currenti, G., Sacks, S., and Sicali, A. (2016). The Borehole Dilatometer Network of Mount Etna: A Powerful Tool to Detect and Infer Volcano Dynamics. J. Geophys. Res. Solid Earth 121, 4655–4669. doi:10.1002/2016JB012914
Calvari, S., Cannavò, F., Bonaccorso, A., Spampinato, L., and Pellegrino, A. G. (2018). Paroxysmal Explosions, Lava Fountains and Ash Plumes at Etna Volcano: Eruptive Processes and Hazard Implications. Front. Earth Sci. 6, 107. doi:10.3389/feart.2018.00107
Chardot, L., Voight, B., Foroozan, R., Sacks, S., Linde, A., Stewart, R., et al. (2010). Explosion Dynamics from Strainmeter and Microbarometer Observations, Soufrière Hills Volcano, Montserrat: 2008-2009. Geophys. Res. Lett. 37, a–n. doi:10.1029/2010GL044661
Currenti, G., and Bonaccorso, A. (2019). Cyclic Magma Recharge Pulses Detected by High-Precision Strainmeter Data: the Case of 2017 Inter-eruptive Activity at Etna Volcano. Sci. Rep. 9, 7553. doi:10.1038/s41598-019-44066-w
Currenti, G., Del Negro, C., Ganci, G., and Scandura, D. (2008). 3D Numerical Deformation Model of the Intrusive Event Forerunning the 2001 Etna Eruption. Phys. Earth Planet. Interiors 168, 88–96. doi:10.1016/j.pepi.2008.05.004
Currenti, G., Napoli, R., Di Stefano, A., Greco, F., and Del Negro, C. (2011). 3D Integrated Geophysical Modeling for the 2008 Magma Intrusion at Etna: Constraints on Rheology and dike Overpressure. Phys. Earth Planet. Interiors 185, 44–52. doi:10.1016/j.pepi.2011.01.002
Currenti, G., Zuccarello, L., Bonaccorso, A., and Sicali, A. (2017). Borehole Volumetric Strainmeter Calibration from a Nearby Seismic Broadband Array at Etna Volcano. J. Geophys. Res. Solid Earth 122. doi:10.1002/2017jb014663
De Beni, E., Behncke, B., Branca, S., Nicolosi, I., Carluccio, R., D'Ajello Caracciolo, F., et al. (2015). The Continuing story of Etna's New Southeast Crater (2012-2014): Evolution and Volume Calculations Based on Field Surveys and Aerophotogrammetry. J. Volcanology Geothermal Res. 303, 175–186. doi:10.1016/j.jvolgeores.2015.07.021
De Beni, E., Cantarero, M., Neri, M., and Messina, A. (2020). Lava Flows of Mt Etna, Italy: the 2019 Eruption within the Context of the Last Two Decades (1999-2019). J. Maps 17, 65–76. doi:10.1080/17445647.2020.1854131
De Gori, P., Giampiccolo, E., Cocina, O., Branca, S., Doglioni, C., and Chiarabba, C. (submitted). How Long Re-pressurized Magma Can Feed Eruptions at Mt. Etna ? Commun. Earth Environ. [Epub ahead of print].
Di Lieto, B., Romano, P., Scarpa, R., and Linde, A. T. (2020). Strain Signals before and during Paroxysmal Activity at Stromboli Volcano, Italy. Geophys. Res. Lett. 47, e2020GL088521. doi:10.1029/2020GL088521
Dzurisin, D. (2007). Volcano Deformation Geodetic Measurements Tecniques. Berlin: Springer-Verlag, 441.
Hautmann, S., Witham, F., Christopher, T., Cole, P., Linde, A. T., Sacks, I. S., et al. (2014). Strain Field Analysis on Montserrat (W.I.) as Tool for Assessing Permeable Flow Paths in the Magmatic System of Soufrière Hills Volcano. Geochem. Geophys. Geosyst. 15, 676–690. doi:10.1002/2013GC005087
Hurwitz, S., and Johnston, M. J. S. (2003). Groundwater Level Changes in a Deep Well in Response to a Magma Intrusion Event on Kilauea Volcano, Hawai'i. Geophys. Res. Lett. 30 (22), 2173. doi:10.1029/2003GL018676
Johnston, M. J. S., Lisowski, M., Hill, D. P., and Power, J. (2001). Mechanics of Volcanic Activity in Long Valley and Kilauea/Mauna Loa Volcanic Areas from Multi-Parameter Borehole Measurements. Trans. Am. Geophys. Un. 82, F1309.
Linde, A. T., Agustsson, K., Sacks, I. S., and Stefansson, R. (1993). Mechanism of the 1991 Eruption of Hekla from Continuous Borehole Strain Monitoring. Nature 365, 737–740. doi:10.1038/365737a0
Linde, A. T., Kamigaichi, O., Churei, M., Kanjo, K., and Sacks, S. (2016). Magma Chamber Recharging and Tectonic Influence on Reservoirs: The 1986 Eruption of Izu-Oshima. J. Volcanology Geothermal Res. 311, 72–78. doi:10.1016/j.jvolgeores.2016.01.001
Linde, A. T., and Sacks, S. (1995). “Continuous Monitoring of Volcanoes with Borehole Strainmeters,” in Mauna Loa Revealed: Structure, Composition, History, and Hazards. Editors J. M. Rhodes, and J. P. Lockwood (Washington, D. C: AGU), 171–185. doi:10.1029/GM092p0171–185
Linde, A. T., Sacks, S., Hidayat, D., Voight, B., Clarke, A., Elsworth, D., et al. (2010). Vulcanian Explosion at Soufrière Hills Volcano, Montserrat on March 2004 as Revealed by Strain Data. Geophys. Res. Lett. 37, a–n. doi:10.1029/2009GL041988
Patané, D., Barberi, G., Cocina, O., De Gori, P., and Chiarabba, C. (2006). Time-Resolved Seismic Tomography Detects Magma Intrusions at Mount Etna. Science 313, 821–823. doi:10.1126/science.1127724
Patanè, D., and Giampiccolo, E. (2004). “Faulting Processes and Earthquake Source Parameters at Mount Etna: State of the Art and Perspectives,” in Etna Volcano Laboratory. Editors A. Bonaccorso, S. Calvari, M. Coltelli, C. Del Negro, and S. Falsaperla (Washington, DC: AGU Geophysical monograph series, American Geophysical Union), 167–189. doi:10.1029/143gm11
Roeloffs, E. A., and Linde, A. T. (2007). “Borehole Observations of Continuous Strain and Fluid Pressure,” in Volcano Deformation Geodetic Measurements Tecniques. Editor D. Dzurisin (Berlin: Springer), 305–322. doi:10.1007/978-3-540-49302-0_9
Salvatore Alparone, S., Vincenza Maiolino, V., Antonino Mostaccio, A., Antonio Scaltrito, A., Andrea Ursino, A., Graziella Barberi, G., et al. (2015). Instrumental Seismic Catalogue of Mt. Etna Earthquakes (Sicily, Italy): Ten Years (2000-2010) of Instrumental Recordings. ANNALS GEOPHYSICS 58, 4–S0435. doi:10.4401/ag-6591
Sturkell, E., Ágústsson, K., Linde, A. T., Sacks, S. I., Einarsson, P., Sigmundsson, F., et al. (2013). New Insights into Volcanic Activity from Strain and Other Deformation Data for the Hekla 2000 Eruption. J. Volcanology Geothermal Res. 256, 78–86. doi:10.1016/j.jvolgeores.2013.02.001
Tamura, Y., Sato, T., Ooe, M., and Ishiguro, M. (1991). A Procedure for Tidal Analysis with a Bayesian Information Criterion. Geophys. J. Int. 104 (3), 507–516. doi:10.1111/j.1365-246X.1991.tb05697.x
Voight, B., Linde, A. T., Sacks, I. S., Mattioli, G. S., Sparks, R. S. J., Elsworth, D., et al. (2006). Unprecedented Pressure Increase in Deep Magma Reservoir Triggered by Lava-Dome Collapse. Geophys. Res. Lett. 33, L03312. doi:10.1029/2005GL024870
Keywords: etna volcano, lava fountains, volcano monitoring, borehole strainmeters, eruption modeling
Citation: Bonaccorso A, Carleo L, Currenti G and Sicali A (2021) Magma Migration at Shallower Levels and Lava Fountains Sequence as Revealed by Borehole Dilatometers on Etna Volcano. Front. Earth Sci. 9:740505. doi: 10.3389/feart.2021.740505
Received: 13 July 2021; Accepted: 23 August 2021;
Published: 08 September 2021.
Edited by:
Aline Peltier, UMR7154 Institut de Physique du Globe de Paris (IPGP), FranceReviewed by:
François Beauducel, UMR7154 Institut de Physique du Globe de Paris (IPGP), FranceEmily K. Montgomery-Brown, United States Geological Survey, United States
Copyright © 2021 Bonaccorso, Carleo, Currenti and Sicali. This is an open-access article distributed under the terms of the Creative Commons Attribution License (CC BY). The use, distribution or reproduction in other forums is permitted, provided the original author(s) and the copyright owner(s) are credited and that the original publication in this journal is cited, in accordance with accepted academic practice. No use, distribution or reproduction is permitted which does not comply with these terms.
*Correspondence: Alessandro Bonaccorso, alessandro.bonaccorso@ingv.it