Detection, Attribution, and Future Response of Global Soil Moisture in Summer
 Liang Qiao
 Zhiyan Zuo
 Dong Xiao
 Lulei Bu1,2
- 1Department of Atmospheric and Oceanic Sciences/Institute of Atmospheric Sciences, Fudan University, Shanghai, China
- 2State Key Laboratory of Severe Weather, Chinese Academy of Meteorological Sciences, Beijing, China
- 3Collaborative Innovation Center on Forecast and Evaluation of Meteorological Disasters, Nanjing University of Information Science and Technology, Nanjing, China
Soil moisture variations and its relevant feedbacks (e.g., soil moisture–temperature and soil moisture–precipitation) have a crucial impact on the climate system. This study uses reanalysis and Coupled Model Intercomparison Project phase 6 simulations datasets to detect, attribute, and project soil moisture variations. The effect of anthropogenic forcings [greenhouse gases (GHG), anthropogenic aerosols (AA), and land use (LU) change] on soil moisture is much larger than that of the natural forcing. Soil moisture shows a drying trend at a global scale, which is mainly attributed to GHG forcing. The effects of external forcings vary with the regions significantly. Over eastern South America, GHG, AA, and natural forcings make soil dry, while LU forcing makes the soil wet. Over severely drying Europe, all the external forcings including GHG, AA, LU, and natural forcing exhibit drying effect. The optimal fingerprint method detection results show that some of GHG, AA, LU, and natural signals can be detected in soil moisture variations in some regions such as Europe. The soil will keep drying in all scenarios over most parts of the globe except Sahel and parts of mid-latitudes of Asia. With the increase of anthropogenic emissions, the variation of global soil moisture will be more extreme, especially in hotspots where the land–atmosphere coupling is intensive. The drying trend of soil moisture will be much larger on the surface than in middle and deep layers in the future, and this phenomenon will be more severe under the high-emission scenario. It may be affected by increased evaporation and the effect of carbon dioxide fertilization caused by global warming.
Introduction
As an essential parameter of the land surface process and the climate system, soil moisture affects surface air temperature, atmospheric humidity, precipitation, stability of the atmospheric boundary layer, and atmospheric circulation by influencing the surface evapotranspiration, surface albedo, soil heat capacity, and vegetation growth conditions (Delworth and Manabe, 1988; Zuo and Zhang, 2016; Liu et al., 2017). Furthermore, soil moisture plays an important role in the energy, water, and biochemical cycles in the climate system (Sellers et al., 1997; Seneviratne et al., 2010; Zhang et al., 2016). Zhang and Zuo (2011) found that spring soil moisture significantly impacts the East Asian summer monsoon and the precipitation in East China by changing the surface thermal conditions. The abnormal soil moisture affects evaporation and temperature, causing an anomalous land–sea temperature difference, that affecting the East Asian summer monsoon circulation. Berg et al. (2017) indicated that soil moisture is essential for the mean circulation and precipitation of the West African monsoon. On the one hand, anomalous soil moisture changes evaporation and transpiration, resulting in anomalous land–ocean thermal contrast. On the other hand, the anomaly of surface evaporation changes the meridional temperature gradients and causes large-scale circulation changes, affecting West African monsoon circulation and precipitation.
With global warming, the land–atmosphere coupling is strengthened, reinforcing the influence of soil moisture on the land surface process and climate change (Zhang et al., 2011; Vogel et al., 2017; Zhou et al., 2019a). Seneviratne et al. (2006) reported that the feedback of summer soil moisture on the atmosphere would increase the temperature and climate variability in Eastern and Central Europe. With the increase of greenhouse gases concentrations, this region will become a new land–atmosphere coupling hotspot. Through the land–atmosphere interaction experiment, Berg et al. (2014) suggested that soil moisture is crucial for the coupling of land surface and atmosphere. Soil moisture controls the partitioning of available energy between the sensible and latent heat flux, which makes the soil moisture dynamics enhance temperature uncertainty over the hotspots of land–atmosphere coupling. Li et al. (2019) used the CCSM-WRF model to study the temperature variation in summer over East Asia and proposed that the feedback of soil moisture caused the mean temperature in summer to increase by 0.15°C, with key regions appearing over the northern Tibetan Plateau, the Sichuan Basin, and the middle and lower reaches of the Yangtze River during 2071–2100 under the RCP8.5 scenario.
In recent decades, based on satellites, observations, and model simulations, soil moisture has become drier in many regions. Dorigo et al. (2012) used a multi-satellite surface soil moisture dataset and found the subtle drying trends in the southern United States, central South America, central Eurasia, northern Africa and the Middle East, Mongolia and northeastern China, northern Siberia, and Western Australia. The result is also confirmed in GLDAS and ERA-Interim datasets. Zhou et al. (2019a) used the Coupled Model Intercomparison Project phase 5 (CMIP5) models and deduced that the land–atmosphere feedback greatly exacerbated the concurrent soil and atmospheric drought. The frequency and intensity of both soil drought and atmospheric aridity enhanced by land–atmosphere feedback are projected to increase in the 21st century.
With soil moisture drying, soil moisture and temperature interaction have increased and intensified extreme high temperature and heatwave events. Liu et al. (2020) analyzed the mechanism of heatwave in Europe and concluded that although heatwaves are initially triggered by abnormal atmospheric circulation, the strong coupling between soil moisture and temperature further strengthened the heatwaves. Meanwhile, land cover plays a key role in determining the occurrence and intensity of coupling between soil moisture and temperature. Based on the reconstruction of tree rings for the past 260 years, Zhang et al. (2020) revealed an abrupt shift to hotter and drier climate over inland East Asia. Persistent soil moisture deficit enhances land–atmosphere coupling, which intensifies land surface warming and soil moisture drying.
In summary, the soil moisture variation in summer, especially in hotspots of land–atmosphere coupling, has a great impact on climate change and extreme climate events, and its relevant feedbacks (e.g., soil moisture–temperature and soil moisture–precipitation) are prerequisite for reproducing historical trends and ensuring fitness for future projections. Therefore, the detection and attribution of soil moisture variation are essential and urgent. At present, the analysis of soil moisture variation tends to focus on precipitation, temperature, and atmospheric circulation (Zuo and Zhang, 2007; Meng and Quiring, 2010; Wei et al., 2016). Cheng et al. (2015) concluded that the soil moisture in East Asia showed a drying trend through the GLDAS dataset, which is significant in northeast China, north China, Mongolia, and Russia near Lake Baikal. The drying trend of soil moisture is mainly driven by the decreasing precipitation and is enhanced almost twofold by increasing temperatures. Chen et al. (2016) detected a significant decreased trend in surface soil moisture in eastern China by the satellite product and attributed the decreasing trend to precipitation/potential evapotranspiration. However, few studies have detected and attributed the effects of external forcings on soil moisture variation. Coupled Model Intercomparison Project phase 6 (CMIP6) is initiated and organized by the World Climate Research Program Coupling Simulation Working Group. CMIP6 provides climate simulation data to the global science community by designing the standards of climate model experiments and setting the shared data format (Eyring et al., 2016; Zhou et al., 2019b). CMIP6 contains many well-designed experiments, and most of the climate models participate in the experiments designed by CMIP6. Therefore, this study used the CMIP6 model experiments to detect and attribute the external forcings on soil moisture variation in summer, and to analyze the future changes of soil moisture under different emission scenarios. This study will provide a more profound understanding for the anthropogenic effects on soil moisture variation. Data, models, and methods are explained in Data and Methods; results and analysis are provided in Results; the discussion and summary are presented in Discussion and Summary.
Data and Methods
Data
Reanalysis datasets are selected to replace observation data in the analysis of soil moisture attribution because soil moisture lacks long time period and spatially continuous observation data. European Centre for Medium-Range Weather Forecasts Reanalysis v5 (ERA5) and Global Land Data Assimilation System Noah 2.0 (GLDAS-Noah 2.0) reanalysis datasets are selected for this study, and experts have widely recognized them in previous studies (Bi et al., 2016; Cheng et al., 2019; Deng et al., 2020). ERA5 derives from the European Centre for Medium-Range Weather Forecasts, and incorporates soil moisture data from in situ observations of the global SYNOP network and satellite remote sensing data (Hersbach et al., 2020). The spatial resolution of ERA5 is 0.25°*0.25°, and the soil is divided into four vertical layers, with the ranges of 0–7, 7–28, 28–100, and 100–289 cm. GLDAS-Noah 2.0 derives from the National Aeronautics and Space Administration; it is based on the satellite and observation data and uses the offline land surface model of NOAH to provide output using land surface variables. The spatial resolution of GLDAS is 0.25° *0.25°, and the soil is divided into four vertical layers, with the ranges of 0–10, 10–40, 40–100, and 100–200 cm.
In order to analyze the detection and attribution of global soil moisture variation in summer, all forcing simulation (historical) experiment, detection and attribution experiment, preindustrial control (CTRL) experiment, land use experiment, and scenario experiment in CMIP6 models are used. The selected soil moisture variables are moisture in the upper portion of the soil column (mrsos) and total water content of the soil layer (mrsol). The purpose of the historical experiment is to reproduce the simulation of historical climate changes since 1850. The purpose of the detection and attribution experiment is to evaluate the impact on the climate by only considering specific external forcings. The experiments considering greenhouse gases (GHG), anthropogenic aerosols (AA), and natural forcing are selected in the detection and attribution experiment. In order to obtain the impact of land use (LU) forcing on the climate, the difference between historical and hist-noLu experiments (a model experiment to keep land use at the preindustrial level in 1850) is calculated. The CTRL experiment, also known as the preindustrial reference experiment, is the result of setting the external forcings before the industrial revolution in 1850. The CTRL experiment mainly reflects the internal variability of the climate. The scenario experiment reflects future climate (2015–2100) under different shared socioeconomic pathways (SSP). SSP1-2.6, SSP2-4.5, and SSP5-8.5 are selected as low-, medium-, and high-emission scenarios, respectively, to evaluate soil moisture variation in the future. Monthly summer data from 1979 to 2014 are selected for soil moisture detection and attribution. June, July, and August are regarded as summer in the Northern Hemisphere, while December, January, and February are regarded as summer in the Southern Hemisphere. The CMIP6 models, the number of model members, and the spatial resolution of model in this study are shown in Tables 1, 2, 3.
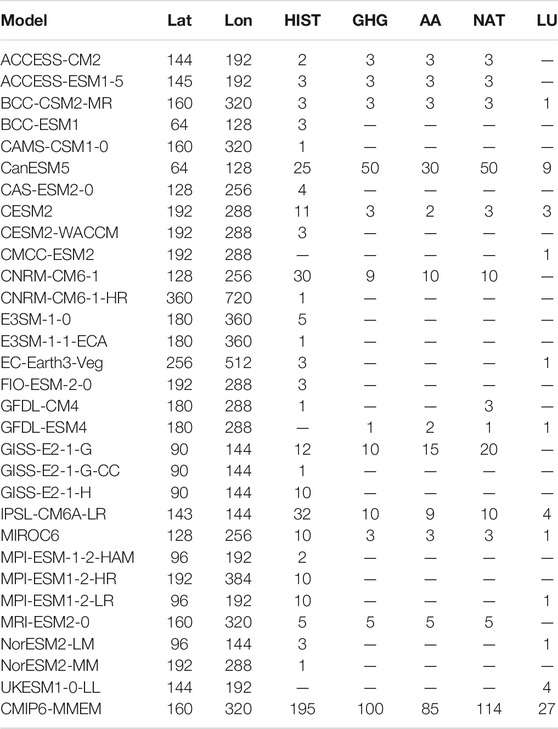
TABLE 1. CMIP6 models (first column), latitude grid points (second column), longitude grid points (third column), and number of mrsos (moisture in the upper portion of the soil column) members (fourth and after column) in different experiments. HIST is all forcing simulation experiment—GHG, AA, NAT, and LU—is only considering greenhouse gases, anthropogenic aerosols, natural, and land use forcing experiment, respectively.
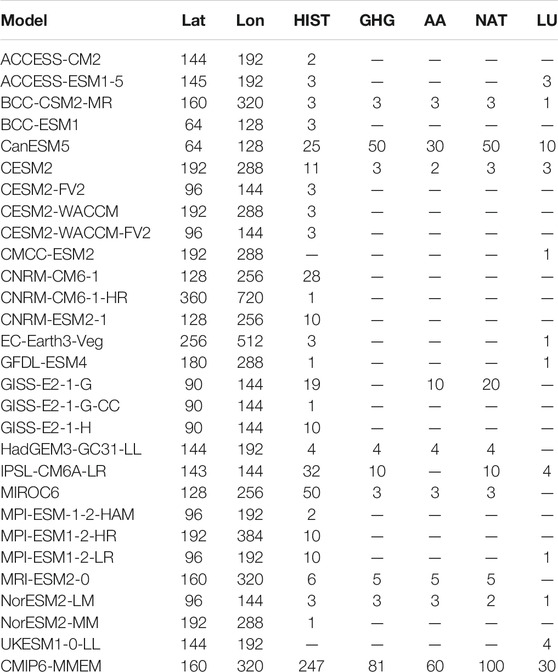
TABLE 2. Same as Table 1, but for mrsol (total water content of the soil layer).
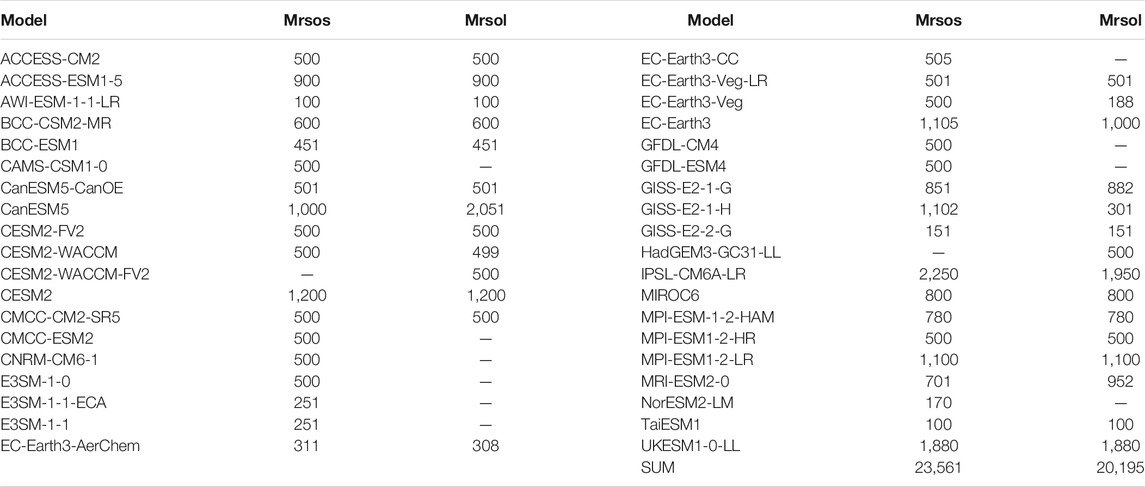
TABLE 3. List of CMIP6 pi-control experiment used to estimate internal climate variability in this research. The first and fourth columns include model names, the second and fifth columns include the total years of mrsos (moisture in the upper portion of the soil column) in pi-control experiment, and the third and sixth columns include the total years of mrsol (total water content of the soil layer) in pi-control experiment.
The depths of soil layer that most datasets have are chosen under the premise of considering the physical meaning in order to unify the thickness of the soil layers in different models and reanalysis datasets. Three depths of 10 cm, 100 cm, and 200 cm are selected as shallow, middle, and deep layers, respectively. The shallow soil moisture (10 cm) directly affects evaporation, so it is the most direct and essential part of the land surface process. Middle soil moisture (100 cm) is often the depth where plant roots are concentrated, and vegetation cover plays a significant role in land–atmosphere interaction and ecology. For the deep layer (200 cm), all models and reanalysis datasets have reached a depth of at least 200 cm. Meanwhile, the deeper the layer, the more genuine the reflection of soil moisture memory and soil hydrological processes (Hagemann and Stacke, 2015). The linear difference method (Liu et al., 2014; Zhang et al., 2018) is used to unify the datasets with inconsistent thickness, and the unit is uniformly converted into kg/m2.
Methods
For trend analysis, the least square method of linear regression is used to analyze soil moisture variation. In the attribution of soil moisture variation, the spatial distribution of soil moisture trends shows that separately considering GHG forcing, AA forcing, natural forcing, and LU forcing are used for analysis. The multi-model ensemble mean (MMEM) is used to express the results of the CMIP6 model simulation, which can reduce the uncertainty caused by the initial disturbance and the model difference.
The optimal fingerprint is a method to detect the attribution of external forcing signals to climate change by eliminating internal climate variability noise. Many experts have adopted the optimal fingerprint method to realize the attribution analysis of climate change (Hegerl et al., 1997; Allen and Stott, 2003; Sun et al., 2014). In this study, the optimal fingerprint method of total least squares generalized regression is used to detect the attribution of soil moisture variation. This method splits the observations (y) into the external forcings (X) as “signals” and the internal climate variability (ε) as “noise”: y = Xβ+ε. In the formula, β is the scaling factor of the external forcing, and X comes from CMIP6 detection and attribution experiments. If the scaling factor is significantly greater than zero (the lower limit of the 90% confidence interval of the scaling factor is greater than zero), it means that the response of the external forcing can be detected in the observation. If the scaling factor is greater than (less than) 1, then the external forcing is considered to underestimate (overestimate) the observed response.
1979 to 2014 (36 years in total) is divided into six segments of the same length (6 consecutive years). The mean value during the 6 year period will reduce the variability and noise in the signal and observation. The internal climate variability is obtained from CTRL experiment. A total of 23,561 years of CTRL experiment from 36 climate models of mrsos are divided into non-overlapping consecutive 36 years, with a total of 626 segments. Furthermore, a total of 20,195 years of CTRL experiment from 28 climate models of mrsol are divided into non-overlapping consecutive 36 years, with a total of 538 segments. The specific models of CTRL experiment are shown in Table 3. The segments of internal climate variability are divided into two groups with same numbers. One group is used for the optimal fingerprint method, and another is used for the residual consistency test. The residual consistency test estimates whether the residual after removing the external forcing signal from the observation is consistent with the internal climate variability (Allen and Tett, 1999; Allen and Stott, 2003). This study uses one signal to separately detect whether external forcings are included in soil moisture variation.
Results
The trends (1979–2014) of shallow, middle, and deep soil moisture of three datasets of ERA5, GLDAS, and CMIP6-MMEM, respectively, in summer are compared (Figure 1). The results show that global soil moisture is mainly a drying trend in summer, and the extent of the drying region is more prominent in CMIP6-MMEM than in ERA5 and GLDAS. This result is similar to Cheng and Huang (2016) viewpoint. They reported that global soil moisture is dominated by negative trends, especially in transitional regions between dry and wet climates. Affected by the range of soil moisture values at different depths, the drying trend of shallow soil moisture is the weakest, followed by the middle soil moisture, and the trend of deep soil moisture being the largest. For the same dataset, the spatial distribution of soil moisture trend at different depths is consistent, indicating that the soil moisture of each layer changes together. In general, the three datasets have consistent trends in most regions. For example, the soil moisture exhibits the drying trend in southwestern North America, eastern South America, Europe, mid-latitudes of East Asia, and the Indo-China Peninsula. Meanwhile, soil moisture exhibits the wetting trend in the Indian subcontinent and Sahel. However, in some small regions, the soil moisture trend is not consistent in different datasets. For instance, in northern North America and southern Africa, soil moisture exhibits mainly the wetting trend in reanalysis datasets, while CMIP6-MMEM exhibits mainly the drying trend, and in Central Africa, soil moisture exhibits mainly the drying trend in ERA5, while GLDAS and CMIP6-MMEM exhibit mainly the wetting trend. The trend of the reanalysis datasets is greater than that of CMIP6-MMEM, which is mainly affected by the MMEM method averaging multiple members and models. Because soil moisture is an unconventional observation element, there are some divergences inevitably among different datasets. These divergences are often influenced by land surface models on hydrological process simulation (Zampieri et al., 2012; Clark et al., 2015). However, the soil moisture trend of selected reanalysis datasets and CMIP6-MMEM is consistent in most regions.
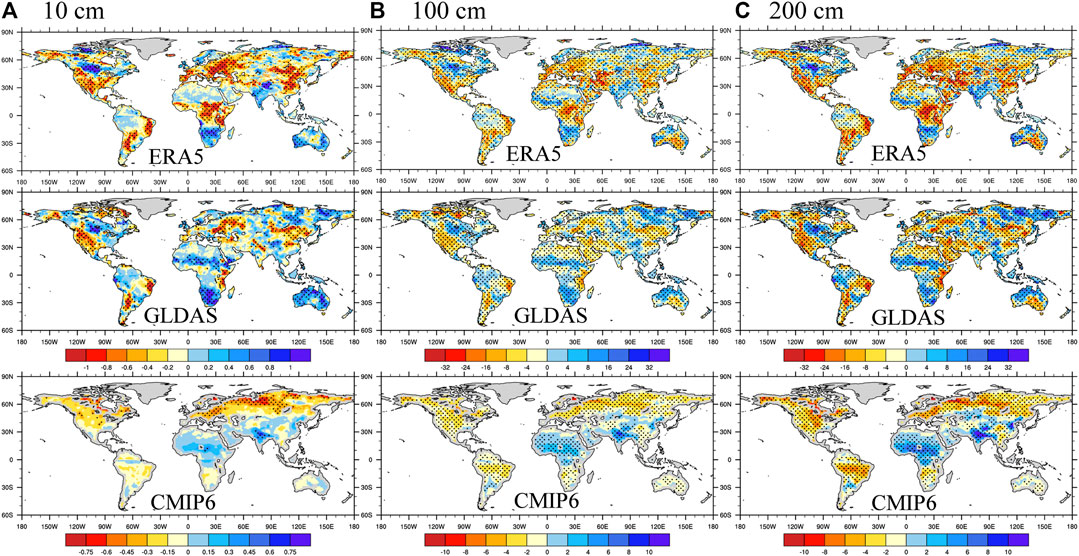
FIGURE 1. Spatial distribution of the soil moisture trend (kg/m2/decade, 1979–2014) in different datasets in summer (the Northern Hemisphere is averaged in June, July, and August, and the Southern Hemisphere is averaged in December, January, and February). (A), (B), and (C) Shallow (10 cm), middle (100 cm), and deep (200 cm) soil moisture, respectively. Black dots indicate where a given area passes the 90% significance test.
In order to evaluate the stability of climatological soil moisture in summer, the spatial distribution of the standard deviation (1979–2014) of soil moisture in summer is analyzed (Figure 2). The standard deviation of soil moisture is generally tiny in extremely arid and humid regions, such as the Sahara Desert, West Asia, Amazon rainforest, and mid-latitudes of East Asia. For extremely arid regions, due to the slight rainfall, the land surface is in a state of drought for a long time, and the variability of soil moisture is naturally tiny. There is much precipitation in summer and the surface water is sufficient for the humid area, so the soil moisture is usually saturated. Regions with high standard deviations are mainly in Europe, mid-latitude of Asia, central South America, eastern North America, Indian subcontinent, Sahel, and southern Africa. These regions are often located in transition zones between humid and arid regions, or regions where rainy and dry seasons occur alternatively, which makes the soil moisture variability relatively large.
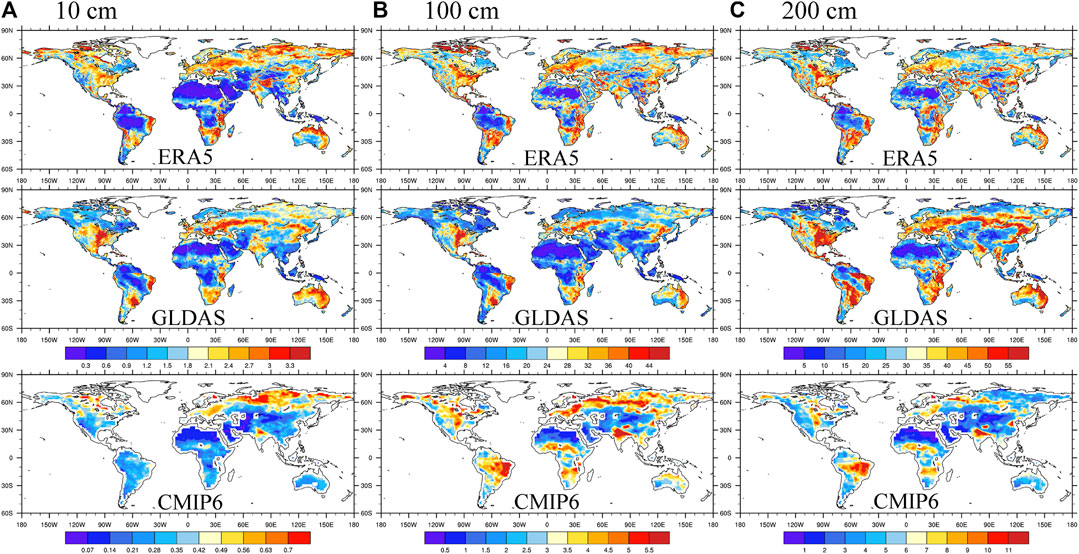
FIGURE 2. Same as Figure 1, but for standard deviation (kg/m2) of soil moisture.
The regions where soil moisture has the most significant impact on land–atmosphere interaction are generally located in the dry–wet transition regions. Soil moisture is high in humid regions, which have enough water on the surface to evaporate so that evaporation is not affected by soil moisture, but mainly affected by energy in humid regions. However, soil moisture in arid areas is too low to meet the demand for evaporation. In the dry–wet transition regions, soil moisture plays a decisive role in evaporation, which in turn affects the energy distribution of surface net radiation between sensible and latent heat flux, affecting the energy and water cycle between land and atmosphere. Therefore, when selecting the study regions, the hotspots of the land–atmosphere coupling in the dry–wet transition regions are taken as the primary study regions. When performing detection and attribution analysis, an essential prerequisite is whether the model can simulate the soil moisture variation. Therefore, based on the above analysis, the global average and five hotspots of land–atmosphere coupling with the same trend are selected to conduct the detection and attribution analysis of soil moisture in summer. The five regions are mid-latitudes of East Asia (M-EA: 40–55°N, 90–135°E), Europe (36–58°N, 0–40°E), Sahel (15–20°N, 18°W–38°E), Western North America (W-NA: 22–35°N, 98–118°E), and the Eastern South America (E-SA, 2–22°S, 35–60°W).
The global average and five selected hotspots of soil moisture time series are analyzed (Figure 3). Results show that the global average is the drying trend in the reanalysis datasets and CMIP6 models, and the drying trend is weaker than that of hotspots, which is mainly affected by the global average. The soil moisture is the drying trend in the M-EA, Europe, the W-NA, and the E-SA, and the trend is wetting only in Sahel. It is the same as previous results through the spatial trend distribution (Figure 1). The trends of shallow, middle, and deep soil moisture in global average and selected hotspots are consistent with different reanalysis datasets and CMIP6 models, indicating that the CMIP6 models can simulate the soil moisture trend well in these regions, which lays the foundation for the subsequent detection and attribution of soil moisture variation. Comparing the time series of different regions, soil moisture in Europe has the most remarkable drying trend, and the deep soil moisture of ERA5 reached 13.48 kg/m2/decade, followed by the W-NA and the E-SA.
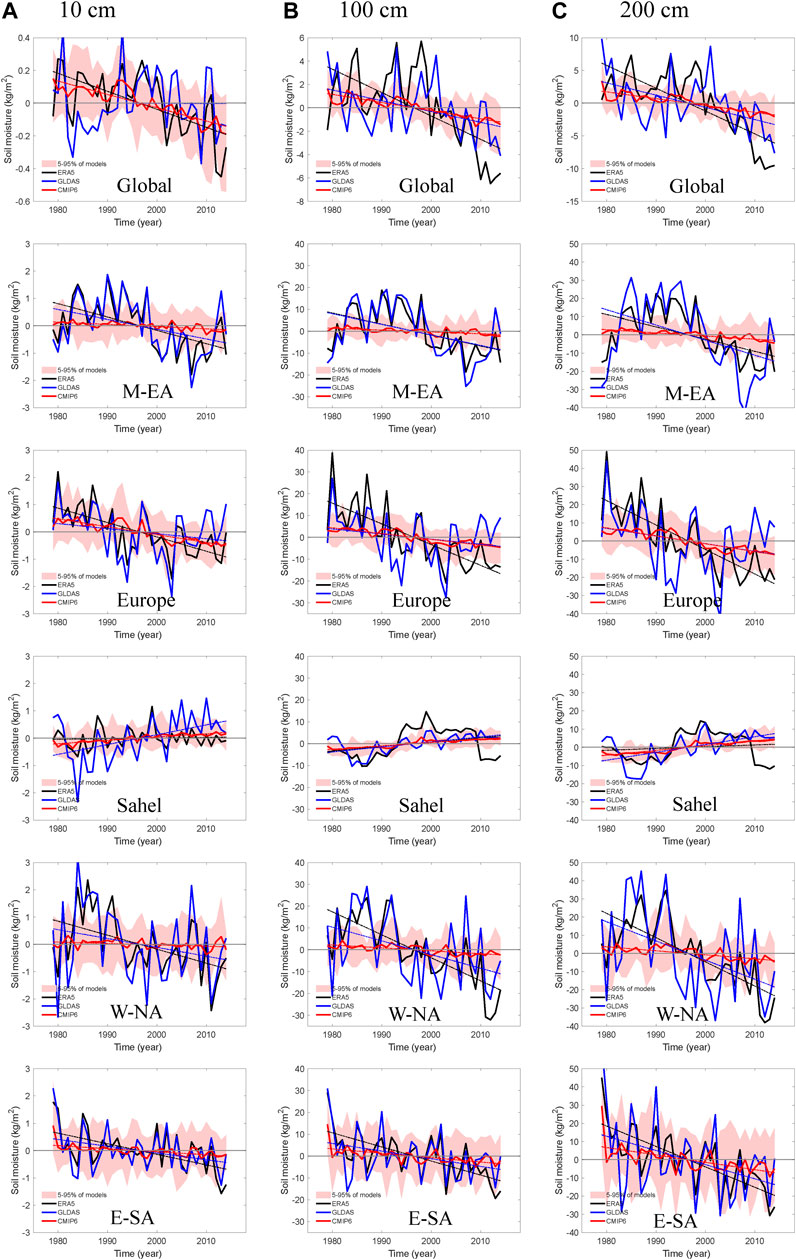
FIGURE 3. Time series of soil moisture (kg/m2, 1979–2014) in the global average and selected hotspots. The solid black line is ERA5, the solid blue line is GLDAS, the solid red line is CMIP6-MMEM, the corresponding dotted line is the trend line, and the pink shade is the range of 5–95% of all CMIP6 models. The M-EA is mid-latitudes of East Asia, the W-NA is Western North America, and the E-SA is Eastern South America.
The single forcing effect on the soil moisture trend is analyzed through the CMIP6 detection and attribution experiment, land use experiment, and historical experiment. Figure 4 shows the spatial distribution of shallow, middle, and deep soil moisture trends in summer considering only the GHG, AA, natural, and LU forcing, respectively. The trend of shallow soil moisture has only passed the significance test in a few regions, while the trends of middle and deep soil moisture have passed the significance test in most regions; this may be due to the smaller value range of shallow soil moisture, which leads to the shallow soil moisture variation being smaller. On the whole, the spatial distribution of the soil moisture trend at different depths under every single forcing is basically the same, which means that the regional trend can extend from surface to deep layers. The GHG forcing makes the soil moisture significantly dry in high latitudes of the Northern Hemisphere, northern South America, and Western Europe. The wetting trend is relatively weaker than the drying trend, and the distribution range is small. The wetting trend mainly occurs in southern South America, central Africa, and parts of the mid-latitudes of Asia. The AA forcing causes a significant drying trend in Europe, high latitudes of Asia, and eastern South America. The soil moisture in middle and deep layers shows a strong drying trend, which is distributed in a belt around 60°N from Europe to East Asia. Meanwhile, soil moisture has a strong wetting trend in Sahel, Tibet Plateau, and Northeast China. The influence of natural forcing on soil moisture is generally weaker than that of other external forcings, but some regions in the middle and deep layers have passed the significance test. Under the LU forcing effect, the drying trend is most pronounced in Europe, and the wetting trend occurs in northeast China, the eastern Mongolian plateau, and the Indian subcontinent.
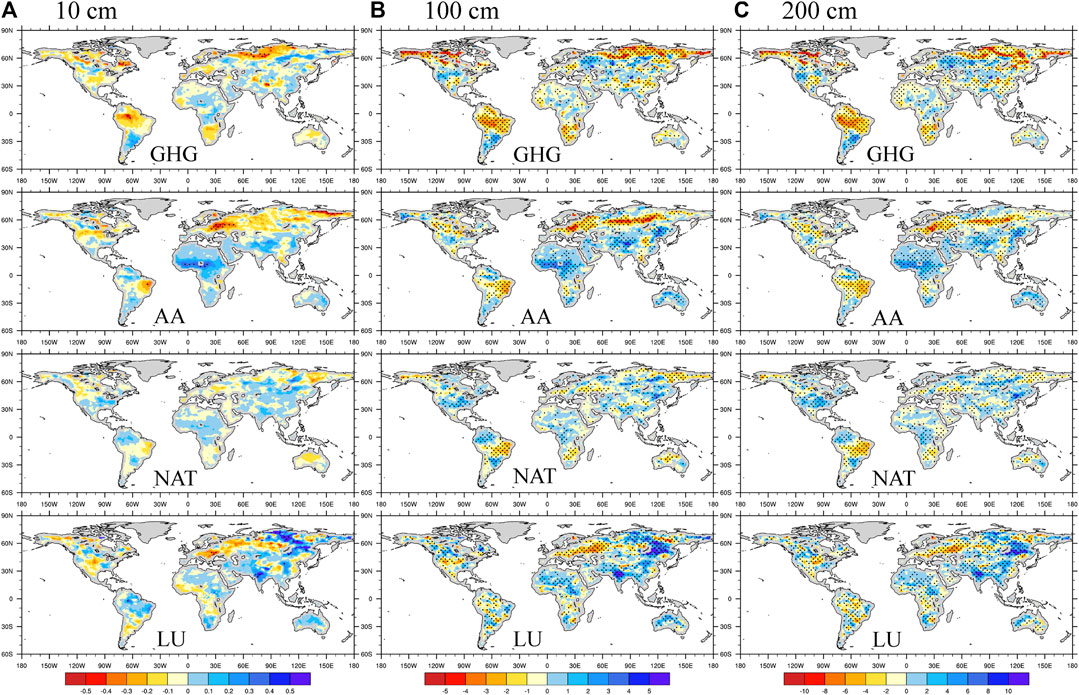
FIGURE 4. Spatial distribution of the soil moisture trend (kg/m2/decade, 1979–2014) from CMIP6 experiments (the experiment only considering greenhouse gases (GHG) forcing, the experiment only considering anthropogenic aerosols (AA) forcing, the experiment only considering natural (NAT) forcing, and the experiment only considering land use (LU) forcing). (A), (B), and (C) Shallow (10 cm), middle (100 cm), and deep (200 cm) soil moisture, respectively. Black dots indicate where a given area passes the 90% significance test.
Based on the external forcing experiment, the soil moisture trend is mainly affected by GHG, AA, and LU forcings, and the natural forcing effect is very small. The attribution characteristics of soil moisture variation are similar to the research results of Gu et al. (2019). They suggested that the anthropogenic climate change signal is detectable in global soil moisture drying. However, these external forcings do not produce a consistent global effect on soil moisture like surface air temperature (e.g., GHG forcing has a warming effect globally and AA forcing has a cooling effect in most parts of the world). The effects of external forcings on soil moisture have significant regional divergences. For instance, in the M-EA, the effect of GHG forcing is a drying trend, while the effect of AA and LU forcings is a wetting trend. In the E-SA, the GHG and AA forcings make soil moisture dry, while the LU forcing makes soil moisture wet. However, some regions have the same trend under different forcings. For example, in Western Europe, GHG, AA, natural, and LU forcings all make soil moisture dry, while it is opposite in Sahel.
Furthermore, the optimal fingerprint method is used to detect whether the external forcing signals are contained in the soil moisture variation. Figure 5 shows the scaling factors of different external forcings. Overall, scaling factors in some regions have a wide range of 90% confidence interval, which makes some forcing signals undetectable. At the same time, the wide range of confidence interval also indicates that the internal climate variability also plays a role in the soil moisture variation (Zhang et al., 2007; Zhou et al., 2020). On the global average, the signals of all forcings and GHG forcing can be detected in soil moisture variation of ERA5 and GLDAS at different depths, except in shallow soil moisture of GLDAS. The scaling factors of AA, natural, and LU forcings are too large or even negative, which indicates that these external forcings have little effect on soil moisture variation. In Europe, the signals of all forcings and AA forcing can basically be detected in ERA5 and GLDAS at different depths, but some lower limits of the 90% confidence interval of scaling factors are less than 0. Meanwhile, the signal of GHG can only be detected in the shallow soil moisture. In Sahel, all forcings and AA forcing signals can be detected in GLDAS, and LU forcing signals can also be detected in the middle and deep layers, but the scaling factor is large. Only the signals of all forcings and LU forcing on middle and deep soil moisture variation can be detected in ERA5. In the E-SA, except LU forcing, other forcing signals can be detected at different soil layers in ERA5 and GLDAS, but the confidence interval of some scaling factors contains the value of 0 in GLDAS. In the M-EA, the scaling factors of each forcing are either too large or less than 0, and it is hard to detect the impact on soil moisture variation. The detection of results by the optimal fingerprint method of the W-NA is similar to that of the M-EA. However, some forcing signals of deep soil moisture can be detected in the M-EA and the W-NA, but the scaling factors are too large. In the residual consistency test, the test result is obviously related to the regions. In the three regions of the M-EA, the W-NA, and Sahel, most of the forcing signals failed in the residual consistency test, and the detection results of the optimal fingerprint method are also poor in these three regions.
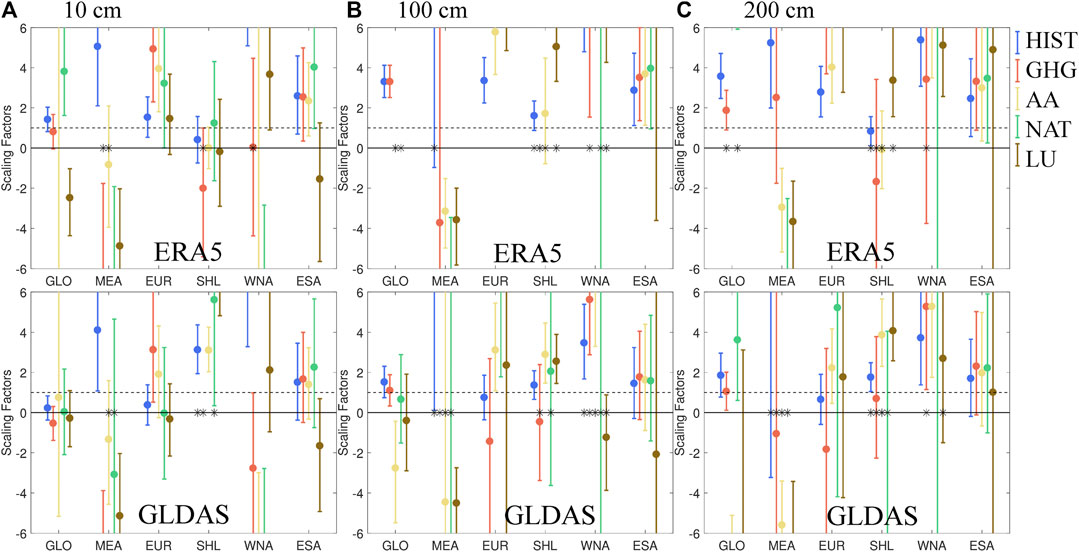
FIGURE 5. Scaling factors through the optimal fingerprint method over global average (GLO), mid-latitudes of East Asia (MEA), Europe (EUR), African Sahel (SHL), Western North America (WNA), and Eastern South America (ESA). The blue dot is the scaling factor of the all forcing (HIST) signal, the red dot is the scaling factor of the greenhouse gase (GHG) forcing signal, the yellow dot is the scaling factor of the anthropogenic aerosol (AA) forcing signal, the green dot is the scaling factor of the natural (NAT) forcing signal, and the brown dot is the scaling factor of the land use (LU) forcing signal. The corresponding extension line is the 90% confidence interval of the scaling factor. (A), (B), and (C) Shallow (10 cm), middle (100 cm), and deep (200 cm) soil moisture, respectively.
Based on the detection results of the optimal fingerprint method, some external forcing signals cannot be detected in some regions. On the one hand, it means that soil moisture variation is complicated, and the internal climate variability has a significant impact on soil moisture variation. On the other hand, this may be related to the shorter time period. However, it still confirms that GHG, AA, and LU forcings can be detected in some regions, and natural forcing plays a minor role in soil moisture variation.
According to the above analysis, anthropogenic forcings (GHG, AA, and LU) have a significant impact on soil moisture variation, especially in hotspots. Furthermore, through the CMIP6 scenario experiment, a low-emission scenario (SSP1-2.6), a medium-emission scenario (SSP2-4.5), and a high-emission scenario (SSP5-8.5) are selected to analyze the soil moisture variation in the future. Figure 6 shows the soil moisture time series of global and hotspots’ average in the past and different scenarios. Combined with Table 4, the global average and selected hotspots will become drier in the future except for Sahel. The soil moisture of Sahel shows a significant wetter tendency in the high-emission scenario, but soil moisture under low-emission and medium-emission scenarios almost has no trend. On global average, with the increase of anthropogenic emission, the drying trend of soil moisture will increase in all layers, and there are similar phenomena in the M-EA, Europe, the W-NA, and the E-SA. The above analysis shows that with the increase of anthropogenic emission, the trend of soil moisture will also increase (soil moisture in areas with drying trend will become drier and in areas with wetting trend will become wetter), which will exacerbate climate instability. In the first half of the 21st century, the divergences of soil moisture variation in different emission scenarios are not significant, but in the second half of the 21st century, the variation will increase among low-, medium-, and high-emission scenarios. The drying trends of shallow, middle, and deep soil moisture in Europe are the severest. Before 2040, the divergence among low-, medium-, and high-emission scenarios is minor, and then the divergence starts to increase, especially under the high-emission scenario. In the M-EA, the soil moisture almost has the same drying trend in the medium- and high-emission scenarios. Meanwhile, there is nearly no significant trend in the low-emission scenario, which indicates that the M-EA is more sensitive to anthropogenic emission, and the medium-emission can also cause a similar drying trend as the high-emission scenario. The W-NA has similar variation characteristics as that of the M-EA.
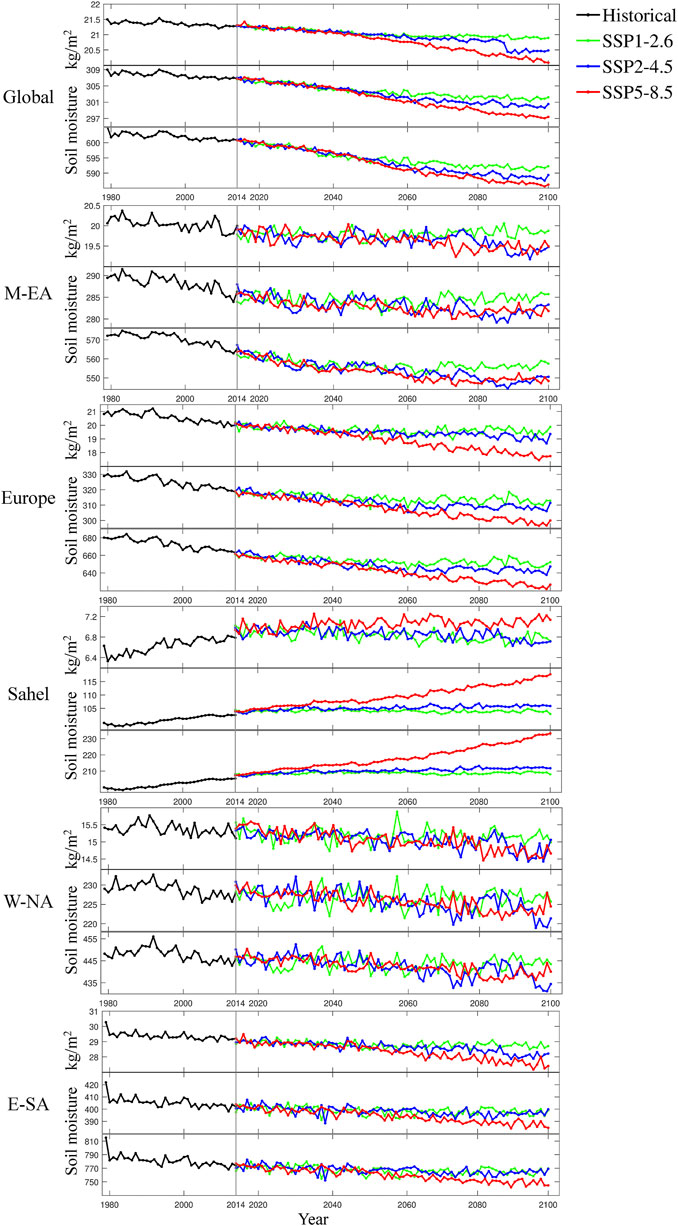
FIGURE 6. Time series of soil moisture (kg/m2) in the global average and selected hotspots in historical (black line, 1979–2014) and different emission scenarios [SSP1-2.6 (green line), SSP2-4.5 (blue line), and SSP5-8.5 (red line), 2015–2100]. The M-EA is mid-latitudes of East Asia, the W-NA is Western North America, and the E-SA is Eastern South America.
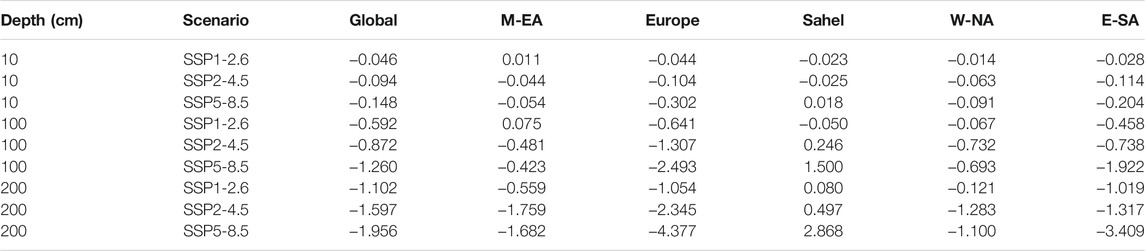
TABLE 4. Soil moisture trend (kg/m2/decade, 2015–2100) of global average and selected hotspots under different emission scenarios in the future. The M-EA is mid-latitudes of East Asia, the W-NA is Western North America, and the E-SA is Eastern South America.
Furthermore, the distribution of future changes of soil moisture is analyzed. Figure 7 shows the distribution of the ratio, which is calculated by dividing the difference between future (2081–2100) and historical (1995–2014) climatological soil moisture by historical climatology [the ratio = (future−historical)/historical]. Overall, soil moisture in most parts of the world has a drying trend under different future scenarios, but wetting trend mainly appears in Sahel and parts of mid-latitudes of Asia. This spatial pattern is basically consistent with the pattern caused by GHG forcing on soil moisture variation, which means that with the emission of GHG increase in the future, the GHG forcing effect on soil moisture will be more intense. In most regions, future soil moisture changes have such characteristics that as anthropogenic emission increases, the soil moisture trend will also increase (the regions with drying trend will be drier and the regions with wetting trend will be wetter). The results in the study of Joo et al. (2020) also confirmed this viewpoint. In addition to the hotspots analyzed above, the soil moisture changes in the Tibet Plateau, high latitudes of the Northern Hemisphere, northern South America, and northern North America are also very significant. It means that as anthropogenic emissions increase, soil moisture and climate anomalies will become more unstable and serious. In the regions with a drying trend, the trend of soil moisture in the surface layer is drier than that of middle and deep layers. On the contrary, the regions with a wetting trend of soil moisture will become wetter with the depth increase, and the space range with a wetting trend in the deep layer will expand. The reason for the severe drying trend of surface soil moisture is that the increased GHG concentration leads to global warming and evaporation increasing. The surface soil moisture is directly affected by the enhancement of evaporation, which makes the surface soil moisture drier. For the wetting trend in deep layers, due to the increase of carbon dioxide concentration on vegetation fertilization, water use efficiency of vegetation increases, leading to the root zone layer (middle and deep layers) becoming wetter (Mankin et al., 2017; Dai et al., 2018).
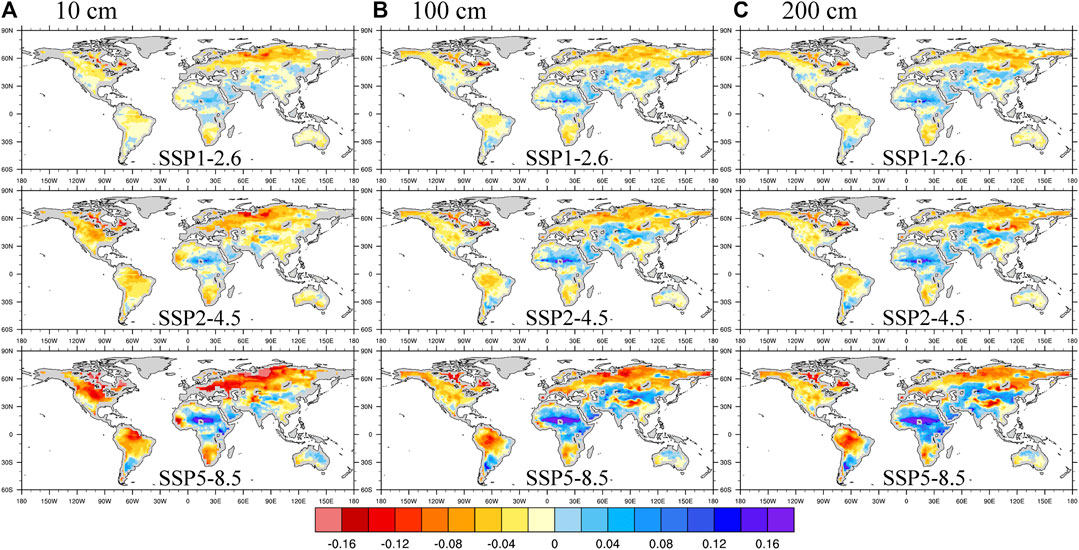
FIGURE 7. Distribution of the ratio of the difference of soil moisture (kg/m2) in different emission scenarios. The ratio of the difference between future (2081–2100) and historical (1995–2014) climatological soil moisture [the ratio = (future−historical)/historical]. (A), (B), and (C) Shallow (10 cm), middle (100 cm), and deep (200 cm) soil moisture, respectively.
Discussion and Summary
The reanalysis (ERA5 and GLDAS) and CMIP6 data are used in this study to detect and attribute global soil moisture variation in summer. Also, the soil moisture responses to different scenarios are analyzed. From a global perspective, soil moisture shows mainly a drying trend in most regions, and it will become much drier with the increase of anthropogenic emission in the future. The detection and attribution results show that the global drying trend is mainly affected by GHG forcing. In different datasets, soil moisture appears to exhibit consistently a drying trend in Europe, southwestern North America, eastern South America, mid-latitudes of East Asia, and the Indo-China Peninsula; however, Indian subcontinent and Sahel show a wetting trend.
In most parts of the world, the soil moisture variations in shallow, middle, and deep layers are consistent. In the regions with a drying trend, the surface layer will become drier than the middle and deep layers in the future, while in wetting regions, the deep soil moisture will become wetter than those of surface and middle layers, and this phenomenon will be more severe with the increase of anthropogenic emission. The surface layer will get when drier affected by the increased evaporation caused by global warming, and the wetting trend is being more severe in the deep layer, which is affected by the effect of carbon dioxide fertilization (Mankin et al., 2017; Dai et al., 2018).
Both the spatial distribution of the detection and attribution experiment, and the detection results of the optimal fingerprint method show that the soil moisture variation is mainly affected by anthropogenic forcings (GHG, AA, and LU), while natural forcing is relatively minor. Different external forcings have diverse influence on soil moisture variation in different regions. For example, all external forcings make soil moisture drier in Europe, while in the M-EA, AA and LU forcings show a wetting trend on soil moisture, and the GHG forcing shows a drying trend.
The variability of soil moisture in hotspots of land–atmosphere coupling is significant, and with the increase of anthropogenic emission, the soil moisture trend will be more extreme (the regions with drying trend will become drier and the regions with wetting trend will become wetter) in the future. Meanwhile, the divergence under different emission scenarios will be amplified in the second half of the 21st century. These characteristics of soil moisture variation will lead to more severe climate instability and being more prone to extreme climate events in the future.
Data Availability Statement
The original contributions presented in the study are included in the article/Supplementary Material; further inquiries can be directed to the corresponding author.
Author Contributions
ZZ and DX conceived and designed the research; LQ and LB processed the data; LQ analyzed the data and wrote the manuscript; and ZZ, DX, LQ, and LB reviewed the paper.
Funding
This work was supported by the National Key Research and Development Program (Grant No. 2016YFA0601502) and the National Natural Science Foundation of China (Grant Nos. 41822503, 41375092, and 42005056).
Conflict of Interest
The authors declare that the research was conducted in the absence of any commercial or financial relationships that could be construed as a potential conflict of interest.
Publisher’s Note
All claims expressed in this article are solely those of the authors and do not necessarily represent those of their affiliated organizations, or those of the publisher, the editors, and the reviewers. Any product that may be evaluated in this article, or claim that may be made by its manufacturer, is not guaranteed or endorsed by the publisher.
References
Allen, M. R., and Stott, P. A. (2003). Estimating Signal Amplitudes in Optimal Fingerprinting, Part I: Theory. Clim. Dyn. 21, 477–491. doi:10.1007/s00382-003-0313-9
Allen, M. R., and Tett, S. F. B. (1999). Checking for Model Consistency in Optimal Fingerprinting. Clim. Dyn. 15 (6), 419–434. doi:10.1007/s003820050291
Berg, A., Lintner, B. R., Findell, K. L., Malyshev, S., Loikith, P. C., and Gentine, P. (2014). Impact of Soil Moisture-Atmosphere Interactions on Surface Temperature Distribution. J. Clim. 27 (21), 7976–7993. doi:10.1175/jcli-d-13-00591.1
Berg, A., Sheffield, J., and Milly, P. C. D. (2017). Divergent Surface and Total Soil Moisture Projections under Global Warming. Geophys. Res. Lett. 44, 236–244. doi:10.1002/2016GL071921
Bi, H., Ma, J., Zheng, W., and Zeng, J. (2016). Comparison of Soil Moisture in GLDAS Model Simulations and In Situ Observations over the Tibetan Plateau. J. Geophys. Res. Atmos. 121, 2658–2678. doi:10.1002/2015JD024131
Chen, X., Su, Y., Liao, J., Shang, J., Dong, T., and Wang, C. (2016). Detecting Significant Decreasing Trends of Land Surface Soil Moisture in Eastern China during the Past Three Decades (1979–2010). J. Geophys. Res. Atmos. 121, 5177–5192. doi:10.1002/2015JD024676
Cheng, S., and Huang, J. (2016). Enhanced Soil Moisture Drying in Transitional Regions under a Warming Climate. J. Geophys. Res. Atmos. 121, 2542–2555. doi:10.1002/2015JD024559
Cheng, S., Guan, X., Huang, J., Ji, F., and Guo, R. (2015). Long-term Trend and Variability of Soil Moisture over East Asia. J. Geophys. Res. Atmos. 120, 8658–8670. doi:10.1002/2015JD023206
Cheng, M., Zhong, L., Ma, Y., Zou, M., Ge, N., Wang, X., et al. (2019). A Study on the Assessment of Multi-Source Satellite Soil Moisture Products and Reanalysis Data for the Tibetan Plateau. Remote Sens. 11, 1196. doi:10.3390/rs11101196
Clark, M. P., Fan, Y., Lawrence, D. M., Adam, J. C., Bolster, D., Gochis, D. J., et al. (2015). Improving the Representation of Hydrologic Processes in Earth System Models. Water Resour. Res. 51, 5929–5956. doi:10.1002/2015WR017096
Dai, A., Zhao, T., and Chen, J. (2018). Climate Change and Drought: a Precipitation and Evaporation Perspective. Curr. Clim. Change Rep. 4, 301–312. doi:10.1007/s40641-018-0101-6
Delworth, T. L., and Manabe, S. (1988). The Influence of Potential Evaporation on the Variabilities of Simulated Soil Wetness and Climate. J. Clim. 1 (5), 523–547. doi:10.1175/1520-0442(1988)001<0523:tiopeo>2.0.co;2
Deng, M., Meng, X., Li, Z., Lyv, Y., Lei, H., Zhao, L., et al. (2020). Responses of Soil Moisture to Regional Climate Change over the Three Rivers Source Region on the Tibetan Plateau. Int. J. Climatol. 40, 2403–2417. doi:10.1002/joc.6341
Dorigo, W., de Jeu, R., Chung, D., Parinussa, R., Liu, Y., Wagner, W., et al. (2012). Evaluating Global Trends (1988–2010) in Harmonized Multi-Satellite Surface Soil Moisture. Geophys. Res. Lett. 39, L18405. doi:10.1029/2012GL052988
Eyring, V., Bony, S., Meehl, G., Seniror, C., Stevens, B., Stouffer, R., et al. (2016). Overview of the Coupled Model Intercomparison Project Phase 6 (Cmip6) Experimental Design and Organization. Geosci. Model. Dev. 9, 1937–2016. doi:10.5194/gmd-9-1937-2016
Gu, X., Zhang, Q., Li, J., Singh, V. P., Liu, J., Sun, P., et al. (2019). Attribution of Global Soil Moisture Drying to Human Activities: A Quantitative Viewpoint. Geophys. Res. Lett. 46, 2573–2582. doi:10.1029/2018GL080768
Hagemann, S., and Stacke, T. (2015). Impact of the Soil Hydrology Scheme on Simulated Soil Moisture Memory. Clim. Dyn. 44, 1731–1750. doi:10.1007/s00382-014-2221-6
Hegerl, G. C., Hasselmann, K., Cubasch, U., Mitchell, J., Roeckner, E., Voes, R., et al. (1997). Multi-fingerprint Detection and Attribution Analysis of Greenhouse Gas, Greenhouse Gas-Plus-Aerosol and Solar Forced Climate Change. Clim. Dyn. 13, 613–634. doi:10.1007/s003820050186
Hersbach, H., Bell, B., Berrisford, P., Hirahara, S., Horanyi, A., Munoz-Sabater, J., et al. (2020). The ERA5 Global Reanalysis. Q. J. R. Meteorol. Soc. 146 (730), 1999–2049. doi:10.1002/qj.3803
Joo, J., Jeong, S., Zheng, C., Park, C., Park, H., and Kim, H. (2020). Emergence of Significant Soil Moisture Depletion in the Near Future. Environ. Res. Lett. 15 (12), 124048. doi:10.1088/1748-9326/abc6d2
Li, K., Zhang, J., Yang, K., and Wu, L. (2019). The Role of Soil Moisture Feedbacks in Future Summer Temperature Change over East Asia. J. Geophys. Res. Atmos. 124, 12034–12056. doi:10.1029/2018JD029670
Liu, L., Zhang, R., and Zuo, Z. (2014). Intercomparison of spring Soil Moisture Among Multiple Reanalysis Data Sets over Eastern China. J. Geophys. Res. Atmos. 119, 54–64. doi:10.1002/2013JD020940
Liu, L., Zhang, R., and Zuo, Z. (2017). Effect of Spring Precipitation on Summer Precipitation in Eastern China: Role of Soil Moisture. J. Clim. 30, 9183–9194. doi:10.1175/jcli-d-17-0028.1
Liu, X., He, B., Guo, L., Huang, L., and Chen, D. (2020). Similarities and Differences in the Mechanisms Causing the European Summer Heatwaves in 2003, 2010, and 2018. Earth's Future 8, e2019EF001386. doi:10.1029/2019EF001386
Mankin, J. S., Smerdon, J. E., Cook, B. I., Williams, A. P., and Seager, R. (2017). The Curious Case of Projected Twenty-First-Century Drying but Greening in the American West. J. Clim. 30 (21), 8689–8710. doi:10.1175/jcli-d-17-0213.1
Meng, L., and Quiring, S. M. (2010). Observational Relationship of Sea Surface Temperatures and Precedent Soil Moisture with Summer Precipitation in the U.S. Great Plains. Int. J. Climatol. 30, 884–893. doi:10.1002/joc.1941
Sellers, P. J., Dickinson, R. E., Randall, D. A., Betts, A. K., Hall, F. G., Berry, J., et al. (1997). Modeling the Exchanges of Energy, Water, and Carbon between Continents and the Atmosphere. Science 275 (5299), 502–509. doi:10.1126/science.275.5299.502
Seneviratne, S., Lüthi, D., Litschi, M., and Schar, C. (2006). Land–atmosphere Coupling and Climate Change in Europe. Nature 443, 205–209. doi:10.1038/nature05095
Seneviratne, S. I., Thierry, C., Edouard, L., Martin, H., Eric, B., Irene, L., et al. (2010). Investigating Soil Moisture–Climate Interactions in a Changing Climate: A Review. Earth Sci. Rev. 99 (3–4), 125–161. doi:10.1016/j.earscirev.2010.02.004
Sun, Y., Zhang, X., Zwiers, F. W., Song, L., Wan, H., Hu, T., et al. (2014). Rapid Increase in the Risk of Extreme Summer Heat in Eastern China. Nat. Clim. Change 4, 1082–1085. doi:10.1038/nclimate2410
Vogel, M. M., Orth, R., Cheruy, F., Hagemann, S., Lorenz, R., van den Hurk, , et al. (2017). Regional Amplification of Projected Changes in Extreme Temperatures Strongly Controlled by Soil Moisture-Temperature Feedbacks. Geophys. Res. Lett. 44, 1511–1519. doi:10.1002/2016GL071235
Wei, J., Su, H., and Yang, Z. L. (2016). Impact of Moisture Flux Convergence and Soil Moisture on Precipitation: a Case Study for the Southern United States with Implications for the globe. Clim. Dyn. 46, 467–481. doi:10.1007/s00382-015-2593-2
Zampieri, M., Serpetzoglou, E., Anagnostou, E. N., Nikolopoulos, E. I., and Papadopoulos, A. (2012). Improving the Representation of River–Groundwater Interactions in Land Surface Modeling at the Regional Scale: Observational Evidence and Parameterization Applied in the Community Land Model. J. Hydrol. 420–421, 72–86. doi:10.1016/j.jhydrol.2011.11.041
Zhang, R., and Zuo, Z. (2011). Impact of Spring Soil Moisture on Surface Energy Balance and Summer Monsoon Circulation over East Asia and Precipitation in East China. J. Clim. 24 (13), 3309–3322. doi:10.1175/2011jcli4084.1
Zhang, X., Zwiers, F., Hegerl, G., Lambert, F., Gillett, N., Solomon, S., et al. (2007). Detection of Human Influence on Twentieth-century Precipitation Trends. Nature 448, 461–465. doi:10.1038/nature06025
Zhang, J., Wu, L., and Dong, W. (2011). Land-atmosphere Coupling and Summer Climate Variability over East Asia. J. Geophys. Res. 116, D05117. doi:10.1029/2010JD014714
Zhang, R., Liu, L., and Zuo, Z. (2016). Variation of Soil Moisture over China and Their Influences on Chinese Climate. Chin. J. Nat. 38 (5), 313–319. doi:10.1007/978-981-10-2338-5_31
Zhang, G., Li, J., Rong, X., Xin, Y., Li, J., Chen, H., et al. (2018). An Assessment of CAMS-CSM in Simulating Land–Atmosphere Heat and Water Exchanges. J. Meteorol. Res. 32 (6), 862–880. doi:10.1007/s13351-018-8055-0
Zhang, P., Jeong, J. H., Yoon, J. H., Kim, H., Wang, S. Y., Linderholm, H. W., et al. (2020). Abrupt Shift to Hotter and Drier Climate over Inner East Asia beyond the Tipping point. Science 27, 1095–1099. doi:10.1126/science.abb3368
Zhou, S., Williams, A. P., Berg, A. M., Cook, B. I., Zhang, Y., Hagemann, S., et al. (2019a). Land–atmosphere Feedbacks Exacerbate Concurrent Soil Drought and Atmospheric Aridity. Proc. Natl. Acad. Sci. Sep. 116 (38), 18848–18853. doi:10.1073/pnas.1904955116
Zhou, T., Zou, L., and Chen, X. (2019b). Commentary on the Coupled Model Intercomparison Project Phase 6 (CMIP6). Clim. Change Res. 15 (5), 445–456. doi:10.12006/j.issn.1673-1719.2019.193
Zhou, T., Zhang, W., Zhang, L., Zhang, X., Qian, Y., Peng, D., et al. (2020). The Dynamic and Thermodynamic Processes Dominating the Reduction of Global Land Monsoon Precipitation Driven by Anthropogenic Aerosols Emission. Sci. China Earth Sci. 63, 919–933. doi:10.1007/s11430-019-9613-9
Zuo, Z., and Zhang, R. (2007). The spring Soil Moisture and the Summer Rainfall in Eastern China. Chin. Sci. Bull. 52, 3310–3312. doi:10.1007/s11434-007-0442-3
Keywords: detection and attribution, soil moisture, future scenario, drying trend, anthropogenic forcings
Citation: Qiao L, Zuo Z, Xiao D and Bu L (2021) Detection, Attribution, and Future Response of Global Soil Moisture in Summer. Front. Earth Sci. 9:745185. doi: 10.3389/feart.2021.745185
Received: 21 July 2021; Accepted: 14 September 2021;
Published: 19 October 2021.
Edited by:
Yulei Xie, Guangdong University of Technology, ChinaReviewed by:
Weili Duan, Xinjiang Institute of Ecology and Geography (CAS), ChinaLing Ji, Beijing Institute of Technology, China
Copyright © 2021 Qiao, Zuo, Xiao and Bu. This is an open-access article distributed under the terms of the Creative Commons Attribution License (CC BY). The use, distribution or reproduction in other forums is permitted, provided the original author(s) and the copyright owner(s) are credited and that the original publication in this journal is cited, in accordance with accepted academic practice. No use, distribution or reproduction is permitted which does not comply with these terms.
*Correspondence: Zhiyan Zuo, zuozhy@fudan.edu.cn