Thermokarst Landscape Development Detected by Multiple-Geospatial Data in Churapcha, Eastern Siberia
 Yoshihiro Iijima1*
  Takahiro Abe1
  Hitoshi Saito2
  Mathias Ulrich3
  Alexander N. Fedorov4,5
  Nikolay I. Basharin4
  Alexey N. Gorokhov5,6
  Victor S. Makarov4,6,7
- 1Graduate School of Bioresources, Mie University, Mie, Japan
- 2College of Economics, Kanto-Gakuin University, Kanagawa, Japan
- 3Institute for Geography, Leipzig University, Leipzig, Germany
- 4Melnikov Permafrost Institute, SBRAS, Yakutsk, Russia
- 5BEST International Centre, North-Eastern Federal University, Yakutsk, Russia
- 6Institute for Biological Problem in Cryolithozone, SBRAS, Yakutsk, Russia
- 7Scientific Research Institute of Applied Ecology of the North, M.K. Ammosov North-Eastern Federal University, Yakutsk, Russia
Thermokarst is a typical process that indicates widespread permafrost degradation in yedoma landscapes. The Lena-Aldan interfluvial area in Central Yakutia in eastern Siberia is now facing extensive landscape changes with surface subsidence due to thermokarst development during the past few decades. To clarify the spatial extent and rate of subsidence, multiple spatial datasets, including GIS and remote sensing observations, were used to analyze the Churapcha rural locality, which has a typical yedoma landscape in Central Yakutia. Land cover classification maps for 1945 and 2009 provide basic information on anthropogenic disturbance to the natural landscape of boreal forest and dry grassland. Interferometric synthetic aperture radar (InSAR) with ALOS-2/PALSAR-2 data revealed activated surface subsidence of 2 cm/yr in the disturbed area, comprising mainly abandoned agricultural fields. Remote sensing with an unmanned aerial system also provided high-resolution information on polygonal relief formed by thermokarst development at a disused airfield where InSAR analysis exhibited extensive subsidence. It is worth noting that some historically deforested areas have likely recovered to the original landscape without further thermokarst development. Spatial information on historical land-use change is helpful because most areas with thermokarst development correspond to locations where land was used by humans in the past. Going forward, the integrated analysis of geospatial information will be essential for assessing permafrost degradation.
Introduction
Permafrost landscapes in Central Yakutia (Eastern Siberia, Russia) are primarily sensitive to Arctic warming (Fedorov et al., 2014b; Miller et al., 2021; Overland and Wang, 2021). Very ice-rich permafrost deposits, such as the yedoma ice complex (Schirrmeister et al., 2013; Strauss et al., 2013; Strauss et al., 2017), are extensively distributed throughout this region. Ice wedges developed under the lacustrine environment in the Lena-Aldan interfluvial region during Pleistocene glacial periods (Bosikov 1991). The permafrost in Central Yakutia faces a risk of rapid, strong warming and thawing processes and thermal erosion. The thawing of ice-rich deposits leads to strong ground subsidence, namely “thermokarst” (Soloviev, 1959; Tarasenko, 2013; Ulrich et al., 2017; Ulrich et al., 2019), and landscape reorganization from flat boreal forest to a rugged open surface with ponding (Czudek and Demek, 1970; Bosikov, 1991).
In Central Yakutia, climate warming initiated extensive thawing and thermokarst processes during the Pleistocene-Holocene transition and the climatic optimum in the middle Holocene (7,000–4000 BP; Katamura et al., 2009; Ulrich et al., 2019). This old permafrost degradation turned into the present-day climax landscape known as an “alas” (Bosikov, 1991), comprising concave grassland with shallow lakes. The grassland in alases has historically been used for livelihood in Central Yakutia (Crate et al., 2017). Excavations of archaeological sites have shown traces of human habitation here for at least 5,000 years, and Tungusic linguistic groups (hunter-gatherers and reindeer herders) inhabited this region from the 11th to 13th centuries. In the 17th century, Central Yakutia belonged to Russia, and in the 20th century, agricultural land was expanded under the economic policy when it was part of the Soviet Union. During this period, the climate was colder on average and hydrological cyclical. Hence, thermokarst was unlikely to develop (Crate et al., 2017), and the natural landscape was relatively stable. With the collapse of the Soviet Union in the 1990s and related large-scale land use changes, the climate was also turned into a warming state (Fedorov et al., 2014b). In addition, increased precipitation was observed in the subsequent decade (after 2000), causing extensive forest degradation due to a warmed and saturated active layer under wet climate conditions (Iijima et al., 2014; Iijima et al., 2016). Both anthropogenic and natural environmental changes have contributed to the warming of permafrost with deepening of the active layer and melting of underground ice, which has led to subsequent land surface displacement by thermokarst. Changes in landforms and ecosystems due to thermokarst development have drastically changed Central Yakutia’s natural and social landscape. The changes of the last 2 decades are taking a heavy toll on cattle and horse farming, agricultural land use, and residential environments that were highly dependent on the local ecosystem (Crate et al., 2017; Takakura et al., 2021).
To evaluate landscape changes associated with permafrost degradation, it is necessary to detect topographic changes caused by thermokarst formation. To analyze surface subsidence accompanied by the very rapid formation of thermokarst over a few years, a spatial resolution of <1.0 m is needed. A limitation of detecting the spatial extent of thermokarst development is that the smallest topographical features are not fully seen in traditional remote sensing images only because of their relatively coarse spatial resolution. In recent years, high-resolution imaging by unmanned aerial systems (UASs) and commercial satellites taking multispectral images has become available. From these images, the distribution of thermokarst development can be obtained with much more precision (Saito et al., 2018). However, even with multiple years of fine-scale images, detecting the topographic subsidence rate is challenging.
The spatial extent of thermokarst development has been detected by combining temporal variation in satellite and aerial images with detailed field measurements as ground truth during the last 2 decades. Recently, a study with the results of a field survey showed that thawing subsidence of permafrost due to surface disturbance in the Alaskan North Slope could be determined using interferometric synthetic aperture radar (InSAR) and light detection and ranging techniques. These methods showed thermokarst development over the coastal tundra (Liu et al., 2015) and extensive areas affected by wildfires in Alaska (Iwahana et al., 2016), its temporal evolution with a resolution of a few centimeters, and its spatial distribution with a resolution of 10 m (Iwahana et al., 2016). Subsequent studies on the ground surface deformation of permafrost zones using SAR images and InSAR analysis have been reported for other permafrost zones (Antonova et al., 2018; Chen et al., 2018; Strozzi et al., 2018).
Combining this spatial information will make it possible to provide a more vivid picture of permafrost degradation based on those backgrounds. However, due to the lack of collaborative field studies and remote sensing analyses, consistent results regarding the relationship between the thermokarst subsidence rate and intensity of natural and social disturbances are still scarce for continuous permafrost zones, particularly in Central Yakutia. The purpose of this study is, thus, to combine multiple spatial data sets to clarify thermokarst development in very ice-rich Yedoma deposits of Central Yakutia.
Study Site
The present study targeted thermokarst landforms in the Churapcha locality on the right bank of the Lena River in Central Yakutia (Figure 1A). Dry grasslands and abandoned arable lands, which may be at risk of thermokarst development, are widely distributed around the settlement of Churapcha (Figure 1). The population of Churapcha has increased from 8,769 in 2010 to 10,202 in 2020 (SakhaSTAT, 2021). The recent population growth has caused settlement expansion in the town’s vicinity into the dry grasslands and abandoned arable lands. These sites were selected to assess thermokarst development associated with socially disturbed areas.
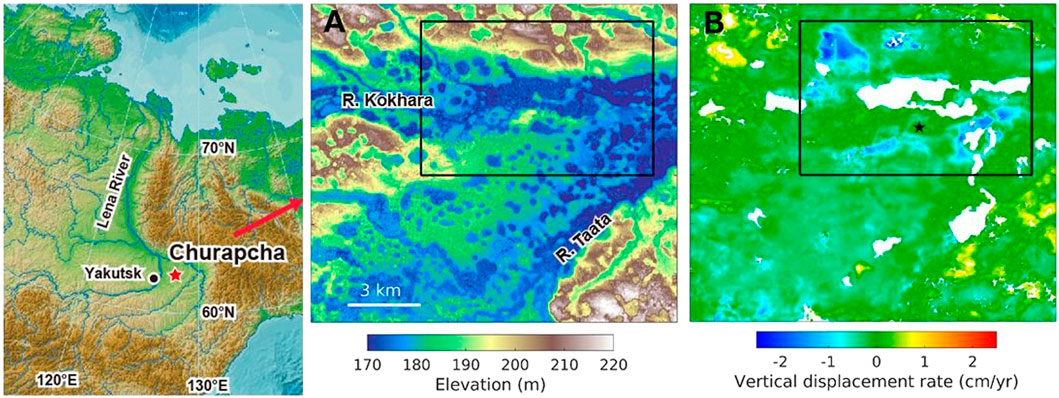
FIGURE 1. Study area: (A) Elevation around Churapcha. (B) Vertical displacement rate derived from ALOS-2 InSAR stacking. The black rectangle indicates the area shown in Figure 2. The black star in (B) indicates the location of the InSAR reference point.
Churapcha is located about 180 km east of Yakutsk on an almost flat surface of the Abrakh terrace at the top of the interfluve of the Taata and Kokhara Rivers at about 170–220 m asl (Figure 1A). The permafrost thickness is estimated at 540 m in Churapcha (Ivanov, 1984). Old alas depressions are widely distributed with a relative depth of about 7–8 m (Saito et al., 2018). The sediments of the ice complex contain syngenetic polygonal ice wedges up to 12–14 m in depth, which lie at a depth of 2.2–2.3 m below the surface. The width of the upper parts of the ice wedges varies from 1.5 to 3.0 m. The volumetric ice content (ice-wedge) in the upper part of the permafrost is approximately 17% at the disused airfield site and 25% in the abandoned arable land areas located south of the Churapcha locality, as estimated by the method of Gasanov (1969) and field measurements by the Melnikov Permafrost Institute.
The regional climate is extremely continental with a pronounced warming trend. Climatological data (1991–2020) from the Churapcha meteorological station show that the mean annual air temperature is −9.6°C, while monthly mean temperatures for January and July are −39.9°C and 19.3°C, respectively. The average yearly number of freezing days (mean daily air temperature below 0°C) is 109 days. The amount of precipitation is 257 mm/yr, with 185 mm occurring during the warm period (May to September). However, during 2005–2020, the mean annual air temperature increased to −8.9°C, and the total precipitation reached 275 mm/yr.
At the meteorological station, the mean annual ground temperature at a depth of 3.2 m was −2.1 ± 0.7°C for 1967–2014. Permafrost temperature was rather colder ranging from −3 to −6°C before the 1980s (Ivanov, 1984). Our recently ongoing monitoring sites in forest and meadow areas near Churapcha show soil temperature ranges from −2 to −3°C and −1.5 to −2°C, respectively, at 3.2 m depth. The active layer thickness was 1.3 and 2.0 m in September 2015 for the forests and meadows, respectively (Iijima et al., 2017). Increasing air temperatures and corresponding ground temperature rise have been observed in Central Yakutia since the early 1990s (Fedorov et al., 2014b). The increase in the active layer thickness in open areas has caused rapid thermokarst subsidence since the 1990s and enhancing after the 2000s (Fedorov and Konstantinov, 2003; Gavriliev and Ugarov, 2009).
Materials and Methods
SAR Data Processing
InSAR is a powerful tool for examining surface displacement using two SAR images acquired at different times with an accuracy of a few centimeters. InSAR is used for detecting surface deformation related to permafrost, such as the seasonal thaw/freeze cycle (e.g., Liu et al., 2010; Short et al., 2011), thermokarst (e.g., Liu et al., 2015; Antonova et al., 2018; Chen et al., 2018; Abe et al., 2020), and wildfires (Liu et al., 2014; Iwahana et al., 2016; Molan et al., 2018; Michaelides et al., 2019; Yanagiya and Furuya, 2020). To examine long-term displacement by thermokarst development, the L-band InSAR is more suitable than the C- and X-band InSAR for coherence (e.g., Strozzi et al., 2018; Abe et al., 2020; Yanagiya and Furuya, 2020).
In this study, L-band SAR data obtained by the PALSAR-2 instrument on the ALOS-2 satellite were processed using the GAMMA software (Wegmüller and Werner, 1997). ALOS-2 obtained six scenes of the stripmap mode 3 with 10-m resolution (path 124, frame 1,240, beam F2_5, Table 1) over Churapcha in 2015–2020. The off-nadir angle at the center of the SAR image is approximately 28 deg. Our InSAR processing procedures are the same as those of previous studies (Strozzi et al., 2018; Abe et al., 2020). We generated Single Look Complex (SLC) data from ALOS-2 Lv1.1 data. After performing co-registration between two SLC images, we reproduced interferograms and selected 11 of them. We excluded interferograms in which the image acquisition period of the pair was over 4 years apart or during the same year for the stacking analysis (Table 1). The topographically related phase was removed using ALOS World 3D -30 m- (AW3D30). The vertical accuracy of AW3D30 digital surface model is less than ca. 5 m. Goldstein–Werner’s adaptive spectral filter with an exponent of 0.7 was applied to smooth the signals (Goldstein and Werner, 1998), and phase unwrapping by minimum cost flow was performed (Costantini, 1998). The spatial resolution after terrain-corrected geocoding projected onto the UTM coordinate was set to 30 m. Finally, the line of sight (LOS, distance between satellite and ground) change detected by InSAR was converted to a vertical displacement by dividing it by the cosine of the incidence angle because vertical displacement is assumed to be dominant in thermokarst. The reference point in interferograms was set to an alas located in the southeast of Churapcha (Figure 1B). Alas is considered to be the climax geomorphological stage of thermokarst development (Bosikov 1991). Hence, we assumed that the bottom of an alas is less likely to be displaced inter-annually in comparison with inter-alas areas on ice-rich permafrost (Abe et al., 2020). In fact, the place of the alas bottom shows no polygonal terrain in the recent Worldview image (Supplementary Figure S1), and it is not a wetland landscape. Thus, the alas bottom is considered to be appropriate as a reference point as no further surface displacement is expected.
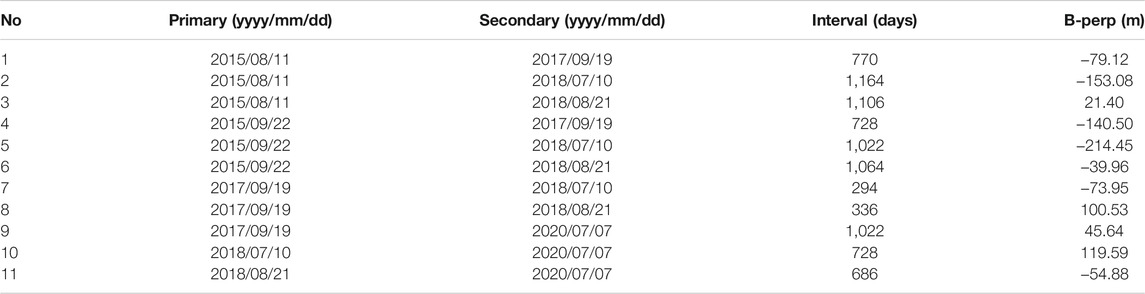
TABLE 1. Interferometric pairs used in this study. B-perp stands for the distance perpendicular to the line of sight between the positions of the satellite at different times.
Tropospheric and ionospheric disturbances contaminated each interferogram. These disturbances are sometimes interfered with to extract surface displacement. Regarding the tropospheric effect, the GACOS product was used to reduce its noise (Yu et al., 2017; Yu et al., 2018). The impacts of ionospheric disturbances are often shown as a linear long-wavelength trend. Our analysis area was spatially limited to ∼10 × 10 km and, we were able to model and subtract the trend by fitting a 2D linear function.
Finally, after generating and correcting interferograms, we performed a weighted stacking analysis for the number of days in the thawing season (from 1 June to 30 September) among the total number of days for the two images (Abe et al., 2020). This weighting reflects the actual period that contributes to the signals of surface subsidence rather than using the total number of days for the two images. The spatial resolution of the stacked interferograms was left at 30 m per pixel. Error analysis of the stacking result was conducted based on Equation 10 in Emardson et al. (2003), which is also used in Rouyet et al. (2019) and Abe et al. (2020). Used the eleven interferograms and error of each interferogram given as the variance of the phase, the 2σ error of the stacking result was estimated to be 0.26 cm/yr.
UAS Remote Sensing
Aerial images were obtained using a DJI Phantom 4 UAS with a digital camera (12.4 megapixels) at the disused airfield site near the settlement of Churapcha on September 14, 2016 and September 15, 2017 (Saito et al., 2018). Images were captured at an altitude of about 100 m above ground level, with an overlap of more than nine images. In total, 94 and 167 images were acquired for 2016 and 2017. We also measured ground control points (GCPs) with a global navigation satellite system receiver (Emlid Reach RTK). The geodetic data were processed based on the kinematic method using RTKLIB (ver. 2.4.3). The standard deviations of the GCP analysis were less than 0.01 m in total across three dimensions for the GCP measurements in 2017 (Saito et al., 2018).
The aerial images were processed using SfM-MVS (Structure from Motion-Multi View Stereo) photogrammetry software (Agisoft Metashape, Professional Edition). We obtained orthorectified images and digital surface models (DSMs). The residual errors (root-mean-squared error) at the GCPs were 16.5 cm in total across three dimensions for 2017. We co-registered the orthorectified images and DSMs for 2016 to those for 2017. The residual errors for 2016 were 7.8 cm. We then compared the images and DSMs to detect the differences in water area and topography.
Fine-Scale Satellite Images
We used additional optical satellite imagery taken in late summer to detect the initiation and development of high-centered polygonal relief and water bodies resulting from thermokarst processes in Churapcha. ALOS-PRISM took an image on September 15, 2007 in the panchromatic band with 2.5-m resolution. The WorldView series includes images taken on September 4, 2011, September 4, 2018, and August 27, 2019 by the panchromatic band with 0.5-m resolution.
GIS Data on Landscape Change
The land cover classification map of the area around Churapcha was compiled in a GIS format by Gorokhov et al. (2011). The first map in 1945 was initially drawn based on aerial photographic interpretation by Soloviev (1959). This first map was later became known to the world by Czudek and Demek (1970). Another map in 2009 was produced at a scale of 1:25,000 and is based on aerial photographs and satellite visible images (Terra/ASTER in 2007, IKONOS and GoeEys-1 in 2009). There are four terrain classes (alas, inter-alas, small valley, and lake) and sub-classification with 13 vegetation and anthropogenic landscape categories (Table 2).
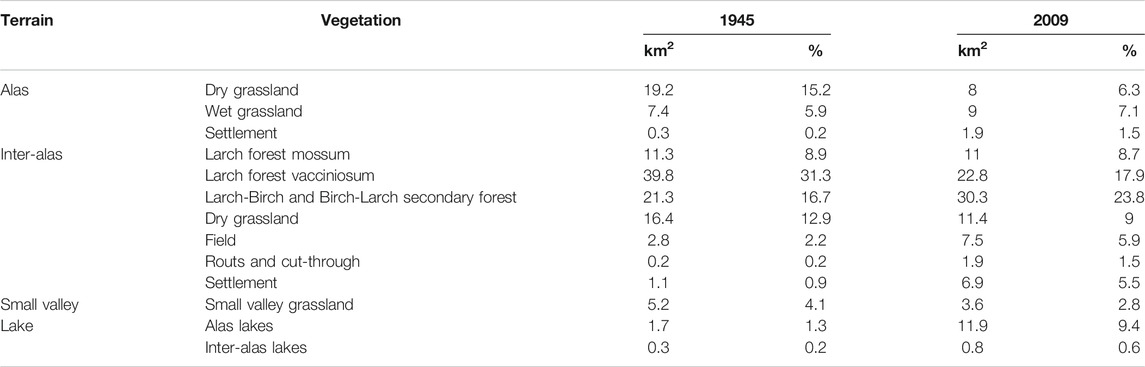
TABLE 2. Landscape characteristics of Churapcha in 1945 and 2009 (after Gorokhov et al., 2011). The targeted area is shown in Figures 2C,D.
Results
InSAR Stacking Result
Figure 1 shows the elevation and vertical displacement rate maps derived from AW3D30 and ALOS-2 InSAR stacking over an area of ∼10 × 10 km that includes Churapcha. The elevation ranges from 170 to 230 m. The north, west, and southeast area has a slightly higher elevation, while the Central part is relatively lower than the surrounding area (Figure 1A). The result of the stacked interferogram (Figure 1B) indicates clear signals of surface subsidence around Churapcha. The signs indicating the subsidence are also southwest of Churapcha.
In contrast, positive signals exist in the northwest and southeast Churapcha. The distribution of the positive signals mainly corresponds to the extent of the larch forest. Inter-annual surface uplift is unlikely to occur within a larch forest, and thus these signals are considered to be due to some tropospheric effects.
Figure 2 shows an enlarged view of the elevation and vertical displacement rate of the Churapcha settlement in Figure 1. There are some lakes in the central part of the area, and the elevation in the north is relatively higher than the other area (Figure 2A). The stacked interferogram shows that five significant signals of surface subsidence rate (areas T1-T5) were identified, up to 2.4 cm/yr (Figure 2B). Land classification by Gorokhov et al. (2011) shows that significant land classifications in 1945 were grassland, larch forest, and alases (Figure 2C). The classification in 2009 (Figure 2D) shows that the number of lakes has increased, and the residential area has expanded distinctly. Some portions of grassland and larch forest were cultivated and changed to agricultural fields. Compared with these changes, the identified surface subsidence signals are in agricultural fields (T1 and T2) and grassland (T3, T4, and T5). The displacement rate of areas T1 and T2 was larger than that of areas T3, T4, and T5. In contrast, no subsidence signals exist in the arable land area in the northeast of the study area (encircled and labeled with A in Figure 2B), which has the same elevation and land classification as T1 and T2.
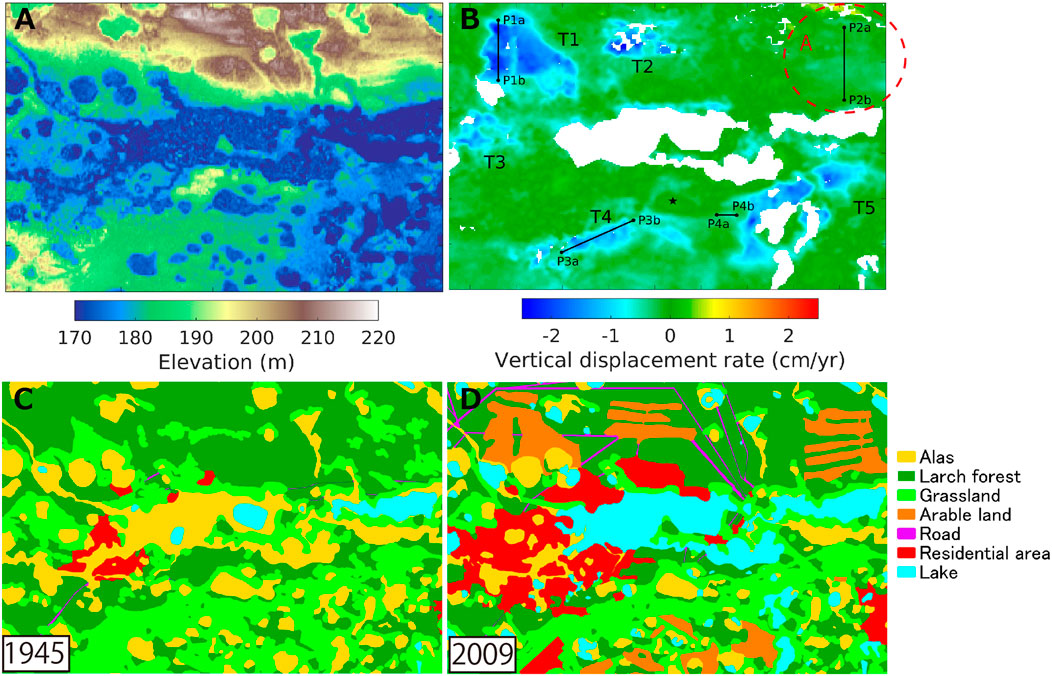
FIGURE 2. Enlarged view of (A) elevation and (B) vertical displacement rate in Churapcha. P1-P4 indicate transect lines showing profiles in Figure 3. The star indicates the location of the InSAR reference point. The red dotted oval labeled A indicates an area of arable land where surface subsidence was not detected. (C) and (D) indicate land classification in 1945 and 2009, partially modified from Gorokhov et al. (2011).
A comparison of the elevation and displacement rate along four transect lines (P1-P4) is shown in Figure 3. In particular, the transect lines of P1 and P2 (T1 and A, respectively) run along the north-south direction on south-facing slopes (Figures 3A,B). However, while both sites are located in abandoned agricultural fields on comparable elevations and relief positions on the Abrakh terrace, only T1 showed subsidence rates up to 2.4 cm/yr, but no displacement could be detected for A (Figures 3A,B).
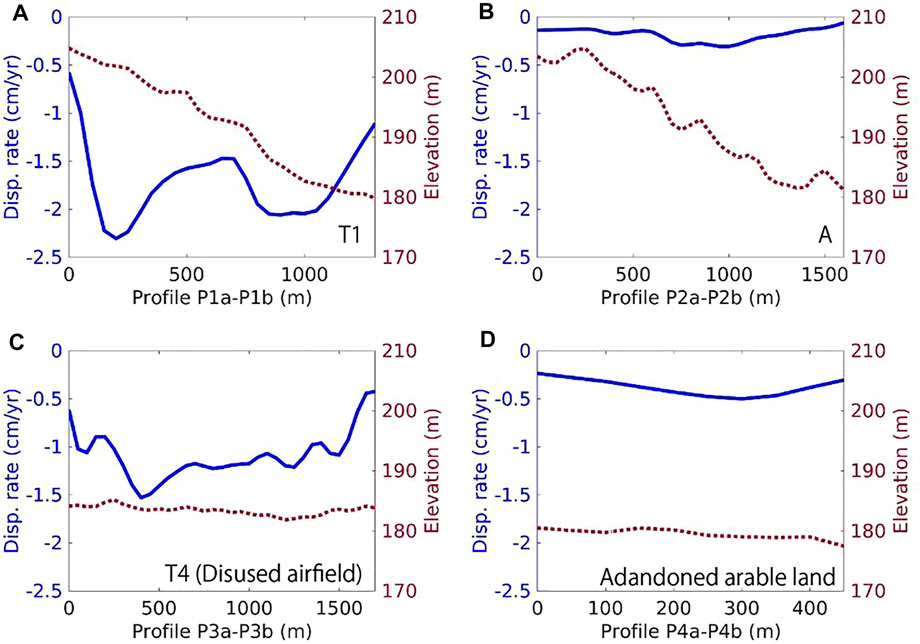
FIGURE 3. Comparison of the surface displacement rate and elevation along the transect lines P1-P4 in Figure 2B.
For comparison with our previous studies (Saito et al., 2018), the transect lines of P3 and P4 were set in a disused airfield and abandoned agricultural field. The elevation profiles along lines P3 and P4 show that the two areas are almost flat (Figures 3C,D). Subsidence in area T4 (disused airfield) was detected at a rate of up to 1.5 cm/yr, while it was up to 0.5 cm/yr in the abandoned agricultural field (Figures 3C,D).
Fine-Scale Mapping Based on UAS Remote Sensing
We obtained the respective orthorectified images and DSMs with spatial resolutions of 3.0 and 6.0 cm for 2016 and 4.0 and 8.0 cm for 2017. High-centered polygons with an average diameter of 11.6 m (Saito et al., 2018) were observed over the entire area of the images (Figure 4). Over the 2 years, little topographic change was observed from the difference between DSMs. The only difference for water areas was that they were more extensive in 2016 (Figure 4). The size of the water area was also affected by the precipitation amounts in each year. The summer season (June, July, and August) precipitations in 2016 and 2017 were 168 and 99 mm, respectively, in the study area. The larger precipitation in 2016 likely resulted in larger water areas in 2016.
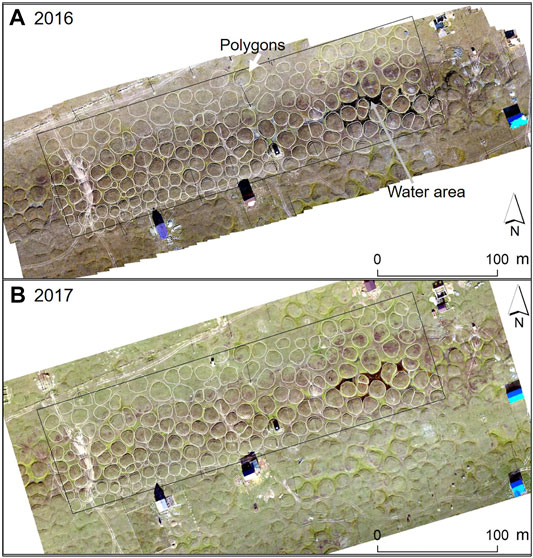
FIGURE 4. Orthorectified images taken by UAS at the disused airfield site (T4 in Figure 2B) for (A) 2016 and (B) 2017. White lines in both photos denote the boundary of polygons.
Figure 5 shows the elevation difference of rectangle area in Figure 4 between 2016 and 2017 DSMs. The difference was calculated only inside the high-centered polygons (Figure 4 and Supplementary Figure S2) since the difference of DSMs between 2016 and 2017 provides unrealistic positive values (uplifting) in most of the trough parts. The reverse tendency was probably due to the low quality of photogrammetry in 2016. The photos taken under the cloudy condition in the late afternoon likely caused the overestimation of deeper trough shape (lower elevation). As a result of Figure 5, most of the difference indicates subsidence with a mean difference of −8 cm/366 days.
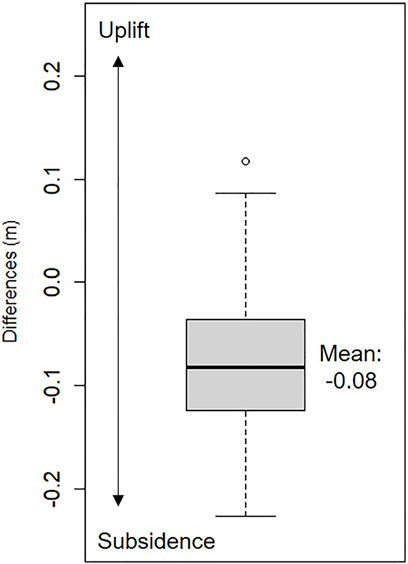
FIGURE 5. (new). Box plot of elevation difference at the center part of polygons between 2016 and 2017 DSM.
The previous study (Saito et al., 2018) showed that the estimated average subsidence rate was 2.1 cm/yr in the disused airfield (Figure 4) and 3.9 cm/yr in the abandoned arable land (Saito et al., 2018). Considering the residual errors of the SfM-MVS photogrammetry of 7.8 and 16.5 cm for 2016 and 2017, respectively, the comparison is mostly within the error. Thus, the small topographic changes (less than 20 cm) triggered by the subsidence in only a 1-year interval may have observational uncertainties by UAS remote sensing.
Discussion
Effect of Land Use History on Thermokarst Development
In the settlement of Churapcha, the landscape on the terraced terrain, where yedoma permafrost has been preserved, differs greatly on a north to south transect (Figure 2). The northern part of the settlement is dominated by larch forest taiga, while natural grassland dominates the southern area. As of 1945, much of the land had been made up of old alases interspersed with terraced terrain, whereas there had been a few young thermokarst lakes (Figure 2C; Czudek and Demek, 1970; Gorokhov et al., 2011). In contrast, anthropogenic development, such as expanding residential development and agricultural fields, has spread north and south. Many young thermokarst lakes emerged simultaneously and continue to do so. Landscape changes between two periods (Table 2) show that the original boreal forest (larch forest with vaccinium) on higher elevations classified as inter-alas, has been decreasing (−13.4%), while settlements (+5.9%) and agricultural fields (+3.7%) have been expanding. The area of alas and inter-alas lakes has also increased (+8.1 and 0.4%, respectively). The inter-alas lakes show a slight total area increase, which indicates the extensive emergence of young thermokarst lakes (Figure 2D). According to an assessment of lake dynamics at the Yukechi site in the Lena-Aldan interfluvial area in Central Yakutia over 70 years (Ulrich et al., 2017), which is located about 100 km to the east, anthropogenic disturbance and deforestation was initiated, and the climate forced rapid and continuous thermokarst lake development in Central Yakutia. They quantified a mean radial growth of 1.2 ± 1.0 m/yr of and a mean subsidence rate of 6.2 ± 1.4 cm/yr. The Churapcha locality is also considered to follow a similar temporal evolution of thermokarst development.
Churapcha is the location of an unpaved airport on inter-alas grassland (T4) that was used until the early 1990s. In addition, the locality has also seemed stably used as agricultural fields in the open areas of the northern boreal forest and in the southern grassland (Figures 2C,D; Gorokhov et al., 2011; Saito et al., 2018). Similar land use without any signs of permafrost degradation and thermokarst processes was widespread in Central Yakutia until the 1980s (Crate et al., 2017). In contrast, extensive surface subsidence due to increasing thermokarst processes seems to be related to a clear warming shift in the region since the 1990s. Reports from the Yukechi site (Fedorov et al., 2014a) indicate that the surface subsidence in the 1990s was minor when the thermokarst lakes had just emerged. In contrast, the subsidence rate increased significantly after 2000, when lakes began to expand rapidly. These recent changes indicate that the status of thermokarst development since the 1990s would be very effectively detected by combining multiple spatial analyses.
Thermokarst Development After 2000 Detected by Multiple Spatial Data
Thermokarst development has been active in Central Yakutia since the early 2000s (Iijima et al., 2010; Fedorov et al., 2014a; Ulrich et al., 2017; Czerniawska and Chlachula, 2020). In addition to the expansion of young thermokarst lakes, the development of polygonal relief due to continuous surface subsidence in the early stage of thermokarst formation with the beginning of ice-wedge complex thawing (“dyede” in the Sakha language, Desyatkin et al., 2009) has been observed in various parts of the open field in Churapcha. The InSAR results show that monotonous topographic subsidence has continued for the previous 5 years (2015–2020), indicating that the thermokarst has been actively developing. However, it is also clear that there are some differences in its progression even within the region.
We compare the landscape changes due to surface subsidence and polygonal landform development detected by InSAR and UAS remote sensing at several sites in Figure 2B with satellite imagery from 2007 (ALOS-PRISM), 2011, and the present (WorldView) in Figure 6. The disused airfield (T4) shows thermokarst initiation with less polygonal relief and small ponding areas in 2007 (Figure 6A). In contrast, we can find intense development of polygonal relief on the former runway (long and narrow rectangle area) and newly developed lakes along the northern road and in the southwestern grassland in 2011. In particular, it is noted that thermokarst lakes have expanded, implying a deepening of their bathymetry in the recent image. Moreover, it is noteworthy that the number of new houses and buildings has been increasing in these areas despite the obvious and significant landscape changes due to the progression of thermokarst during the last decade.
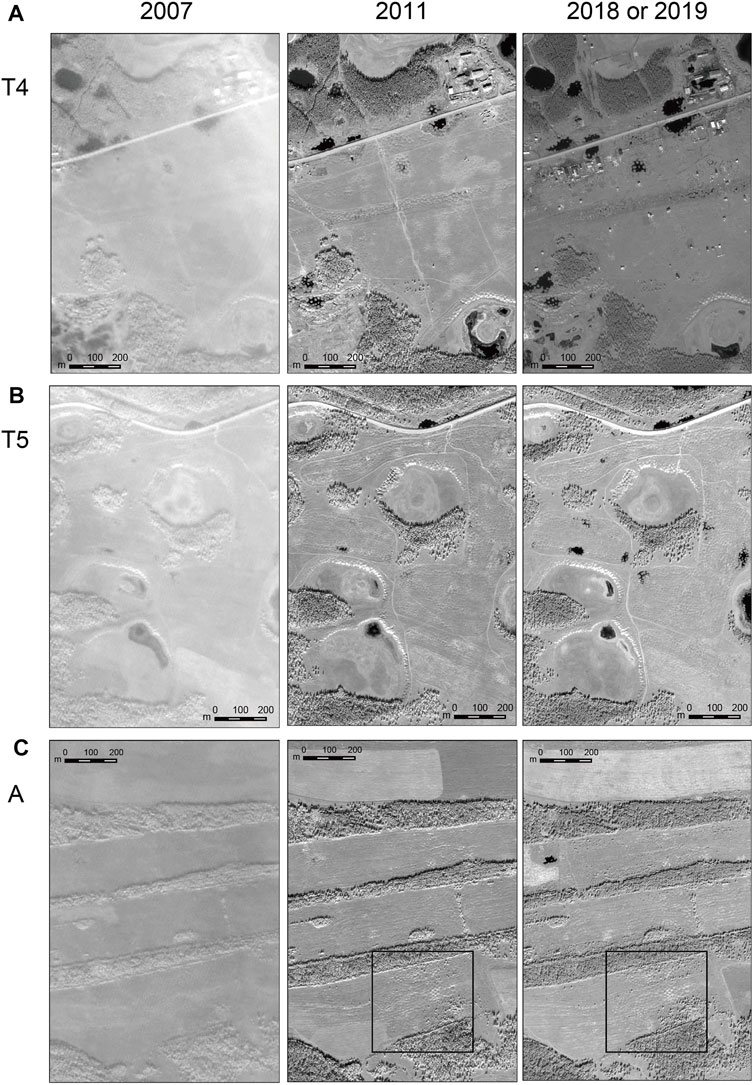
FIGURE 6. Comparison of the visible images in areas (A) T4, (B) T5, and (C) A (as shown in Figure 2B), derived from ALOS-PRISM in September 2007 (left), WorldView in September 2011 (center), and WorldView in September 2018 or August 2019 (right). The rectangle in (C) shows the enlarged area in Figure 8.
The same change is obvious for the abandoned agricultural field (T5; Figure 6B). Thermokarst lakes had already emerged in their exact current locations as of 2007. The lakes were initially small but appear to have constantly increased in size until recently. High-centered polygons are developed in a plot of land used as agricultural fields, where vehicle tracks are visible. The extent of the polygons coincides well with the large subsidence seen in area T5 (Figure 2B).
Saito et al. (2018) examined thermokarst subsidence in areas T4 and T5 using a UAS and SfM-MVS and estimated a subsidence rate of 2.1 cm/yr for the disused airfield and 3.9 cm/yr for the abandoned arable land from 1990 to 2017. According to our InSAR stacking results (Figures 3C,D), both average subsidence rates during 2015–2020 (1.5 cm/yr at P3 and 0.5 cm/yr at P4) were lower than those reported in Saito et al. (2018). One of the possible reasons is interannual changes in the subsidence rate. Fedorov et al. (2014a) demonstrated the acceleration of subsidence at polygon centers after 2000, particularly in 2004–2008 during wet climate periods at the Yukechi site. Compared to that period, the speed of the active layer deepening shows a slow or recovering trend, and this may indicate the possibility that the recent period of relative stability is somewhat small compared to the long-term subsidence rate likely because of drier climate. It is also clear that the significant subsidence rate indicated by InSAR analysis is difficult to estimate from the difference of the DSMs taken in two consecutive years. Figure 7 shows the subsidence rate of InSAR in area T4 compared to the UAS ortho-images and DSM. The orthorectified images and DSM show that the polygons are distributed over the entire area. In particular, the polygon troughs are showing the lowest terrain heights, which are about 2 m lower than the surrounding area. The InSAR magnified images indicate that a subsidence rate of 0.5–2 cm/yr is widespread over the entire area, and areas of high subsidence correspond to regions with deep polygon development. Based on the line transect diagram (A-B) in Figure 7, there is an obvious correspondence between the magnitude of the InSAR subsidence rate and the level of polygon development. Areas with high elevations and less pronounced polygon development at side A show low subsidence rates, while areas with well-developed polygons near the center show high subsidence rates. On side B, the polygons are well developed. However, there is a water area, which may correspond to the fact that the subsidence was not well reproduced by InSAR. Thus, although it is difficult to calculate the subsidence rate from year to year based on the accuracy of the images and the DSM itself, the high-resolution spatial information is beneficial for confirming the locations where the InSAR results can be verified.
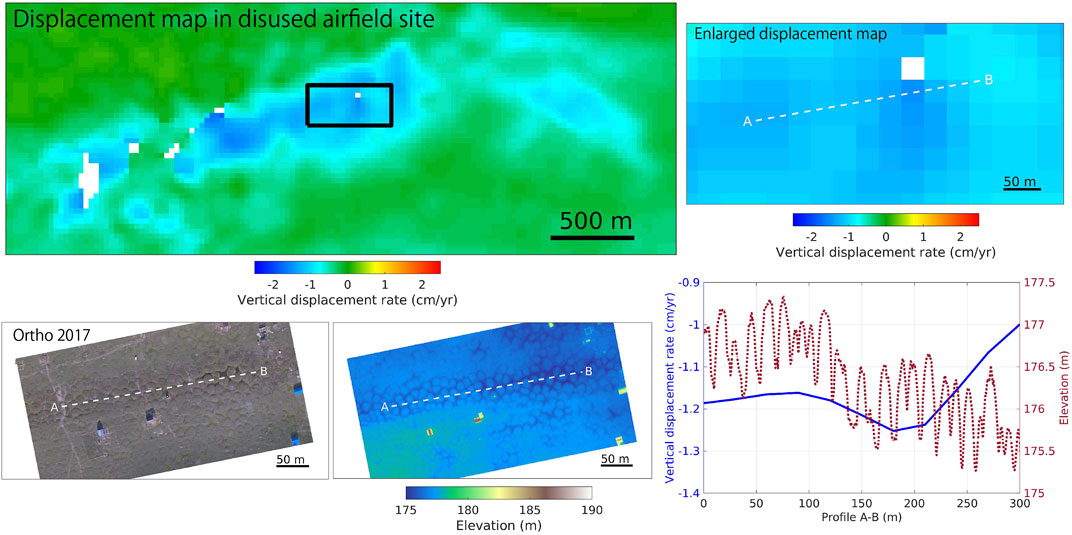
FIGURE 7. Comparison between InSAR and UAS maps at area T4. The displacement map (upper left) is the same as Figure 2B with 30-m resolution. (upper right) Enlarged displacement map (lower left) Orthorectified and DSM maps in 2017. (lower-right) comparison between elevation and vertical displacement rate along line transect (A–B).
In contrast, the stacked interferogram (Figure 2B) shows that no subsidence signal was detected in area A. However, numerous high-centered polygons in area A were identified by Worldview high-resolution optical images in 2011 (Figure 6C). Figure 8 shows enlarged pan-sharpened images in area A by Worldview-2 in 2011 and Worldview-3 in 2019 with a resolution of 50 cm. High-centered polygons in cultivated areas are shown in both images, confirming that thermokarst has been developing in area A. However, the polygons in 2019 were more ambiguous than in 2011, and it is apparent that larch regeneration is also spreading, which would indicate a slight stabilization of the surface. The cultivated agricultural land in the north showed extensive subsidence at T1 (Figures 2B, 3A). Both areas T1 and A are south-facing slopes with similar topography and relief positions on the potentially ice-rich Abrakh terrace surfaces. Based on these conditions, it is not surprising that thermokarst development has progressed at both locations. However, if thermokarst development is slowing down in area A, it can be pointed out that the reason may reflect differences in soil and ground ice distribution rather than a climatic trend. Area A is located on the terrace edge near the Taata River (Figure 1A), suggesting the existence of a depositional environment here, different from that of T1. The average diameter of polygons in areas T4 and T5 also differ by approximately 4 m, suggesting that the ice wedges were formed under different conditions (Saito et al., 2018).
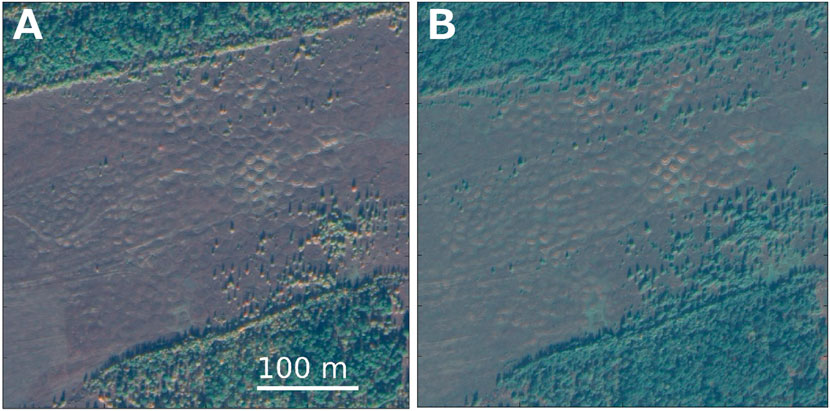
FIGURE 8. Comparison of the pan-sharpened images in arable land area A in Figure 2B derived from the (A) Worldview-2 image on September 11, 2011 and (B) Worldview-3 image on August 27, 2019.
Effectiveness of InSAR Analysis for Detecting Thermokarst Development
The application of InSAR analysis to the vicinity of Yakutsk, East Siberia, Russia, mark a starting point in quantifying land surface subsidence related to the thawing of permafrost (Abe et al., 2020; Yanagiya and Furuya, 2020). These previous studies used stacking InSAR analysis with SAR images from 2006–2010 (ALOS-PALSAR) and 2015–2018 (ALOS-2/PALSAR-2). Their results showed that, compared with regions showing relatively small surface displacements, open areas showing obvious thermokarst subsidence signals had average subsidence rates of 1–3 cm/yr (Abe et al., 2020). According to their field survey at the Mayya settlement (about 100 km southeast of Churapcha), the ground truth data identified polygonal landforms in the deforested areas where thermokarst subsidence signals were found. The ground surface displacements obtained from two field surveys in subsequent autumns showed good agreement with the displacements obtained from InSAR analysis. This result confirms that InSAR successfully detects the spatio-temporal distribution of subsidence signals in open land, logging land, and agricultural land, including non-forested urban areas in Central Yakutia.
In the present study, several open areas near Churapcha also showed a clear subsidence trend at the rate of 0.5–2 cm/yr (Figure 1B, Figure 2B, and Figure 3). The rate is somehow comparable to the estimation at T4 and T5 by Saito et al. (2018). How can these interannual subsidence rates be evaluated in relation to the annual freeze-thaw cycle? As for seasonal subsidence, we additionally performed InSAR analysis using two pairs within the warm season in the certain year, a pair between autumn to next early summer and a pair 3 years apart (Supplementary Figure S3). The subsidence distribution in (Supplementary Figure S3A) is exactly similar to the ones in the stacked interferogram. Since the melting of yedoma ice occurs in the latter half of the thawing season, this result may represent a part of the thermokarst process; Zwieback and Meyer (2021) discuss the same point in their InSAR results for Alaska. Since the signal distribution in Supplementary Figure S3B does not show very clear subsidence, it appears that the surface subsidence associated with ground-ice melting has not yet occurred in this period. Seasonal subsidence during July to August tends to be a little less than 1 cm/month. Supplementary Figure S3C suggests the net change in subsidence associated with melting of the ground ice in 2017 and subsequent frost heaving, and then seasonal ice melting mainly within the active layer in 2018. It is similar to the distribution of subsidence in the stacked interferogram. The subsidence rate is more extensive than Supplementary Figure S3A, which suggests that there is still more subsidence after September 22, 2015 and/or that the 2017 subsidence is more significant. As for the InSAR results for images 3 years apart (Supplementary Figure S3D), the displacement distribution shows the same trend as the stacking result. It represents about 3 years of displacement. The large positive areas are forests or lakes, which appear differently in the other images, so they are possibly noise. Area A shows slight subsidence (Supplementary Figures S3C,D), so we might have found more subsidence if we had images from the end of September instead of 20 July. Based on the results, the seasonal change component tends to show the effect of yedoma ice melting in the late summer rather than the effect of annual frost heaving and subsidence. The subsidence rate for stacking analyses in this study is probably underestimated in this case due to the availability of data for the late summer.
Based on the fine-scale satellite images, these landscapes are mostly affected by polygonal land deformation, indicating thermokarst development. In addition, these are not natural areas but have been developed by human activity within the past 70 years. This subsidence progression was consistent with the InSAR results as an average value for the entire target area. Still, the results suggest that continued observations and additional observation points are needed for more detailed verification.
Conclusion
In the present study, we evaluated the distribution of topographic subsidence caused by thermokarst development in the area around Churapcha, in Central Yakutia, which is characterized by a typical yedoma landscape. In an attempt to understand the rapidly progressing thermokarst development, multiple spatial data sources were used.
The results of the InSAR stacking analysis show that the interannual trend of surface subsidence by thawing permafrost and melting of yedoma ice mainly occurred in deforested areas and agricultural fields. The agricultural fields have expanded significantly north and south of Churapcha during the past 70 years. However, extensive thermokarst processes and the widespread development of high-centered polygonal relief make it difficult for the local people to continue using these areas. Thermokarst has also developed in areas where people have already built structures. This situation makes it particularly important to provide information about permafrost degradation to the local population, also in order to be able to take countermeasures.
The thermokarst development in Central Yakutia has progressed since the 2000s. InSAR analysis using the ALOS series of satellites, which has been in operation since the early 2000s, can detect topographic changes over the years. However, even in the stripmap mode of ALOS-2, the effective resolution is limited to approximately 30 m due to noise influences, which is insufficient to map the displacement to actual landscape changes. By comparing with the DSMs and high-resolution images from the UAS, which have a resolution of the order of less than 10 cm, we can effectively examine the development of thermokarst in the area where the InSAR displacement appeared. On the other hand, for short-term (1 year) differences in DSMs, the amount of displacement could not be detected with the vertical accuracy of InSAR due to the low data quality of the 2016 DSM. Therefore, to improve the accuracy of the topographic displacement validation, it is necessary to detect the cumulative displacement over 5–10 years. In this case, clear photography and accurate GCP geocoding in the space of about 1 km2 will be necessary to compare with InSAR results. In addition, because most fields with thermokarst development correspond to areas affected by anthropogenic activity in the past, spatial information on historical land-use change in GIS format is also helpful. Going forward, the integrated analysis of geospatial information will be essential for assessing permafrost degradation.
Data Availability Statement
The original contributions presented in the study are included in the article/Supplementary Materials, further inquiries can be directed to the corresponding author.
Author Contributions
YI, TA, HS, MU, and AF designed the study. YI and TA acquired funding. YI, HS, NB, and AF participated in field investigations. TA and MU conducted InSAR analyses. HS, NB, and AF conducted SfM analyses using UAS data. AG and VM applied the land classifications in the GIS format. YI, TA, and HS wrote the original draft of the manuscript. All authors contributed to the review and editing of the manuscript.
Funding
This research was supported by the three Japanese grants: JSPS KAKENHI Grant JP19H00556, Arctic Challenge for Sustainability II Program Grant JPMXD1420318865, JST SICORP Grant JPMJSC1902, and JSPS International Fellowship for Research in Japan (L18558). This study was also supported by ERI JURP 2021-B-03 in Earthquake Research Institute, the University of Tokyo and the HYPE-ERAS project, which is funded by FORMAS (project No. 2019-02332), RFBR (project No. 20-55-71005), JST (grant No. JPMJBF2003) through the Belmont Forum Collaborative Research Action: Resilience in Rapidly Changing Arctic Systems.
Conflict of Interest
The authors declare that the research was conducted in the absence of any commercial or financial relationships that could be construed as a potential conflict of interest.
Publisher’s Note
All claims expressed in this article are solely those of the authors and do not necessarily represent those of their affiliated organizations, or those of the publisher, the editors and the reviewers. Any product that may be evaluated in this article, or claim that may be made by its manufacturer, is not guaranteed or endorsed by the publisher.
Acknowledgments
We express sincere thanks to Dr. Aleksey Desyatkin for help with fieldwork in 2016 and 2017. ALOS-2/PALSAR-2 SLC data are shared among PIXEL (PALSAR Interferometry Consortium to Study our Evolving Land surface), and provided from JAXA under a cooperative research contract with PIXEL. The ownership of ALOS-2/PALSAR-2 data belongs to JAXA.
Supplementary Material
The Supplementary Material for this article can be found online at: https://www.frontiersin.org/articles/10.3389/feart.2021.750298/full#supplementary-material
References
Abe, T., Iwahana, G., Efremov, P. V., Desyatkin, A. R., Kawamura, T., Fedorov, A., et al. (2020). Surface Displacement Revealed by L-Band InSAR Analysis in the Mayya Area, Central Yakutia, Underlain by Continuous Permafrost. Earth Planets Space 72, 138. doi:10.1186/s40623-020-01266-3
Antonova, S., Sudhaus, H., Strozzi, T., Zwieback, S., Kääb, A., Heim, B., et al. (2018). Thaw Subsidence of a Yedoma Landscape in Northern Siberia, Measured In Situ and Estimated from TerraSAR-X Interferometry. Remote Sensing 10, 494. doi:10.3390/rs10040494
Bosikov, N. P. (1991). Alas Evolution of Central Yakutia. Yakutsk: Permafrost Institute SD USSR AS. 128p. (In Russian).
Chen, J., Liu, L., Zhang, T., Cao, B., and Lin, H. (2018). Using Persistent Scatterer Interferometry to Map and Quantify Permafrost Thaw Subsidence: A Case Study of Eboling Mountain on the Qinghai-Tibet Plateau. J. Geophys. Res. Earth Surf. 123, 2663–2676. doi:10.1029/2018jf004618
Costantini, M. (1998). A Novel Phase Unwrapping Method Based on Network Programming. IEEE Trans. Geosci. Remote Sensing 36, 813–821. doi:10.1109/36.673674
Crate, S., Ulrich, M., Habeck, J. O., Desyatkin, A. R., Desyatkin, R. V., Fedorov, A. N., et al. (2017). Permafrost Livelihoods: A Transdisciplinary Review and Analysis of Thermokarst-Based Systems of Indigenous Land Use. Anthropocene 18, 89–104. doi:10.1016/j.ancene.2017.06.001
Czerniawska, J., and Chlachula, J. (2020). Climate-Change Induced Permafrost Degradation in Yakutia, East Siberia. Arctic 73, 509–528. doi:10.14430/arctic71674
Czudek, T., and Demek, J. (1970). Thermokarst in Siberia and its Influence on the Development of Lowland Relief. Quat. Res. 1, 103–120. doi:10.1016/0033-5894(70)90013-x
Desyatkin, A. R., Takakai, F., Fedorov, P. P., Nikolaeva, M. C., Desyatkin, R. V., and Hatano, R. (2009). CH4emission from Different Stages of Thermokarst Formation in Central Yakutia, East Siberia. Soil Sci. Plant Nutr. 55, 558–570. doi:10.1111/j.1747-0765.2009.00389.x
Emardson, T. R., Simons, M., and Webb, F. H. (2003). Neutral Atmospheric Delay in Interferometric Synthetic Aperture Radar Applications: Statistical Description and Mitigation. J. Geophys. Res. 108 (B5), 2231. doi:10.1029/2002JB001781
Eshqi Molan, Y., Kim, J.-W., Lu, Z., Wylie, B., and Zhu, Z. (2018). Modeling Wildfire-Induced Permafrost Deformation in an Alaskan Boreal Forest Using InSAR Observations. Remote Sensing 10, 405. doi:10.3390/rs10030405
Fedorov, A., and Konstantinov, P. (2003). “Observations of Surface Dynamics with Thermokarst Initiation, Yukechi Site, Central Yakutia”, in Proceedings of the 8th International Conference on Permafrost, Zurich, Switzerland, July 21-25, 2003 (Lisse, Netherlands: AA Balkema). 239–243.
Fedorov, A. N., Gavriliev, P. P., Konstantinov, P. Y., Hiyama, T., Iijima, Y., and Iwahana, G. (2014a). Estimating the Water Balance of a Thermokarst lake in the Middle of the Lena River basin, Eastern Siberia. Ecohydrol. 7, 188–196. doi:10.1002/eco.1378
Fedorov, A. N., Ivanova, R. N., Park, H., Hiyama, T., and Iijima, Y. (2014b). Recent Air Temperature Changes in the Permafrost Landscapes of Northeastern Eurasia. Polar Sci. 8, 114–128. doi:10.1016/j.polar.2014.02.001
Gasanov, S. S. (1969). Estimating of the Volumetric Macro Ice Bodies Content of Permafrost in the Development of Placer deposit. Kolyma 6, 41–42.
Gavriliev, P. P., and Ugarov, I. S. (2009). Reaction of Central Yakutian Ice Complex on Climate Warming. Earth Cryosphere XIII, 24–30. (In Russian).
Goldstein, R. M., and Werner, C. L. (1998). Radar Interferogram Filtering for Geophysical Applications. Geophys. Res. Lett. 25, 4035–4038. doi:10.1029/1998gl900033
Gorokhov, A. N., Fedorov, A. N., Skorve, D., and Makarov, V. S. (2011). Assessment of the Anthropogenic Landscape Variability in the Vicinity of the Churapcha Village (Central Yakutia) Based on Remote Sensing Data. Probl. Reg. Ecol. Evol. Dyn. Geosystems, UDC 504, 54. (In Russian).
Iijima, Y., Fedorov, A. N., Park, H., Suzuki, K., Yabuki, H., Maximov, T. C., et al. (2010). Abrupt Increases in Soil Temperatures Following Increased Precipitation in a Permafrost Region, central Lena River basin, Russia. Permafrost Periglac. Process. 21, 30–41. doi:10.1002/ppp.662
Iijima, Y., Nakamura, T., Park, H., Tachibana, Y., and Fedorov, A. N. (2016). Enhancement of Arctic Storm Activity in Relation to Permafrost Degradation in Eastern Siberia. Int. J. Climatol. 36, 4265–4275. doi:10.1002/joc.4629
Iijima, Y., Ohta, T., Kotani, A., Fedorov, A. N., Kodama, Y., and Maximov, T. C. (2014). Sap Flow Changes in Relation to Permafrost Degradation under Increasing Precipitation in an Eastern Siberian Larch forest. Ecohydrol. 7, 177–187. doi:10.1002/eco.1366
Iijima, Y., Park, H., Konstantinov, P. Y., Pudov, G. G., and Fedorov, A. N. (2017). Active-Layer Thickness Measurements Using a Handheld Penetrometer at Boreal and Tundra Sites in Eastern Siberia. Permafrost Periglac. Process. 28, 306–313. doi:10.1002/ppp.1908
Ivanov, M. S. (1984). The Cryogenic Structure of Quarternary Deposits of the Leno-Aldan Depression. Novosibirsk: Nauka. 125p. (In Russian).
Iwahana, G., Uchida, M., Liu, L., Gong, W., Meyer, F., Guritz, R., et al. (2016). InSAR Detection and Field Evidence for Thermokarst after a Tundra Wildfire, Using ALOS-PALSAR. Remote Sensing 8, 218. doi:10.3390/rs8030218
Katamura, F., Fukuda, M., Bosikov, N. P., and Desyatkin, R. V. (2009). Charcoal Records from Thermokarst Deposits in Central Yakutia, Eastern Siberia: Implications for forest Fire History and Thermokarst Development. Quat. Res. 71, 36–40. doi:10.1016/j.yqres.2008.08.003
Liu, L., Jafarov, E. E., Schaefer, K. M., Jones, B. M., Zebker, H. A., Williams, C. A., et al. (2014). InSAR Detects Increase in Surface Subsidence Caused by an Arctic Tundra Fire. Geophys. Res. Lett. 41, 3906–3913. doi:10.1002/2014gl060533
Liu, L., Schaefer, K. M., Chen, A. C., Gusmeroli, A., Zebker, H. A., and Zhang, T. (2015). Remote Sensing Measurements of Thermokarst Subsidence Using InSAR. J. Geophys. Res. Earth Surf. 120, 1935–1948. doi:10.1002/2015jf003599
Liu, L., Zhang, T., and Wahr, J. (2010). InSAR Measurements of Surface Deformation over Permafrost on the North Slope of Alaska. J. Geophys. Res. 115, F03023. doi:10.1029/2009jf001547
Michaelides, R. J., Schaefer, K., Zebker, H. A., Parsekian, A., Liu, L., Chen, J., et al. (2019). Inference of the Impact of Wildfire on Permafrost and Active Layer Thickness in a Discontinuous Permafrost Region Using the Remotely Sensed Active Layer Thickness (ReSALT) Algorithm. Environ. Res. Lett. 14, 035007. doi:10.1088/1748-9326/aaf932
Miller, J. R., Fuller, J. E., Puma, M. J., and Finnegan, J. M. (2021). Elevation-dependent Warming in the Eastern Siberian Arctic. Environ. Res. Lett. 16, 024044. doi:10.1088/1748-9326/abdb5e
Overland, J. E., and Wang, M. (2021). The 2020 Siberian heat wave. Int. J. Climatol. 41, E2341–E2346. doi:10.1002/joc.6850E2346
Rouyet, L., Lauknes, T. R., Christiansen, H. H., Strand, S. M., and Larsen, Y. (2019). Seasonal Dynamics of a Permafrost Landscape, Adventdalen, Svalbard, Investigated by InSAR. Remote Sensing Environ. 231, 111236. doi:10.1016/j.rse.2019.111236
Saito, H., Iijima, Y., Basharin, N., Fedorov, A., and Kunitsky, V. (2018). Thermokarst Development Detected from High-Definition Topographic Data in Central Yakutia. Remote Sensing 10, 1579. doi:10.3390/rs10101579
SakhSTAT SakhSTAT (2021). Available at: https://sakha.gks.ru/about (Accessed July 19, 2021).
Schirrmeister, L., Froese, D., Tumskoy, V., Grosse, G., and Wetterich, S. (2013). “PERMAFROST and PERIGLACIAL FEATURES | Yedoma: Late Pleistocene Ice-Rich Syngenetic Permafrost of Beringia,” in The Encyclopedia of Quaternary Science. Editor S. A. Elias (Amsterdam: Elsevier), 542–552. doi:10.1016/b978-0-444-53643-3.00106-0
Short, N., Brisco, B., Couture, N., Pollard, W., Murnaghan, K., and Budkewitsch, P. (2011). A Comparison of TerraSAR-X, RADARSAT-2 and ALOS-PALSAR Interferometry for Monitoring Permafrost Environments, Case Study from Herschel Island, Canada. Remote Sensing Environ. 115, 3491–3506. doi:10.1016/j.rse.2011.08.012
Soloviev, P. A. (1959). Permafrost of Northern Part of the Lena-Amga Interfluve. Moscow: USSR Academy of Sciences.
Strauss, J., Schirrmeister, L., Grosse, G., Fortier, D., Hugelius, G., Knoblauch, C., et al. (2017). Deep Yedoma Permafrost: A Synthesis of Depositional Characteristics and Carbon Vulnerability. Earth-Science Rev. 172, 75–86. doi:10.1016/j.earscirev.2017.07.007
Strauss, J., Schirrmeister, L., Grosse, G., Wetterich, S., Ulrich, M., Herzschuh, U., et al. (2013). The Deep Permafrost Carbon Pool of the Yedoma Region in Siberia and Alaska. Geophys. Res. Lett. 40, 6165–6170. doi:10.1002/2013gl058088
Strozzi, T., Antonova, S., Günther, F., Mätzler, E., Vieira, G., Wegmüller, U., et al. (2018). Sentinel-1 SAR Interferometry for Surface Deformation Monitoring in Low-Land Permafrost Areas. Remote Sensing 10, 1360. doi:10.3390/rs10091360
Takakura, H., Fujioka, Y., Ignatyeva, V., Tanaka, T., Vinokurova, N., Grigorev, S., et al. (2021). Differences in Local Perceptions about Climate and Environmental Changes Among Residents in a Small Community in Eastern Siberia. Polar Sci. 27, 100556. doi:10.1016/j.polar.2020.100556
Tarasenko, T. V. (2013). Interannual Variations in the Areas of Thermokarst Lakes in Central Yakutia. Water Resour. 40, 111–119. doi:10.1134/S0097807813010107
Ulrich, M., Matthes, H., Schirrmeister, L., Schütze, J., Park, H., Iijima, Y., et al. (2017). Differences in Behavior and Distribution of Permafrost‐related Lakes in C Entral Y Akutia and Their Response to Climatic Drivers. Water Resour. Res. 53, 1167–1188. doi:10.1002/2016wr019267
Ulrich, M., Matthes, H., Schmidt, J., Fedorov, A. N., Schirrmeister, L., Siegert, C., et al. (2019). Holocene Thermokarst Dynamics in Central Yakutia - A Multi-Core and Robust Grain-Size Endmember Modeling Approach. Quat. Sci. Rev. 218, 10–33. doi:10.1016/j.quascirev.2019.06.010
Wegmüller, U., and Werner, C. L. (1997). “Gamma SAR Processor and Interferometry Software,” in Proceedings of the 3rd ERS symposium, Florence, Italy, March 14-21, 1997 (European Space Agency, Spec Publ), 1687–1692.
Yanagiya, K., and Furuya, M. (2020). Post-wildfire Surface Deformation at Batagay, Eastern Siberia, Detected by L-Band and C-Band InSAR. 125, e2019JF005473. doi:10.1029/2019JF005473
Yu, C., Li, Z., Penna, N. T., and Crippa, P. (2018). Generic Atmospheric Correction Model for Interferometric Synthetic Aperture Radar Observations. J. Geophys. Res. Solid Earth 123, 9202–9222. doi:10.1029/2017jb015305
Yu, C., Penna, N. T., and Li, Z. (2017). Generation of Real‐time Mode High‐resolution Water Vapor fields from GPS Observations. J. Geophys. Res. Atmos. 122, 2008–2025. doi:10.1002/2016jd025753
Keywords: ALOS-2/PALSAR-2, UAS, interferometric SAR (InSAR), permafrost degradation, subsidence, Central Yakutia
Citation: Iijima Y, Abe T, Saito H, Ulrich M, Fedorov AN, Basharin NI, Gorokhov AN and Makarov VS (2021) Thermokarst Landscape Development Detected by Multiple-Geospatial Data in Churapcha, Eastern Siberia. Front. Earth Sci. 9:750298. doi: 10.3389/feart.2021.750298
Received: 30 July 2021; Accepted: 09 November 2021;
Published: 10 December 2021.
Edited by:
Duane Froese, University of Alberta, CanadaReviewed by:
Lin Liu, The Chinese University of Hong Kong, ChinaBernhard Rabus, Simon Fraser University, Canada
Copyright © 2021 Iijima, Abe, Saito, Ulrich, Fedorov, Basharin, Gorokhov and Makarov. This is an open-access article distributed under the terms of the Creative Commons Attribution License (CC BY). The use, distribution or reproduction in other forums is permitted, provided the original author(s) and the copyright owner(s) are credited and that the original publication in this journal is cited, in accordance with accepted academic practice. No use, distribution or reproduction is permitted which does not comply with these terms.
*Correspondence: Yoshihiro Iijima, yiijima@bio.mie-u.ac.jp