Influence of Karst Caves on the Pile’s Bearing Characteristics-A Numerical Study
 Jia-hui Liang
 Qiu-yan Fan
 Kuo Qin2
- 1Research Center of Geotechnical and Structural Engineering, Shandong University, Jinan, China
- 2College of Civil and Architecture, Guangxi University, Nanning, China
Compared with the amount of research undertaken on vertical-bearing piles in karst areas, there are fewer studies on the stability of horizontal-bearing piles (e.g., anti-slide piles and supporting piles), and little in the way of theoretical developments. In order to study the influence of karst cave in front of and under the pile on the stability of anti slide pile, this study designs orthogonal test, carries out numerical simulation by using ABAQUS finite element analysis software, deduces the displacement load curve of each group of piles, and then determines the lateral ultimate bearing capacity of anti slide pile when karst cave exists, and Through multiple linear regression analysis and test on the parameters such as the distance between the karst cave under the pile and the pile tip, the span height ratio of the cave in front of the pile and the span height ratio of the cave under the pile, it is concluded that there is a significant correlation between the above participation and the lateral ultimate bearing capacity. The research results have certain guiding significance for the application of anti slide pile in karst area.
1 Introduction
In areas with soluble limestone, surface precipitation, and free water flowing underground, there are long-term scouring and dissolution effects on the limestone, forming karst morphology, the process being termed karstification. Karst caves are, therefore, underground spaces formed by the karstification of soluble rock. The existence of karst caves destroys the integrity of a rock mass, greatly reducing its strength and stability. The development and formation of karst caves may lead to engineering problems, such as karst collapse, karst ground deformation, karst seepage and water inrush, soil erosion, and water and soil pollution, which causes difficulties in construction and economic losses to the engineering activities implemented on such foundations (Liu et al., 2018; Liu et al., 2019). With the rapid development of China’s economic and social infrastructure and the acceleration of urbanization, more complex sites, including those in areas of karst geology, which are not suitable for foundations, need to be used. Supporting piles in foundation pit engineering and anti-slide piles in landslide treatment engineering, the latter mainly bearing horizontal forces, are often arranged in bedrock with karst caves. This leads to the stability problem of horizontal-bearing piles in karst areas, where the usually adopted treatment methods include increasing the pile diameter, increasing the pile length to penetrate the karst cave, grouting and plugging the karst cave, or directly ignoring its impact and not undertaking any treatment. These treatment methods reflect the lack of theoretical development in terms of the design calculations and construction methods behind horizontal-bearing piles, such as anti-slide piles, when considering karst caves. By contrast, they can only be based on the experience of the engineering and technical personnel, with the safety and stability of the treated pile not able to be guaranteed. This leads to the situation where if the treatment method is too conservative, it will cause unnecessary delays and/or economic waste (Liu et al., 2021a; Liu et al., 2021b).
At present, there is little literature on the bearing characteristics and stability of horizontal-bearing piles in karst areas, either in China or abroad. Fan (2015) and Wang (2014) considered anti-slide piles in areas with karst caves and designed an orthogonal table to simulate the stability of piles under different conditions, obtaining an empirical formula for the safe distance separating karst caves from piles. Han (2019) studied the influence of a karst cave underlying an anti-slide pile on the pile’s stability and inferred the associated failure mode and failure mechanism. Li (2019) studied the influence on the stability of an anti-slide pile when there is a karst cave in the pile’s passive area (i.e., in front of the pile), and obtained the failure mode and failure mechanism, and compared the bearing capacity and crack development process of an anti-slide pile under the influence of two different karst cave forms. Chen and Yi (2017) calculated the safe thickness of a karst cave roof by using the mechanical analysis method, the elastic theory of surrounding rock, and the Griffith criterion. Shaowei et al. (2019) studied the stress and deformation characteristics of supporting piles with circular and rectangular sections based on the comparative model test and studied the anti-sliding ability of circular-section supporting piles. Wang and Zhang (2012) and Dai et al. (2016) used the FDM software FLAC3D to analyze the stability and deformation characteristics of pile foundations under different load levels in the karst area of a large railway. Zhou (2020) studied the pile foundation model for karst environments and obtained the change characteristics of karst foundations under pile loads. Suleiman et al. (2014) used a soil-structure interaction device to study the soil-structure interaction of a pile (i.e., the passive pile subjected to lateral soil movement) that was employed to stabilize a collapsed slope, and established the force-displacement relationship curve of the soil-pile interaction under the condition of passive loading. However, there appears to be no research results dealing with the bearing characteristics and stability of anti-slide piles with karst caves both under and in front of the pile. Based on this, our research group carried out indoor model loading tests and numerical simulation analyses considering anti-slide piles with karst caves both under and in front of the pile. The process of developing the indoor model loading tests and the results are discussed in another paper. This work discusses the numerical simulations and analyzes the influence of various parameters of karst caves on the bearing characteristics of anti-slide piles.
2 Research Methods
The horizontal displacement development curves and the stress-strain law of a pile obtained from the numerical simulation of the same parameters considered in the indoor similarity model are consistent with the similarity test results, with the displacement and strain after the similarity conversion being the same order of magnitude. It is, therefore, feasible to use the ABAQUS software to study the numerical loading model of the effect of the double cave scenario on an anti-slide pile. However, the indoor similarity test is mechanical, and fewer factors are considered. In the follow-up study, it is necessary to add additional influencing factors and carry out an orthogonal test grouping for the analysis of the degree of influence of each factor on the bearing characteristics of an anti-slide pile.
3 Research Project
3.1 Numerical Simulation Model
3.1.1 Calculation Method and Basic Assumptions
For the anti-slide pile without the influence of a karst cave, the main factors influencing its bearing capacity include pile stiffness, pile material strength, pile embedded depth, pile side rock, and soil conditions. When there is a karst cave near the pile, in addition to the nature of the pile itself and the surrounding rock and soil characteristics, there are other factors that describe how the cave affects the pile’s bearing capacity, such as the location, shape, size, number, distance from the pile, and thickness of the cave roof. According to the description in Zhao (2003), the anti-slide pile will cause deformation when it is subjected to horizontal thrust. According to the deformation state of the pile itself and the surrounding rock and soil, the anti-slide pile can be divided into a rigid pile and an elastic pile. The judgement of rigid and elastic piles is related to the calculated depth the pile is buried below the sliding surface. The geological strata considered in this study is limestone, which is hard in texture and is generally complete in distribution, so the “K” method is selected as the calculation method for the anti-slide pile. The cantilever section of the anti-slide pile in the model bears the horizontal thrust, and the corresponding horizontal resistance is provided by the fixed built-in section.
This study analyzed the influence of karst caves on the bearing characteristics of anti-slide piles. The anti-slide piles are arranged continuously, and the stress and cross section are not changed along the longitudinal direction. Displacement and deformation only occur in the cross-section, which is a plane strain problem. The Mohr-Coulomb ideal elastic-plastic model was used to describe the limestone, and the linear elastic model was used for the anti-slide pile.
3.1.2 Model Geometry
The plane strain problem is a two-dimensional problem where the model can be established by determining the length and width of the bedrock and the geometric size of the pile’s section. To avoid the influence on the stress distribution around the pile and the karst cave that would result from considering a too small boundary for the model bedrock, the vertical thickness of the bedrock was set to 15 m, and the transverse width was set to be 15 m outward from the central axis of the pile. The considered size ranges of the pile and caves are listed in Table 1. Schematic diagram of the model’s geometric parameter values in Figure 1.
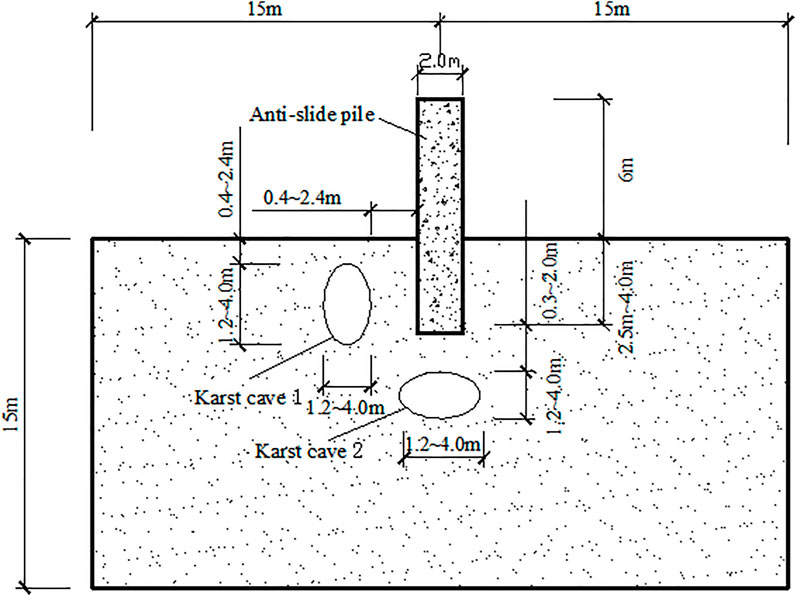
FIGURE 1. Schematic diagram of the model’s geometric parameter values.
TABLE 1. Geometric parameters of the pile and karst caves.
3.1.3 Physical and Mechanical Parameters of the Simulation Materials
Based on experience and previously acquired data, the values of the mechanical parameters of limestone are as follows: unit weight 17–31 kN/m3, uniaxial compressive strength 10–200 MPa, tensile strength 0.5–20 MPa, Poisson’s ratio 0.04 to 0.31, elastic modulus 10–80 GPa, cohesion 10–40 MPa, and internal friction angle 30°–50°. In the practical engineering, the anti-slide pile is generally set in place in bedrock with good integrity, a uniform distribution of strata, weak weathering degree, and relatively stable mechanical properties as the build-in section. The mechanical parameters of the limestone material considered in the simulation model are presented in Table 2.
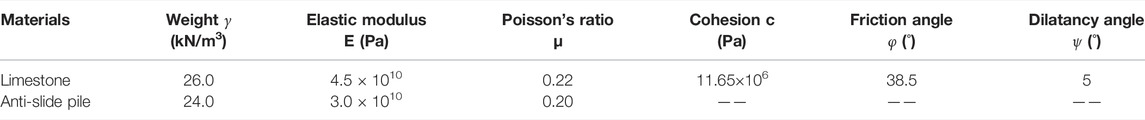
TABLE 2. Physical and mechanical parameters of the anti-slide pile and the considered limestone.
In the design of the anti-slide pile, the concrete grade is usually C30 to C40, and the steel bars are usually HRB400. Considering the large value of pile diameters and low reinforcement ratio in the design process of anti-slide piles, this paper selects C30 grade concrete for analysis. Based on the Code for Design of Concrete Structures (China Academy of Building, 2016), the values of weight, elastic modulus, and Poisson’s ratio of concrete and reinforcement for the piles are also shown in Table 2.
3.2 Failure Theory and Simulation Test Criteria
According to the theory of the elastic-plastic design of anti-slide piles proposed by Chen and Wang (1997), Wang et al. (1997), the core of the method is the establishment of the failure mechanism of the plastic zone of rock and soil in front of the pile. The extent of the elastic-plastic zone of the pile after loading, that is, the maximum allowable critical height of the elastic-plastic zone is the key parameter of such a design.
Considering the Mohr-Coulomb failure criterion, a wedge-shaped plastic zone will appear on the compression surface of the anchorage section of the bedrock when the pile bears horizontal thrust. When the wedge is in the limit equilibrium state, the sliding force and anti-sliding force of the pile under load are equal. When the load of an anti-slide pile continues to increase, the equilibrium state is destroyed, with the sliding force being greater than the anti-slide force, where the rock mass in the plastic zone presents a relative sliding state along the sliding surface, leading to the rock mass being sheared and destroyed. The displacement of the pile then increases rapidly, exceeding the deformation limit or cannot continue to bear the load, leading to the failure of the anti-slide pile. Stress diagram of the anti-slide pile and the wedge model in the elastic-plastic equilibrium zone in Figure 2.
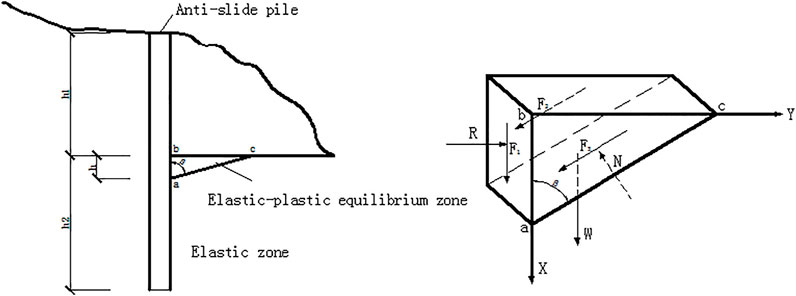
FIGURE 2. Stress diagram of the anti-slide pile and the wedge model in the elastic-plastic equilibrium zone.
From the previous discussion, we know that many factors affect the bearing capacity of the anti-slide pile when a karst cave exists in its vicinity. However, if too many influencing factors are considered, there will be too many combinations of variables to be analyzed, making the analysis process overly complex. Considering the characteristics of the actual project, the pile diameter and fixity depth are set, and five factors (the thickness of the roof of the cave in front of the pile, the distance between the cave in front of the pile and the pile side, the distance between the cave under the pile and the pile end, the span-height ratio of the cave in front of the pile, and the span-height ratio of the cave under the pile) were selected as the variables, and six numerical levels are set for the orthogonal combinations. The maximum horizontal displacement of point A (located in the plastic zone of the rock mass in front of the pile, Figure 3) at the intersection of the pile and the rock surface in the simulations for each parameter combination is used to determine the horizontal ultimate load of the pile. The bearing characteristics of the pile under the changing factors are recorded to analyze the influence of these factors on the bearing characteristics of the anti-slide pile.
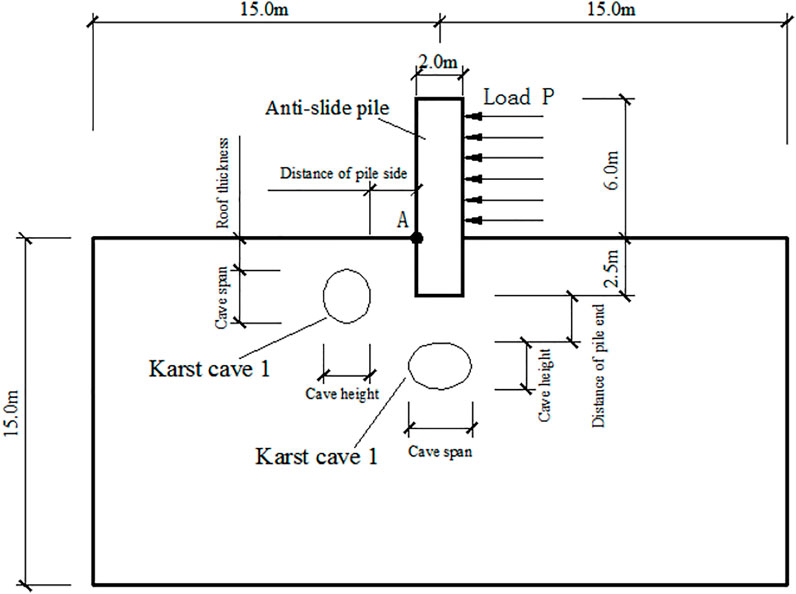
FIGURE 3. Diagram of the loading model used in the simulations.
Based on article 6.4.5 of the Technical Code for Testing of Building Foundation Piles (China Academy of Building, 2014), the horizontal load value corresponding to the starting point of the sharp drop of the H-Y0 curve in the slow maintenance load method can be taken as the lateral ultimate bearing capacity of a pile. The method employed in this study is to load the pile by stages and to record the maximum deformation value of the intersection point between the pile and the rock surface, which is similar to the slow maintaining load method in foundation pile detection technology. Therefore, in this paper, the above criteria are adopted to determine the lateral ultimate bearing capacity of the pile.
3.3 Simulation and Statistics
According to the “K” method, when the pile diameter is 2.0 m and the fixity depth of the pile is not more than 2.99 m, it is a rigid pile, and when it is more than 2.99 m, it is an elastic pile. In practical engineering, the principle of economy is usually given priority. Provided the bearing capacity and stability requirements are met, the pile length and diameter should be reduced as much as possible to save costs. Therefore, under the condition that there are karst caves both in front of and under the pile, the simulations and statistical analysis of the results will be carried out considering a rigid pile with a relatively small pile length. The fixity depth of the fixed pile is therefore set to be 2.5 m, and the cantilever length above the embedded section is 6.0 m.
3.3.1 Orthogonal Test Design
Through the preliminary analysis of the collected data, the five factors outlined above for the orthogonal test design are considered as independent variables, with a six-level orthogonal combination being designed for the simulation tests. The distances mentioned above are all from the outside of the karst cave to the margin of the pile or bedrock. The levels for each factor is shown in Table 3.
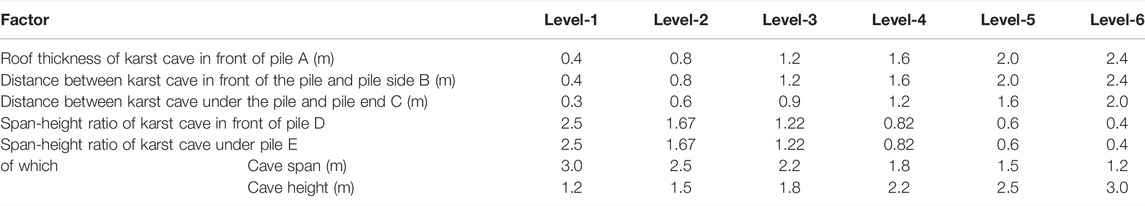
TABLE 3. The level of each factor in the orthogonal test design.
Based on the level of these factors, the mixed level orthogonal test design was carried out using SPSS software, with a total of 49 groups of parameter combinations.
4 Research Results
4.1 Simulation Calculation and Result Analysis
The loading simulations of the 49 groups of parameter combinations were calculated using the finite element analysis software ABAQUS. The horizontal limit load of the pile and the displacement corresponding to point A of the pile were counted according to the value principle of limit load. A schematic diagram of the simulation loading model is shown in Figure 3.
For the statistical analysis, five groups of typical cave distribution models were selected to determine the ultimate load and to analyze the change in the plastic zone of rock mass in front of the piles:
1) Group 7: A = 0.4 m, B = 1.2 m, C = 1.2 m, D = 1.67, E = 1.67, the roof rock mass of the karst cave in front of the pile is thin.
2) Group 30: A = 2.0 m, B = 2.4 m, C = 2.0 m, D = 2.5, E = 1.22, the thickness of rock mass is relatively large in all places.
3) Group 35: A = 1.6 m, B = 0.4 m, C = 0.3 m, D = 2.5, E = 0.6, the distance between the karst cave and the pile side and pile end is relatively small.
4) Group 37: A = 1.6 m, B = 0.4 m, C = 0.6 m, D = 1.22, E = 2.55, the thickness of rock mass between the two cave surfaces is small.
5) Group 49: A = 0.8 m, B = 2.4 m, C = 0.3 m, D = 1.67, E = 0.4, the distance between the karst cave under the pile and the pile end is small (A∼E corresponds to the factors listed in Table 3).
(1) Load-Displacement Curves
The resulting curves of the horizontal displacement of point A with the change in loading for the five groups of simulation tests are presented in Figure 4. The ultimate horizontal bearing capacity of the pile was determined based on these load-displacement curves.
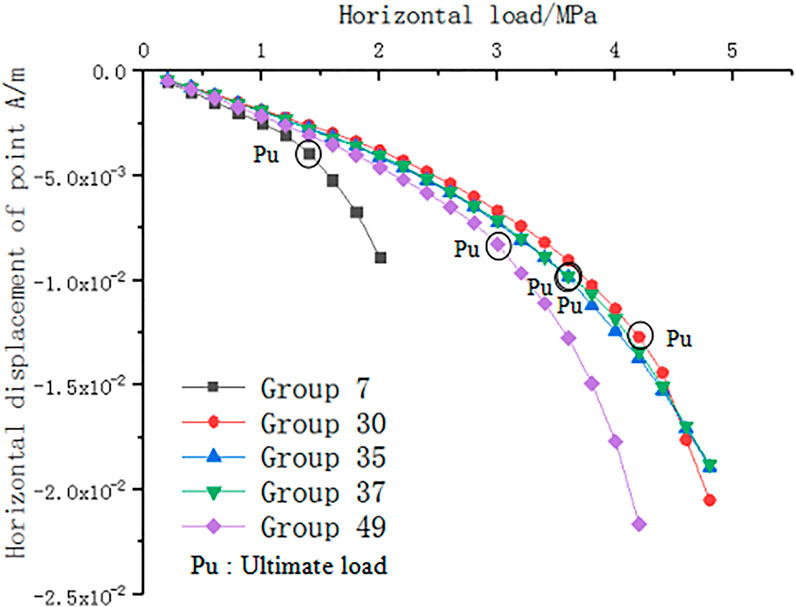
FIGURE 4. Load displacement curves in the five group tests.
Based on these load-displacement curves and the ultimate load determination principle, the horizontal ultimate loads for Groups 7, 30, 35, 37, and 49 are 1.4, 4.2, 3.6, 3.6, and 3.0 MPa, respectively. In Group 7, when the load reaches 2.0 MPa, the plastic strain diagram shows that the rock mass at the cave roof has dislocation slip, indicating that the anti-slide pile is unstable. The trend in the curve for Group 35 is almost the same as that of Group 37, so it can be inferred that the distance between the karst cave under the pile and the pile end has little effect on the bearing capacity of the pile. To observe the internal force distribution and changes in each group more clearly, the plastic strain distribution diagram of each group under the ultimate load was derived, and the loading process was analyzed.
(2) Plastic Strain
The plastic strain distribution of the bedrock under the ultimate load for the five groups of tests is shown in Figure 5. The following findings have been identified:
1) When the roof of the karst cave in front of the pile is thin, the rock mass at the roof directly above the karst cave (a certain distance to the left of point A) appears to show larger plastic deformation than the rock mass at the other parts due to compression. A sliding surface appears, which shows a shear compression failure trend along the sliding surface. However, there is little or no elastic deformation in the other parts of the rock mass. In this case, the bearing failure of the anti-slide pile is caused by the shear failure of the rock mass at the cave roof.
2) When the cave roof is thick and distant from the pile side and pile end, the bearing capacity of the anti-slide pile is controlled by the deformation of the rock mass in front of the pile. The failure of the anti-slide pile is thus caused by the excessive deformation of rock mass at point A.
3) When the karst cave in front of the pile is close to the pile side, the rock mass between the karst cave and the pile side also shows high plastic deformation during the loading process. It can be assumed that if there are joints or fissures in this part of rock mass at this time, the pile is likely to have been damaged before reaching the ultimate load, resulting in the potential instability of the pile body.
4) When the boundaries of the caves in front of the pile and under the pile are close to each other, the rock mass between the two caves first experiences large plastic deformation. This part of rock mass was seen to be damaged in the simulations, but in practical engineering, the situation is more complicated. If this part of the rock mass has uncontrollable factors, such as the existence of cracks and different degrees of dissolution, the rock mass strength is in a non-uniform state, with this part of the rock mass owing to the cracks breaking first, resulting in the instability of the anti-slide pile.
5) When the karst cave under the pile is close to the pile end, the rock mass at the top of the karst cave first suffers large plastic deformation, where the deformation here is larger than that in front of the pile, The rock mass here is, therefore, more likely to be destroyed, resulting in the instability of the anti-slide pile.
FIGURE 5. Plastic strain distribution of the five groups of tests outlined in the text.
4.2 Multiple Linear Regression Analysis
4.2.1 Multiple Linear Regression
The horizontal limit load was taken as the dependent variable Y, and the roof thickness of the karst cave in front of the pile, the distance between the karst cave in front of the pile and the pile side, the distance between the karst cave under the pile and the pile end, the span height ratio of the karst cave in front of the pile, and the span height ratio of the karst cave under the pile, were defined as the independent variables X1, X2, X3, X4, and X5, respectively. The statistical data in Table 4 were imported into the SPSS software for linear regression analysis, and the following regression equation was obtained:

TABLE 4. Fitting analysis parameters.
In this formula, the variables X1 to X5 should conform to the range of values of the corresponding factors in the orthogonal test design. The unit of Y is MN/m2, and to ensure dimensional unity, the unit of the coefficients of X1 to X3 is defined as MN/m3, and X4 and X5 are dimensionless, hence the unit of their coefficients and the constant term are defined as MN/m2. The orthogonal test design was carried out under the assumption that the anti-slide pile meets the strength index of the pile material, has no defects and meets the required safety standards. Therefore, the regression equation is suitable for analyzing the influence of the karst cave on the horizontal bearing capacity of the anti-slide pile when there are karst caves both in front of and under the pile, allowing the assessment of whether it is necessary to treat the karst cave or to modify the pile design.
4.2.2 Linear Regression Test
1) Test for the degree of fitting and independence
It can be obtained from Table 4 that R2 = 0.797, hence the fitting degree is good, indicating that the linear regression equation obtained is reasonable. The Durbin-Watson index is 1.908, indicating that the variables in the regression equation are independent of each other.
2) Multivariate analysis of variance
From the analysis of variance presented in Table 5, it can be seen that the F-Test Sig = 0.000 < 0.05, which also shows that the regression equation, displays a good significance.
3) Multicollinearity diagnosis and significance test

TABLE 5. Parameters of the multivariate analysis of variance.
By the variance proportion coefficient in Table 6, the collinearity among the independent variables is seen to be not significant. Further analysis of the VIF parameters in Table 7 shows that the VIF of all factors is 1.000, indicating that there is no multicollinearity among these five independent variables, hence, no effect on the regression equation.
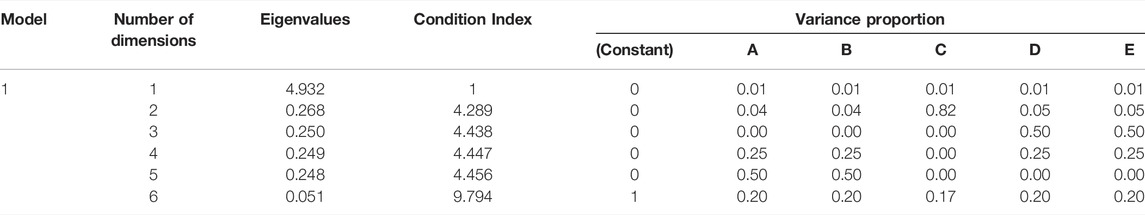
TABLE 6. Collinearity diagnostic parameters.
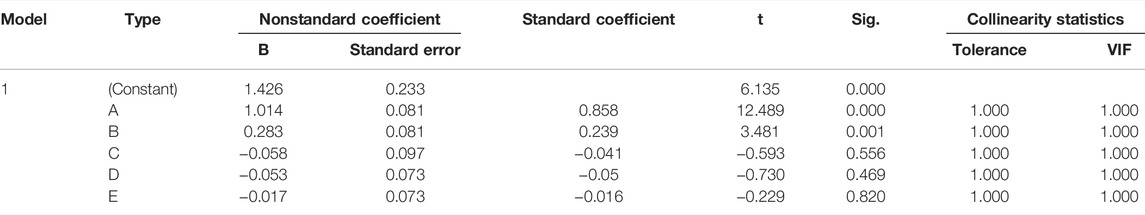
TABLE 7. Coefficient T-test.
It can be seen from Table 7 that the Sig coefficients of the roof thickness of the karst cave in front of the pile and the distance between the karst cave in front of the pile and the pile side are less than 0.05, indicating that these two factors are significantly and positively correlated with the horizontal ultimate load of the dependent variable. However, the Sig coefficients of the distance between the karst cave under the pile and the pile end, the height-span ratio of the karst cave in front of the pile, and the height-span ratio of the karst cave under the pile are larger, and the absolute values of coefficient
4) Standardized residual analysis
By examining the standardized residual histogram shown in Figure 6, it can be seen that although some of the sample residuals exceeded the normal curve, the overall residuals were basically in line with a normal distribution, indicating that the selected influencing factor data Xi matched the dependent variable Y and that the regression model was reasonable.
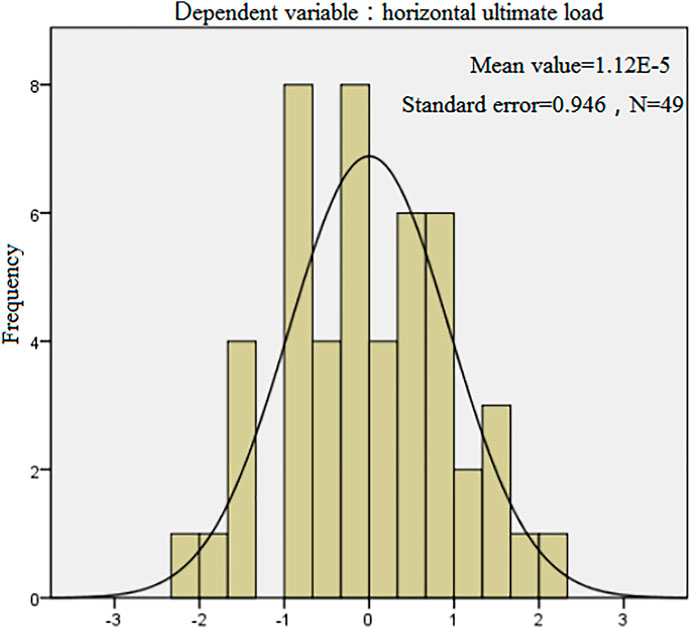
FIGURE 6. Standardized residual histogram.
5 Conclusion
In this paper, the ABAQUS finite element analysis software was used to carry out the simulated loading test of an anti-slide pile with karst caves located both under and in front of it. Through the simulations and accompanying analyses, the following conclusions are drawn:
1) From the results of the linear analysis, it can be seen that the roof thickness of the karst cave in front of the pile (X1) and the distance between the karst cave in front of the pile and pile side (X2) display significant correlation with the bearing capacity of the anti-slide pile, and, hence, are the main factors affecting the bearing capacity of the pile. In the range of values considered within this study, the larger the values of X1 and X2, the higher the bearing capacity of the pile.
2) When the karst cave under the pile is close to the pile end (<0.3 m) or the distance between the surfaces of the two karst caves is small (<0.2 m), the plastic strain of the two thinner rock masses here is high when the anti-slide pile is being loaded. These two thin rock masses will be destroyed first, which will lead to the instability of the anti-slide pile. In view of these two kinds of karst cave distributions, the karst cave should be treated first, and any construction should be carried out only after meeting the necessary stability requirements.
(3) The research conditions of this paper are relatively ideal. The use of the inferred formula needs to meet the appropriate conditions, such as the strength of the anti-slide pile itself must meet safety requirements, the structure inside the bedrock is complete except for the karst cave, the rock mass is uniform, no large joints or fissures have developed, and there is no other strong filler inside the karst caves. When there are many disadvantageous conditions, the calculated bearing capacity should be reduced, or further specialized studies need to be made.
Data Availability Statement
The original contributions presented in the study are included in the article/supplementary material, further inquiries can be directed to the corresponding author.
Author Contributions
This paper is completed by three authors. J-hL is responsible for experimental design and data analysis, Q-yF is responsible for providing overall ideas, and KQ is responsible for instrument operation.
Conflict of Interest
The authors declare that the research was conducted in the absence of any commercial or financial relationships that could be construed as a potential conflict of interest.
Publisher’s Note
All claims expressed in this article are solely those of the authors and do not necessarily represent those of their affiliated organizations, or those of the publisher, the editors and the reviewers. Any product that may be evaluated in this article, or claim that may be made by its manufacturer, is not guaranteed or endorsed by the publisher.
References
Chen, D., and Yi, C. (2017). Study on Roof Safe Thickness of Rock Foundation with Karst Cave and Karst Cave-Surrounding Rock Stability. IOP Conf. Ser. Mater. Sci. Eng. 224 (1), 012058. doi:10.1088/1757-899x/224/1/012058
Chen, L., and Wang, S. (1997). Elastic-Plastic Theory Analysis of Anti-slide Pile. Ind. Construction (07), 29–34. doi:10.13204/j.gyjz199707009
China Academy of Building Research (2016). Code for Design of concrete Structures (GB 50010-2010) (2015 Edition). Beijing: China Architecture & Building Press.
China Academy of Building Research (2014). Technical Code for Detection of Building Foundation Piles (JGJ106-2014). Beijing: China Architecture & Building Press.
Dai, Z., Chen, S., Xu, X., and Fei, Y. (2016). “Analysis of the Influence of the Beaded Karst on the Pile Additional Settlement,” in Proceedings of 2016 6th International Conference on Information Engineering for Mechanics and Materials(ICIMM 2016), Huhhot, Mongolia, July 30-31, 2016 (Computer Science and Electronic Technology International Society). doi:10.2991/icimm-16.2016.85
Fan, Q-Y. (2015). “Research on the Effect of Karst Caves on the Stability of Retaining Piles. Science and Engineering Research Center,” in Proceedings of 2015 International Conference on Applied Mechanics and Mechatronics Engineering(AMME 2015), Bangkok (Science and Engineering Research Center).
Han, J. (2019). Experimental Study on the Influence of Lower Karst Cave on the Stability of Anti-slide Pile. Nanning: Guangxi University.
Li, W. (2019). Experimental Study on the Influence of Karst Cave in Passive Zone on the Stability of Anti-slide Pile. Nanning: Guangxi University.
Liu, J., Chen, W., Nie, W., Yuan, J., and Dong, J. (2019). Experimental Research on the Mass Transfer and Flow Properties of Water Inrush in Completely Weathered Granite Under Different Particle Size Distributions. Rock Mech. Rock Eng. 52 (7), 2141–2153.
Liu, J., Chen, W., Yuan, J., Li, C., Zhang, Q., and Li, X. (2018). Groundwater Control and Curtain Grouting for Tunnel Construction in Completely Weathered Granite. Bull. Eng. Geol. Environ. 77 (2), 515–531.
Liu, J., Liu, C., Liu, X. Y., Wang, S., Yuan, H. L., Li, C. J., et al. (2021a). Prediction of Water–Mud Inrush Hazard from Weathered Granite Tunnel by an Improved Seepage Erosion Model. Bull. Eng. Geol. Environ. 80, 9249–9266. doi:10.1007/s10064-021-02480-3
Liu, J., Yuen, K. V., Ke, J. F., and Chen, W. (2021b). Developing a Prediction Model for Segment Joint Opening in an Underwater Shield Tunnel. Marine Geores. Geotechnol. doi:10.1080/1064119X.2021.2017528
Shaowei, W., Sui, Y., and Yang, J. (2019). Model Test Study on Slip Resistance of Circular and Rectangular Cross Section Anti-slide Pile. Rock Soil Mech. 40 (03), 951–961. doi:10.16285/j.rsm.2017.1807
Suleiman, M. T., Ni, L., Helm, J. D., and Raich, A. (2014). Soil-Pile Interaction for a Small Diameter Pile Embedded in Granular Soil Subjected to Passive Loading. J. Geotechnical Geoenvironmental Eng. doi:10.1061/(ASCE)GT.1943-5606.0001081
Wang, G. J., and Zhang, Y. (2012). Work Mechanisms of Pile Foundation in the Karst Region. Amm 170-173, 88–92. doi:10.4028/www.scientific.net/amm.170-173.88
Wang, Q. (2014). Study on the Influence of Karst Cave on the Stability of Supporting Pile. Nanning: Guangxi University.
Wang, S., Chen, L., and Zhang, J. (1997). Elastoplastic Theory Analysis of Anti-slide Pile (Ⅱ). J. Xi'an Univ. Architecture Tech. (Natural Sci. Edition) (04), 74–77.
Keywords: karst cave, anti-slide pile, numerical simulation, orthogonal test, multiple linear regression
Citation: Liang J-h, Fan Q-y and Qin K (2022) Influence of Karst Caves on the Pile’s Bearing Characteristics-A Numerical Study. Front. Earth Sci. 9:754330. doi: 10.3389/feart.2021.754330
Received: 06 August 2021; Accepted: 17 December 2021;
Published: 06 April 2022.
Edited by:
Jinquan Liu, University of Macau, ChinaReviewed by:
Zhipeng Qi, Chang’an University, ChinaZhiyong Zhang, East China University of Technology, China
Copyright © 2022 Liang, Fan and Qin. This is an open-access article distributed under the terms of the Creative Commons Attribution License (CC BY). The use, distribution or reproduction in other forums is permitted, provided the original author(s) and the copyright owner(s) are credited and that the original publication in this journal is cited, in accordance with accepted academic practice. No use, distribution or reproduction is permitted which does not comply with these terms.
*Correspondence: Qiu-yan Fan, fan161513@163.com