Recent Evolution of Glaciers in the Manaslu Region of Nepal From Satellite Imagery and UAV Data (1970–2019)
 Adina E. Racoviteanu1,2*
  Neil F. Glasser1
  Benjamin A. Robson3
  Stephan Harrison2 Romain Millan4
  Rijan B. Kayastha5
  Rakesh Kayastha5
- 1Department of Geography and Earth Sciences, Aberystwyth University, Aberystwyth, United Kingdom
- 2Department of Geography, University of Exeter, Exeter, United Kingdom
- 3Department of Earth Science, University of Bergen, Bergen, Norway
- 4Institut de Géosciences de L’Environnement, Grenoble, France
- 5Department of Environmental Science and Engineering, Kathmandu University, Dhulikhel, Nepal
Glacierized mountain ranges such as the Himalaya comprise a variety of glacier types, including clean and debris-covered glaciers. Monitoring their behaviour over time requires an assessment of changes in area and elevation along with surface features and geomorphology. In this paper we quantify the surface evolution of glacier systems in the Manaslu region of Nepal over the last five decades using 2013/2019 multi-sensor imagery and elevation data constructed from 1970 declassified Corona imagery and 1970 declassified Corona imagery. We investigate area changes, glacier thickness, geodetic glacier mass balance and surface velocity changes at regional scales and focus on the Ponkar Glacier and Thulagi Glacier and Lake for an in-depth assessment of surface geomorphology and surface feature dynamics (ponds, vegetation and ice cliffs). The time series of surface elevation changes for the lower ablation area of Ponkar Glacier is extended using 2019 UAV-based imagery and field-based ablation rates measured over the period 2016–2019. Glaciers in the Manaslu region experienced a mean area loss of −0.26 ± 0.0001% a−1 between 1970 and 2019. The mean surface lowering was −0.20 ± 0.02 ma−1 over the period 1970 to 2013, corresponding to a regional geodetic mass balance of −0.17 ± 0.03 m w. e.a−1. Overall, debris-covered glaciers had slightly higher thinning rates compared to clean ice glaciers; lake-terminating glaciers had double thinning rates compared to land-terminating glaciers. Individual glacier mass balance was negatively controlled by glacier slope and mean glacier elevation. During the period 1970 to 2013, Ponkar Glacier had a geodetic mass balance of −0.06 ± 0.01 m w. e.a−1, inversely correlated with parts of the central trunk thickening. Between 2013 and 2019 there was a nine-fold increase in the thinning rates over the lower parts of the glacier tongue relative to the period 1970–2013. Ice-surface morphology changes between 1970 and 2019 on Ponkar Glacier include a decrease in ogives and open crevasses, an increase in ice cliffs and ponds and the expansion of the supraglacial debris and ice-surface vegetation. These changes point to reduced ice-dynamic activity and are commensurate with the observed recession and negative glacier mass balance over the last five decades.
Introduction
Supraglacial debris cover is a prominent feature of glaciers in high, rugged relief orogenic belts including the Hindu Kush Himalaya (Kääb et al., 2012), the Tien Shan (Hagg et al., 2008), Caucasus (Stokes et al., 2007; Tielidze et al., 2020), Alaska (Berthier et al., 2010), New Zealand (Anderson and Mackintosh, 2012; Anderson B. et al., 2021) and to a smaller extent in parts of the Andes (Racoviteanu et al., 2008) and the European Alps (Smiraglia et al., 2000; Deline, 2005). Globally, however, supraglacial debris cover only accounts for a small percentage (∼4–7%) of the global glacierized area (Scherler et al., 2018; Herreid and Pellicciotti, 2020). Debris material generally originates from rock and snow avalanches from the steep surrounding valley slopes, melt-out of englacial debris due to subglacial erosion processes (Jansson and Fredin, 2002), or collapsing lateral or terminal moraines (Hambrey et al., 2008; Kirkbride and Deline, 2013; Rowan et al., 2015). The high denudation rates characteristic of rugged environments favour the accumulation and transport of large quantities of rock debris to the glacier surface (Kirkbride, 2011), creating debris-covered glacier tongues up to a few tens of kilometres long such as Baltoro Glacier (62 km) in the Karakoram (Mihalcea et al., 2006) or Ngozumpa Glacier (∼20 km) in Nepal Himalaya (Rowan et al., 2020). Despite its small global extent, supraglacial debris plays an important role in the mass balance of glaciers and their future behaviour, and for this reason it has gained increasing attention in recent decades. One area of concern is currently the fast development of supraglacial lakes in certain areas of the Himalaya, and the potential implications of this for water resources and glacier hazards, notably glacier lake outburst floods (GLOFs).
Supraglacial debris cover controls the ice melt underneath the debris layer (Benn and Evans, 1998; Kayastha et al., 2000; McCarthy et al., 2017) i.e. a thin debris layer initially increases rates of ice-surface melt (Østrem, 1975) but for a thick debris layer, the insulating effect dominates (Nicholson and Benn, 2006). Understanding the ablation rates associated with debris-covered glaciers is important for predicting the melt rates from glacierized regions and estimating their contribution to sea-level rise with climate change (Scherler et al., 2011; Shannon et al., 2019; Immerzeel et al., 2020). Recent studies based on satellite imagery have shown an upwards expansion of the supraglacial debris cover upwards in several regions (Mölg et al., 2019; Tielidze et al., 2020; Xie et al., 2020), associated with the stagnation of the glacier fronts and glacier surface velocity slowdown (Dehecq et al., 2019). Furthermore, in the last decade, several studies reported similar thinning rates and mass loss for debris-covered and clean ice glaciers (Bolch et al., 2012; Gardelle et al., 2012; Kääb et al., 2012; Brun et al., 2017). At the glacier scale, ephemeral features such as bare ice cliffs and supraglacial ponds play an important role in the ablation of debris-covered glaciers by enhancing local ablation (Brun et al., 2016; Miles et al., 2018b; Irvine-Fynn et al., 2017). However, field-based studies reveal important local variability in the role of these supraglacial features for ice melt rates. For example, the insulating effect still dominates on many debris-covered glaciers such as Changri Nup Glacier in Nepal Himalaya) (Vincent et al., 2016; Brun et al., 2018; Anderson et al., 2021). These supraglacial features are also extremely dynamic. Ice cliffs are high–relief, bare-ice areas that are commonly visible as vertical or near-vertical ‘scars’ on the surface of debris-covered glaciers (Sakai et al., 2002; Steiner et al., 2015; Buri et al., 2016; Buri et al., 2021). Supraglacial ponds are seasonal, i.e., they emerge during the monsoon season (Miles et al., 2018a); some can disappear through intra-glacial conduits (Gulley et al., 2009) or re-emerge in the same location (Taylor et al., 2021). Others persist between seasons and coalesce to form larger supraglacial lakes which may evolve into fully-formed proglacial ice and/or moraine-dammed lakes (Benn et al., 2012; Thompson et al., 2012) with a potential to create GLOF events (Richardson and Reynolds, 2000; Komori, 2008; Benn et al., 2012; Reynolds, 2014; GAPHAZ, 2017). Increasing trends of pond development of 17–52% a−1 have been reported for the last few decades, for example in the Khumbu region of Nepal Himalaya (Watson et al., 2016; Chand and Watanabe, 2019). Such trends are consistent with the reported proglacial lake and supraglacial pond increase and over the entire Himalaya (Nie et al., 2017). Quantifying the evolution of these features has been the focus of several studies (Watson et al., 2016; Watson et al., 2017a; Miles et al., 2017; Steiner et al., 2019), but these remain biased towards well-studied regions such as the Khumbu and Langtang regions in the Nepal Himalaya.
The role of glacier morphology in controlling glacier behaviour has been demonstrated in recent Himalayan studies (Salerno et al., 2017; Brun et al., 2019), but features such as supraglacial vegetation on debris-covered glaciers have not received much attention. It has been shown that supraglacial vegetation has been expanding on the surface of debris-covered glaciers (Fickert et al., 2007; Tampucci et al., 2016; Anderson et al., 2020), but studies on this topic remain scarce. Comprehensive assessments of surface geomorphology, supraglacial pond coverage, moraine characteristics and vegetation are still needed. Understanding the fluctuations of these surface characteristics is important, as they may indicate the transition from a debris-covered glacier to a rock glacier which has been hypothesised as an evolutionary response for at least some glaciers under climate change (Shroder et al., 2000; Monnier and Kinnard, 2017; Jones et al., 2019; Knight et al., 2019). With the exception of a few studies (Watson et al., 2016; Watson et al., 2017a; Watson et al., 2017b; Miles et al., 2017; Steiner et al., 2019; Taylor et al., 2021), significant gaps remain with respect to the evolution of these supraglacial features, particularly over decadal time scales. Despite the increasing emergence of remote sensing large-scale studies, automated workflows and big data (Brun et al., 2017; Dehecq et al., 2020; Rounce et al., 2021), small scale studies that combine remote sensing with field observations remain crucial and complementary for understanding the intra-regional variability in the behaviour of debris-covered glaciers.
The aim of our study is to fill the gap in a poorly studied area of the Nepal Himalaya—the Manaslu region of the central Himalaya, comprising both clean and debris-covered glaciers. In a previous study, Robson et al. (2018) investigated area and elevation changes in this region from 1962 to 2013 using Corona declassified imagery and medium resolution Landsat data (30 m). In this study, we use new, freely available high-resolution Planet images (3–5 m), a better coverage of Corona 1970 data and 2019 UAV data acquired in the field to update and expand the existing study and to characterize the surface and evolution of glaciers in the Manaslu region over the last five decades. This complements the existing Robson et al. (2018) study by providing higher quality datasets to investigate area and surface elevation changes, geodetic glacier mass balance, surface velocity changes, and structural changes. We illustrate these changes at the local scale by comparing and contrasting the evolution of two debris-covered glaciers in this region: Ponkar Glacier, which has been studied in the field since 2016 (Shrestha et al., 2020) and Thulagi Glacier and Lake, which have been described in the context of GLOFs (Pant and Reynolds, 2000; Haritashya et al., 2018). Field-based ablation measurements on Ponkar Glacier provide opportunities for validating the remote sensing methods. By combining various methodologies and data sources, our study complements and expands the existing records on these glaciers and assesses the spatial representativeness of the dynamics observed on these two glaciers. Our study provides an example of an integrated assessment of a glacier system, and how it can be nested within a regional scale analysis.
Study Area
Our study focuses on the Manaslu region (1,971 km2), situated in the headwaters of the Dudh Khola in the Manang district, Gandaki Province of Nepal (Figure 1). The study area is located in the central Himalaya region as defined in previous studies (Bolch et al., 2012). Climatically, this region is located at the boundary between the Indian summer monsoon in the south west and the drier areas of the Tibetan plateau in the north (Yanai et al., 1992; Benn and Owen, 1998). The last major glacier advance in this area was probably in the Little Ice Age (LIA) (Rowan, 2017), with the peak of moraine building between 1,300 and 1600 CE, slightly earlier than the coldest period of the Northern Hemisphere (Rowan, 2017) and earlier than several regions in the Southern Hemisphere (Solomina et al., 2015). The area comprises various types of glaciers, with a mix of clean glaciers, debris-covered glaciers, lake-terminating glaciers (Robson et al., 2018) and rock glaciers. A small number of glaciers in our study area are located across the topographic divide in Tibet and are discussed separately in the text. The southern part of our study area (627 km2) was investigated in a previous study (Robson et al., 2018). The study area also comprises Thulagi Glacier and Thulagi Lake. The latter is a proglacial moraine-dammed lake surveyed in the field as well as by remote sensing with regards to its hazard potential (Haritashya et al., 2018).
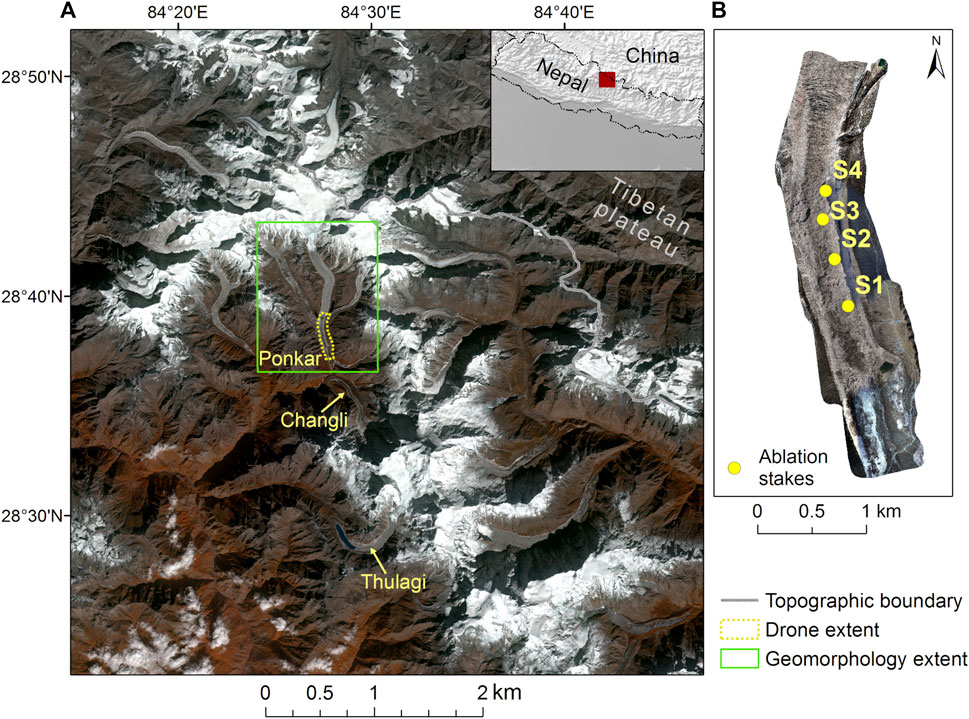
FIGURE 1. Location map of the Manaslu study area, located in the Gandaki Province of Nepal (A) False colour composite (bands 5,4,3) of RapidEye satellite image acquired on November 20th, 2019 showing the glaciers discussed in the text; (B) Orthophoto from of the UAV survey (dashed yellow polygon in (A)). The green rectangle shows the extent of the geomorphology analysis on Ponkar Glacier (see Figure 8).
For the study of in-depth geomorphology and glacier surface changes with UAV measurements, we focused on the largest glacier system in the study area, Ponkar Glacier (28˚37′49″ N; 84˚28′14″ E). The glacier has three tributaries (Kechakyu Khola, Ponkar and Salpudanda) (Figure 1A) (Sapkota et al., 2016; Shrestha et al., 2020). The estimated average glacier thickness is ∼134 m (Bajracharya et al., 2014), with a median elevation of 5,872 m a.s.l. and a terminus elevation of 3,651 m a.s.l. in 2019. The lower part of the tongue comprises large patches of mature supraglacial vegetation. We chose this glacier due to the relatively easy accesses as well as the field measurements initiated in the last 8 years in this area.
Methodology
Satellite Data
Our analysis spans the periods 1970–2013 and 2013–2019, corresponding to two spatial scales (regional/local). Satellite data used for the various time steps are summarized in Table 1. For the 1970s decade, we obtained declassified imagery from the Corona KH-4B mission (Dashora et al., 2007). Corona KH-4B satellites acquired data from September 1967 and May 1972 using a pair of counter-rotating panoramic cameras with a 30° separation angle (one camera tilted 15° forward and one 15° backwards), yielding stereo imagery (Dashora et al., 2007). We obtained three stripes of stereo images from the mission 1,112 acquired on Nov 19, 1970. This date corresponds to the end of the ablation season in this part of the Himalaya (Oct/Nov). Image stripes were scanned at 7 microns directly from the original film stripes and USGS; the digital scans were obtained at no cost from the US Geological Survey (https://earthexplorer.usgs.gov). The scenes were cloud-free over the glaciers.
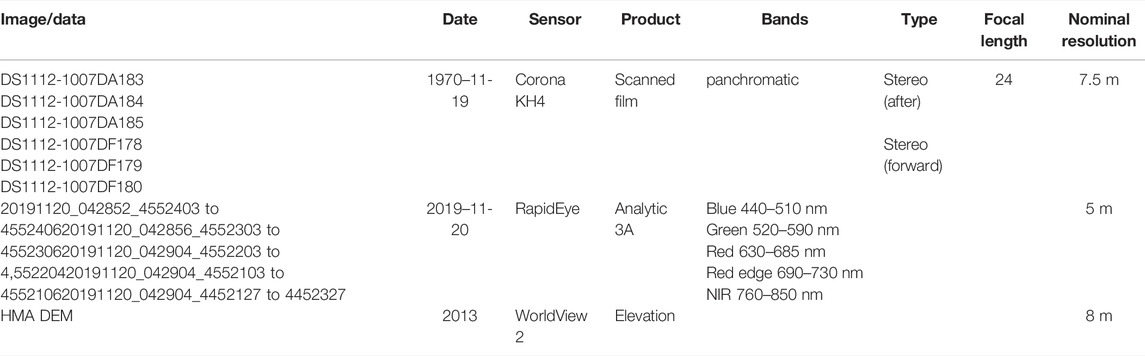
TABLE 1. Satellite data used in this study and their characteristics.
For the recent time period, we obtained high-resolution images stripes at 5 m from Planet’s RapidEye constellation (Planet_Labs, 2021). RapidEye consists of multispectral data (five spectral bands in the visible and near infrared) with a spatial resolution of 6.5 m on the ground and a positional accuracy of <10 m (Table 1) (Planet Labs, 2016). We used Level 3A data, which consist in stripes of multispectral, radiometrically corrected orthotiles processed at 5 m spatial resolution. These represent surface reflectance computed using at-sensor radiance based on the 6S radiative transfer model (Vermote et al., 1997) and MODIS data, which accounts for atmospheric effects (Planet Labs, 2021). We mosaicked these using nearest neighbour to output a single image covering our study area (Figure 1A). The Nov 20, 2019 image was cloud-free and was acquired at the same time of the year as the Corona data (Nov 19, 1970) and a few days after our field campaign (Nov 12–16th, 2019). The 2019 image had some seasonal snow outside the glaciers in some areas, so we used a second scene from Oct 20, 2015 to refine the glacier extents around rock outcrops and debris cover, and to eliminate seasonal snow.
The High Mountain Asia (HMA) DEM at 8 m spatial resolution (Shean, 2017) was chosen as reference to represent the modern glacier surface for the 2010s decade. The HMA DEM tiles are generated from very high-resolution satellite imagery from Digital Globe Inc., from 2002 to 2016, processed using the NASA AMES Stereo Pipeline as described in Shean et al. (2016). We obtained six DEM tiles derived from along-track Worldview two imagery from the NSIDC DAAC High Mountain Asia (HMA) collection (https://nsidc.org/data/highmountainasia) with dates ranging from November 16, 2013 to November 25, 2013. Although DEM tiles were available from subsequent years, the coverage of the study area was incomplete and in particular large voids were present over some of the glacier accumulation areas. The geolocation accuracy of the HMA DEM is estimated at < 5 m, with relative vertical errors of 1–2 m. Larger uncertainties occur due to clouds, steep slopes image saturation and/or correlation failures (Shean et al., 2016). We also obtained the ALOS Global Digital Surface Model (AW3D30) version 2.2 (30 m) (JAXA, 2019), constructed from data acquired from 2006 to 2011. The vertical accuracy of this dataset is estimated at ∼10 m in Eastern Nepal (Tadono et al., 2014). The AW3D30 DEM was used as regional elevation reference for ground control points in the Corona DEM extraction process (see section Corona DEM Generation and Co-Registration).
Field Data
In November 2019, we conducted a UAV survey of the lower ablation area of Ponkar Glacier (∼4 km2, 3,646–4,238 m a.s.l.) (Figure 1B) using two DJI Phantom four Pro UAVs, with an 80% forward and 70% side overlap, covering an area of 3.36 km2. A total of 1,110 images were orthorectified using nine ground control points (GCPs) and were processed using a dense stereo matching algorithm in Pix4D Mapper software to produce a 0.50 m orthoimage and 1 m DEM. The accuracy of the orthorectification process was estimated as 1 m horizontally and <1.5 m vertically (2 and 3 times the ground sampling distance, respectively). Both the orthoimages and the resulting DEM were used to refine the geomorphological mapping (see section Mapping of Supraglacial and Geomorphological Features).
The lower ablation area of Ponkar Glacier has been surveyed in the field for mass balance and hydro-geochemical studies since 2016 (Shrestha et al., 2021). Ice ablation measurements on the lower area of Ponkar Glacier have been carried out yearly from 2016 to 2019. A Kovacs hand driller was used to drill the debris-covered ice up to 2.5 m to install the ablation stake at four locations under different debris thicknesses ranging from 11 to 20 cm. Four stakes (Stakes 1–4) were installed in March 2016 and resurveyed in different dates during field trips from 2016 to 2019. Their locations are shown on Figure 1B and their are characteristics listed in Table 2.
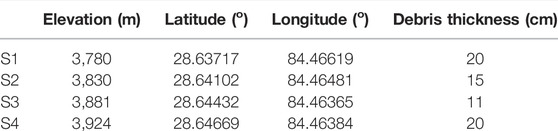
TABLE 2. Location of the ablation stakes on the lower part of the Ponkar Glacier, shown on Figure 1B.
Glacier Mapping and Auxiliary Data
Glacier outlines for the year 1970, including debris cover, were delineated using on-screen manual digitization complemented with image thresholding from the Corona panchromatic image. Shaded relief terrain derived from the 1970 Corona DEM was used to identify rock outcrops. The low contrast of the black and white Corona image made it difficult to distinguish ice from snow in a few areas. Therefore, Corona outlines were compared with the ICIMOD inventory (Mool et al., 2002), which was constructed by manual mapping on topographic maps at 1:50,000 scale published in the 1950s–1970s by the Survey of India (Survey of India, 2005). The latest glacier inventory in this area is the GAMDAM glacier inventory (Sakai, 2019), constructed based on semi-automated mapping from Landsat imagery and manual editing. However, most of the GAMDAM glacier outlines in our study area dated from 1994, except for those in the northern part (China) which dated from 2010, and were thus not suitable for analysis. For the year 2019, glacier outlines were derived by manual digitization on the RapidEye image; areas of seasonal snow were removed manually. When glaciers disconnected or disintegrated, we counted them as special glacier entities as per guidelines established by the Global Land Ice Measurements from Space community (Raup and Khalsa, 2007; Racoviteanu et al., 2009). Debris-covered glacier sections were cross-checked visually against high-resolution SPOT imagery from Oct 24, 2019 visible on the Google Earth platform. For both the 1970 and 2019 time steps, ice divides were constructed on the basis of the AW3D30 DEM complemented with the HMA DEM using the buffer method (Granshaw and Fountain, 2006; Bolch et al., 2010). These were kept constant for the two time steps to facilitate the glacier change detection analysis and to minimize uncertainties related to differences in the upper part of the accumulation area. Rock outcrops were delineated for 1970 and 2019 separately.
We calculated glacier surface slope, mean altitude, and altitudinal range for all the glaciers in the study area based on the AW3D30 DEM (for the regional trends) and the HMA DEM (for the in-depth study on Ponkar Glacier). We also calculated glacier surface velocities in the Manaslu region using a combination of Sentinel-2 and Landsat-8 imagery, following Millan et al. (2019). The ice velocity maps were calculated using a feature tracking algorithm on all possible image pairs, with repeat cycles ranging from the sensor nominal repeat cycle (i.e., 5 days for Sentinel-2, 16 days for Landsat-8) up to more than a year (Millan et al., 2019). Ice velocity mosaics are finally assembled at a sampling resolution of 50 m, by computing a pixel-by-pixel weighted average (Millan et al., 2019). We also obtained yearly velocity data from 2000 to 2017, generated using auto-RIFT (Gardner et al., 2018) and provided by the NASA MEaSUREs ITS_LIVE project (Gardner et al., 2019).
Corona DEM Generation and Co-registration
The Corona image stripes were set up as a single block file in ERDAS IMAGINE Photogrammetry Suite (ERDAS, 2010) using the UTM projection system (zone 45N), with WGS84 vertical and horizontal datums. Since Corona parameters are not available, we used a non-metric camera model based on the actual flying height, focal length and the nominal scale of the photos (Table 1). The interior and exterior orientation of the stripes were solved in the aerial triangulation step using Ground Control Points (GCPs) and Tie Points (TPs). For the northern part of the study area (four stereo image stripes), TPs were generated automatically in ERDAS IMAGINE Photogrammetry and were complemented with manually generated points. This resulted in a total of 3,047 TPs with a mean uncertainty of 6.6 m and a standard deviation of 9.1 m. A total of 255 GCPs were manually digitized on stable terrain from the RapidEye scene and identified on each of the stereo image stripes. Elevations of the ground control points were extracted from the AW3D30 DEM. The total root mean square error for the triangulation (RMSE) was 1.9 pixels, with ground x, y and z accuracy of 14.9, 11.2 and 19.3 m, respectively. Point clouds were generated using the Dense Point Matching with the Enhanced Automatic Terrain Extraction (eATE) in ERDAS Imagine Photogrammetry module using the Normalized Cross-Correlation routine with a 9 × 9 window size, spike interpolation setting to remove extreme values and a point threshold of 2.5 (number of points for interpolation). No filtering was applied to the point clouds. For the southern part of the study area where Thulagi Glacier is located, two 1970 image stripes had been processed similarly in a previous study (Robson et al., 2018) using 75 GCPs and 1837 tie points with a RMSEz <5 m. To extract the DEMs, we utilised both the eATE routine in ERDAS and PCI Geomatica. Each DEM was extracted as a point cloud which was then gridded using a finite difference interpolation method with 10 iterations within Geomatica Banff (PIC Geomatics Inc., 2020).
Two DEMs were produced: one for the northern stereo pairs, and one for the southern stereo pairs. Each DEM was co-registered independently before being mosaiced together. The DEM co-registration was performed in a two-step process using the Numpy and ArcPy python packages. Linear co-registration biases were removed using the method outlined by Nuth and Kääb (2011) which minimizes the root mean square residuals of the elevation bias over stable (i.e non-glacial) terrain. Terrain with slope values less than 10o and greater than 40o was excluded. The co-registration was repeated iteratively until the mean elevation bias over stable terrain decreased by <2%. In both cases, this led to the process being run 8 times. Corona imagery contains significant panoramic lens distortions which can result in non-linear elevation biases of up to 20 m (Bolch et al., 2011; Robson et al., 2018). These elevation biases were removed by fitting a sixth order polynomial for along track and third order for across track and elevation to the stable terrain elevation biases (Figure 2). A summary of the co-registration shifts is given in Table 3. The process was iterated a total of six times until no noticeable trend in stable ground polynomials was visible. The co-registered surface elevation rasters were then mosaicked together to one file. The same co-registration routine was applied to co-register the 2019 UAV data to the 2013 DEM with the linear-co-registration being repeated four times and the non-linear co-registration repeated three times.
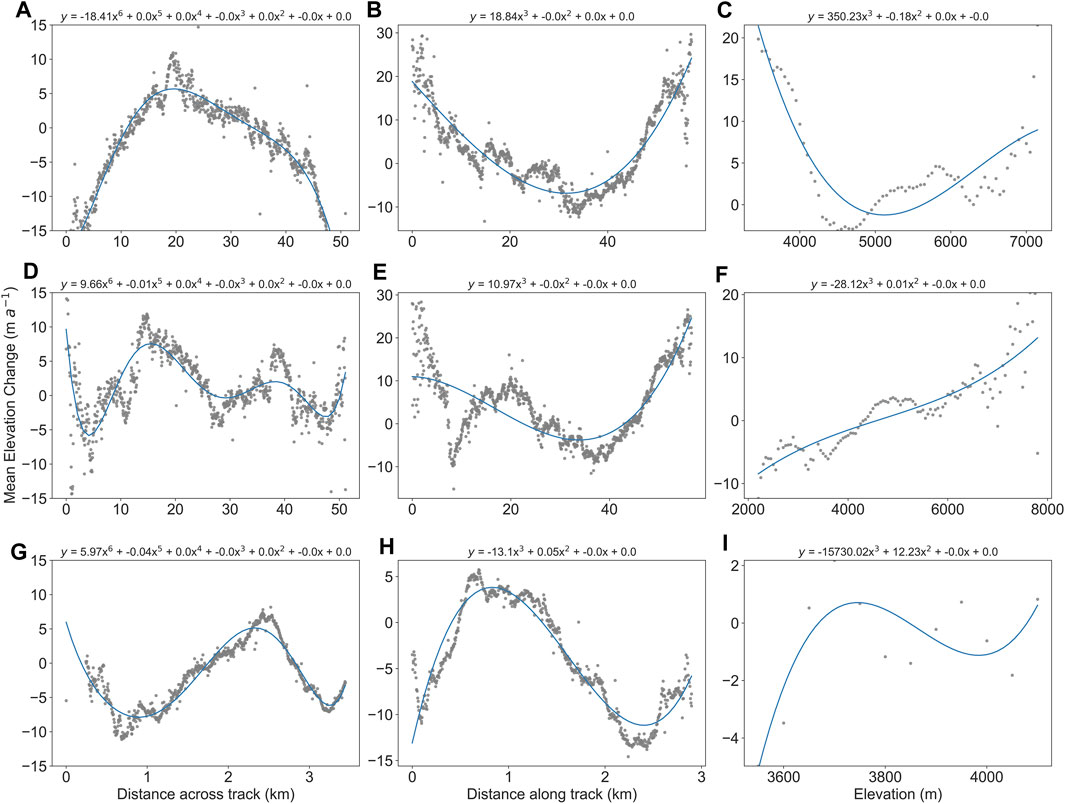
FIGURE 2. Non-linear elevation biases over stable (non-glacierized) terrain. The top two rows show biases between the 2013 HMA DEM and the 1970 Corona DEM for the Northern DEM (A–C) and the Southern DEM (D–F). The bottom row shows the elevation biases between the 2019 UAV DEM and the 2013 HMA DEM for the lower part of Ponkar Glacier (G–I). From left to right, graphs represent: across track biases, along track biases and vertical biases, respectively. The blue lines show the polynomials used to remove non-linear co-registration biases (sixth-order for the across-track, and third-order for along-track and elevation biases.
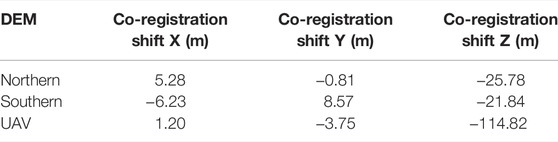
TABLE 3. Summary of the co-registration shifts for the northern and southern parts of the study area, corresponding to the Corona stripes and the UAV DEM.
Geodetic Methods
Surface elevation changes and the resulting geodetic mass balance were computed at two time steps for the two spatial domains using the geodetic (DEM differencing) method (Berthier et al., 2004). For the large spatial domain (Manaslu region), we used the 1970 Corona DEM and the 2013 HMA DEM. For the smaller domain (the lower area of Ponkar Glacier), we used the 2013 HMA DEM and the 2019 UAV data. DEMs were subtracted on a cell-by-cell basis for each of the time periods. For both periods, the elevation difference rasters resulting from the co-registration and mosaicking were cleaned using the method set out by Gardelle et al. (2013) where the mean surface elevation change per 50 m altitudinal band was calculated. Any pixels that were not within three standard deviations of the mean value were excluded. Voids were filled by fitting third-order polynomials to the mean elevation change per 50 m altitudinal band, after McNabb et al. (2019). A uniform glacier ice density of 850 ± 60 kg m−3 (cf. Huss, 2013) was used to convert volume changes into mass changes for the geodetic mass balance calculation.
Mapping of Supraglacial and Geomorphological Features
We mapped the glacier surface features and associated geomorphology in 1970 and 2019 at the local scale (Ponkar Glacier). Ice-surface features mapped included glacier flow units, crevasses and ogives; mapped landforms included terminal and lateral moraines and large areas of outwash which complement the glacier extents. These were mapped manually using on-screen digitization on the Corona and RapidEye images on the basis of standard criteria for identifying and mapping ice-structural and glacial landforms (adapted from Glasser et al., 2005) and Goodsell et al. (2005)) (Table 4). Surface features (ice cliffs, supraglacial ponds and ice-surface vegetation) were mapped from Corona and RapidEye scenes using an image segmentation workflow implemented in the ENVI Feature Extraction Module (Harris Geospatial, 2017). This consisted in applying an edge algorithm to identify the pond, ice cliffs and vegetation segments using a texture kernel size of 3 pixels. Segments were merged manually to prevent over-segmenting and to combine different segments into one pond, ice cliff or vegetation patch.
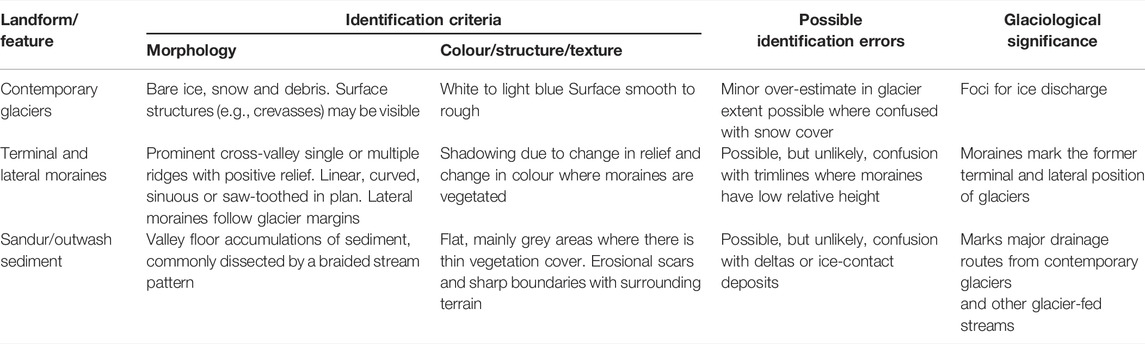
TABLE 4. Criteria used in geomorphological mapping to identify ice-surface and proglacial landforms. Adapted from Glasser et al. (2005).
Uncertainty Estimates
The uncertainty of the elevation change was calculated based on the method set out by Falaschi et al. (2019). The uncertainty of the volume change (
Where the standard error (
N is calculated using the number of pixels (Ntot) in the DEM differencing, the pixel size (PS), and the distance of spatial autocorrection, which following Bolch et al. (2011) we took to be equal to 20 pixels:
In addition to
Surface elevation change raster data tends to contain data voids over steep or shadowed terrain, as well in areas of low image contrast. The polynomial fit used to interpolate each glacier was inspected, and any glacier where the fit was poor was not included in the analysis of surface change. In the absence of comparable in-situ data, we estimated DEM uncertainties in the based on the literature combined with biases measured over the stable terrain using a conservative approach. Magnusson et al. (2016) demonstrated that such techniques typically overestimate uncertainties as they neglect the spatial dependence of DEM errors.
Uncertainties in the 1970 and 2019 glacier areas and geomorphology units were determined using the buffer method (Granshaw and Fountain, 2006; Pekel et al., 2016; Paul et al., 2017). This consists of applying a buffer inside and outside the glacier polygons and calculating the standard deviation as an uncertainty estimate. Following the method of Granshaw and Fountain (2006), we used ∼½ of the RMSE of the geolocation errors of both images for the size of the buffer (5 m buffer for RapidEye and 6.5 m buffer for Corona). Geolocation errors were calculated as the RMSE of each satellite image orthorectification. The uncertainty of the area change analysis was estimated as the RMSE of the two error uncertainties (1970 and 2019). The error of the supraglacial vegetation was estimated using a ½ pixel buffer (1 and 2.5 m for Corona and RapidEye images, respectively). For ice cliffs and ponds mapping, we used uncertainty values from Steiner et al. (2019) study also based on manual digitization of high resolution imagery. The uncertainty in the glacier terminus recession was estimated using two RapidEye 2 pixels and 5 Corona pixels.
Results
Regional Glacier Changes in the Manaslu Region
Area Changes 1970–2019
Mapping of the 1970 glacier extents from Corona imagery yielded 212 glaciers (177 clean ice glaciers and 35 debris-covered glaciers), ranging in area from 0.005 ± 0.0001 km2 to 49.5 ± 1.0 km2, with a total area of 610.1 ± 12.8 km2 (Table 5). For 2019, based on RapidEye imagery, we mapped 274 glaciers (239 clean ice and 35 debris-covered glaciers), ranging in area from 0.002 ± 0.0001 km2 to 46.7 ± 1.3 km2 and a total area of 531.6 ± 14.4 km2. Some glaciers fragmented or detached from the main glacier by 2019, resulting in a higher number of glacier entities in 2019. Of the total glacierized area, 35 glaciers had debris cover in the lower part of their ablation areas. In 2019, the area of the supraglacial debris cover was 73 ± 2 km2 (13.6% of the total glacierized area), which is 3.5 km2 larger than the area obtained based on the Herreid and Pellicciotti (2020) dataset for the same extent. Out of the 35 debris-covered glacier entities mapped, 24 overlapped with Herreid and Pellicciotti (2020); we mapped 11 additional debris-covered glacier entities based on the RapidEye image.
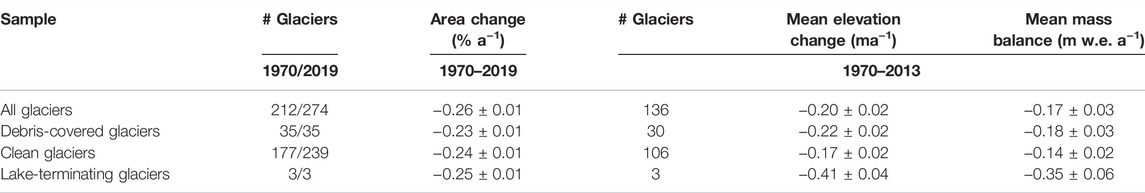
TABLE 5. Summary of area changes (1970–2019) and elevation changes (1970–2013) over the entire domain for all the glaciers and for the various types of glaciers.
The total glacierized area in the Manaslu region reduced by 78.5 ± 2.7 km2 (−12.9 ± 0.4%) from 1970 to 2019, at a mean rate of −1.6 ± 0.05 km2 a−1 (−0.26 ± 0.01% a−1). The 35 debris-covered glaciers lost 46.1 ± 1.6 km2 (−11.4 ± 0.4%) of their area from 1970 to 2019 (a mean rate of −0.23 ± 0.01% a−1). The remaining clean ice glaciers (177 glaciers in 1970 and 239 in 2019) lost 22.9 ± 0.8 km2 (−11.6 ± 0.4% of their area), at a rate of −0.24 ± 0.01% a−1, similar to that of debris-covered glaciers. We identified three glaciers that terminated in a proglacial lake both in 1970 and 2019. The glacierized area of these glaciers reduced by 12% from 1970 to 2019 (−0.25 ± 0.01% a−1). The 19 glaciers located north of the topographic divide (on the Tibetan plateau) lost 10.1 ± 0.3 km2 from 1970 to 2019 (−12 ± 0.4% of the glacierized area, or −0.24 ± 0.01% a−1). All of these glaciers except two are clean glaciers, and they exhibit rates of area loss similar to the entire domain. Glacier median elevation over the entire domain shifted from 5,729 m a.s.l in 1970 to 5,800 m. a.s.l. in 2019, a rise of +72 m over five decades. Similarly, the elevation of glacier termini rose from 3,118 m a.s.l to 3,265 m a.s.l in 2019, a +147 m upward shift. The maximum elevation of glaciers in the domain was 8,057 m a.s.l. in 2019.
Surface Elevation Changes and Mass Balance (1970–2013)
Here we present surface elevation changes for the 136 glaciers (a surface of 512.2 km2, or 84% of the 1970 glacierized area) which had sufficient elevation change data to determine geodetic mass balances and mean surface lowering rates. A total of 76 glaciers were excluded from the surface change analysis due to data voids. Glaciers in the Manaslu region exhibited a mean surface lowering of −0.20 ± 0.02 ma−1 between 1970 and 2013 (Table 5 and Figure 3), corresponding to a mean geodetic mass balance of −0.17 ± 0.03 m w. e.a−1. On average, debris-covered tongues thinned at the rate of −0.22 ± 0.02 ma−1 (−0.18 ± 0.03 m w. e.a−1), a slightly higher rate than clean ice glaciers (−0.17 ± 0.02 ma−1, −0.14 ± 0.02 m w. e.a−1) (Table 5). The three lake-terminating glaciers had a double thinning rate and mass balance (−0.41 ± 0.04 ma−1, −0.35 ± 0.06 m w. e.a−1) compared to the regional average (Table 5). Individual average thinning rates and mass balance of the clean ice glacier sample (n = 106) and debris-covered glaciers (n = 30) were statistically significant based on the two independent sample Welch’s t-test (Welch, 1947) (90% confidence level, p-value < 0.10). Individual glacier mass balances ranged from −0.56 ± 0.16 m w. e.a−1 to +0.35 ± 0.07 m w. e.a−1. Thirty glaciers had positive or approximately in balance geodetic mass balances between 1970 and 2013, all of which were situated at high elevations (>6,000 m a.s.l.). Mean glacier-by-glacier average thinning rates exhibit a slight southwest to northeast pattern, with negative thinning rates increasing at the rate of 0.003 ma−1 per 1 km in the longitude direction and 0.002 ma−1 per 1 km in the latitude direction.
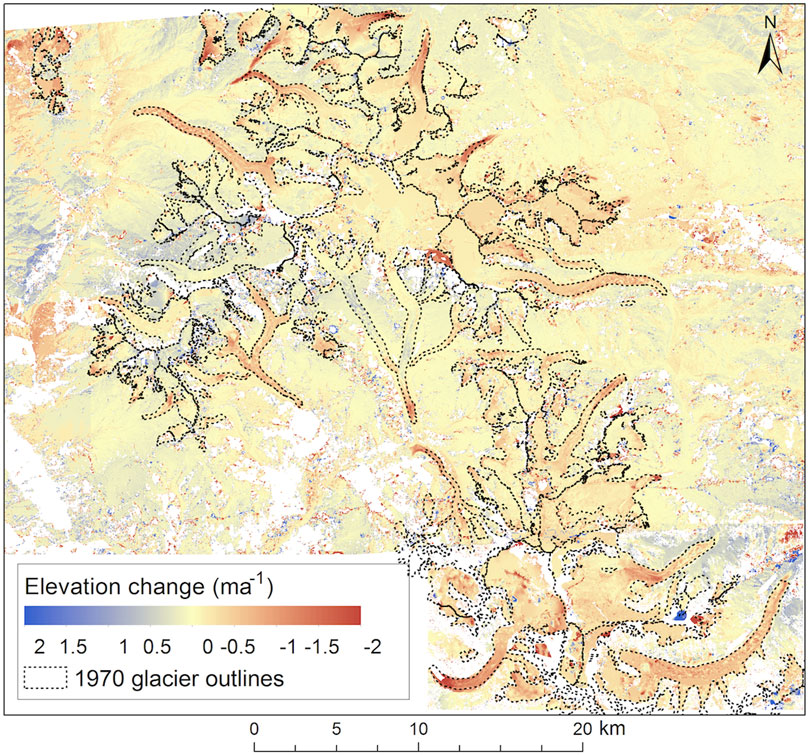
FIGURE 3. Surface elevation changes for all glaciers over the full domain (Manaslu region) from 1970 to 2013.
Changes at Glacier Scale: Ponkar and Thulagi Glaciers
Area and Elevation Change 1970–2013–2019
The largest individual glacier system was Ponkar Glacier, with 38.0 ± 1.0 km2 clean ice and 13.3 ± 0.4 km2 debris-covered ice in 2019. Counting the three branches, its total area reduced from 54.7 ± 1.1 km2 in 1970 to 51.2 km2 in 2019, a loss of 3.5 ± 0.1 km2 (−6.4 ± 0.1% of its area, or −0.13 ± 0.003% a−1). The rate of area loss of Ponkar Glacier is about half of the average area loss experienced by debris-covered glaciers over the entire domain (−0.23 ± 0.01% a−1). The terminus of Ponkar Glacier receded by 890 ± 10 m from 1970 to 2019, based on our estimates from the Corona and RapidEye imagery. Supraglacial debris cover expanded from 11.9 ± 0.2 km2 in 1970 to 13.3 ± 0.4 km2 in 2019 (+11.7 ± 0.4%). The area of the debris-covered Thulagi Glacier in the southern part of our study area reduced from 24.5 ± 0.5 km2 in 1970 to 22.3 ± 0.6 km2 in 2019, a loss of 2.2 ± 0.1 km2 (−8.78 ± 0.4% of its area, or −0.18 ± 0.008% a−1). The area loss of Thulagi Glacier is 0.05% a−1 larger than that of Ponkar Glacier, and the recession of its tongue (−1,500 m, or ∼30 ma−1) was 40% larger compared to that of Ponkar Glacier (−890 m, ∼18 ma−1) between 1970 and 2019. While the proglacial Thulagi Lake has doubled in size from 0.46 ± 0.01 km2 in 1970 to 0.92 ± 0.02 km2 in 2019, Ponkar Glacier on the contrary did not develop a proglacial lake at its terminus.
During the period 1970 to 2013, Ponkar Glacier had a slight negative geodetic mass balance of −0.06 ± 0.01 m w. e.a−1. The western and eastern trunks were approximately stable, and losses concentrated on the eastern trunk (ranging from −0.3 to −0.8 ma−1) (Figure 3). Surface thinning was concentrated around the terminus, with surface lowering rates of ∼ −1.3 ma−1, while otherwise losses are found at elevations of ∼5,500–6,000 m a.s.l. Parts of the central trunk of Ponkar Glacier have been thickening by ∼0.1–0.3 ma−1 during this period (Figure 3). In contrast, Thulagi Glacier had a mean geodetic mass balance of −0.45 ± 0.08 m w. e.a−1. Parts of its terminus have been thinning at rates > −2.5 ma−1, which are amongst the highest in the study area and 10.9 times more than that of the land-terminating Ponkar Glacier.
For the lower section of the central trunk of Ponkar Glacier surveyed with the UAV (Figure 1B), surface elevation changes averaged −0.21 ± 0.11 ma−1 from 1970 to 2013 (Figure 4A) and −1.88 ± 0.30 ma−1 (Figure 4B) from 2013 to 2019. The thinning for the recent period represents a ∼ nine-fold increase over the 1970–2013 period, suggesting an accelerated mass loss for this part of the glacier. The largest increases in glacier thinning occurred at the upper part of the area surveyed with the UAV (4,000–4,200 m a.s.l), where rates increased from −0.07 ma−1 between 1970 and 2013 to −1.6–2.4 ma−1 between 2013 and 2019 (Figures 4A,B). The highest thinning rates (−2.5 ma−1) were observed at elevations around 4,100 m a.s.l and otherwise decrease both up- and downglacier (Figure 5). The rate of thinning at the terminus (∼3,700 m a.s.l) based on elevation data was −1.83 ma−1. Field-based measurements in this area of the glacier show that Stake 1 lowered by −6.95 m, Stake two lowered by −6.46 m and Stake 3 lowered by −6.61 m between March 2016 and November 2019. Stake four does not have the whole period of ablation data. On average, the lower part of the glacier thinned by nearly −6.67 m in that period (Figure 6), a mean rate of −1.78 ma−1. Assuming an average ice thickness of 50 m over the lower 1.5 km section surveyed with the UAV (cf. Farinotti et al. (2019) and a surface velocity of ∼10 ma−1 based on the velocity data from Millan et al., 2022 (see section Glacier Velocity Patterns and Changes below), we calculated an emergence velocity of ∼0.3 ma−1. Taking into account the emergence velocity, we estimated the total surface lowering over the lower part of the glacier as ∼ −2.21 ± 0.30 ma−1. The mean thinning rates of −1.88 ± 0.30 ma−1 obtained from remote sensing are therefore consistent with direct measurements from the lower three ablation stakes installed on Ponkar Glacier (see Figure 1 and Table 2). Debris thickness measured in the field averaged 16.5 cm for the four stake measurement sites.
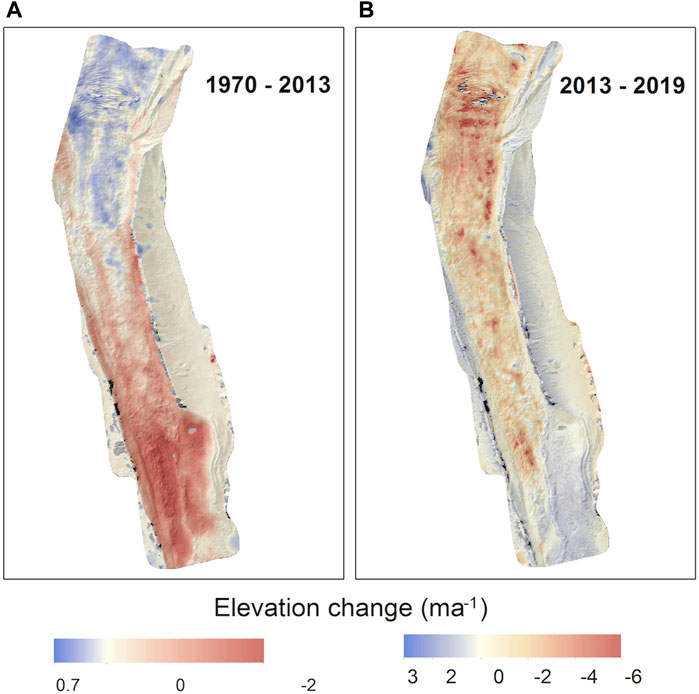
FIGURE 4. Surface elevation changes on the lower ablation part of Ponkar Glacier from (A) 1970 to 2013 and (B) 2013 to 2019.
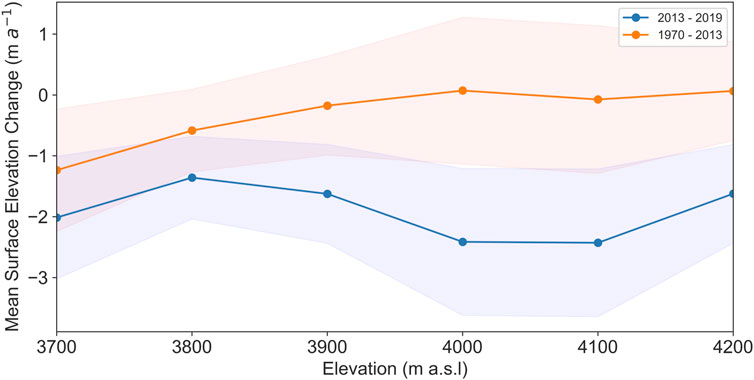
FIGURE 5. Comparison of mean annual change in surface elevation over the lower part of the ablation area of Ponkar Glacier (3,700 m a s l. to 4,200 m a s l.) between 1970 and 2013 (orange line) and 2013 and 2019 (blue line). The shaded uncertainty intervals correspond to one standard deviation per elevation bin. On average, surface elevation changes were approximately nine times more negative between 2013–2019 compared with 1970–2013 with the entire terminus now undergoing thinning.
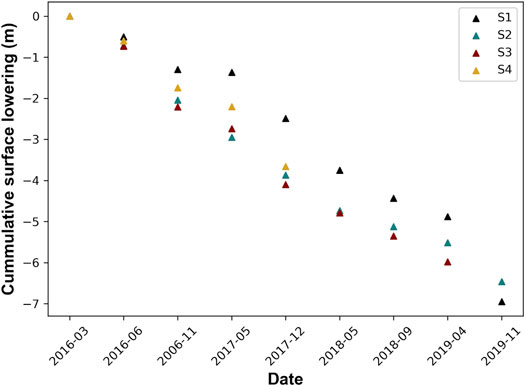
FIGURE 6. Cumulative surface lowering measured from March 2016 to November 2019 at four stakes installed on the lower part of Ponkar Glacier (locations are shown on Figure 1B and their characteristics listed in Table 2). Ablation measurements were not available from the highest stake (S4) for 2017 and 2018.
Glacier Velocity Patterns and Changes
Based on the recent dataset from 2017/2018 (Millan et al., 2022), we observe rather low surface velocities for the majority of glaciers in the Manaslu region, with median surface velocities ranging from ∼0 to 20 ma−1 (Figure 7A). However, we observe some exceptions to this on a glacier-by-glacier basis. The Ponkar tributary and the neighbouring Larkya Glacier have median velocities in the range of 20–30 ma−1. Suti Glacier in the northern part of the region and HimalChuli Glaciers in the southern part have median velocities between 30 and 40 ma−1. The fastest flowing glacier is the clean ice Purdi Glacier located east of Changli Glacier, with a median surface speed in the range of 60–70 ma−1 (Figure 7A). The debris-covered parts of the three branches of the Ponkar Glacier complex display different velocity patterns (Figure 7B). The upper part of the centre branch (Ponkar) displays high velocities (300–600 ma−1). Velocities decrease to 50–100 ma−1 over most of the centre part and to 5–10 ma−1 at the terminus and some stagnating areas towards the lateral moraine. The western part (Kechakyu Khola) displays moderate velocities (10–20 ma−1) over most of its area, with several pockets of higher velocities (20–50 ma−1) in the middle of the tongue and lower velocities towards the confluence with the main branch. The eastern branch of Ponkar Glacier complex (Salpudanda) has an overall low median surface velocity, similar to the majority of glaciers in the region, with very low velocities of 0–5 ma−1 over the lower half of the debris-covered tongue (Figure 7B).
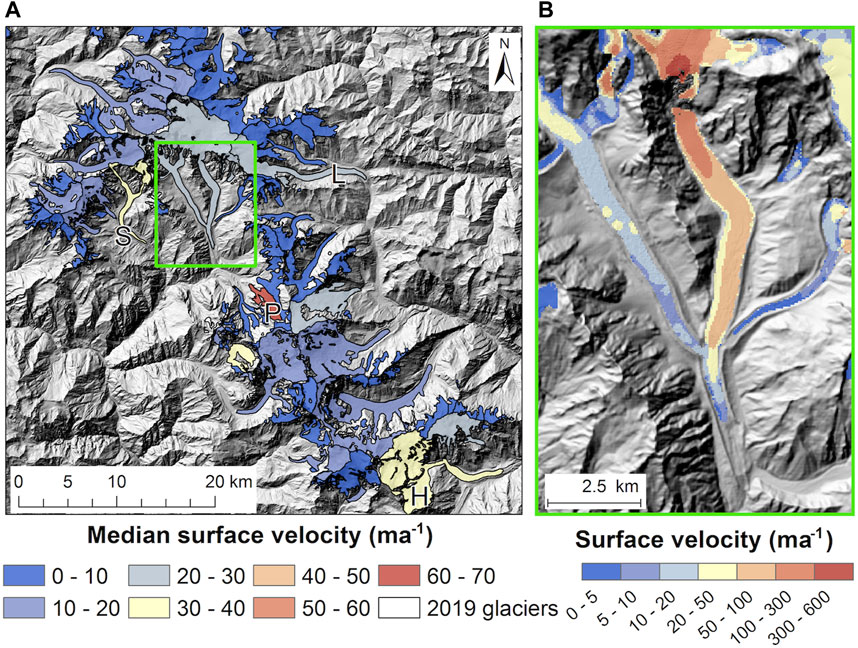
FIGURE 7. Surface flow velocity of glaciers in the Manaslu region between 2017 and 2018 color coded from blue (low velocity) to red (high velocity): (A) Median surface velocity calculated over the 2019 glacier boundaries with glaciers discussed in the text: S—Suti Glacier, L—Larkya Glacier; H—HimalChuli Glaciers and P—Purdi Glacier; the green rectangle represents the extent of Ponkar Glacier complex from Figure 9; (B) Zoom on the surface flow velocity map of the Ponkar Glacier overlaid on AW3D30 and HMA DEM shaded relief. Missing velocity data at the upper part of the middle tributary in (b) correspond to areas where the velocity was not captured by the feature tracking algorithm (Millan et al., 2019).
The re-analysis of velocity data generated using auto-RIFT (Gardner et al., 2018) and provided by the NASA MEaSUREs ITS_LIVE project (Gardner et al., 2019) shown in Figure 8 gives an insight into changes in surface flow velocity over the studied period. Over the western, slow-moving branch of Ponkar (Figure 8A), the ITS_LIVE dataset indicates a clear slowdown from ∼30 ma−1 to ∼16 ma−1 from 1990 to 2017. For the eastern branch, only the lower part of the glacier of the ice tongue (downstream of the ice fall) can be used for the analysis, as the ice fall and neighbouring regions are not captured by the feature tracking algorithm. This branch shows a large slowdown in velocity between 1990 and 2000, from 90 ma−1 to 50 ma−1, with an acceleration to 70 ma−1 between 2000 and 2010 (Figure 8B). For the period 2010–2017, the velocity of this branch decreased again, consistent with what can be observed on the western branch of Ponkar Glacier. The latest available ITS_LIVE mosaic from 2018 does not show any significant changes compared to 2017 on either branch. The analysis of this dataset should, however, be considered carefully, since the sampling resolution of ITS_LIVE is 240 m, and the glacier has a relatively narrow tongue (∼500–800 m), which can induce large uncertainties in the image matching algorithm [e.g., wrong correlation, see Millan et al. (2019)].
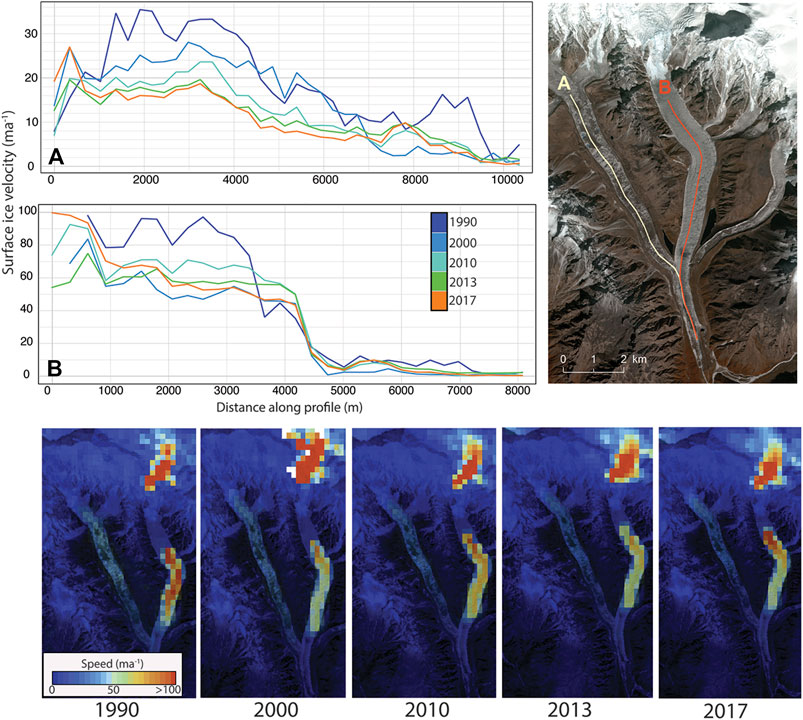
FIGURE 8. Ice velocity changes of the Ponkar Glacier between 1990 and 2017. Panel (A) and (B) represent velocity profiles along the flowline of the two branches of Ponkar Glacier (light yellow and red solid lines, respectively, overlayed on The RapidEye imagery from 2019. The bottom panels show the ice velocity mosaics color coded on a linear scale from blue (low velocity) to red (velocity >100 ma−1).
Geomorphological Changes on Ponkar Glacier
Geomorphological maps of Ponkar Glacier based on Corona and RapidEye imagery show clear changes in the overall configuration of the different flow units of Ponkar Glacier between 1970 and 2019. For example, the ice-flow contribution from Flow Unit 1 to the main trunk (Flow Unit 2) decreased from 3.92 ± 0.1 km2 in 1970 to 3.62 ± 0.1 km2 in 2019, a decrease of 7.7%. This can also be inferred from the change in the size, shape and continuity of the flow-unit boundary where the two glaciers meet (Figure 9). Flow Unit 3 was already more or less detached from the main trunk (Flow Unit 2) in 1970, so there has been no change in its overall contribution. There is generally more glacial outwash present around the glacier in 2019 (2.63 ± 0.1 km2) than in 1970 (0.18 ± 0.005 km2) (Figure 9).
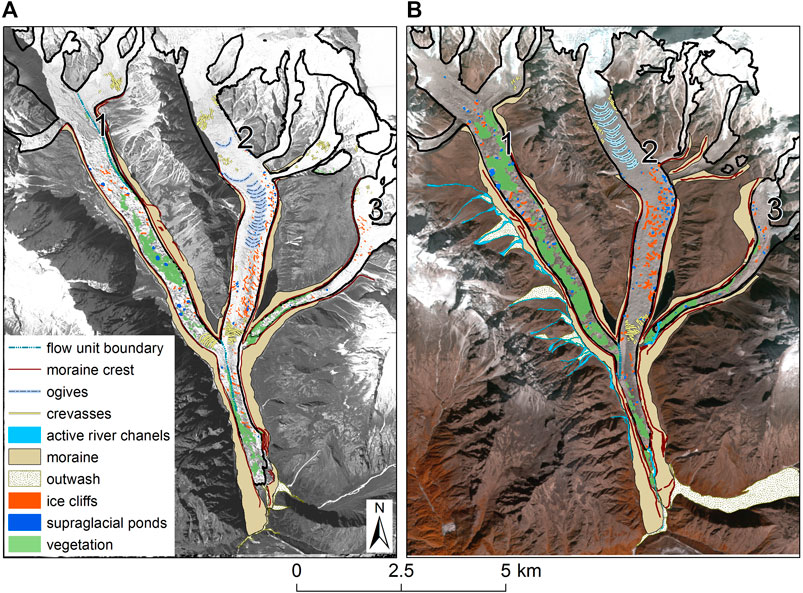
FIGURE 9. Geomorphology and ice-surface changes for the Ponkar Glacier system for period 1970 to 2019: (A) interpretation based on the Corona 1970 panchromatic image; (B) interpretation based on RapidEye 2019 false colour composite bands 543.
Ogives were present on the main Ponkar Glacier trunk on both 1970 and 2019 images (Figures 9A,B), but they extended ∼100 m further down-glacier in 1970 (4,203 m a.s.l.) compared to 2019 (4,321 m a.s.l.). Similarly, crevasses are visible near the three-way glacier confluence on both 1970 and 2019 images (Figures 9A,B). We mapped a total of 236 crevasses on the 1970 image (Figure 9A); in 2019 only 76 crevasses were visible on the RapidEye image (Figure 9B).
We identified 265 ice cliffs on the surface of the glacier in 1970 image, covering an area of 0.12 ± 0.02 km2 (0.21% of the glacier area or 1.00% of the debris-covered area). For the year 2019, we mapped 156 ice cliffs with a total area of 0.18 ± 0.03 km2 (0.35% of the glacier area or 1.35% of the debris-covered area in 2019). The number of ice cliffs decreased but the total area increased by 0.05 km2 in 2019 compared to 1970.
Supraglacial ponds increased in number and area from 56 ponds with a total area of 0.03 ± 0.007 km2 in 1970 (0.05% of the glacier area; 0.25% of the debris-covered area) to 123 ponds in 2019 with a total area of 0.06 ± 0.01 km2 (0.12% of the glacier area or 0.45% of the debris-covered area).
Ice-surface vegetation is clearly visible on several areas of the glacier surface in both 1970 and 2019 (Figures 9A,B). Its area increased from 0.72 ± 0.07 km2 (1.3% of the glacier area; 6% of the debris-covered area) to 1.9 ± 0.16 km2 (3.8% of the glacier area; 14.5% of the debris-cover area) in 2019.
Uncertainties in Area and Elevation Changes
Remote sensing estimates of glacier area, area changes, and geomorphological features are subject to the quality of the images as well as the accuracy of the glacier delineation procedure (Paul et al., 2013). Using the buffer method, we obtained a glacier area uncertainty of 2.7% for the RapidEye imagery and 2.1% for the Corona imagery. While Corona imagery is panchromatic and is likely to have more uncertainty, the total error is slightly less than RapidEye because the buffer method takes into account the higher spatial resolution of Corona compared to RapidEye. The uncertainty of the area change analysis, estimated as the RMSE uncertainties of the two dates was 3.4%. The uncertainty in the glacier terminus recession was estimated at 10 m (i.e., two RapidEye pixels and 5 Corona pixels). The error of the supraglacial vegetation amounted to 9.7 and 8.2% for 1970 and 2019, respectively. Supraglacial pond and ice cliffs were difficult to identify on the Corona image as they sometimes mixed with shadow and lithology. We used uncertainty values of 26 and 21% respectively (cf. Steiner et al., 2019). The feature detection routine helped mitigate some of this challenge and helped automate the delineation of supraglacial ponds and ice cliffs, but we remain cautious about the area estimates for these two features.
With regards to surface elevation changes, all of our regional mass balance estimates, along with 89% of the individual glacier mass balance estimates, and 94% of the surface lowering estimates were significantly different from zero. The non-linear co-registration biases (Figure 2) show that there were deviations from the polynomial of up to 5 m. These biases are also visible on Figure 4, and predominantly occur on steep slopes as well as areas of low-image contrast, such as shadows. In most cases, the surfaces of the glaciers in the study area had good image contrast, especially over the debris-covered surfaces. As such, our error estimates of mass balance are conservative. At the glacier scale, the removal of the non-linear co-registration biases on the UAV data was complicated by the lack of stable terrain in the dataset. The only terrain that could be used to identify the biases was on the steeply sloped eastern side of the terminus of Ponkar Glacier. As such we cannot be confident that the polynomials used to remove the biases are equally applicable across the entire study area; this most likely explains the 0.2–0.5 ma−1 elevation bias that can be observed on the lateral moraine of Ponkar Glacier in Figure 4. Nevertheless, the changes visible on the glacier surface are greater than the biases remaining on the stable ground so we are confident that the elevation change patterns observed are reliable.
Discussion
Glacier Behaviour in the Manaslu Region
In this study, we find that glaciers in the Manaslu region of Nepal have been receding and losing mass over the last five decades. The region-wide mean rate of area loss (−0.23% a−1, 1970–2013) is slightly lower than those reported for the Everest area over the last four decades (Thakuri et al., 2014: −0.27 ± 0.06% a−1, 1962–2011; King et al., 2020: −0.39 ± 0.13 m a−1, 1962–2018). The area changes over the entire period 1970 to 2019 is much lower than the area loss over recent periods reported in the same area in a previous study (Robson et al., 2018: −1.2% a−1, 2001–2005; −0.4 a−1, 2005–2013). This suggests an accelerated area loss in the last decade, also noted in other areas of the Himalaya (Ren et al., 2006; Thakuri et al., 2014; King et al., 2020). However, we interpret the difference in rates of area change between our study and Robson et al. (2018) with caution, because of the different glacier mapping methods used. Regional area change estimates going back to the 1960s and 1970s remain limited in the Himalaya, making it difficult to directly compare the behaviour of glaciers in the Manaslu region to other regions. Here we compare our findings with existing remote sensing studies for similar timescales.
For the period 1970 to 2013, our estimated mean geodetic mass balance (−0.17 ± 0.03 m w. e.a−1) for the Manaslu region is lower than the larger central-west Himalaya domain where are study area is located (King et al., 2019: an average of ∼ −0.25 ± 0.11 w. e.a−1 from ∼1974–2015), as well as than Himalaya-wide estimates (Maurer et al., 2019: −0.31 ± 0.13 m w. e. a−1, 1975–2016). Both cited studies used similar methodology to ours (declassified Hexagon KH-9 imagery combined with SRTM and ASTER DEMs, respectively). However, the slight differences in the size of the domains, the time span of ±3 years and the type of imagery used may account for some of the differences between our study and the cited studies. With respect to temporal evolution of the mass balance, the rate of mass loss over the period 1970–2013 in the Manaslu area is lower than rates reported for the last decade (2000–2015/2016) in the central Himalaya (Brun et al., 2017: −0.28 ± 0.08 m w. e. a−1; King et al., 2019: −0.26 ± 0.11 m w. e a−1). This suggests an acceleration of mass loss in this area in the last decade compared to the previous decades, which is consistent with findings from other studies (Maurer et al., 2019; Hugonnet et al., 2021).
In addition to mass loss, our study shows that glaciers are slowing down as they experience negative mass balance, a general pattern noted in other studies across the Himalaya. Dehecq et al. (2019) reported a slowdown of glaciers in High Mountain Asia for the period 2000–2016. For instance, in the Manaslu region, glaciers experience moderate thinning along with moderate glacier velocities compared to other regions such as Nyainqntanglha and Lahaul Spiti regions (Dehecq et al., 2019). Coupled with the low supraglacial pond and ice cliff coverage in this region (Racoviteanu et al., 2021), this indicates that glaciers in this area might be in the initial phase of retreat, characterized by melting and slow downwasting associated with slowly retreating glacier termini (Kirkbride, 1993). The presence of only three lake-terminating glaciers out of 213/274 glaciers in 1970/2019 indicates that the third phase in the evolution of a glacier, marked by the development of deepening proglacial lakes (Kirkbride, 1993; Benn et al., 2012) is not under way in this area. This is different than the eastern Himalaya, for example Sikkim, which is characterized by accelerated growth of supraglacial and proglacial lakes (Basnett et al., 2013; Racoviteanu et al., 2015; Shukla et al., 2018).
Clean vs. Debris-Covered Glaciers
Previous studies reported higher rates of area loss of clean ice glaciers compared to debris-covered glaciers in various parts of the Himalaya such as Khumbu in the Central Himalaya (Bolch et al., 2008; Nuimura et al., 2012; Thakuri et al., 2014), Sikkim to the east (Racoviteanu et al., 2015), or the Garwhal Himalayas in the west (Bhambri et al., 2011). Low rates of glacier surface area loss and even stable or slowly receding glacier termini were reported over the entire Himalaya (Scherler et al., 2011). We did not notice such patterns in the Manaslu region, where clean and debris-covered glaciers lost area at similar rates from 1970 to 2013 (−0.23 ± 0.01% and −0.24 ± 0.01% a−1, respectively). Clean glaciers on the north side of the divide on the Tibetan plateau receded at almost the same rate as the entire region. This region is in a monsoon shadow and is drier than the southern slopes, with fewer debris-covered tongues. Furthermore, in this study we find that debris-covered glaciers in this area exhibited slightly higher thinning rates and mass loss compared to clean ice glaciers. This is consistent with similar patterns noted in two other regional studies (King et al., 2019; Maurer et al., 2019). However, this is in contrast with previous studies that had found similar thinning rates for clean and debris-covered glaciers (Gardelle et al., 2012; Kääb et al., 2012; Brun et al., 2017). In our study, with a few exceptions, both debris-coved glaciers and clean ice glaciers exhibit most thinning at their termini, with the highest reaches of the glaciers remaining approximately stable, or thickening. These trends are clearly visible for some of the debris-covered glaciers including Ponkar and Thulagi Glaciers discussed in more detail below; other glaciers exhibit more homogenous thinning rates over the entire debris cover area, up to the transition with clean ice.
In terms of debris control on glacier surface changes, we did not find any correlation between extent of the debris and surface elevation changes for the glaciers in the Manaslu region (Table 6). Debris cover extent had a significant negative correlation with mean glacier elevation and slope (Table 6), i.e., steeper glaciers situated at higher altitudes have less debris cover, and these tend to be rather clean glaciers. In general, debris-covered glaciers extend to lower altitudes, and display an inverted mass-balance regime compared to clean ice glaciers, notably larger ablation rates in the middle ablation area (Benn and Lehmkuhl, 2000; King et al., 2017). These general findings hold for some, but not all, glaciers in our study area.
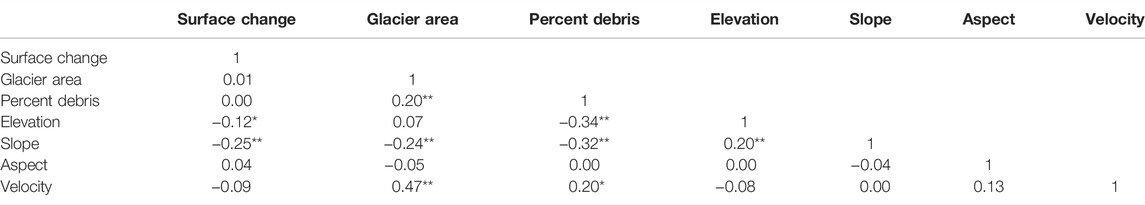
TABLE 6. Correlation matrix for morphology controls on glacier surface change for the Manaslu region for the 135 valid glaciers with positive correlations shown in green and negative correlations in red. Statistically significant correlations are marked with “**”and “*” for 95 and 90% confidence level, respectively. Variables are expressed as average slope, aspect and elevation, median velocity and percent debris. Elevation changes are expressed as ma−1 for the period 2013–2017.
Lake-Terminating vs. Land-Terminating Glaciers
In this study, we found that lake-terminating glaciers retreat at a slightly higher rate than land-terminating glaciers; however, our sample only includes three lake-terminating glaciers. Other studies showed that proglacial lakes accelerate glacier area change in the Himalayas and elsewhere (Basnett et al., 2013; Bajracharya et al., 2014; Racoviteanu et al., 2015; King et al., 2018; King et al., 2019; Sutherland et al., 2020). The mass loss of −0.35 ± 0.06 m w. e a−1 of lake-terminating glaciers found in this study is consistent with findings from King et al. (2019) for the central-western Himalaya region where our study area is located (an average of −0.34 ± 0.11 ma−1 from ∼1974 to 2015) as well as Himalaya-wide estimates from Maurer et al. (2019) (−0.40 ± 0.07 ma−1 from ∼1975 to 2016). It has been shown that lake-terminating Himalayan glaciers retreated and exhibited maximum thinning near the glacier termini at almost double rates compared to land-terminating glaciers (King et al., 2018; King et al., 2019). The lake-terminating glaciers in our study area including Thulagi Glacier conform to this pattern. While these recent studies showed that land-terminating glaciers all decelerated and thinned most in their middle reaches, our results do not support this finding, i.e. we found high thinning rates at glacier termini for both types of glaciers.
Effect of Topography
Glaciers in the Manaslu region exhibit rather homogenous slope patterns, with a regional average of 26° and a standard deviation of 7°. Ponkar and Thulagi Glaciers have similar average slopes (21 and 27°, respectively). The slightly higher slope average for Thulagi might partly explain its different behaviour compared to Ponkar, i.e., the growth of a proglacial lake. We found a significant negative correlation between surface elevation change and glacier slope (r = −0.25, p < 0.05) (Table 6), suggesting that glaciers with lower surface slopes have larger surface elevation changes. These results are consistent with findings from Salerno et al. (2017), who reported that surface slopes along with and supraglacial pond coverage were the main factors controlling the behaviour of glaciers in the Khumbu region of Nepal. Similarly, over the entire High Mountain Asia, Brun et al. (2019) reported that for most of the regions, the slope of the ablation area and the mean glacier elevation were the main predictors of glacier mass balances. In this study we found a significant negative correlation between surface change and mean glacier elevation (Table 6), although the correlation was rather weak (r = −0.12, p < 0.10). This suggests that glaciers in the Manaslu region conform to the patterns noted elsewhere in the Himalaya, i.e., glaciers situated at lower elevations exhibit greater surface thinning.
Supraglacial Pond and Ice Cliff Coverage
Supraglacial ponds are typical of debris-covered glaciers, and are a result of differential ablation patterns (Sakai et al., 2000; Buri et al., 2016; Miles et al., 2016; Miles et al., 2018b). Supraglacial ponds develop on stagnating areas on the ablation areas of glaciers with negative mass balance and surface angles lower than 2° (Reynolds, 2000; Quincey et al., 2007; Sakai and Fujita, 2010), and rarely exist or survive where the glacier is actively flowing. Supraglacial pond density was found to be the second most important factor controlling glacier behaviour in two studies (Salerno et al., 2017; Brun et al., 2019). In a previous study (Racoviteanu et al., 2021), we reported an overall pond coverage of ∼2% of the debris-covered glacier areas in the Manaslu region based on spectral unmixing of Landsat 8 imagery (30 m) for 2015. Other studies reported 0.3–7% pond coverage in the Khumbu based on high-resolution Pléiades data (Salerno et al., 2012; Watson et al., 2017a; Kneib et al., 2020; Racoviteanu et al., 2021). However, due to the differences in spatial resolution of the sensors used, these results cannot be compared directly.
Ice cliffs are exposed on a glacier either as a consequence of redistribution of ice-surface debris during ablation, or the collapse of the roof of a water channel, but the processes responsible for their formation and persistence are largely unknown (Kirkbride, 1993; Sakai et al., 2000). This has consequences for glacier ablation, since these features greatly enhance local ablation (Sakai et al., 1998; Buri et al., 2021). Previous studies in the Himalaya have shown that ice cliffs enhance the overall surface lowering of debris-covered glaciers and contribute to up to 15% of the total ice melt on a glacier (Reid and Brock, 2014; Brun et al., 2016; Ragettli et al., 2016; Buri et al., 2021). The increase in ice cliff area on Ponkar Glacier conforms to the surface thinning patterns at this glacier. While our datasets do not include regional coverage of ice cliffs, we note that the increase in ice cliff area on Ponkar Glacier in the last decades is consistent with observations in other areas of the Nepal Himalaya (Iwata et al., 2000).
Vegetation Development
Ice-surface vegetation is generally rare on glaciers (Fickert et al., 2007; Tampucci et al., 2016; Anderson et al., 2020), but it can develop where the glacier surface is stable over periods of decades. Conversely, it cannot exist or survive where the glacier is actively flowing. In the Manaslu area, we observe the development of supraglacial vegetation on debris-covered tongues with low velocity rates and strong thinning rates such as Ponkar Glacier and the glaciers nearby. In a previous study (Racoviteanu et al., 2021) supraglacial vegetation was estimated at ∼ 4% of the debris-covered glacier areas in the Manaslu region based on spectral unmixing of Landsat 8 imagery for the year 2015. The vegetation coverage is higher in the Manaslu region compared to the Khumbu and Bhutan Himalaya further east. However, at regional scales, the controls on vegetation development remain unclear. At local scales, thinning trends coupled with glacier slowdown are particularly visible on Flow Unit 3 of Ponkar Glacier (Salpundanda Glacier), where ∼ half of the lower area exhibits low velocities, ranging from 0 to 5 ma−1 (Figure 7B). As shown on Figure 9, this branch of the glacier has detached from the main body by 2019, has become stagnant and is associated with the development of extensive supraglacial vegetation. Similarly, the lower parts of Flow Unit 1 (Kechakyu Khola Glacier) exhibit similar tendencies of vegetation expansion in the lower part. Flow Unit 3 is a good example of part of a glacier which has evolved towards a “vegetated” tongue as we observed in the field on the nearby Changli Glacier (Supplementary Figure S1). We infer that such transitions occurred over the last five decades as a consequence of slow velocities and negative mass balance and may continue in the future.
Contrasting debris-covered glacier behaviour: the example of Ponkar and Thulagi Glaciers
While the area and elevation change in the Manaslu region are moderate compared to other regions, and rather homogenous (clean vs. debris-covered glaciers), differences exist on a glacier-by-glacier basis. The influence of supraglacial debris on glacier area and surface changes in the Himalayas has been addressed in recent studies (Brun et al., 2017; Dehecq et al., 2019; Shean et al., 2020). In this discussion, we focus on the contrasted behaviour of the lake-terminating Thulagi Glacier and the land-terminating Ponkar Glacier and we infer links between surface morphology (supraglacial pond and ice cliff coverage, slope, and debris cover), surface velocity and mass balance of these two glaciers.
These glaciers are both covered with debris but behave differently with respect to area and elevation losses. The lake-terminating Thulagi Glacier had higher area loss, terminus retreat and thinning rates compared to the non-lake terminating Ponkar Glacier from 1970 to 2013/2019. The proglacial Thulagi Lake, previously identified as a hazardous glacial lake, has doubled in size since the 1970s based on our estimates. The growth of Thulagi Lake occurred concomitantly with the thinning of Thulagi Glacier noted in this study as well as in previous studies (Pant and Reynolds, 2000; Robson et al., 2018; Maskey et al., 2020; Watson et al., 2020). Ponkar Glacier, in contrast, did not develop a proglacial lake at its terminus. In terms of surface elevation changes, Ponkar Glacier stands out as an exception to the regional pattern noted earlier (i.e. thinning towards the terminus with stable or thickening trends in the upper areas, vs. consistent thinning across the debris-covered part for most of the glaciers in the region). The thickened upper ablation zone shown in Figures 3, 4 is probably best explained by the velocity data in Figures 7, 8, which indicates that this part of the glacier is still dynamically active. The simplest explanation is therefore that there is still some ice actively flowing from the accumulation area into the upper ablation area but that the glacier is then more or less dynamically inactive below this (i.e. in the middle and lower ablation zone). We infer that the recent prolonged period of negative mass balance led to reduced ice velocities and enhanced ice-surface lowering, especially near the glacier terminus.
Using the example of Ponkar Glacier, we note that changes in the ice-surface morphology based on satellite imagery are commensurate with the recession and thinning of the glacier between 1970 and 2013/2019. For example, we note an increase in the area of ice-surface vegetation over the 1970–2019 period. This supports the idea that Ponkar Glacier is currently in a stagnation phase, in comparison with Thulagi Glacier which is at the stage of lake development and calving. Furthermore, the ice-flow contribution from Flow Unit 1 to the main trunk (Flow Unit 2) decreased by 2019. Ogives, which form beneath icefalls on glacier surfaces indicate active glacier flow; crevasses generally open and form beneath actively-flowing ice. The decrease in number and extent of both of these ice-surface features, coupled with an increase in the size of lateral moraines and expanded outwash plains further indicate that Ponkar Glacier is currently less dynamically active than in 1970. Crevasses in Flow Unit 1 are only visible on that section of the glacier in the 1970 image and some crevasses appear to have closed up by 2019. While this can be a function of glacier recession (i.e., glacier recession means there is more available space for outwash plains to expand on the valley floor), the expansion of outwash plains could also indicate an increase in ablation and associated fluvial activity between 1970 and 2019.
The large lateral moraines present along the glacier margins in 1970 indicate that glacier thinning was already underway five decades ago. Moraines expanded in size between 1970 and 2019 as the glacier continued to thin and recede during this period. The most conspicuous change observed is near the snout in the “embayment” area, on the true left-hand side near the terminus, where moraines can be seen actively forming at the 1970 ice margin. By 2019, these moraines separated from the glacier itself and a new lateral lake had formed within the moraines in the embayment area (Figure 9B).
On Ponkar Glacier, supraglacial ponds covered a small percent of the debris-covered glacier area in both 1970 and 2019 (0.25% and 0.45% of the debris-covered area, respectively). Ice cliffs covered 1–1.35% of the debris-covered area. The low supraglacial pond coverage is a pattern over the entire Manaslu area as noted in a previous study (Racoviteanu et al., 2021). With respect to regional ice cliff coverage, we cannot compare directly the local estimates with the regional ones due to the difference in the spatial resolution of the data used in the cited study vs. this study (30 vs 5 m). However, we note that the pond and ice cliff coverage that we obtained for the post-monsoon (dry) season in 1970 and 2019 is about half that of the area reported from other glaciers in the Nepal Himalaya for the same season. For example, Steiner et al. (2019) reported 2.5% ice cliff coverage and 0.9% pond coverage relative to the debris-cover area of five glaciers in the Langtang valley, about 115 km east of our study area in October 2015. Brun et al. (2018) found a 7–8% ice cliff coverage on the Changri Nup Glacier in the Khumbu Himalaya during the dry season, east of our study area, based on Pléiades imagery (2 m). This is ∼7 times larger than the ice cliff coverage we estimated on Ponkar Glacier for the dry season (November 1970 and 2019). The increased number of ice cliffs from 1970 to 2019 on Ponkar Glacier appears to be consistent with the thinning patterns we noted earlier (see section Changes at Glacier Scale: Ponkar and Thulagi Glaciers). The doubling of the number and surface area of supraglacial ponds on Ponkar Glacier from 1970 to 2019 also supports the idea that the glacier was less dynamically active in 2019 than it was in 1970. The slight increase in the number of ice cliffs on this glacier suggest that ice cliffs are in the “development” phase as defined by Sakai et al. (2002). Ponkar Glacier represents a good example of the relationship between glacier mass balance, glacier dynamics and changes in supraglacial debris cover for a glacier which has not reached the transition to the calving stage. In terms of local ablation, we found that surface elevation changes between 2013 and 2019 were noticeably higher within the vicinity of supraglacial ponds and exposed ice (up to −4.5 ma−1) (Figure 4B), with implications for the future behaviour of this glacier. Other studies in the Himalaya clearly showed that while these surface features cover only several percent of the total ablation area of glaciers (Steiner et al., 2019), they can enhance local ablation rates by up to three times (Brun et al., 2016; Irvine-Fynn et al., 2017; Miles et al., 2018b; Buri et al., 2021).
Future Outlook of Debris-Covered Glaciers
In this study, we have shown that glaciers in the Manaslu region have undergone thinning and frontal recession in recent decades in response to regional climate change. During this period, the glacier ablation zones have accumulated debris at an increased rate. Debris naturally accumulates in a supraglacial position during surface lowering of glaciers in mountain areas such as the Himalaya for two main reasons. First, material falls onto the ice surface from the collapsing inner faces of the surrounding lateral moraines (Hambrey et al., 2008). These moraines are progressively de-stabilised during ice-surface lowering as the supporting ice is removed. This is especially the case near the terminus of glaciers, where ice velocity is low or where the ice is stagnant and therefore supraglacial material cannot be evacuated. Second, there is a tendency for an increase in supraglacial debris cover simply because debris becomes concentrated on the ice surface during ablation (i.e., as the proportion of ice in an ice-rock mixture decreases during ablation, the proportion of debris increases). The ∼12% increase in supraglacial debris cover from 1970 to 2019 noted in this study is consistent with the increase in debris cover reported in other studies in the Himalaya and the Alps (Mölg et al., 2019; Xie et al., 2020). Again, this is especially the case near glacier termini where velocities tend to be low during periods of negative mass balance (Benn and Evans, 1998).
The regional pattern of surface lowering leads to an increase in debris cover for the two main reasons noted above, which in turn reduces ablation. This accounts for the large and increasing number of debris-covered glaciers in the Himalaya (Scherler et al., 2018; Herreid and Pellicciotti, 2020). This poses the question: how will this, and other glaciers in the region, evolve as climate warming continues? There are perhaps two obvious answers to this question: first, all the glaciers could melt and lose mass through the rest of this century and beyond, leaving behind small niche glaciers at high altitudes and plateau icefields on broad mountain tops; second, debris-covered glaciers such as Ponkar Glacier might undergo a transition to a rock glacier as debris cover accumulates and glacier snouts reorganize and undergo increased downslope creep (Harrison et al., 2021). This transition process has been hypothesized to occur in the arid Andes (e.g. Monnier and Kinnard, 2015), in the Himalayas (Jones et al., 2019) and elsewhere globally (Knight et al., 2019).
If Ponkar Glacier does undergo a future transition to a rock glacier then we would envisage this to occur in two stages. In Stage 1, climate change leads to increased air temperature and associated reduction in solid precipitation, which influences ice flow and drives glacier recession. While few long-term climate datasets exist in the high mountain region of western Nepal, there are data from valley locations in the region that show a recent rise in temperature in the area allied to a reduction in precipitation (Basnet et al., 2020; Paudel, 2020). If these trends exist at high altitudes, we would expect these to induce negative mass balance of the glacier. As a result, the glacier thins and accumulates surface debris via rockfalls from valley sides, mass-wasting of lateral moraines and transport of debris from subglacial and englacial sources (Benn and Owen, 2002; Knight and Harrison, 2009; Kirkbride and Deline, 2013; van Woerkom et al., 2019). In Stage 2, accumulation of surface debris occurs to the extent that mass balance of the terminus becomes more positive as ice melt is reduced. In conjunction, basal shear stress increases as does internal deformation of the terminus ice mass as debris load increases. This induces flow and deformation of the terminus which transitions to an ice-cored rock glacier. However, the processes outlined in Stage 2 have clearly not occurred on Ponkar Glacier, where the terminus area shows low velocities rather than the increased velocity hypothesised in this transition model (see Figure 8B), despite the clear increase in supraglacial debris in this zone.
Summary and Further Work
In this study, we found that the glacierized area in the Manaslu region of Nepal Himalaya reduced at the mean rate of −0.26 ± 0.0001% a−1 from 1970 to 2019, with slightly higher rates for debris-covered glaciers. For a sample of 135 glaciers, we found thinning trends of −0.20 ± 0.03 ma−1 between 1970 and 2013, corresponding to a mean geodetic mass balance of −0.17 ± 0.03 m w. e. a−1. Surface elevation changes were negatively influenced to some extent by the mean slope of the glacier and mean glacier elevations, pointing to increasingly negative mass balance for gentle-sloped glaciers situated at lower elevations. Stronger thinning rates and negative mass balance were observed for lake-terminating glaciers such as Thulagi Glacier, compared to the land-terminating Ponkar Glacier. Overall, glaciers in this area exhibit low supraglacial pond and ice cliff coverage compared to other regions in the eastern Himalaya such as Khumbu. Using the example of the largest glacier system in the region (Ponkar Glacier), the geomorphology analysis shows an increase in pond and ice cliff coverage concomitant with a reduction in ogives and crevasses. This indicates that the glacier was more active in 1970 compared to the present day, and that it is currently undergoing a stagnation phase marked by ice-surface vegetation growth and a significant expansion of the supraglacial debris cover. Coupled with increased thinning trends for the recent years (2013–2019) compared to 1970 to 2013 period and the relatively low glacier surface velocities, such trends indicate that glaciers in the Manaslu region might be in the initial transitional phase characterized by rather slowly receding glacier termini. Remaining work will focus on expanding the geomorphology analysis used in this study to map the evolution of ice cliffs, ponds and vegetation over the entire region in order to understand the consequences of slow velocities and negative mass balance at the regional scale.
Data Availability Statement
The datasets presented in this study can be found in online repositories. ITS_LIVE velocity data are found at: https://its-live.jpl.nasa.gov/. Planet imagery are available from Planet Labs (www.planet.com). Corona images are available from the USGS EarthExplorer at https://earthexplorer.usgs.gov. The geodetic mass balance produced in this study can be found at the zenodo repository: http://10.5281/zenodo.5700932.
Author Contributions
AR designed the study, processed the Corona and RapidEye images, refined geomorphology mapping using the RapidEye image, prepared figures and led the paper. NG provided geomorphology expertise for manual mapping of geomorphology features and supervised the study. BR produced the Corona DEMs, computed the geodetic mass balance, prepared figures and helped edit the paper. SH provided climate expertise and paper edits. RM provided glacier velocity data, processed the ITS_Live data, provided figures and helped edit the paper. RBK and RK provided the field-based ablation measurements and supported the UAV field campaign.
Funding
AR was supported by a Fellowship from the European Union’s Horizon 2020 research and innovation programme under the Marie Skłodowska-Curie COFUND Ser Cymru II scheme (Grant agreement No 663830). Financial support for travel and field logistics for NFG and AR was provided by a GCRF (Global Challenges Research Fund) Agility Grant through CIDRA (Center for International Research Development at Aberystwyth University). SH was supported by funding from College of Life and Environmental Sciences, University of Exeter. BR was supported by a University of Bergen stipend between 2017 and 2020. The participation of Nepalese and Indian students to the fieldwork training at Ponkar Glacier was supported financially by the UNESCO IGCP Project 672. The UAV survey was conducted by a pilot team from Nepal Flying Labs.
Conflict of Interest
The authors declare that the research was conducted in the absence of any commercial or financial relationships that could be construed as a potential conflict of interest.
Publisher’s Note
All claims expressed in this article are solely those of the authors and do not necessarily represent those of their affiliated organizations, or those of the publisher, the editors and the reviewers. Any product that may be evaluated in this article, or claim that may be made by its manufacturer, is not guaranteed or endorsed by the publisher.
Acknowledgments
We thank all fieldwork participants for their hard work and enthusiasm. We acknowledge the Himalayan Research Expeditions in Nepal for organizing fieldwork logistics on Ponkar Glacier. RapidEye images were provided at no cost using an API from Planet Labs (https://www.planet.com). Ice velocity were processed by Romain Millan thanks to a post-doctoral fellowship from the French Centre National d'Etudes Spatiales (CNES) and the CNES MaiSON project.
Supplementary Material
The Supplementary Material for this article can be found online at: https://www.frontiersin.org/articles/10.3389/feart.2021.767317/full#supplementary-material
Supplementary Figure S1 | The vegetated debris-covered tongue of Changli Glacier as viewed from Yak Kharka on the way to Ponkar Glacier. Photo credit: N.F. Glasser.
References
Anderson, B., and Mackintosh, A. (2012). Controls on Mass Balance Sensitivity of Maritime Glaciers in the Southern Alps, New Zealand: The Role of Debris Cover. J. Geophys. Res. 117 (F1), a–n. doi:10.1029/2011JF002064
Anderson, B., Mackintosh, A. N., Dadić, R., Oerlemans, J., Zammit, C., Doughty, A., et al. (2021). Modelled Response of Debris-Covered and lake-calving Glaciers to Climate Change, Kā Tiritiri O Te Moana/Southern Alps, New Zealand. Glob. Planet. Change 205, 103593. doi:10.1016/j.gloplacha.2021.103593
Anderson, K., Fawcett, D., Cugulliere, A., Benford, S., Jones, D., and Leng, R. (2020). Vegetation Expansion in the Subnival Hindu Kush Himalaya. Glob. Change Biol. 26 (3), 1608–1625. doi:10.1111/gcb.14919
Anderson, L. S., Armstrong, W. H., Anderson, R. S., and Buri, P. (2021). Debris Cover and the Thinning of Kennicott Glacier, Alaska: In Situ Measurements, Automated Ice Cliff Delineation and Distributed Melt Estimates. The Cryosphere 15 (1), 265–282. doi:10.5194/tc-15-265-2021
Bajracharya, S. R., Maharjan, S. B., and Shrestha, F. (2014). The Status and Decadal Change of Glaciers in Bhutan from the 1980s to 2010 Based on Satellite Data. Ann. Glaciol. 55 (66), 159–166. doi:10.3189/2014AoG66A125
Basnet, K., Shrestha, A., Joshi, P. C., and Pokharel, N. (2020). Analysis of Climate Change Trend in the Lower Kaski District of Nepal. Himalayan J. Appl. Sci. Engin. 1, 11–22. doi:10.3126/hijase.v1i1.33536
Basnett, S., Kulkarni, A. V., and Bolch, T. (2013). The Influence of Debris Cover and Glacial Lakes on the Recession of Glaciers in Sikkim Himalaya, India. J. Glaciol. 59 (218), 1035–1046. doi:10.3189/2013jog12j184
Benn, D. I., Bolch, T., Hands, K., Gulley, J., Luckman, A., Nicholson, L. I., et al. (2012). Response of Debris-Covered Glaciers in the Mount Everest Region to Recent Warming, and Implications for Outburst Flood Hazards. Earth-Science Rev. 114 (1), 156–174. doi:10.1016/j.earscirev.2012.03.008
Benn, D. I., and Lehmkuhl, F. (2000). Mass Balance and Equilibrium-Line Altitudes of Glaciers in High-Mountain Environments. Quat. Int. 65-66, 15–29. doi:10.1016/s1040-6182(99)00034-8
Benn, D. I., and Owen, L. A. (2002). Himalayan Glacial Sedimentary Environments: a Framework for Reconstructing and Dating the Former Extent of Glaciers in High Mountains. Quat. Int. 97-98, 3–25. doi:10.1016/S1040-6182(02)00048-4
Benn, D. I., and Owen, L. A. (1998). The Role of the Indian Summer Monsoon and the Mid-latitude Westerlies in Himalayan Glaciation: Review and Speculative Discussion. J. Geol. Soc. 155 (2), 353–363. doi:10.1144/gsjgs.155.2.0353
Berthier, E., Arnaud, Y., Baratoux, D., Vincent, C., and Remy, F. (2004). Recent rapid thinning of the "Mer de Glace" glacier derived from satellite optical images. Geophys. Res. Lett. 31 (17). doi:10.1029/2004gl020706
Berthier, E., Schiefer, E., Clarke, G. K. C., Menounos, B., and Rémy, F. (2010). Contribution of Alaskan Glaciers to Sea-Level Rise Derived from Satellite Imagery. Nat. Geosci 3, 92–95. doi:10.1038/ngeo737
Bhambri, R., Bolch, T., Chaujar, R. K., and Kulshreshtha, S. C. (2011). Glacier Changes in the Garhwal Himalaya, India, from 1968 to 2006 Based on Remote Sensing. J. Glaciol. 57 (203), 543–556. doi:10.3189/002214311796905604
Bolch, T., Buchroithner, M., Pieczonka, T., and Kunert, A. (2008). Planimetric and Volumetric Glacier Changes in the Khumbu Himal, Nepal, since 1962 Using Corona, Landsat TM and ASTER Data. J. Glaciol. 54 (187), 592–600. doi:10.3189/002214308786570782
Bolch, T., Kulkarni, A., Kääb, A., Huggel, C., Paul, F., Cogley, J. G., et al. (2012). The State and Fate of Himalayan Glaciers. Science 336 (6079), 310–314. doi:10.1126/science.1215828
Bolch, T., Menounos, B., and Wheate, R. (2010). Landsat-based Inventory of Glaciers in Western Canada, 1985-2005. Remote Sensing Environ. 114, 127–137. doi:10.1016/j.rse.2009.08.015
Bolch, T., Pieczonka, T., and Benn, D. I. (2011). Multi-decadal Mass Loss of Glaciers in the Everest Area (Nepal Himalaya) Derived from Stereo Imagery. The Cryosphere 5 (2), 349–358. doi:10.5194/tc-5-349-2011
Brun, F., Berthier, E., Wagnon, P., Kääb, A., and Treichler, D. (2017). A Spatially Resolved Estimate of High Mountain Asia Glacier Mass Balances from 2000 to 2016. Nat. Geosci 10, 668–673. doi:10.1038/ngeo2999
Brun, F., Buri, P., Miles, E. S., Wagnon, P., Steiner, J., Berthier, E., et al. (2016). Quantifying Volume Loss from Ice Cliffs on Debris-Covered Glaciers Using High-Resolution Terrestrial and Aerial Photogrammetry. J. Glaciol. 62 (234), 684–695. doi:10.1017/jog.2016.54
Brun, F., Wagnon, P., Berthier, E., Jomelli, V., Maharjan, S. B., Shrestha, F., et al. (2019). Heterogeneous Influence of Glacier Morphology on the Mass Balance Variability in High Mountain Asia. J. Geophys. Res. Earth Surf. 124 (6), 1331–1345. doi:10.1029/2018JF004838
Brun, F., Wagnon, P., Berthier, E., Shea, J. M., Immerzeel, W. W., Kraaijenbrink, P. D. A., et al. (2018). Ice Cliff Contribution to the Tongue-wide Ablation of Changri Nup Glacier, Nepal, central Himalaya. The Cryosphere 12 (11), 3439–3457. doi:10.5194/tc-12-3439-2018
Buri, P., Miles, E. S., Steiner, J. F., Immerzeel, W. W., Wagnon, P., and Pellicciotti, F. (2016). A Physically Based 3‐D Model of Ice Cliff Evolution over Debris‐covered Glaciers. J. Geophys. Res. Earth Surf. 121 (12), 2471–2493. doi:10.1002/2016JF004039
Buri, P., Miles, E. S., Steiner, J. F., Ragettli, S., and Pellicciotti, F. (2021). Supraglacial Ice Cliffs Can Substantially Increase the Mass Loss of Debris‐Covered Glaciers. Geophys. Res. Lett. 48 (6), e2020GL092150. doi:10.1029/2020GL092150
Chand, M. B., and Watanabe, T. (2019). Development of Supraglacial Ponds in the Everest Region, Nepal, between 1989 and 2018. Remote Sensing 11 (9), 1058. doi:10.3390/rs11091058
Dashora, A., Lohani, B., and Malik, J. N. (2007). A Repository of Earth Resource Information-CORONA Satellite Programme. Curr. Sci. 92 (7).
Dehecq, A., Gardner, A. S., Alexandrov, O., McMichael, S., Hugonnet, R., Shean, D., et al. (2020). Automated Processing of Declassified KH-9 Hexagon Satellite Images for Global Elevation Change Analysis since the 1970s. Front. Earth Sci. 8, 516. doi:10.3389/feart.2020.566802
Dehecq, A., Gourmelen, N., Gardner, A. S., Brun, F., Goldberg, D., Nienow, P. W., et al. (2019). Twenty-first century Glacier Slowdown Driven by Mass Loss in High Mountain Asia. Nat. Geosci 12 (1), 22–27. doi:10.1038/s41561-018-0271-9
Deline, P. (2005). Change in Surface Debris Cover on Mont Blanc Massif Glaciers after the ‚Little Ice Age' Termination. The Holocene 15 (2), 302–309. doi:10.1191/0959683605hl809rr
Falaschi, D., Lenzano, M. G., Villalba, R., Bolch, T., Rivera, A., and Lo Vecchio, A. (2019). Six Decades (1958-2018) of Geodetic Glacier Mass Balance in Monte San Lorenzo, Patagonian Andes. Front. Earth Sci. 7, 326. doi:10.3389/feart.2019.00326
Farinotti, D., Huss, M., Fürst, J. J., Landmann, J., Machguth, H., Maussion, F., et al. (2019). A Consensus Estimate for the Ice Thickness Distribution of All Glaciers on Earth. Nat. Geosci. 12 (3), 168–173. doi:10.1038/s41561-019-0300-3
Fickert, T., Friend, D., Grüninger, F., Molnia, B., and Richter, M. (2007). Did Debris-Covered Glaciers Serve as Pleistocene Refugia for Plants? A New Hypothesis Derived from Observations of Recent Plant Growth on Glacier Surfaces. Arctic, Antarctic, Alpine Res. 39 (2), 245–257. doi:10.1657/1523-0430(2007)39[245:ddgsap]2.0.co;2
Gaphaz, (2017). in Assessment of Glacier and Permafrost Hazards in Mountain Regions – Technical Guidance Document. Standing Group on Glacier and Permafrost Hazards in Mountains (GAPHAZ) of the International Association of Cryospheric Sciences (IACS) and the International Permafrost Association (IPA). Editors S. Prepared by Allen, H. Frey, and C. Huggel (Zurich, Switzerland/Lima, Peru).
Gardelle, J., Berthier, E., Arnaud, Y., and Kääb, A. (2013). Region-wide Glacier Mass Balances over the Pamir-Karakoram-Himalaya during 1999-2011. The Cryosphere 7 (4), 1263–1286. doi:10.5194/tc-7-1263-2013
Gardelle, J., Berthier, E., and Arnaud, Y. (2012). Slight Mass Gain of Karakoram Glaciers in the Early Twenty-First century. Nat. Geosci. 5, 322–325. doi:10.1038/ngeo1450
Gardner, A. S., Fahnestock, M. A., and Scambos, T. A. (2019). ITS_LIVE Regional Glacier and Ice Sheet Surface Velocities. Data archived at National Snow and Ice Data Center. doi:10.5067/6II6VW8LLWJ7
Gardner, A. S., Moholdt, G., Scambos, T., Fahnstock, M., Ligtenberg, S., van den Broeke, M., et al. (2018). Increased West Antarctic and Unchanged East Antarctic Ice Discharge over the Last 7 Years. The Cryosphere 12 (2), 521–547. doi:10.5194/tc-12-521-2018
Glasser, N. F., Jansson, K. N., Harrison, S., and Rivera, A. (2005). Geomorphological Evidence for Variations of the North Patagonian Icefield during the Holocene. Geomorphology 71, 263–277. doi:10.1016/j.geomorph.2005.02.003
Goodsell, B., Hambrey, M. J., Glasser, N. F., Nienow, P., and Mair, D. (2005). The Structural Glaciology of a Temperate Valley Glacier: Haut Glacier d'Arolla, Valais, Switzerland. Arctic, Antarctic, Alpine Res. 37 (2), 218–232. doi:10.1657/1523-0430(2005)037[0218:tsgoat]2.0.co;2
Granshaw, F. D., and G. Fountain, A. (2006). Glacier Change (1958-1998) in the North Cascades National Park Complex, Washington, USA. J. Glaciol. 52 (177), 251–256. doi:10.3189/172756506781828782
Gulley, J. D., Benn, D. I., Screaton, E., and Martin, J. (2009). Mechanisms of Englacial Conduit Formation and Their Implications for Subglacial Recharge. Quat. Sci. Rev. 28 (19), 1984–1999. doi:10.1016/j.quascirev.2009.04.002
Hagg, W., Mayer, C., Lambrecht, A., and Helm, A. (2008). Sub‐debris Melt Rates on Southern Inylchek Glacier, central Tian Shan. Geografiska Annaler: Ser. A, Phys. Geogr. 90, 55–63. doi:10.1111/j.1468-0459.2008.00333.x
Hambrey, M. J., Quincey, D. J., Glasser, N. F., Reynolds, J. M., Richardson, S. J., and Clemmens, S. (2008). Sedimentological, Geomorphological and Dynamic Context of Debris-Mantled Glaciers, Mount Everest (Sagarmatha) Region, Nepal. Quat. Sci. Rev. 27 (25-26), 2361–2389. doi:10.1016/j.quascirev.2008.08.010
Haritashya, U., Kargel, J., Shugar, D., Leonard, G., Strattman, K., Watson, C., et al. (2018). Evolution and Controls of Large Glacial Lakes in the Nepal Himalaya. Remote Sensing 10, 798. doi:10.3390/rs10050798
Harris Geospatial (2017). ENVI Feature Extraction Module. Available at: https://www.l3harrisgeospatial.com/Portals/0/pdfs/HG_ENVI_FX_module_data-sheet_WEB.pdf (Accessed 04 25, 2021).
Harrison, S., Jones, D., Anderson, K., Shannon, S., and Betts, R. A. (2021). Is Ice in the Himalayas More Resilient to Climate Change Than We Thought? Geografiska Annaler: Ser. A, Phys. Geogr. 103 (1), 1–7. doi:10.1080/04353676.2021.1888202
Herreid, S., and Pellicciotti, F. (2020). The State of Rock Debris Covering Earth's Glaciers. Nat. Geosci. 13 (9), 621–627. doi:10.1038/s41561-020-0615-0
Hugonnet, R., McNabb, R., Berthier, E., Menounos, B., Nuth, C., Girod, L., et al. (2021). Accelerated Global Glacier Mass Loss in the Early Twenty-First century. Nature 592 (7856), 726–731. doi:10.1038/s41586-021-03436-z
Huss, M. (2013). Density Assumptions for Converting Geodetic Glacier Volume Change to Mass Change. The Cryosphere 7 (3), 877–887. doi:10.5194/tc-7-877-2013
Immerzeel, W. W., Lutz, A. F., Andrade, M., Bahl, A., Biemans, H., Bolch, T., et al. (2020). Importance and Vulnerability of the World's Water Towers. Nature 577 (7790), 364–369. doi:10.1038/s41586-019-1822-y
Irvine-Fynn, T. D. L., Porter, P. R., Rowan, A. V., Quincey, D. J., Gibson, M. J., Bridge, J. W., et al. (2017). Supraglacial Ponds Regulate Runoff from Himalayan Debris-Covered Glaciers. Geophys. Res. Lett. 44 (2311), 11894–11904. doi:10.1002/2017GL075398
Iwata, S., Aoki, T., Kadota, T., Seko, K., and Yamaguchi, S. (2000). “Morphological Evolution of the Debris Cover on Khumbu Glacier, Nepal, between 1978 and 1995,” in Debris-covered Glaciers. Editors M. Nakawo, C. F. Raymond, and A. Fountain.
Jansson, P., and Fredin, O. (2002). Ice Sheet Growth under Dirty Conditions: Implications of Debris Cover for Early Glaciation Advances. Quat. Int. 95-96, 35–42. doi:10.1016/s1040-6182(02)00025-3
Jones, D. B., Harrison, S., and Anderson, K. (2019). Mountain Glacier-To-Rock Glacier Transition. Glob. Planet. Change 181, 102999. doi:10.1016/j.gloplacha.2019.102999
Kääb, A., Berthier, E., Nuth, C., Gardelle, J., and Arnaud, Y. (2012). Contrasting Patterns of Early Twenty-First-century Glacier Mass Change in the Himalayas. Nature 488, 495–498. doi:10.1038/nature11324
Kayastha, R. B., Takeuchi, Y., Nakawo, M., and Ageta, Y. (2000). “Practical Prediction of Ice Melting beneath Various Thickness of Debris Cover on Khumbu Glacier, Nepal, Using a Positive Degree-Day Factor,” in Debris-Covered Glaciers. Editors C. F. Raymond, M. Nakawo, and A. Fountain (Wallingford, UK: IAHS), 71–81.
King, O., Bhattacharya, A., Bhambri, R., and Bolch, T. (2019). Glacial Lakes Exacerbate Himalayan Glacier Mass Loss. Sci. Rep. 9 (1), 18145. doi:10.1038/s41598-019-53733-x
King, O., Bhattacharya, A., Ghuffar, S., Tait, A., Guilford, S., Elmore, A. C., et al. (2020). Six Decades of Glacier Mass Changes Around Mt. Everest Are Revealed by Historical and Contemporary Images. One Earth 3 (5), 608–620. doi:10.1016/j.oneear.2020.10.019
King, O., Dehecq, A., Quincey, D., and Carrivick, J. (2018). Contrasting Geometric and Dynamic Evolution of lake and Land-Terminating Glaciers in the central Himalaya. Glob. Planet. Change 167, 46–60. doi:10.1016/j.gloplacha.2018.05.006
King, O., Quincey, D. J., Carrivick, J. L., and Rowan, A. V. (2017). Spatial Variability in Mass Loss of Glaciers in the Everest Region, central Himalayas, between 2000 and 2015. The Cryosphere 11 (1), 407–426. doi:10.5194/tc-11-407-2017
Kirkbride, M. P. (2011). “Debris-Covered Glaciers,” in Encyclopedia of Snow, Ice and Glaciers. Editors V. P. Singh, P. Singh, and U. K. Haritashya (Dordrecht: Springer Netherlands), 180–182. doi:10.1007/978-90-481-2642-2_622
Kirkbride, M. P., and Deline, P. (2013). The Formation of Supraglacial Debris Covers by Primary Dispersal from Transverse Englacial Debris Bands. Earth Surf. Process. Landforms 38 (15), 1779–1792. doi:10.1002/esp.3416
Kirkbride, M. P. (1993). The Temporal Significance of Transitions from Melting to Calving Termini at Glaciers in the central Southern Alps of New Zealand. The Holocene 3 (3), 232–240. doi:10.1177/095968369300300305
Kneib, M., Miles, E. S., Jola, S., Buri, P., Herreid, S., Bhattacharya, A., et al. (2021). Mapping Ice Cliffs on Debris-Covered Glaciers Using Multispectral Satellite Images. Remote Sensing Environ. 253, 112201. doi:10.1016/j.rse.2020.112201
Knight, J., Harrison, S., and Jones, D. B. (2019). Rock Glaciers and the Geomorphological Evolution of Deglacierizing Mountains. Geomorphology 324, 14–24. doi:10.1016/j.geomorph.2018.09.020
Knight, J., and Harrison, S. (2009). Periglacial and Paraglacial Environments: a View from the Past into the Future. Geol. Soc. Lond. Spec. Publications 320 (1), 1–4. doi:10.1144/SP320.1
Komori, J. (2008). Recent Expansions of Glacial Lakes in the Bhutan Himalayas. Quat. Int. 184 (1), 177–186. doi:10.1016/j.quaint.2007.09.012
Magnússon, E., Muñoz-Cobo Belart, J., Pálsson, F., Ágústsson, H., and Crochet, P. (2016). Geodetic Mass Balance Record with Rigorous Uncertainty Estimates Deduced from Aerial Photographs and Lidar Data - Case Study from Drangajökull Ice Cap, NW Iceland. The Cryosphere 10 (1), 159–177. doi:10.5194/tc-10-159-2016
Maskey, S., Kayastha, R. B., and Kayastha, R. (2020). Glacial Lakes Outburst Floods (GLOFs) Modelling of Thulagi and Lower Barun Glacial Lakes of Nepalese Himalaya. Prog. Disaster Sci. 7, 100106. doi:10.1016/j.pdisas.2020.100106
Maurer, J. M., Schaefer, J. M., Rupper, S., and Corley, A. (2019). Acceleration of Ice Loss across the Himalayas over the Past 40 Years. Sci. Adv. 5 (6), eaav7266. doi:10.1126/sciadv.aav7266
McCarthy, M., Pritchard, H., Willis, I., and King, E. (2017). Ground-penetrating Radar Measurements of Debris Thickness on Lirung Glacier, Nepal. J. Glaciol. 63 (239), 543–555. doi:10.1017/jog.2017.18
McNabb, R., Nuth, C., Kääb, A., and Girod, L. (2019). Sensitivity of Glacier Volume Change Estimation to DEM Void Interpolation. The Cryosphere 13 (3), 895–910. doi:10.5194/tc-13-895-2019
Mihalcea, C., Mayer, C., Diolaiuti, G., Lambrecht, A., Smiraglia, C., and Tartari, G. (2006). Ice Ablation and Meteorological Conditions on the Debris-Covered Area of Baltoro Glacier, Karakoram, Pakistan. Ann. Glaciol. 43, 292–300. doi:10.3189/172756406781812104
Miles, E. S., Pellicciotti, F., Willis, I. C., Steiner, J. F., Buri, P., and Arnold, N. S. (2016). Refined Energy-Balance Modelling of a Supraglacial Pond, Langtang Khola, Nepal. Ann. Glaciol. 57 (71), 29–40. doi:10.3189/2016AoG71A421
Miles, E. S., Watson, C. S., Brun, F., Berthier, E., Esteves, M., Quincey, D. J., et al. (2018a). Glacial and Geomorphic Effects of a Supraglacial lake Drainage and Outburst Event, Everest Region, Nepal Himalaya. The Cryosphere 12, 3891–3905. doi:10.5194/tc-12-3891-2018
Miles, E. S., Willis, I., Buri, P., Steiner, J. F., Arnold, N. S., and Pellicciotti, F. (2018b). Surface Pond Energy Absorption across Four Himalayan Glaciers Accounts for 1/8 of Total Catchment Ice Loss. Geophys. Res. Lett. 45 (1910), 10464–10473. doi:10.1029/2018GL079678
Miles, E. S., Willis, I. C., Arnold, N. S., Steiner, J., and Pellicciotti, F. (2017). Spatial, Seasonal and Interannual Variability of Supraglacial Ponds in the Langtang Valley of Nepal, 1999-2013. J. Glaciol. 63 (237), 88–105. doi:10.1017/jog.2016.120
Millan, R., Mouginot, J., Rabatel, A., Jeong, S., Cusicanqui, D., Derkacheva, A., et al. (2019). Mapping Surface Flow Velocity of Glaciers at Regional Scale Using a Multiple Sensors Approach. Remote Sensing 11 (21), 2498. doi:10.3390/rs11212498
Millan, R., Mouginot, J., Rabatel, A., and Morlighem, M. (2022). Ice Velocity of the World's Glaciers : Reconciling Ice Thickness Distribution with Glacier Dynamics, Nature Geosciences. Nat. Geosciences 15, 124–129.
Mölg, N., Bolch, T., Walter, A., and Vieli, A. (2019). Unravelling the Evolution of Zmuttgletscher and its Debris Cover since the End of the Little Ice Age. The Cryosphere 13 (7), 1889–1909. doi:10.5194/tc-13-1889-2019
Monnier, S., and Kinnard, C. (2017). Pluri-decadal (1955-2014) Evolution of Glacier-Rock Glacier Transitional Landforms in the central Andes of Chile (30-33° S). Earth Surf. Dynam. 5 (3), 493–509. doi:10.5194/esurf-5-493-2017
Monnier, S., and Kinnard, C. (2015). Reconsidering the Glacier to Rock Glacier Transformation Problem: New Insights from the central Andes of Chile. Geomorphology 238, 47–55. doi:10.1016/j.geomorph.2015.02.025
Mool, P. K., Bajracharya, S. R., Joshi, S. P., Sakya, K., and Baidya, A. (2002). Inventory of Glaciers, Glacial Lakes and GLOF Monitoring Nepal. Nepal: International Center for Integrated Mountain Development.
Nicholson, L., and Benn, D. I. (2006). Calculating Ice Melt beneath a Debris Layer Using Meteorological Data. J. Glaciol. 52 (178), 463–470. doi:10.3189/172756506781828584
Nie, Y., Sheng, Y., Liu, Q., Liu, L., Liu, S., Zhang, Y., et al. (2017). A Regional-Scale Assessment of Himalayan Glacial lake Changes Using Satellite Observations from 1990 to 2015. Remote Sensing Environ. 189, 1–13. doi:10.1016/j.rse.2016.11.008
Nuimura, T., Fujita, K., Yamaguchi, S., and Sharma, R. R. (2012). Elevation Changes of Glaciers Revealed by Multitemporal Digital Elevation Models Calibrated by GPS Survey in the Khumbu Region, Nepal Himalaya, 1992-2008. J. Glaciol. 58 (210), 648–656. doi:10.3189/2012jog11j061
Østrem, G. (1975). Erts Data in Glaciology-An Effort to Monitor Glacier Mass Balance from Satellite Imagery. J. Glaciol. 15 (73), 403–415. doi:10.3189/S0022143000034511
Pant, S. R., and Reynolds, J. M. (2000). Application of Electrical Imaging Techniques for the Investigation of Natural Dams: an Example from the Thulagi Glacier Lake, Nepal. J. Nepal Geol. Soc. 22. doi:10.3126/jngs.v22i0.32348
Paudel, U. (2020). Trends of Temperature and Rainfall in Pokhara. Prithvi Acad. J. 3, 22–32. doi:10.3126/paj.v3i0.29556
Paul, F., Barrand, N. E., Baumann, S., Berthier, E., Bolch, T., Casey, K., et al. (2013). On the Accuracy of Glacier Outlines Derived from Remote-Sensing Data. Ann. Glaciol. 54 (63), 171–182. doi:10.3189/2013AoG63A296
Paul, F., Bolch, T., Briggs, K., Kääb, A., McMillan, M., McNabb, R., et al. (2017). Error Sources and Guidelines for Quality Assessment of Glacier Area, Elevation Change, and Velocity Products Derived from Satellite Data in the Glaciers_cci Project. Remote Sensing Environ. 203, 256–275. doi:10.1016/j.rse.2017.08.038
Pekel, J.-F., Cottam, A., Gorelick, N., and Belward, A. S. (2016). High-resolution Mapping of Global Surface Water and its Long-Term Changes. Nature 540 (7633), 418–422. doi:10.1038/nature20584
Planet Labs, (2016). RapidEye Imagery Produce Specification Version 6.1. Available: https://www.planet.com/products/satellite-imagery/files/160625-RapidEye%20Image-Product-Specifications.pdf (Accessed 0805, 2021).
Quincey, D. J., Richardson, S. D., Luckman, A., Lucas, R. M., Reynolds, J. M., Hambrey, M. J., et al. (2007). Early Recognition of Glacial lake Hazards in the Himalaya Using Remote Sensing Datasets. Glob. Planet. Change 56 (1 - 2), 137–152. doi:10.1016/j.gloplacha.2006.07.013
Racoviteanu, A. E., Arnaud, Y., Williams, M. W., and Manley, W. F. (2015). Spatial Patterns in Glacier Characteristics and Area Changes from 1962 to 2006 in the Kanchenjunga-Sikkim Area, Eastern Himalaya. The Cryosphere 9 (2), 505–523. doi:10.5194/tc-9-505-2015
Racoviteanu, A. E., Arnaud, Y., Williams, M. W., and Ordoñez, J. (2008). Decadal Changes in Glacier Parameters in the Cordillera Blanca, Peru, Derived from Remote Sensing. J. Glaciol. 54 (186), 499–510. doi:10.3189/002214308785836922
Racoviteanu, A. E., Nicholson, L., and Glasser, N. F. (2021). Surface Composition of Debris-Covered Glaciers across the Himalaya Using Linear Spectral Unmixing of Landsat 8 OLI Imagery. The Cryosphere 15 (9), 4557–4588. doi:10.5194/tc-2020-37210.5194/tc-15-4557-2021
Racoviteanu, A., Paul, F., Raup, B., Khalsa, S. J. S., and Armstrong, R. (2009). Challenges and Recommendations in Mapping of Glacier Parameters from Space: Results of the 2008 Global Land Ice Measurements from Space (GLIMS) Workshop, Boulder, Colorado, USA. Ann. Glaciology 50 (53). doi:10.3189/172756410790595804
Ragettli, S., Bolch, T., and Pellicciotti, F. (2016). Heterogeneous Glacier Thinning Patterns over the Last 40 Years in Langtang Himal, Nepal. The Cryosphere 10, 2075 - 2097. doi:10.5194/tc-10-2075-2016
Raup, B. H., and Khalsa, S. J. S. (2007). GLIMS Analysis Tutorial . GLIMS. Available: http://www.glims.org/MapsAndDocs/assets/GLIMS_Analysis_Tutorial_a4.pdf (Accessed 01 10, 2007 2007).
Reid, T. D., and Brock, B. W. (2014). Assessing Ice-Cliff Backwasting and its Contribution to Total Ablation of Debris-Covered Miage Glacier, Mont Blanc Massif, Italy. J. Glaciol. 60 (219), 3–13. doi:10.3189/2014JoG13J045
Ren, J., Jing, Z., Pu, J., and Qin, X. (2006). Glacier Variations and Climate Change in the central Himalaya over the Past Few Decades. Ann. Glaciol. 43, 218–222. doi:10.3189/172756406781812230
Reynolds, J. M. (2014). Assessing Glacial Hazards for Hydropower Development in the Himalayas, Hindu Kush and Karakoram. Int. J. Hydropower Dams 21 (1), 60–65.
Reynolds, J. M. (2000). “On the Formation of Supraglacial Lakes on Debris-Covered Glaciers,” in Debris-covered Glaciers. Editors M. Nakawo, C. F. Raymond, and A. Fountain (Wallingsford: IAHS, published online by Cambridge University Press), 153–161.
Richardson, S. D., and Reynolds, J. M. (2000). An Overview of Glacial Hazards in the Himalayas. Quat. Int. 65-66, 31–47. doi:10.1016/s1040-6182(99)00035-x
Robson, B. A., Nuth, C., Nielsen, P. R., Girod, L., Hendrickx, M., and Dahl, S. O. (2018). Spatial Variability in Patterns of Glacier Change across the Manaslu Range, Central Himalaya. Front. Earth Sci. 6, 12. doi:10.3389/feart.2018.00012
Rounce, D. R., Hock, R., McNabb, R. W., Millan, R., Sommer, C., Braun, M. H., et al. (2021). Distributed Global Debris Thickness Estimates Reveal Debris Significantly Impacts Glacier Mass Balance. Geophys. Res. Lett. 48 (8), e2020GL091311. doi:10.1029/2020GL091311
Rowan, A. V., Egholm, D. L., Quincey, D. J., and Glasser, N. F. (2015). Modelling the Feedbacks between Mass Balance, Ice Flow and Debris Transport to Predict the Response to Climate Change of Debris-Covered Glaciers in the Himalaya. Earth Planet. Sci. Lett. 430, 427–438. doi:10.1016/j.epsl.2015.09.004
Rowan, A. V., Nicholson, L. I., Quincey, D. J., Gibson, M. J., Irvine-Fynn, T. D. L., Watson, C. S., et al. (2020). Seasonally Stable Temperature Gradients through Supraglacial Debris in the Everest Region of Nepal, Central Himalaya. J. Glaciol. 67, 170–181. doi:10.1017/jog.2020.100
Rowan, A. V. (2017). The ‚Little Ice Age' in the Himalaya: A Review of Glacier advance Driven by Northern Hemisphere Temperature Change. The Holocene 27 (2), 292–308. doi:10.1177/0959683616658530
Sakai, A. (2019). Brief Communication: Updated GAMDAM Glacier Inventory over High-Mountain Asia. The Cryosphere 13 (7), 2043–2049. doi:10.5194/tc-13-2043-2019
Sakai, A., and Fujita, K. (2010). Formation Conditions of Supraglacial Lakes on Debris-Covered Glaciers in the Himalaya. J. Glaciol. 56 (195), 177–181. doi:10.3189/002214310791190785
Sakai, A., Nakawo, M., and Fujita, K. (2002). Distribution Characteristics and Energy Balance of Ice Cliffs on Debris-Covered Glaciers, Nepal Himalaya. Arctic, Antarctic, Alpine Res. 34 (1), 12–19. doi:10.1080/15230430.2002.12003463
Sakai, A., Nakawo, M., and Fujita, K. (1998). Melt Rate of Ice Cliffs on the Lirung Glacier, Nepal Himalayas, 1996. Bull. Glacier Res. 16 (57 - 66).
Sakai, A., Takeuchi, N., Fujita, K., and Nakawo, M. (2000). Role of Supraglacial Ponds in the Ablation Process of a Debris-Covered Glacier in the Nepal Himalayas. Int. Assoc. Hydrological Sci. 264, 119–130.
Salerno, F., Thakuri, S., D’Agata, C., Smiraglia, C., Manfredi, E. C., Viviano, G., et al. (2012). Glacial lake Distribution in the Mount Everest Region: Uncertainty of Measurement and Conditions of Formation. Glob. Planet. Change 92-93, 30–39. doi:10.1016/j.gloplacha.2012.04.001
Salerno, F., Thakuri, S., Tartari, G., Nuimura, T., Sunako, S., Sakai, A., et al. (2017). Debris-covered Glacier Anomaly? Morphological Factors Controlling Changes in the Mass Balance, Surface Area, Terminus Position, and Snow Line Altitude of Himalayan Glaciers. Earth Planet. Sci. Lett. 471, 19–31. doi:10.1016/j.epsl.2017.04.039
Sapkota, A., Kayastha, R., Kafle, K., and Thapa, A. (2016). “Geomorphological Mapping of Lower Part of Ponkar Glacier, Bhimthang, Manang,” in National Symposium on Hydrology and Metereology, Kathmandu, Nepal. doi:10.13140/RG.2.2.34880.33287
Scherler, D., Bookhagen, B., and Strecker, M. R. (2011). Spatially Variable Response of Himalayan Glaciers to Climate Change Affected by Debris Cover. Nat. Geosci 4 (3), 156–159. doi:10.1038/ngeo1068
Scherler, D., Wulf, H., and Gorelick, N. (2018). Global Assessment of Supraglacial Debris-Cover Extents. Geophys. Res. Lett. 45 (2111), 11798–11805. doi:10.1029/2018GL080158
Scott Watson, C., Quincey, D. J., Carrivick, J. L., and Smith, M. W. (2017a). Ice Cliff Dynamics in the Everest Region of the Central Himalaya. Geomorphology 278 (C), 238–251. doi:10.1016/j.geomorph.2016.11.017
Shannon, S., Smith, R., Wiltshire, A., Payne, T., Huss, M., Betts, R., et al. (2019). Global Glacier Volume Projections under High-End Climate Change Scenarios. The Cryosphere 13 (1), 325–350. doi:10.5194/tc-13-325-2019
Shean, D. E., Alexandrov, O., Moratto, Z. M., Smith, B. E., Joughin, I. R., Porter, C., et al. (2016). An Automated, Open-Source Pipeline for Mass Production of Digital Elevation Models (DEMs) from Very-High-Resolution Commercial Stereo Satellite Imagery. ISPRS J. Photogrammetry Remote Sensing 116, 101–117. doi:10.1016/j.isprsjprs.2016.03.012
Shean, D. E., Bhushan, S., Montesano, P., Rounce, D. R., Arendt, A., and Osmanoglu, B. (2020). A Systematic, Regional Assessment of High Mountain Asia Glacier Mass Balance. Front. Earth Sci. 7, 363. doi:10.3389/feart.2019.00363
Shean, D. E. (2017). HMA 8-meter DEM Mosaics Derived from Optical Imagery, V1. NSIDC DAAC: NSIDC Distributed Active Archive Center.
Shrestha, R., Kayastha, R. B., and Kayastha, R. (2020). Effect of Debris on Seasonal Ice Melt (2016-2018) on Ponkar Glacier, Manang, Nepal. Sci. Cold Regions 12 (5), 261–271. doi:10.3724/SP.J.1226.2020.00272
Shrestha, S., Bhandari, R., Bashyal, A., and Shrestha, N. (2021). A Comparative Study of Physico-Chemical Parameter in Glacial Melt Water, Ponkar Glacier, Nepal. OALib 08, 1–10. doi:10.4236/oalib.1107160
Shroder, J. F., Bishop, M. P., Copland, L., and Sloan, V. F. (2000). Debris‐covered Glaciers and Rock Glaciers in the Nanga Parbat Himalaya, pakistan. Geografiska Annaler: Ser. A, Phys. Geogr. 82 (1), 17–31. doi:10.1111/j.0435-3676.2000.00108.x
Shukla, A., Garg, P. K., and Srivastava, S. (2018). Evolution of Glacial and High-Altitude Lakes in the Sikkim, Eastern Himalaya over the Past Four Decades (1975-2017). Front. Environ. Sci. 6, 81. doi:10.3389/fenvs.2018.00081
Smiraglia, C., Diolaiuti, G., Casati, D., and Kirkbride, M. P. (2000). “Recent Areal and Altimetric Variations of Miage Glacier (Monte Bianco Massif, Italian Alps),” in Debris-covered Glaciers. Editors M. Nakawo, C. F. Raymond, and A. Fountain (Wellingsford: IAHS, published online by Cambridge University Press), 227–233.
Solomina, O. N., Bradley, R. S., Hodgson, D. A., Ivy-Ochs, S., Jomelli, V., Mackintosh, A. N., et al. (2015). Holocene Glacier Fluctuations. Quat. Sci. Rev. 111, 9–34. doi:10.1016/j.quascirev.2014.11.018
Steiner, J. F., Buri, P., Miles, E. S., Ragettli, S., and Pellicciotti, F. (2019). Supraglacial Ice Cliffs and Ponds on Debris-Covered Glaciers: Spatio-Temporal Distribution and Characteristics. J. Glaciol. 65 (252), 617–632. doi:10.1017/jog.2019.40
Steiner, J. F., Pellicciotti, F., Buri, P., Miles, E. S., Immerzeel, W. W., and Reid, T. D. (2015). Modelling Ice-Cliff Backwasting on a Debris-Covered Glacier in the Nepalese Himalaya. J. Glaciol. 61, 889–907. doi:10.3189/2015JoG14J194
Stokes, C. R., Popovnin, V., Aleynikov, A., Gurney, S. D., and Shahgedanova, M. (2007). Recent Glacier Retreat in the Caucasus Mountains, Russia, and Associated Increase in Supraglacial Debris Cover and Supra-/proglacial lake Development. Ann. Glaciol. 46, 195–203. doi:10.3189/172756407782871468
Survey of India (2005). National Map Policy. Survey of India. Available: http://www.surveyofindia.gov.in/tenders/nationalmappolicy/nationalmappolicy.pdf (Accessed October 24, 2010).
Sutherland, J. L., Carrivick, J. L., Gandy, N., Shulmeister, J., Quincey, D. J., and Cornford, S. L. (2020). Proglacial Lakes Control Glacier Geometry and Behavior during Recession. Geophys. Res. Lett. 47 (19), e2020GL088865. doi:10.1029/2020GL088865
Tadono, T., Ishida, H., Oda, F., Naito, S., Minakawa, K., and Iwamoto, H. (2014). Precise Global DEM Generation by ALOS PRISM. ISPRS Ann. Photogramm. Remote Sens. Spat. Inf. Sci. II-4, 71–76. doi:10.5194/isprsannals-II-4-71-2014
Tampucci, D., Citterio, C., Gobbi, M., and Caccianiga, M. (2016). Vegetation Outlines of a Debris-Covered Glacier Descending below the Treeline. Plant Sociol. 53, 43–52. doi:10.7338/pls2016531/03
Taylor, C. J., Carr, J. R., and Rounce, D. R. (2021). Spatiotemporal Supraglacial Pond and Ice Cliff Changes in the Bhutan-Tibet Border Region from 2016 to 2018. J. Glaciol., 1–13. doi:10.1017/jog.2021.76
Thakuri, S., Salerno, F., Smiraglia, C., Bolch, T., D'Agata, C., Viviano, G., et al. (2014). Tracing Glacier Changes since the 1960s on the South Slope of Mt. Everest (central Southern Himalaya) Using Optical Satellite Imagery. The Cryosphere 8, 1297 - 1315. doi:10.5194/tc-8-1297-2014
Thompson, S. S., Benn, D. I., Dennis, K., and Luckman, A. (2012). A Rapidly Growing Moraine-Dammed Glacial lake on Ngozumpa Glacier, Nepal. Geomorphology 145-146, 1–11. doi:10.1016/j.geomorph.2011.08.015
Tielidze, L. G., Bolch, T., Wheate, R. D., Kutuzov, S. S., Lavrentiev, I. I., and Zemp, M. (2020). Supra-glacial Debris Cover Changes in the Greater Caucasus from 1986 to 2014. The Cryosphere 14, 585–598. doi:10.5194/tc-14-585-2020
van Woerkom, T., Steiner, J. F., Kraaijenbrink, P. D. A., Miles, E. S., and Immerzeel, W. W. (2019). Sediment Supply from Lateral Moraines to a Debris-Covered Glacier in the Himalaya. Earth Surf. Dynam. 7 (2), 411–427. doi:10.5194/esurf-7-411-2019
Vermote, E. F., Tanre, D., Deuze, J. L., Herman, M., and Morcette, J.-J. (1997). Second Simulation of the Satellite Signal in the Solar Spectrum, 6S: an Overview. IEEE Trans. Geosci. Remote Sensing 35 (3), 675–686. doi:10.1109/36.581987
Vincent, C., Wagnon, P., Shea, J. M., Immerzeel, W. W., Kraaijenbrink, P., Shrestha, D., et al. (2016). Reduced Melt on Debris-Covered Glaciers: Investigations from Changri Nup Glacier, Nepal. The Cryosphere 10 (4), 1845–1858. doi:10.5194/tc-10-1845-2016
Watson, C. S., Kargel, J. S., Shugar, D. H., Haritashya, U. K., Schiassi, E., and Furfaro, R. (2020). Mass Loss from Calving in Himalayan Proglacial Lakes. Front. Earth Sci. 7, 342. doi:10.3389/feart.2019.00342
Watson, C. S., Quincey, D. J., Carrivick, J. L., and Smith, M. W. (2016). The Dynamics of Supraglacial Ponds in the Everest Region, central Himalaya. Glob. Planet. Change 142 (Suppl. C), 14–27. doi:10.1016/j.gloplacha.2016.04.008
Watson, C. S., Quincey, D. J., Smith, M. W., Carrivick, J. L., Rowan, A. V., and James, M. R. (2017b). Quantifying Ice Cliff Evolution with Multi-Temporal point Clouds on the Debris-Covered Khumbu Glacier, Nepal. J. Glaciol. 63 (241), 823–837. doi:10.1017/jog.2017.47
Welch, B. L. (1947). The Generalization of ‚Student's' Problem when Several Different Population Varlances Are Involved. Biometrika 34 (1-2), 28–35. doi:10.1093/biomet/34.1-2.28
Xie, F., Liu, S., Wu, K., Zhu, Y., Gao, Y., Qi, M., et al. (2020). Upward Expansion of Supra-glacial Debris Cover in the Hunza Valley, Karakoram, during 1990 ∼ 2019. Front. Earth Sci. 8 (308). doi:10.3389/feart.2020.00308
Keywords: Himalayan glaciers, Manaslu region, geodetic mass balance, debris cover, geomorphology, Corona/RapidEye
Citation: Racoviteanu AE, Glasser NF, Robson BA, Harrison S, Millan R, Kayastha RB and Kayastha R (2022) Recent Evolution of Glaciers in the Manaslu Region of Nepal From Satellite Imagery and UAV Data (1970–2019). Front. Earth Sci. 9:767317. doi: 10.3389/feart.2021.767317
Received: 30 August 2021; Accepted: 17 November 2021;
Published: 11 April 2022.
Edited by:
Argha Banerjee, Indian Institute of Science Education and Research, IndiaReviewed by:
Levan Tielidze, Victoria University of Wellington, New ZealandRachel Joanne Carr, Newcastle University, United Kingdom
Copyright © 2022 Racoviteanu, Glasser, Robson, Harrison, Millan, Kayastha and Kayastha. This is an open-access article distributed under the terms of the Creative Commons Attribution License (CC BY). The use, distribution or reproduction in other forums is permitted, provided the original author(s) and the copyright owner(s) are credited and that the original publication in this journal is cited, in accordance with accepted academic practice. No use, distribution or reproduction is permitted which does not comply with these terms.
*Correspondence: Adina E. Racoviteanu, a.racoviteanu@exeter.ac.uk