SMART Subsea Cables for Observing the Earth and Ocean, Mitigating Environmental Hazards, and Supporting the Blue Economy
 Bruce M. Howe1*
  Michael Angove2
  Jérome Aucan3
  Christopher R. Barnes4
  José S. Barros5 Nigel Bayliff6 Nathan C. Becker7
  Fernando Carrilho8 Matthew J. Fouch9
  Bill Fry10
  Anthony Jamelot11 Helen Janiszewski12 Laura S. L. Kong13
  Stephen Lentz14
  Douglas S. Luther15
  Giuditta Marinaro16
  Luís Manuel Matias17
  Charlotte A. Rowe18
  Andi E. Sakya19,20
  Amir Salaree21
  Torsten Thiele22
  Frederik J. Tilmann23
  Christa von Hillebrandt-Andrade24
  Laura Wallace10,25
  Stuart Weinstein7
  William Wilcock26
- 1Department of Ocean and Resources Engineering, University of Hawaiʻi at Mānoa, Honolulu, HI, United States
- 2NOAA National Weather Service Tsunami Program, Silver Spring, MD, United States
- 3Pacific Community Centre for Ocean Sciences, Nouméa, New Caledonia
- 4University of Victoria, Victoria, BC, Canada
- 5Autoridade Nacional de Comunicações (ANACOM), Lisbon, Portugal
- 6Aqua Comms, Dublin, Ireland
- 7NOAA Pacific Tsunami Warning Center, Honolulu, HI, United States
- 8Instituto Português Do Mar e da Atmosfera, Lisbon, Portugal
- 9Subsea Data Systems, Inc., Washington, DC, United States
- 10GNS Science, Lower Hutt, New Zealand
- 11Laboratoire de Géophysique de Pamatai, CEA, Papeete, French-Polynesia
- 12Department of Earth Sciences, University of Hawaiʻi at Mānoa, Honolulu, HI, United States
- 13UNESCO IOC—NOAA International Tsunami Information Center, Honolulu, HI, United States
- 14Ocean Specialists, Inc., McLean, VA, United States
- 15Department of Oceanography, University of Hawaiʻi at Mānoa, Honolulu, HI, United States
- 16Istituto Nazionale di Geofisica e Vulcanologia, Roma, Italy
- 17Instituto Dom Luiz, Faculdade de Ciências, Universidade de Lisboa, Lisboa, Portugal
- 18Los Alamos National Laboratory, Earth and Environmental Science, Los Alamos, NM, United States
- 19National Agency for Research and Innovation (BRIN), Jakarta, Indonesia
- 20Indonesia Institute of Technology (ITI), Tangerang, Indonesia
- 21Earth and Environmental Sciences, University of Michigan, Ann Arbor, MI, United States
- 22Institute for Advanced Sustainability Studies (IASS), Potsdam, Germany
- 23GFZ German Research Centre for Geosciences, Potsdam, Germany
- 24UNESCO IOC—NOAA International Tsunami Information Center, Caribbean Office, Mayagüez, PR, United States
- 25Institute for Geophysics, University of Texas at Austin, Austin, TX, United States
- 26School of Oceanography, University of Washington, Seattle, WA, United States
The Joint Task Force, Science Monitoring And Reliable Telecommunications (JTF SMART) Subsea Cables, is working to integrate environmental sensors for ocean bottom temperature, pressure, and seismic acceleration into submarine telecommunications cables. The purpose of SMART Cables is to support climate and ocean observation, sea level monitoring, observations of Earth structure, and tsunami and earthquake early warning and disaster risk reduction, including hazard quantification. Recent advances include regional SMART pilot systems that are the first steps to trans-ocean and global implementation. Examples of pilots include: InSEA wet demonstration project off Sicily at the European Multidisciplinary Seafloor and water column Observatory Western Ionian Facility; New Caledonia and Vanuatu; French Polynesia Natitua South system connecting Tahiti to Tubaui to the south; Indonesia starting with short pilot systems working toward systems for the Sumatra-Java megathrust zone; and the CAM-2 ring system connecting Lisbon, Azores, and Madeira. This paper describes observing system simulations for these and other regions. Funding reflects a blend of government, development bank, philanthropic foundation, and commercial contributions. In addition to notable scientific and societal benefits, the telecommunications enterprise’s mission of global connectivity will benefit directly, as environmental awareness improves both the integrity of individual cable systems as well as the resilience of the overall global communications network. SMART cables support the outcomes of a predicted, safe, and transparent ocean as envisioned by the UN Decade of Ocean Science for Sustainable Development and the Blue Economy. As a continuation of the OceanObs’19 conference and community white paper (Howe et al., 2019, doi: 10.3389/fmars.2019.00424), an overview of the SMART programme and a description of the status of ongoing projects are given.
1 Introduction: The SMART Cables Concept
The last two decades witnessed an astonishing advancement and confluence of priorities in scientific research, ocean sensor technologies, subsea telecommunication cables, and societal and political needs to meet major environmental threats and hazard mitigation. The potential for rapid acceptance and deployment of sophisticated subsea cable systems was articulated by Howe et al. (2019) and this present paper documents the significant advances over the last 2 years in both new deployments and subdisciplines in Earth and ocean sciences.
These developments come at a time when the telecommunications industry is managing a sharp increase in Internet traffic from multiple sources including high frequency stock market trading, video entertainment, 5G networks, the Internet of Things (IoT), remote classrooms and teleconferencing, and work-from-home employment spurred on by the COVID-19 pandemic. A decade or two ago there were only a few major trans-ocean cable installation companies, whereas now leading data companies (e.g., Google, Apple, Microsoft, Amazon, and Facebook) are themselves funding higher capacity cable systems and establishing new routes.
A recent workshop of the National Academies of Sciences, Engineering, and Medicine (National Academies of Sciences, Engineering, and Medicine, 2020, p. 1) noted that “Uninterrupted, multi-decadal observations of the ocean are critical to understanding the Earth system as a whole and managing the ocean’s resources on which human lives and economies depend”. Sustained and real-time ocean data are integral to the new Blue Economy (Spinrad, 2016; European Marine Board, 2019; Weller at al., 2019; World Ocean Initiative, 2020; Carney, 2021).
A complementary development in the last few years has been the international recognition for urgent and coordinated responses to environmental threats posed by climate change, sea level rise, and tsunamis, which imposed huge and unacceptable human tragedies, deaths, and financial losses. These were addressed in part by the Paris Climate Agreement, which was adopted by 191 national parties in 2015, with specified action targets to mid-century, and by the recent IPCC et al. (2021). Since 2000, over 250,000 deaths have been attributed to earthquakes and tsunamis worldwide with an associated damage cost of over $400 billion. Other relevant United Nations programs are discussed below. The net result is the alignment of scientific and technical advances, telecom and cable industries’ expanding needs, and growing political and societal demands for environmental protection and hazard mitigation.
Deploying oceanographic sensors on new undersea telecommunication cables is a promising solution for obtaining the extensive, longitudinal, real-time data that are critical for understanding and managing these urgent environmental issues. Such sensors can provide important environmental data from sites in the deep ocean and continental margins that are otherwise difficult and expensive to obtain in real time, continuously, and over decadal time scales. Suitable sensors are already deployed on dedicated cabled ocean observatories, some of which are described below. With modest non-recurring engineering expenses, these sensors can be further integrated into future telecommunications cables to greatly increase spatial coverage and create a global network of Science Monitoring And Reliable Telecommunication (SMART) cable systems (Figure 1).
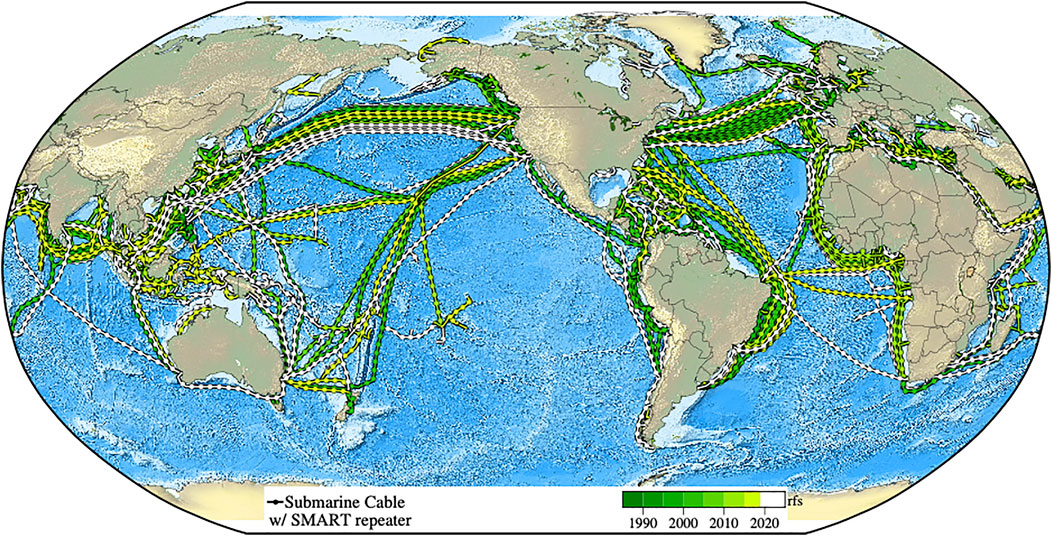
FIGURE 1. Current and planned cables span the oceans, enabling the Internet and our modern society. As they are replaced and expanded over their 10–25-years refresh cycle, environmental sensors (pressure, temperature, acceleration) can be added to the cable repeaters every ∼100 km, gradually obtaining real time global coverage (for clarity, repeaters are shown only every 300 km; rfs = year ready for service). Cable data: TeleGeography’s Telecom Resources licensed under Creative Commons ShareAlike. Permission obtained for use of figure.
The SMART cables concept originated decades ago and was demonstrated on a small scale by placing a few sensors at the end of disused cables, such as off the coast of Japan in the 1990s for detecting earthquakes and tsunamis. A major advancement came with using modern fiber-optic cables, capable of delivering power and high-bandwidth, as the backbone of dedicated sustained cabled observatories to obtain data on complex ocean systems well beyond what is available from conventional research vessels and fixed buoys (Favali et al., 2010, Favali et al., 2015; Lo Bue et al., 2021). The first such operational cabled observatories were the 2006 coastal VENUS system (Tunnicliffe et al., 2008) and the regional NEPTUNE observatory in 2009 (Barnes et al., 2015; Best et al., 2015), both now within Ocean Networks Canada (ONC). Similar observatories, tailored to national, scientific, and geographical needs, have included: Japan—DONET and S-net (Kawaguchi et al., 2015; Kanazawa et al., 2016; Aoi et al., 2020); USA—Ocean Observatories Initiative (OOI) and others (Massion and Raybould, 2006; Kelley et al., 2014; Howe et al., 2015); China (Lu et al., 2015); and Europe (Best et al., 2014; Person et al., 2015; Dañobeitia et al., 2020). These developments have in turn fostered the evolution of progressively smaller, more precise, and reliable sensors (Schaad, 2009; Paros et al., 2012; RBR, 2017; Delory and Pearlman, 2018; Lin and Yang, 2020). Such developments have direct applications to programs (e.g., NASA) for extraterrestrial ocean exploration (Aguzzi et al., 2020), with reciprocal benefits as well.
Advocacy for the SMART cables concept began with a paper by You (2010). In 2012, following workshops in Rome (2011) and Paris (2012), three UN agencies (International Telecommunication Union (ITU), World Meteorological Organization (WMO), and the Intergovernmental Oceanographic Commission of the United Nations Educational, Scientific and Cultural Organization (UNESCO/IOC)) established the Joint Task Force (JTF) to facilitate development of the concept (Butler, et al., 2014). The initial period of development of JTF was described by Barnes (2018) and details of workshops and publications are provided on the JTF web site: https://www.itu.int/en/ITU-T/climatechange/task-force-sc.
SMART cables represent a potential major new element in the Global Ocean Observing System (GOOS Steering Committee, 2019). The JTF is engaging with the GOOS Framework for Ocean Observing (FOO) as it develops SMART cables (http://www.oceanobs09.net/foo/; Lindstrom et al., 2014). A core concept of the GOOS FOO is “Essential Ocean Variables” (EOV): high-impact, discrete, feasibly monitored observable attributes of the global oceans. SMART cables, by their nature as extensive, deep-ocean, high-data-rate observatories, directly address several of the GOOS EOVs. For example, Ocean Bottom Pressure (OBP) was recently accepted as an emerging EOV and SMART cables are potentially the most extensive and cost-effective source for such measurements. SMART cables also measure Subsurface Temperature EOV and the OBP capabilities of SMART cables would address one aspect of the Sea Surface Height EOV. GOOS prescribes a phased approach for new ocean observing technologies, from concept to regional pilots through global implementation. The JTF is following this approach to ensure that SMART cables and data derived from them can be seamlessly incorporated into GOOS within a comprehensive Deep Ocean Observing Strategy (DOOS; Levin et al., 2019).
A central feature of the SMART cables concept is combining two key themes of the 21st century: the increasing pressure for global connectivity and urgent need for coherent, concerted global effort on climate change and ocean management. The market-driven investment in information infrastructure can be harnessed to achieve tangible, social benefits in climate and ocean science. The relatively modest suite of proposed instruments will help address many of the applied science and societal needs and facilitate monitoring the physical integrity of the cable itself. The importance of such synergy is reflected in the themes of OceanObs’19 (e.g., the “Blue Economy” and “Ocean Discovery”, particularly in the deep oceans) and the UN’s Sustainable Development Goals (SDG 13—Climate and SDG 14—Oceans). With respect to the latter, the JTF has been endorsed as a project of the UN Decade of Ocean Science for Sustainable Development.
The JTF and its industry partners recognize the need for funding sources to contribute to the development costs of integrating sensors into existing submarine cable components and toward the incremental capital expenditures associated with adding SMART capabilities to telecommunications cable systems. The first step underway is a wet demonstration/pilot project in which sensor packages are included on a relatively short submarine cable using standard industry practices, with real-time data retrieved over a minimum of 1 year. Multiple suitable cable projects are in the planning stages in the South Pacific, northeastern Atlantic, and Mediterranean where the JTF can validate not only the technical elements, but also the data management, regulatory clearances, and funding mechanisms (e.g., multilateral development banks).
We call out two specific positive developments. First, Alcatel Submarine Networks in a press release stated: “Global warming presents real and measurable risks for our society. ASN is launching a number of initiatives to help address climate change” and “Our entire portfolio will benefit from this new “CC” (Climate Change) philosophy to propose dedicated applications such as TEWS (tsunami early warning system), monitoring of underwater seismic activity, global warming, and water temperature and level” (Alcatel Submarine Networks, 2020). Second, The Portuguese government announced that it would finance and build the CAM-2 system connecting Lisbon, Azores, and Madeira in a ring system, including “provision of services, namely seismic detection, for the production of alerts, environmental measurements… and data transmission of scientific projects” (Government of Portugal, 2020). These two announcements indicate that suppliers acknowledge the societal demand for SMART systems and expect to provide them. More importantly, these developments demonstrate that there are governments investing in the same, recognizing the need to share the submarine critical infrastructure between telecom and science and early warning.
This paper is an update to SMART Cables for Observing the Global Ocean: Science and Implementation (Howe et al., 2019), with a scientific emphasis on geophysics and hazard early warning. The paper first explains how SMART cables can improve our understanding of myriad geophysical and ocean processes, including global seismology, tsunami modeling, ocean temperature and circulation, sea level rise, tides, and wind waves (Section 2). It then details practical aspects of creating such a network: what sensors with what requirements will SMART repeaters use and how will they integrate into subsea telecommunications cable systems (Section 3); and the presently planned and proposed systems (Section 4). In Other Developments, we discuss data management, legal, permitting and security, costs and financing, and relationship to other organizations (Section 5). Concluding remarks are given in Section 6.
2 Improvements in Earth and Ocean Observing
The data collected by the SMART cables will greatly enhance and complement the observation networks already in place today. The variables measured by the SMART cable repeaters are ocean bottom temperature, pressure, and seismic acceleration. Importantly, as discussed in the Introduction, the direct measurements and their derivatives respond directly to the GOOS need for greater attention to EOVs and the UN imperative to contribute to the SDGs and the Decade of Ocean Science. More broadly and in the future, the SMART cable infrastructure will provide a general interface into the deep ocean.
2.1 Geophysics and Seismology
The inclusion of high-sensitivity accelerometers and pressure sensors on SMART cables holds great potential for significant advances for the field of seismology by improving our capacity to detect and locate small earthquakes below the ocean floor, improving our ability to determine the rupture type and dynamics for larger offshore earthquakes, and enhancing our ability to image the interior of the Earth, both locally and globally, from earthquakes occurring all around the globe.
One intriguing opportunity for leveraging the seismic sensors is the global characterization of seafloor seismic noise. Noise sources range from the primary and secondary oceanic microseisms to seafloor currents, anthropogenic sources such as shipping traffic and marine surveys, as well as narrow directional contributions from bathymetric anomalies. The deployment of permanent seismic sensors along widely distributed telecommunications cables offers an unprecedented opportunity to observe, characterize and attribute geographically extensive and dynamically changing seafloor seismic noise, whose features have only been sparsely sampled to date through isolated and usually time-limited ocean bottom seismometer (OBS) experiments.
Another exciting opportunity that the presence of SMART seismic sensors could provide is the ability to exploit random sources of opportunity for basic structural imaging. Nearby marine seismic surveys are one obvious example, but recent observations of whale song on seafloor sensors (Kuna and Nábělek. 2021) or well-established techniques based on the analysis of noise recordings (Crawford and Singh, 2008) suggest a similar leveraging for shallow geologic imaging along the lengths of any observing SMART cables.
Ranasinghe et al. (2018) used forward modeling to compare the potential improvement in ray coverage for global tomographic models, when notional SMART Cables are added to existing (or previous) observational capability. The naturally heterogeneous distribution of earthquake sources (Figure 2), along with predominantly land-based sensors (Figure 2), result in significant regions of the globe poorly or completely unsampled by propagating seismic waves.
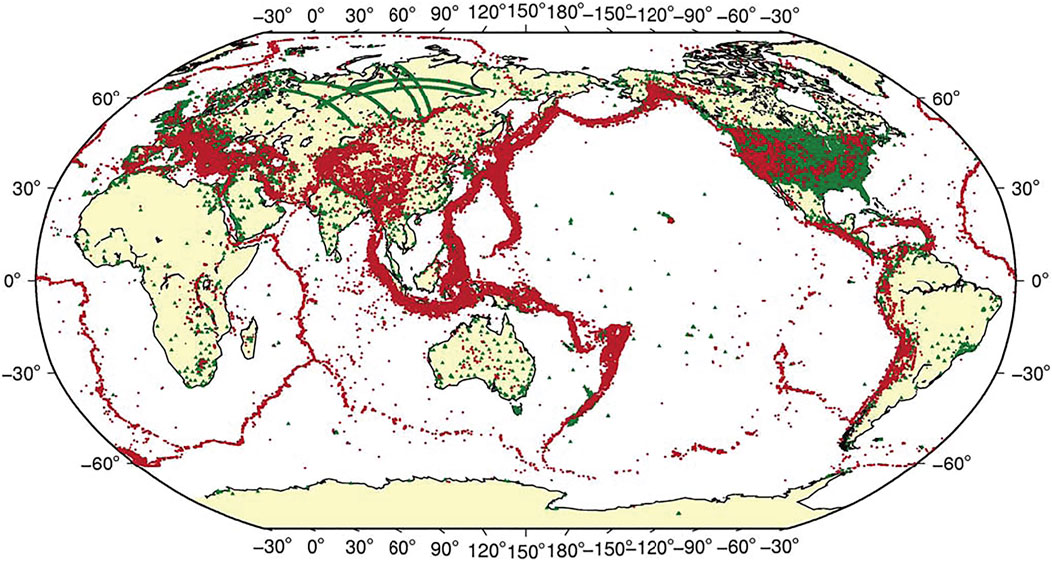
FIGURE 2. Global seismic sources (red) and existing or previously existing seismic stations (green) showing heterogeneity of coverage, with particular absence of sources and receivers in the ocean basins.
Ranasinghe et al. (2018) demonstrated as much as 300% improvement in some oceanic areas (Figures 3A,B) by including notional SMART cables. Figures 3C,D illustrate a mantle cross-section comparing existing ray sampling vs. that achievable by the addition of SMART Cables. Ongoing research includes comparisons of global tomographic model resolution, which is critical to understanding the improved confidence in propagation times and, for properly calibrated sensors, path-dependent attenuation.
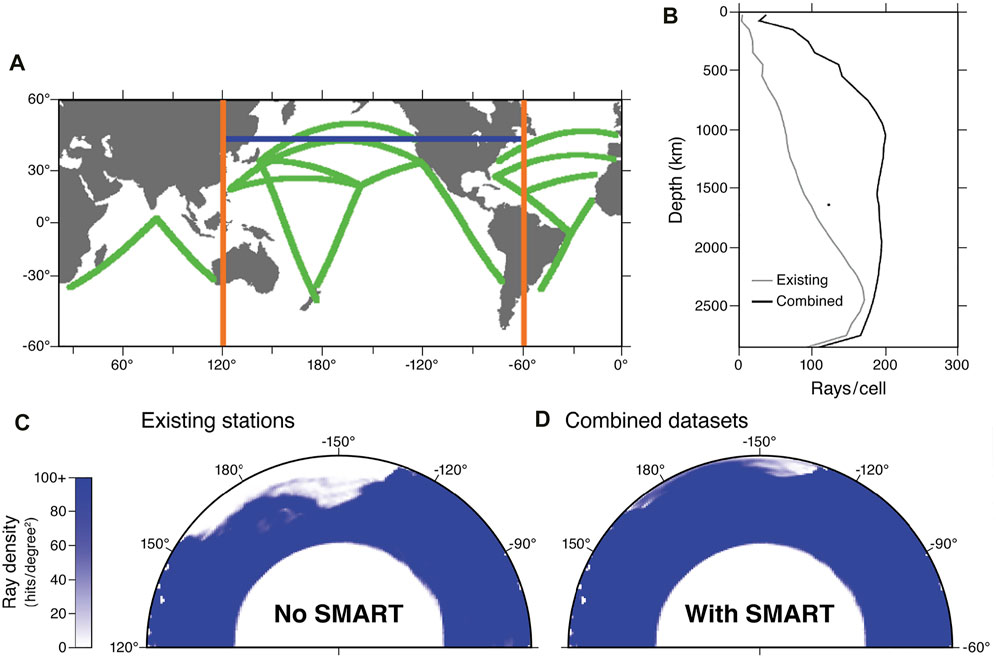
FIGURE 3. (A) Notional SMART cable routes. (B) Comparison of coverage for seismic paths sampled beneath the northern Pacific Ocean, for existing stations (gray line) versus addition of notional SMART Cables (black). The curves represent the material volume in which each 1° × 1° x 100 km depth element is sampled by more than 100 rays. Horizontal axis represents units of 105 cubic kilometers (Ranasinghe et al., 2018). (C,D) Example of ray path coverage (hit counts) for 1 × 1 degree x 100 km depth volumes in north-central Pacific, for (C) existing station coverage vs. (D) combined existing stations and SMART cables for the section indicated with a blue line in (A). This modeling was undertaken using the global ak135 Earth model. Color scale saturates at 100 rays per volume element.
In addition to utility in tsunami warning (below), OBP sensors have also shown great promise for seafloor geodetic applications, specifically for identification of cm-level vertical tectonic deformation during earthquakes and slow slip events at subduction zones, and volcanic events (e.g., Chadwick et al., 2006; Iinuma et al., 2012; Ito et al., 2013; Wallace et al., 2016). Having OBP sensing capability on cables spanning regions that could host such events will add greatly to global seafloor geodetic sensing capability and enhance our ability to monitor a range of seafloor deformation processes at offshore tectonic plate boundaries.
2.2 Seismic and Tsunami Monitoring and Warning
In our previous paper, we presented a full discussion on how SMART cables can benefit tsunami warning capabilities (Howe et al., 2019). Angove et al. (2019) give more information on the tsunami warning problem. In this section we present a summary on how and why SMART cables can benefit tsunami warning systems. In tsunami early warning, there is generally a clear distinction between the near field, i.e., the coastline directly adjacent to the triggering earthquake or other tsunamigenic event where potential warning times are typically tens of minutes to maybe an hour, and the far field, where tsunami waves travel.
Prior to the 21st century several unnecessary evacuations occurred on Pacific coastlines especially for far field regions. Not because a tsunami was not generated but because the tsunami was not as destructive as predicted. Tsunami Warning Center (TWC) duty scientists only had knowledge of basic earthquake parameters, hypocenter and magnitude, and, mostly of potential use for far field warnings, readings from coastal sea-level stations. In the 21st Century, tsunami forecasting has been significantly improved by the investment of several Pacific countries into more instrumentation and real-time data sharing, such as the deep-ocean pressure sensors (DART buoys), coupled to richer information available on earthquakes through new methodology faster focal mechanism solutions and estimates of rupture area (Kanamori and Rivera, 2008; Duputel et al., 2011). But trying to assess the destructive potential of tsunamis on coastlines, even using the increased coastal sea-level network and DART buoys, in addition to the seismic information, is still fraught with uncertainty. The strength of the tsunami will strongly depend on the amount of vertical deformation of the seafloor and, importantly, at what depth beneath the seafloor and under what water depth this perturbation is occurring, with deeper water leading to greater tsunamis. Furthermore, the conversion of earthquake magnitude into a prediction of the seafloor displacement is strongly dependent on the elastic properties in the volume of material surrounding the fault rupture. The gradients in both seafloor topography and elastic properties are high in subduction zones (the source region of the most catastrophic tsunamis), meaning that typical uncertainties in earthquake location and the size of the rupture zone translate into very large uncertainties in the predicted size of the tsunami. This is an obvious problem for near-field warnings, which are currently usually based on seismic information alone; several pilot systems incorporate geodetic data (GNSS displacements), which reduces uncertainties, provides very fast complex moment tensor (CMT) solutions, and allows the estimation of rupture extent. Uncertainties remain significant, particularly for the highly tsunamigenic earthquakes with slip near a subduction zone’s trench.
Coastal sea-level stations provide data on the local impact and are helpful for fast assessment of the most strongly influenced areas. However, tsunamis and the effects they have on coastal areas can be strongly affected by near shore bathymetry and shape of the coastline. The modification of the tsunami by shoaling and/or resonance make it difficult to assess a tsunami’s impact on every shore far from the tsunami source, particularly as their numerical simulation is computationally very expensive because it requires very high-resolution bathymetry data. In contrast, propagation in deep water is well understood and described by the shallow water wave equation. Measurements of the tsunami in deep water (wavelength and amplitude) along the wave propagation are thus extremely useful for validating and augmenting tsunami forecasts and improving the precision with which the tsunami threat can be determined in the far field. It is precisely this kind of information that SMART cables can provide and at potentially much higher resolution than the existing sparse DART stations.
SMART cables parallel to offshore seismic zones can also be beneficial for issuing tsunami warnings in the near field. SMART cables will have pressure sensors as well as seismic instrumentation, accelerometers that will provide useful information regarding earthquakes. The additional seismic information will aid in detecting earthquakes (alerting TWC duty scientists) and determining the hypocenter, earthquake magnitude, finite fault slip pattern, and its CMT with less lag and lower uncertainties in comparison to relying on land-based measurements alone.
Tsunami forecasts can be based on the CMT (Wang and Becker, 2012), which provides the geometry of the fault, direction of faulting, and an authoritative estimate of the earthquake magnitude. This information allows the surface displacement to be calculated which in turn is used to force a tsunami propagation model, generating a tsunami wave-height forecast.
Unfortunately, the CMT has limitations when it comes to generating tsunami forecasts. For example, real-time CMT analysis is insufficient for resolving complex events such as the recent August 12, 2021 South Sandwich Islands earthquake sequence. In addition, the tsunami excitation can be further exacerbated by displacement along splay faults and earthquake-triggered submarine landslides (e.g., Carter et al., 2014), which are very difficult to detect by seismology alone. A recent example is the strike-slip Alaska earthquake of October 19, 2020 (Herman and Furlong, 2021). The tsunami recorded on nearby DART buoys was much greater than expected given the Pacific Tsunami Warning Center’s (PTWC’s) forecast based on the CMT. Another example of a tsunami generated or augmented by a submarine landslide is the tsunamis generated by 1998 Papua New Guinea M7.0 earthquake (Heidarzadeh and Satake, 2015). Subaerial landslides also pose a tsunami risk. For example, the Lituya Bay, Alaska, megatsunami (1958) was the result of a subaerial landslide triggered by an M7.8 strike-slip earthquake (Fritz and Hagar, 2001). Of particular concern in the United States is the potential for a great tsunamigenic subaerial landslide in Barry Arm Alaska (Dai et al., 2020). Although the standard repeater spacing in SMART cables would, in most cases, not be sufficient to have much of an impact on near field warnings from landslide events based on pressure recordings, governments could decide to decrease the spacing or optimize cable routes near coastal areas assessed to be at risk for such an event. For the seismic detection of submarine slides by accelerometers and pressure sensors even a standard SMART cable might be sufficient; however, too little is known about the seismic signature of submarine slides to be able to judge the feasibility of this approach.
Today there are only some 70 or so ocean bottom pressure sensors (e.g., on DARTs buoys, and installed on DONET, S-net, ONC and OOI cabled observatories) in the deep ocean, whose data are (openly) available in real-time to tsunami warning centers. The vast majority of these are in the Pacific Basin. SMART cables can increase that number by orders of magnitude, well into the thousands (Figure 4). Such an abundance of near-real-time information can be used to validate and/or revise forecasts making tsunami warnings for areas >1,000 km from an earthquake more precise and conversely greatly reducing the potential of unnecessary warnings and evacuations.
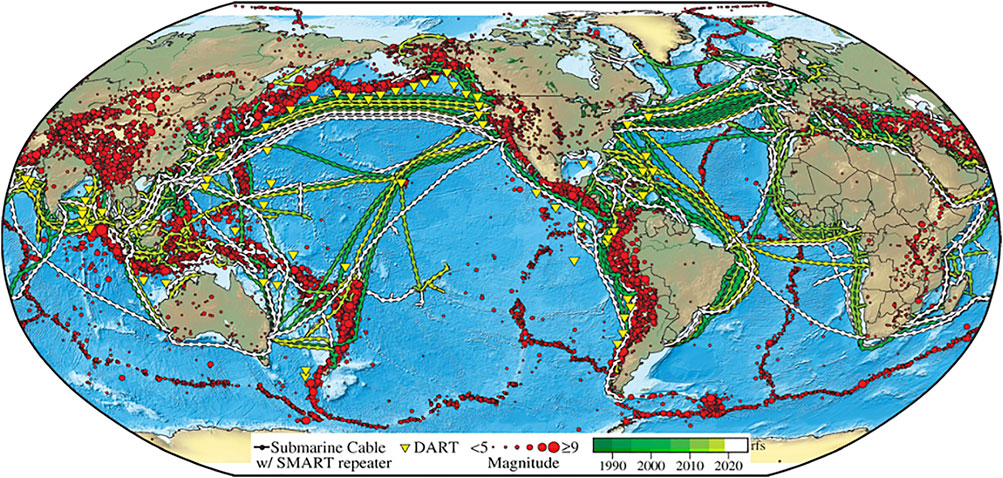
FIGURE 4. Global map of ∼1 million km of operational submarine telecommunications cables (green present, white in progress/planned; SMART repeaters shown every 300 km; rfs—year ready for service), historical earthquakes (red), and DART tsunami buoys (yellow triangles). Cable data: TeleGeography’s Telecom Resources licensed under Creative Commons ShareAlike; DART Buoy locations: NOAA National Data Buoy Center; Seismic data: USGS Earthquake Catalog. Permission obtained for use of figure.
The previous paper (Howe et al., 2019) presented preliminary calculations performed at the PTWC as to how SMART cables can improve the tsunami warning system. In that study the calculations were based on five hypothetical cables spanning the Pacific basin containing ocean bottom pressure (OBP) sensor/seismometer packages. In this paper, PTWC added another hypothetical SMART cable that follows the coastline extending from central Mexico south along the west coast of South America. This cable roughly follows the outer rise of the subduction zone along this section of coastline. These routes are not specifically based on any existing telecommunication cable route. However, coast parallel telecommunication routes do currently exist. For instance, the recently installed Curie cable from Los Angeles, United States to Valparaiso, Chile, is roughly 300 km offshore.
Figure 5 shows the routes of hypothetical SMART cables that contain OBP sensor/seismometer packages and the Pacific basin subduction zones with potential epicenters of great earthquakes. The SMART cable repeaters containing these instrument packages are spaced 100 km apart and the calculations assume 905 synthetic earthquake sources located every 50 km along the Pacific Basin subduction zones.
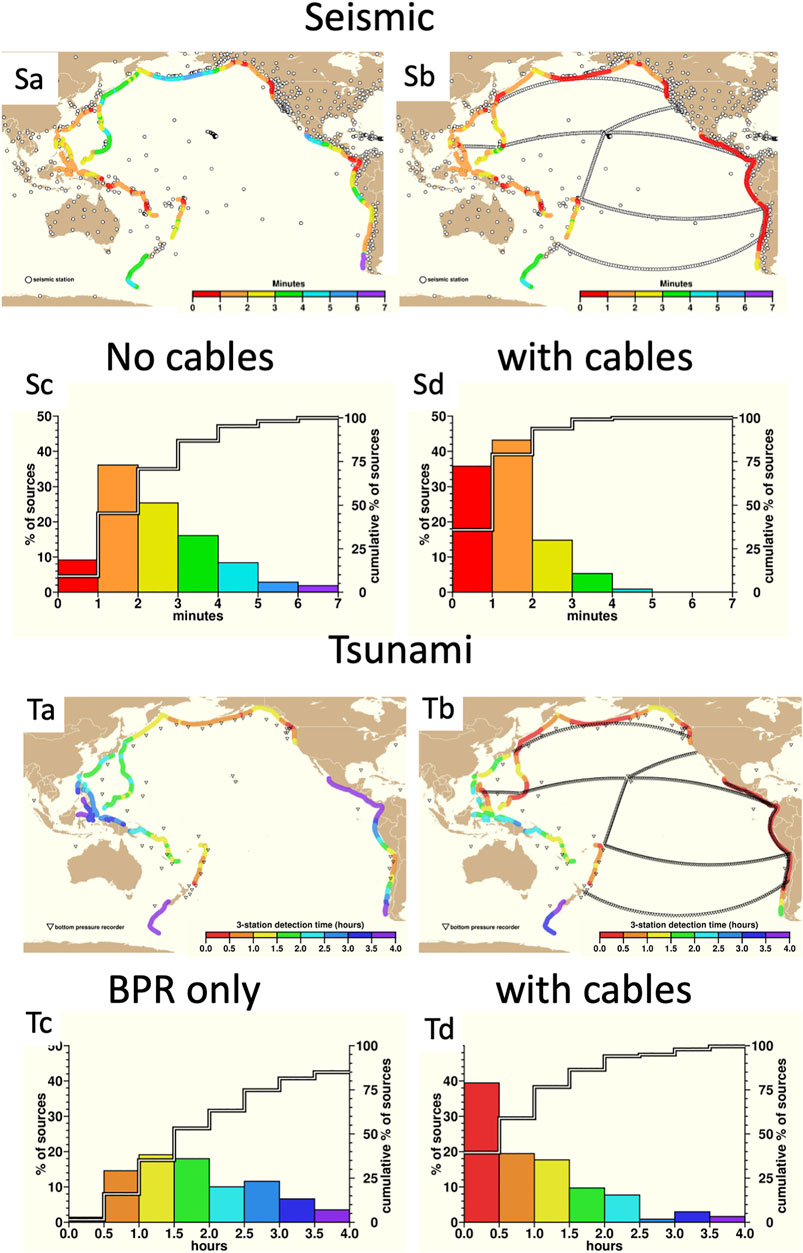
FIGURE 5. Maps Sa and Sb (top) show existing seismic stations alone (Sa, gray circles) and then with six simulated SMART cables (Sb, repeaters gray circles), respectively. Colored dots represent simulated megathrust subduction earthquake epicenters, and the color bars the time to detection (0–7 min). Maps Ta and Tb show existing DART bottom pressure recorder (BPR) stations (triangles) and then with six simulated SMART cables (repeaters gray circles), respectively. The color bars denote the time to detection (0–4 h). Again, dots in both cases represent simulated potential megathrust subduction earthquake epicenters and the color bars the time to detection (red represents shorter time). The lower histograms are used to obtain statistics as discussed in the text.
The estimation of the potential impact of SMART cables on the speed with which an earthquake hypocenter might be determined is based on two criteria. Five stations must detect the compressional primary P-wave and the largest azimuth gap between any two (azimuthally) neighboring stations with respect to the hypocenter must be less than 180°. The calculation assumes an earthquake at each epicenter and then computes the minimum time required to meet the five station and azimuth gap requirement. The calculations are performed based on the seismic station distribution available to PTWC (as of early 2021) without and with the SMART cables in Figure 5 Sa and Sb, respectively. The resulting distribution of time-to-detection is shown in Figure 5 Sc and Sd. The inclusion of these six notional SMART cables would have the potential to speed up Pacific-wide earthquake epicenter determinations by an average of ∼42%.
Similarly, we calculated the reduction in latency in tsunami detection that is achievable with cabled OBP sensors, following a tsunamigenic earthquake. Using the 905 epicenters in Figure 5, tsunami travel times are computed from each epicenter to the set of operational (56 as of September 2021) OBP sensors received by PTWC with and without the OBP sensors associated with the SMART cables. With SMART cables in place, the time required to observe the tsunami arrival at three or more OBP sensors is reduced by ∼57%.
Specifically, the four histogram charts in Figure 5 compare detection time for earthquakes (left) and tsunamis (right), first using only those sensors available in 2021 (Sc and Tc), and then using existing sensors augmented with simulated data from future SMART cable sensors (Sd and Td). Detection of an earthquake—meaning reception on ≥ 5 seismic instruments—is reduced from 2.44 to 1.42 min, or from an average of 2 min 26 s down to 1 min 25 s, which is a 42% reduction. Sixty seconds is an eternity in earthquake detection and warning for a duty scientist at a tsunami warning center.
Tsunami detection at ≥ 3 pressure sensors showed a similar percentage improvement, dropping from 2.4 to 1.0 h, for a 57% improvement. Although wide area tsunami warnings are already helping to save lives, unnecessary or overly broad warnings and evacuation orders have significant financial and safety costs. The reduction in detection time coupled with a better description of the wave field will help better characterize the source, improve forecasts in both the near and far field, and potentially reduce false alarms. Thus, SMART cable augmented tsunami detection will help reduce the direct and indirect costs associated with tsunami warning and evacuation programs, as well as likely improve confidence in the warning system and compliance in the event of a necessary evacuation.
The statistics presented here could be further improved if SMART-enabled repeaters were deployed more densely and/or nearer the coast or seismically active regions.
2.3 Oceanography
Oceans are currently predominantly monitored by surface in-situ (ships, buoys, moorings, or floats) and remote sensing (satellite) techniques. Each of these techniques covers specific time and space scales (daily, global but only surface measurement from satellites, real-time but only discrete location for moorings, global but limited to 2000 m depth for floats, etc.). The deep ocean and the important processes occurring there remain extremely undersampled and unobserved. Data from SMART cables would fill critical gaps in our existing monitoring systems, complement existing observations, increase our current level of understanding of the ocean, and improve our capability to predict its future evolution (Howe et al., 2019).
2.3.1 Ocean Temperature
The Antarctic Bottom Water, which fills much of the deep oceans (Johnson, 2008), is warming, absorbing substantial amounts of heat, and contributing to sea level rise (Figure 6; Purkey and Johnson, 2010). Oceanographers currently rely primarily on Global Ocean Ship (GO-SHIP) repeated transoceanic hydrographic sections (Talley et al., 2016) to monitor the deep ocean water properties, along with a few time series stations (Lukas et al., 2001) and deep instruments on moorings (McKee et al., 2011; Send and Lankhorst, 2011). Deep Argo floats operational to a depth of 6,000 m are being developed, with a few regional pilot arrays already deployed or planned (Jayne et al., 2017; Johnson et al., 2019), and a global network envisioned (Johnson et al., 2015). Changes in the deep ocean, however, remain undersampled (Johnson et al., 2015). SMART cables, with transoceanic sampling of temperature in the bottom boundary layer at roughly 50 km resolution, would complement other data sets and facilitate investigation into water temperature variability, trends, and circulation.
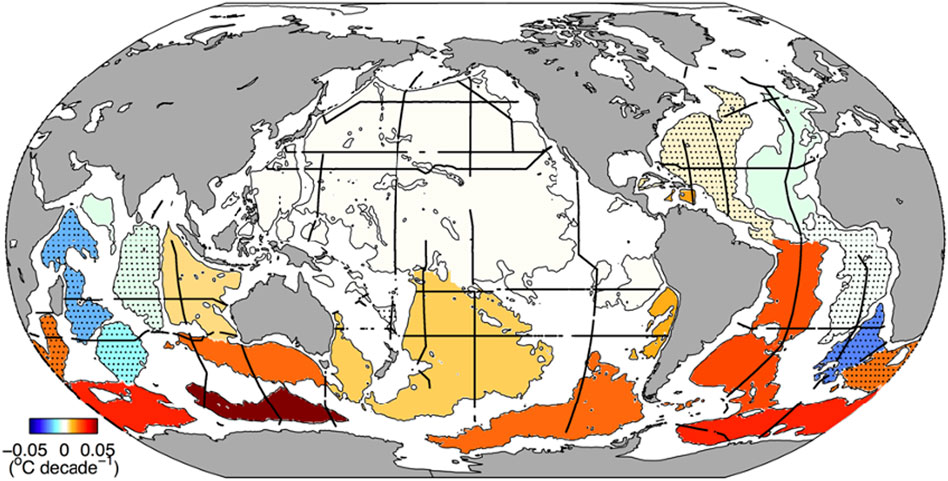
FIGURE 6. Deep basin (thin solid lines) average warming rates below 4,000 m from the 1990s to the 2000s (°C decade−1, colorbar) based on data from Purkey and Johnson (2010). Estimates are based on data from decadal repeats of hydrographic sections (thick solid lines) first occupied during the World Ocean Circulation Experiment (WOCE) (King et al., 2001) and subsequently by GO-SHIP (Talley et al., 2016). Stippled basins have average warming rates that are not statistically significantly different from zero at 95% confidence. Permission obtained for use of figure.
2.3.2 Ocean Circulation
The Atlantic meridional overturning circulation (AMOC), which redistributes heat in the Atlantic Ocean, is changing (Smeed et al., 2018). The changes are associated with variations in ocean temperature, air–sea heat flux, and sea level. Since 2004, the RAPID/MOCHA array has been providing estimates of the AMOC by estimating the pressure gradient between the western and eastern continental slopes at 26°N (McCarthy et al., 2015). From the AMOC strength, the climate-relevant meridional heat transport and its variation can also be inferred (Johns et al., 2011). SMART cables would complement and extend the existing AMOC estimates in two ways. First, OBP measurements on cables spanning an entire ocean basin could measure the pressure differences at many depths (for instance, over the Mid-Atlantic Ridge) between the western and eastern boundaries of the basin (Hughes et al., 2018). The pressure differences are directly related to the transports at those depths. Second, multiple cross-basin transects by SMART cables at different latitudes would allow a division of major ocean basins into boxes. This could also provide longitudinal resolution, for instance with the CAM-2 system between Portugal and the Azores (Section 4.3). Geostrophic transports across box boundaries could then be estimated from OBP observations as just described, allowing the mass balance of individual boxes to be calculated. These box models would finally allow a quantification of the long-term mass evolution in an ocean basin, based on unaliased measurements.
2.3.3 Sea Level Rise and Mass Distribution
Global warming has caused global mean sea level to rise at a rate of 3.0 ± 0.4 mm/year since 1992 (Figure 7), with an estimated current acceleration of 0.084 ± 0.025 mm/year2 (Nerem et al., 2018). Depending on the emissions scenarios, the mean sea level will rise between 41 cm (for the lowest emissions scenario) and 82 cm (for the highest emissions scenario) by 2100 (IPCC AR6).
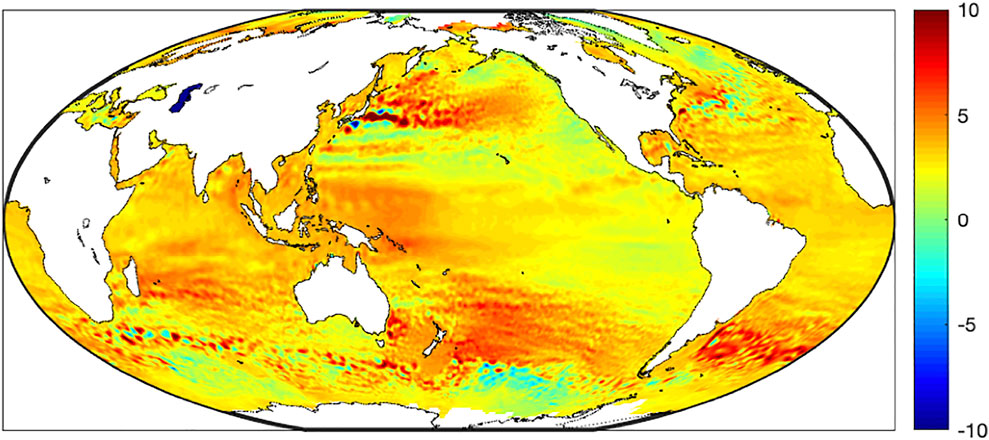
FIGURE 7. Mean sea level trend (mm/y; January 1993–October 2019) from multi-mission satellite altimetry (data source: AVISO).
Individual contributions to sea level change, such as barystatic (mass changes, e.g., due to melting land ice) and steric (expansion of water, e.g., due to warming) effects in the ocean, as well as Earth-produced eustatic (changes in ocean volume due to geometric changes in the seafloor boundary) and isostatic (changes in height of land) effects vary considerably across the ocean basins. Sea level rise is not homogeneous and sea level variability patterns can be determined directly by various measurement techniques and sensors (e.g., radar altimetry or gravity measurements from satellites and land-based tide gauges). The identification of individual contributing effects, however, requires complementary observation methods. OBP observations provide the amount of local barystatic sea level change, which is the change due to added water mass from melting land ice. SMART cables would provide a network of long-lasting, temporally unaliased OBP sensors that could be quite dense in some basins and unaliased along the cables. The difference between total sea surface height (SSH) from satellite altimetry and OBP from the pressure sensors gives the steric component of SSH, e.g., due to density changes/thermal expansion of sea water. The OBP measurements reflecting added mass would enable separation of the steric and barystatic contributions to sea level change at a particular location, whose differentiation is required to understand the causes of sea level rise and thus for reliable sea level projections.
As there is drift in the currently used pressure sensors, the latter can effectively be calibrated by using GRACE satellite gravity data providing coarse estimates (300 km scales) of OBP (Worthington et al., 2019) or by measuring the steric component by occasional Argo float profiles, shipboard conductivity, temperature, depth (CTD) profiles, or inverted echosounders (Baker-Yeboah and Watts, 2009; Hughes et al., 2013). This should be adequate for determining signals with periods less than half the record length. See Section 3.3 for more discussion of the pressure sensors.
2.3.4 Ocean Surface (Barotropic) Tides
SMART cable measurements of OBP would allow unique, basin-scale quantification of barotropic tidal variability over a wide range of timescales, necessary as a forcing term in ocean modeling, but also provide ground truth for secular and seasonal changes to tidal correction models used in altimetry and gravimetry.
Simulation of the gravitationally forced surface (barotropic) tides has now become quite accurate even without assimilation of satellite altimetry data. Forward tide models now routinely capture 90% or more of tidal sea surface height variance (Arbic et al., 2004; Egbert et al., 2004).
However, there are still tidal phenomena that are poorly described or understood such as the lesser tidal constituents, seasonal variability of all constituents, non-linear constituents, rapid variation of constituent structure in shallow water, and shifting sinks of energy as the global environment changes. Although these factors exhibit small amplitudes, their global distributions are sought due to their impacts on phenomena such as internal tide generation, deep ocean mixing, paleotide descriptions, and Earth structure. They also have utility in defining the tidal “correction” that must be applied to satellite altimetry and gravity data to extract the sub-diurnal variability of ocean circulation features as well as sea level rise over long periods. Ocean bottom pressure observations provide one of the better tools for exploring the finer details and changes of the barotropic tides, because the non-tidal “geophysical noise” (internal waves, mixed-layer currents, and coastal-trapped edge wave, etc.) in which the tides are embedded is much weaker at the seafloor far from the coast than at the sea surface or near the coast (Ray, 2013).
2.3.5 Microseisms and Infragravity Waves
Observations of the ambient noise in the ocean can improve our understanding of both the structure of the oceanic lithosphere and waves at the ocean surface. Wind waves breaking and interacting in the shallow waters of the continental shelves, as well as in the open ocean, generate seismic noise in the period band of the wind-driven surficial waves and at shorter periods (2–20 s). This noise, termed microseisms, constitutes the principal seismic noise source on Earth. The ambient noise spectrum in the deep ocean, and on land, is dominated by the so-called secondary microseisms with a peak period of ∼6 s (Longuet-Higgins, 1950). They are generated from the interaction of opposing trains of ocean waves that impose a (non-linear) pressure signal at the seafloor with half the period of the interacting waves. This pressure signal, as measured with SMART pressure sensors, couples to the solid Earth and excites seismic Rayleigh waves measured on the accelerometers. With few exceptions, the occurrence of opposing wavetrains is limited to near shore regions due to wave reflection at the coast or shallows. Nevertheless, the excited Rayleigh waves have a long range and can be observed even at the farthest reaches from the oceans in central Asia (Bromirski et al., 2005; Ardhuin et al., 2011; Chen et al., 2015; Butler and Aucan, 2018) as well as in the centers of large ocean basins (Dahm et al., 2006).
Infragravity (IG) waves are surface waves with periods ranging from minutes to hours. Nonlinear interactions between wind waves in the open ocean and at the coasts generate IG waves at periods from 0.5 min to many tens of minutes. IG waves appear as either “free” or “bound” waves (Herbers and Guza, 1994; Herbers et al., 1995), where the bound waves are tied to underlying groups of wind waves and become free at the shoreline where the short wind waves break (Bertin et al., 2018). A small fraction of the resultant free IG energy leaks into the open ocean where it can spread for thousands of kilometers, with horizontal wavelengths of up to 10 s of kilometers and heights of up to 10 s of centimeters with significant seasonal variability (Aucan and Ardhuin, 2013). IG waves at longer periods up to hours have also been identified and appear to be forced by the surface barotropic tides and solar modes of oscillation (Chave et al., 2019). Given the size and wavelength of these IG waves, they are a source of aliasing noise in satellite measurements of sea surface elevation. Thus, a better understanding and modeling of the temporal and spatial variations of the IG waves as measured with the SMART pressure sensors could improve the processing of satellite altimetry data (Ardhuin et al., 2014).
3 Technical Approach
3.1 SMART Cable Concept Requirements
The defining characteristic of SMART cables is the integration of environmental sensors into commercial subsea telecommunications cables. The crucial objectives are: 1) to measure ocean bottom temperature and pressure, both of which are essential ocean variables, together with acceleration in three axes; 2) to have little or no impact on the operation of the telecommunications system that hosts the sensors; 3) to require no special handling or deployment methods; and 4) to be sufficiently reliable that 95% of all sensors operate for a minimum of 10 years. SMART cables will provide data that is unavailable or sparsely represented in current data sets. As a tsunami warning system, SMART cables can provide broader coverage and greater reliability than the existing network of moored/buoy-based detection systems. Long term measurement at fixed locations will allow new insights into environmental processes. A world-spanning network of fiber optic cables is operated, maintained, and periodically renewed by the telecommunications industry. The technical aspects are reviewed by Chesnoy (2016). Present estimates (2021) indicate that over 1.3 million km of cable and more than 426 independent subsea cable systems are in service (Telegeography, 2021). On many of the more active (lucrative) transocean routes, new cables are installed to replace or supplement existing systems at intervals ranging from three to 10 years; each new deployment provides an opportunity to include sensor capabilities. On less active routes, cables can be left in service for their engineering design life of 25 years.
3.2 From Single-Purpose Cables to SMART Cables
Subsea telecommunications cables incorporate “repeaters”—cylindrical housings containing Erbium Doped Fiber Amplifiers (EDFAs)—at regular intervals along the cable. To create a SMART cable, sensor functions must be incorporated into the repeater. Necessary functional elements include the sensors, digital signal processing, optical transceivers, and associated power supply circuits. Data may be transmitted to shore over fibers added for that purpose or as an out-of-band channel on the main fibers.
Adding these elements requires substantial modifications to the repeater leading to several engineering challenges that must be addressed (Lentz and Howe, 2018). Accelerometers can be mounted inside the repeater housing. Temperature and pressure sensors must be placed outside the repeater housing, in contact with the environment, necessitating a penetration of the housing to connect these sensors to the internal circuitry. The sensors must be isolated from high voltages present within the repeater and fail-safe so that the normal operation of the repeater cannot be impacted by faults in the external sensors. All of this must be done in a manner that is consistent with the 25-year expected operating life and 8,000 m deployment depth of a commercial repeater.
The earliest example of a submarine cable observatory is the Geophysical and Oceanographysical-Trans Ocean Cable (GeO-TOC), which was installed in 1997 midway between Guam and Japan using the retired TPC-1 communications cable (Kasahara et al., 1998). The GeO-TOC system anticipated the development of SMART cables by almost two decades yet included all essential SMART cable features: a three-axis accelerometer; pressure sensor; and precision thermometer. These were incorporated into an in-line repeater housing that was deployed from a cable ship in a conventional manner.
In the first decade of the 2000 s, attention shifted to regional-scale observatories such as NEPTUNE (ONC), OOI RCA, and DONET (Barnes et al., 2007; Best et al., 2007; Hazell et al., 2007; Kawaguchi et al., 2008; Consortium for Ocean Leadership 2010). Each of these employed telecommunication cable and repeaters; bespoke housings (i.e., nodes) were developed for interconnection, power delivery, and communications. Sensors were installed on separate platforms outside the main pressure housings. These projects demonstrated the usefulness of commercial telecommunications technology in the realm of ocean observing but did not incorporate the close integration needed to create a true SMART cable.
Following the Tōhoku earthquake and tsunami of 2011, Japan undertook rapid development of a large-scale network of subsea seismic and pressure sensors (Aoi et al., 2020). The resulting S-net system incorporates many of the functions essential to a SMART cable. The overall deployment comprises 150 observation nodes along 5,700 km of cable divided into six independent subsystems (five running up and down the slope and one offshore of the trench), with average spacing between nodes of ∼50 km. Each observation node consists of an underwater housing containing seismometers and pressure sensors connected in-line with a telecommunications cable. The result closely resembles a telecommunications repeater, however, with housings having a length of 2,260 mm, these require modification of conventional cable laying equipment.
Another in-line ocean bottom seismometer was developed by the University of Tokyo (Shinohara et al., 2014). This design is more compact than the S-Net observatory at 50 cm long and 13 cm in diameter. A total of four units and 25 km of cable were deployed off the west coast of Awashima in 2012 using conventional cable laying equipment. This system uses ethernet switches and optical transceivers are employed, an approach which could also be applied to SMART cables. In 2015, this was commercialized using an industry standard repeater housing and deployed off Sanriku with three nodes and a length of 105 km. The deepest node had an underwater mateable connector providing power over ethernet (PoE) to a pressure sensor (Shinohara et al., 2021).
The S-Net and Sanriku system designs demonstrate the technical feasibility of developing a SMART cable system but stop short of integrating sensor functions into a system built primarily for telecommunications. Further effort is needed to develop a SMART cable system that satisfies the needs of both science and commercial telecoms operators.
3.3 Sensors
The SMART cable sensor suite comprises sensors for temperature, pressure, and acceleration, chosen based on scientific merit and for engineering simplicity. Sensor performance parameters are based on well proven sensors, long used in oceanography, cabled observatories, and early warning systems. Temperature is a local measurement while pressure and acceleration provide remote sensing of the entire water column, remote events, and the intervening media. Detailed requirements for the SMART sensors are given in the several white papers (Lentz and Phibbs 2012; JTF Engineering Team, 2021).
Temperature sensors can meet the required initial accuracy of 1 mK and stability of 2 mK/year. They need to be mounted some distance from the repeater, a “heat island” dissipating ∼50 W. This can be done in a sheath several meters from the repeater and, possibly, with several sensors azimuthally distributed around the cable to assure one is exposed to open water. Data from buried temperature sensors will have to be evaluated on a case-by case basis to determine usefulness.
Pressure sensors also need to reside external to the repeater housing with access to local ambient pressure. Typically, there is a dedicated temperature sensor immediately next to the pressure sensing element to account for temperature dependence of the pressure measurements. The main requirement is a depth rating to 7,000 m with an overpressure tolerance to 8,000 m, the standard telecom rating. Nano-resolution Absolute Pressure Gauges (APG) manufactured by Paroscientific Inc. provide the resolution needed for tsunami detection, oceanographic observations, and other applications. Such APGs have initial sensor drift equivalent to several tens of centimeters per year. Further, as Wallace et al. (2016) point out, “The drift is composed of an initial exponential drift in the month or two following the deployment” that could include an initial settling signal.
Calibration methods to account for this are described in Section 2.3.3. The longest period signal that could be observed would be half the record length, so with the cabled sensors this could be a decade or so. Methods to overcome this with in-situ calibration are in development (Sasagawa and Zumberge, 2013; Wilcock et al., 2021). Shinohara et al. (2021) conclude that “Through the evaluation of records of tides and a tsunami, it is estimated that the buried pressure gauge records data with the same quality and amplitude as the pressure gauge on the seafloor.”
Three-axis accelerometers, also called strong motion sensors, can reside inside the repeater housings; indeed, simple accelerometers are already included in one supplier’s repeaters for engineering purposes (Xtera, 2016). Shinohara et al. (2021) state: “Rotation of the cylindrical pressure vessel around a longitudinal axis may occur due to its shape. Using long-term data from the accelerometers, rotation around the longitudinal axis was estimated. No large rotation of the cylindrical vessel was observed during the observation period.” And further, “The [node] buried below the seafloor has a lower noise environment than the [node] on the seafloor,” as is commonly found with seafloor seismic instrumentation (Duennebier and Sutton, 2007).
We note that the wet demonstration off Sicily will add to information on the effective transfer functions of all three sensors; see Section 4.1.
As discussed in Section 2, there are many potential applications of seismic observations on SMART cables, each of which may guide accelerometer specifications. Generally, the three most important applications are: 1) the early detection and characterization of great subduction zone earthquakes for earthquake and tsunami early warning; 2) filling ocean gaps in the global seismic networks to improve earthquake catalogs and seismic images of the Earth’s deep interior; and 3) providing additional monitoring capability for local earthquakes in the offshore regions of active margins. The sensor specification for these goals can be broadly understood by comparing spectra of seafloor seismic noise levels with the typical amplitudes expected for earthquakes at teleseismic, regional and local distances (Figure 8).
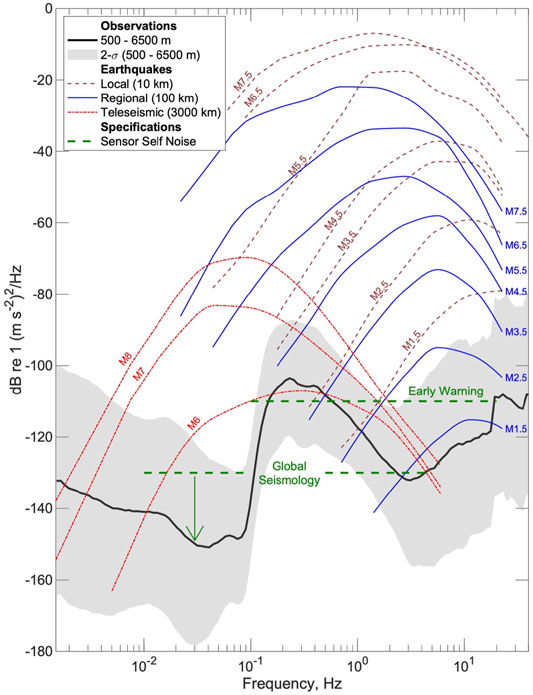
FIGURE 8. Vertical acceleration spectra showing seafloor noise levels, typical earthquakes of various magnitudes at local (10 km), regional (100 km) and teleseismic (3,000 km) distances, and illustrative accelerometer self-noise specifications for earthquake and tsunami early warning and global seismology. The arrow illustrates the potential benefit for global seismology applications of sensors with very low self-noise at lower frequencies. Seafloor noise levels are from a compilation of over a decade of US ocean bottom seismometer experiments (Janiszewski et al., 2020) and show average noise levels and two standard deviation variations at depths greater than 500 m. The acceleration spectra of typical earthquakes are from Clinton and Heaton (2002) and have been converted from octave wide bandpass acceleration to power spectral density following Cauzzi and Clinton (2013).
For earthquake and tsunami early warning on and near subduction zones, it is essential that the seismic sensors deployed do not go off scale for the largest earthquakes. This mandates the use of strong motion accelerometers with a full-scale range of several g. For example, peak accelerations recorded for the 2011 Tōhoku-Oki earthquake reached nearly ±3 g (Goto and Morikawa, 2012). Because the orientation of the repeater housing may vary, the accelerometer should measure accelerations in three-orthogonal directions in all physical orientations. The ShakeAlert earthquake early warning system on the US west coast utilizes vertical accelerometer data that is high pass filtered with a 0.075 Hz cutoff (Kohler et al., 2020); at longer periods the acceleration records cannot be reliably integrated to yield ground displacements. No high frequency cutoff is applied in the ShakeAlert system although most of the spectral power will be at frequencies of <10–20 Hz. The self-noise requirements of a sensor for earthquake early warning are not very onerous because the goal is to warn for large earthquakes with a system that has been verified by successfully detecting moderate earthquakes. The ShakeAlert system is designed for earthquakes down to magnitude 3.0 (Kohler et al., 2020), which, considering the high noise levels in the secondary microseism band from 0.15 to 0.5 Hz, can be accomplished by an accelerometer with a noise floor of −110 dB re 1 (m s−2)2 Hz−1 from 0.1 to 20 Hz (Figure 8).
For studies of teleseismic earthquakes with seismic sensors deployed in deep waters, only the very largest earthquakes (magnitude ≥ ∼6.5 at 3,000 km in Figure 8) will have amplitudes that exceed secondary microseism noise levels. For smaller earthquakes, there are two key frequency bands (Webb, 1998). The first is the low noise notch between ∼0.03 and 0.1 Hz that lies below the secondary microseism band but above the frequencies at which long period ocean waves (infragravity waves) are felt on the deep seafloor. In this band, the surface waves and long period body waves from even quite small earthquakes can be detected. Figure 8 shows that a noise floor of −130 dB re 1 (m s−2)2 Hz−1 is sufficient to record a magnitude six earthquake at 3,000 km even at noisy sites, while lowering the sensor noise floor to −150 dB re 1 (m s−2)2 Hz−1 would facilitate studies of earthquakes of magnitude five at sites where the seafloor noise levels are sufficiently low. Extending this frequency band down to ∼0.01 Hz would facilitate the recording of longer period surface waves for large earthquakes. The second frequency band of interest extends from ∼0.5–5 Hz. Here a sensor noise floor of about −130 dB re 1 (m s−2)2 Hz−1 is sufficient to record high frequency teleseismic P waves when their amplitudes exceed seafloor noise levels (Figure 8). We note that leveraging array techniques and azimuth/slowness stacking of adjacent sensor packets can lower the effective detection threshold for regional and teleseismic earthquakes. However, it is also important to recognize that the cable attached to the repeater may impact the coupling of the repeater housing to the seafloor and lead to enhanced susceptibility to water current noise, thus potentially limiting the fidelity of recorded ground motions, particularly at the shorter periods. Here, analysis of the data from initial demonstrator deployments is needed to obtain robust data on coupling and wave-induced noise for sensors in repeater housings.
The combined specifications for these two objectives suggest a sensor noise floor of −110 dB re 1 (m s−2)2 Hz−1 from 0.1 to 20 Hz decreasing to −130 dB re 1 (m s−2)2 Hz−1 at 0.5–53 Hz and at least as low as -130 dB re 1 (m s−2)2 Hz−1 at ∼0.01 and 0.1 Hz, and ideally lower within this band (Figure 8). Note that a high-resolution low-noise broadband pressure gauge provides a complementary means to record earthquakes (Webb, 1998) and so the needs of seismology should also contribute to the pressure sensor specifications.
Existing commercial sensors meeting these requirements will be used for the first SMART systems. Improvements in size, reliability, and ease of use would facilitate wider adoption in cable systems and an evolution towards sensor designs developed specifically for SMART cables could set off a virtuous circle of easier implementation of SMART cables driving demand and further development of sensor designs optimized for the SMART environment.
The addition of other sensor types, including hydrophones, conductivity sensors, inverted echosounders, as well as acoustic or optical modems capable of relaying data from free swimming sensors, has been considered. A new in-situ calibration method called ambient-zero/internal pressure case-ambient (A-0-A; Wilcock et al., 2021) would approach accuracies required for detecting longer-term (secular) vertical deformation signals, seafloor geodesy, and absolute sea level rise. Given that the SMART repeater will provide a general interface, in principle it should be possible to add these and others once the initial concept has been successfully demonstrated. However, it is very important to keep the initial systems as simple as possible to minimize their impact on the telecommunications functions of the system.
There is a new distributed sensing technology based on using optical fibers themselves as sensors. Any strain (stretch) in the fibers can be detected by Brillouin optical correlation domain reflectometry (BOCDR; presently to 50 km; Galindez-Jamioy and López-Higuera, 2012), Rayleigh backscatter interferometry (Lindsey et al., 2017), or a combination of bi-directional transmission optical interferometry and absolute time measurement (Marra et al., 2018). A more recent development correlates changes in the polarization states of the optical signals carrying telecommunications traffic with localized stress on the fiber and has been used to detect seismic events along the west coasts of North and South America (Kamalov and Cantono, 2020; Zhan et al., 2021). These two methods open the possibility of passively using both existing and future trans-ocean fibers as continuously distributed seismic sensors. It is important to note that both these are distributed methods and do not provide the same resolution or precision as the point sensors, which will be used in SMART cables. For the benefit of the telecom mission, they can provide measurements directly related to cable integrity, e.g., cable movement due to external aggression (fishing and bottom trawling, anchors, submarine landslides, etc.). SMART cables with in-situ sensors and distributed “remote” sensing are complementary and both should be implemented in parallel.
3.4 Design and Development
The design and development of SMART cables will require an unprecedented level of cooperation between scientific organizations, cable system suppliers, and cable system operators. Achieving integration with telecommunications systems will require further refinement of the sensors, design and development of the signal processing and data transmission circuits, and mechanical integration into the repeaters. A full set of technical requirements is proposed in (Joint Task Force, 2015a).
Integration of the SMART functions into cable systems requires a substantial investment on the part of the cable system suppliers. Despite similarities in function, each supplier has different mechanical arrangements and manufacturing processes. Development of a reference design for the sensors, signal processing boards, and data communications should be pursued to reduce the burden on each potential supplier and to ensure consistent results from the first generation of systems. Such a reference design would incorporate, at a minimum, circuit diagrams and functional code; one or more working benchtop prototypes would be assembled. Individual suppliers could then utilize this to create a functional design that is compatible with their repeater design.
Reliability is a significant concern for telecommunications cables. A rate of no more than one repair due to intrinsic failures in 25 years for 5,000 km of cable is a typical objective. As a matter of principle, the sensor functions must not impinge on the reliability of the telecommunications system. The sensor functions are unlikely to achieve this same level of reliability and must be designed to “fail safe” so that the telecommunications capabilities continue to function. A 10-year operating life is the initial goal (95 percent of sensors working at the end of 10 years), as this represents the timeframe in which a newer cable can be expected to be installed along the same route. Preliminary simulations indicate this is achievable but will require some level of redundancy, particularly in the optical transceiver functions.
Moving beyond the system suppliers, commercial cable system owners and operators must be persuaded to support SMART cables. Submarine cable systems represent a significant investment and a critical piece of strategic network infrastructure. Any interruption in operations has the potential to cause major disruptions. For this reason, system owners are reluctant to accept new or unproven modifications to existing designs without some substantial benefit in exchange. Smaller projects, particularly those serving island nations that are most at risk from climate change and tsunamis, are expected to be more amenable to SMART cables. Regional systems are also more likely to have unallocated fiber pairs and sufficient overhead margin in the electrical power budget, thus eliminating the objection that adding SMART functions reduces the cable’s overall capacity. Addressing the concerns of the telecommunications industry will require a series of projects that demonstrate that all technical issues have been fully addressed.
4 Projects Underway or Planned
Here we describe five SMART projects at various stages of planning and implementation. The first, the InSEA Wet Demonstration, will show that sensors in a cable repeater mechanical configuration can return good science data. The second, Vanuatu-New Caledonia, is still in the planning stage, although some funding is already allocated. The Natitua South system connecting French Polynesia Tahiti to Tubaui to the south is in the RFP process at the time of this writing. Indonesia is developing in-country capability because SMART cables are seen as the basis of “cable-based tsunami” warning, which, in turn, will be the basis of the entire in situ tsunami warning system. Lastly, the most advanced SMART system is the CAM-2 project, linking Lisbon, the Azores, Madeira Islands together in a ring. This approved project is funded by the Portuguese government and should be ready for service in 2025.
4.1 InSEA Wet Demo
The Western Ionian Sea hosts one of the European Multidisciplinary Seafloor and water column Observatory (EMSO) Regional Facilities, about 25 km off the Eastern Sicily coast at 2,100 m water depth. An underwater electro-optical cable runs on the seafloor from Catania harbor and splits into two branches that host geophysical, environmental, and oceanographic seafloor platforms. It is managed by Istituto Nazionale di Geofisica e Vulcanologia (INGV) and Istituto Nazionale di Fisica Nucleare (INFN).
The observation area is prone to numerous natural hazards due to the high seismicity and nearby Mount Etna. A major earthquake/tsunami in this area in 1693 caused 60,000 casualties in and around Catania (Tonini et al., 2011), and another event in 1908 in nearby Messina killed about 75,000 people (Mildon and Meschis, 2019).
In 2019 the project InSEA, funded by the Italian Ministry of Research, began enhancements to the Western Ionian Sea infrastructure capabilities. One of the main goals of InSEA is to realize the SMART wet demonstrator (Joint Task Force, 2015b; Joint Task Force, 2016). A map of the areas with the cables and detail of the wet demo portion is shown in Figure 9.
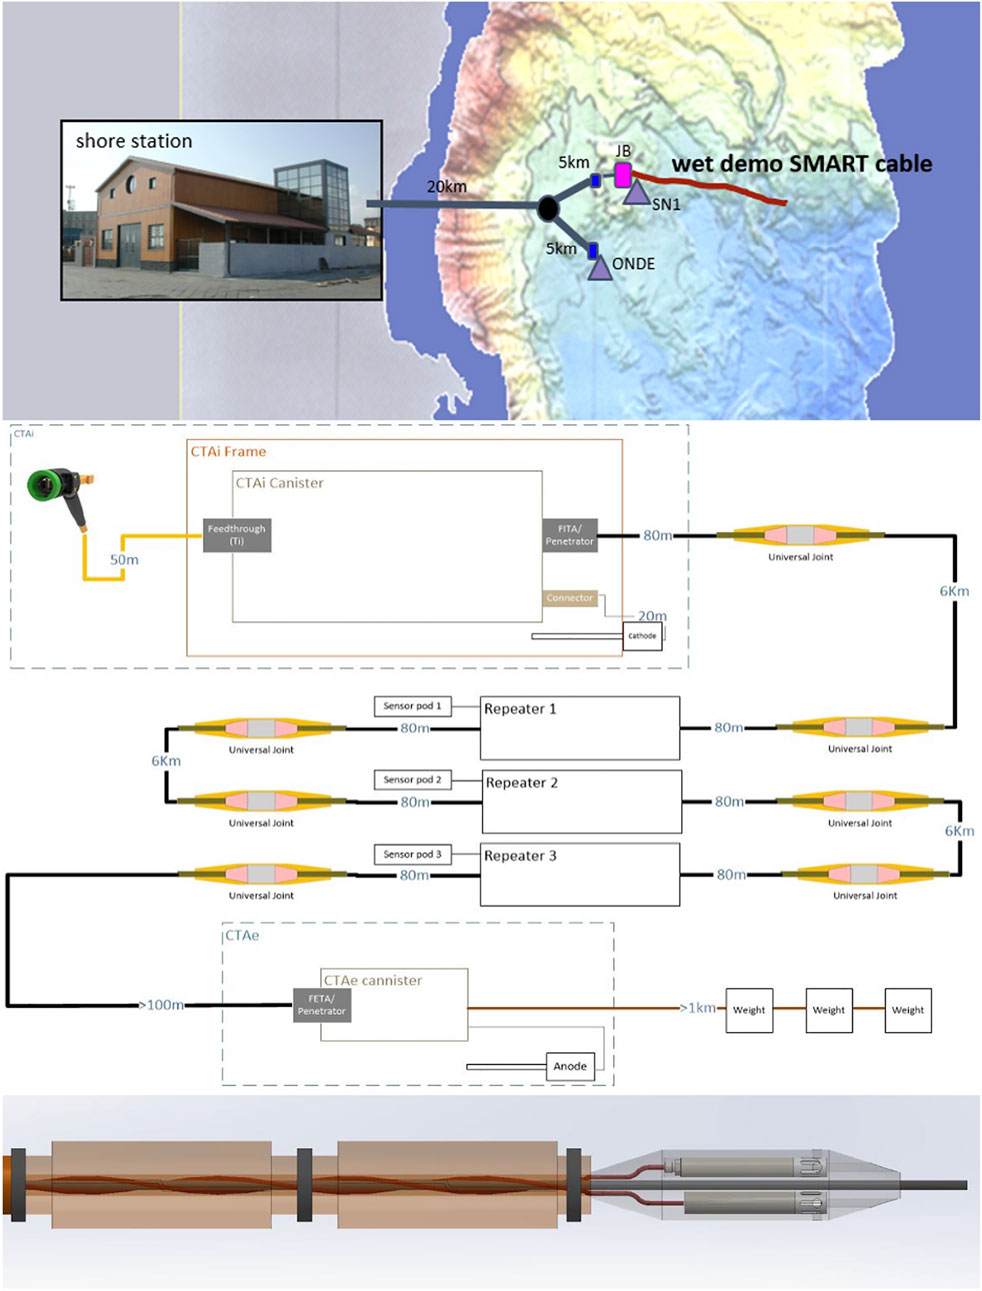
FIGURE 9. (top) The EMSO Western Ionian Sea Facility where the InSEA wet demo SMART cable will be laid in 2022. (middle) The complete system diagram (bottom) Sensor pod containing pressure and temperature sensors.
The wet demo is designed to establish the effectiveness of seismometers and environmental monitoring components installed in and around the repeater housings of a traditional communications cable. The key objectives are to demonstrate that the cable can be deployed using an unmodified cable laying system and ensure that the acquired data are robust, valid, and scientifically useful.
The contract for the wet demonstrator was awarded to Guralp Systems Ltd. (GSL) by INGV in 2020. The wet demo project will consist of a 17 mm LW cable of 19 km length with sensors integrated into the housing of three industry standard repeaters. The housings will be installed 6 km from one another (Figure 9). Each housing will include a temperature sensor (SBE 39plus), absolute pressure gauge (APG, Paroscientific 8,000 series, 3,000 m version), GSL force balance accelerometer (FBA), and GSL broadband seismometer.
The GSL accelerometer has selectable gain between 0.5 and 4 g and a frequency response between DC and 200 Hz, with a noise floor of 10.2 ng Hz−1/2 at 20 Hz. The GSL broadband seismometer has a velocity frequency response flat between 120 s and 100 Hz, with a noise floor of −173 dB at 0.1 Hz.
With a broadband seismometer, a force-feedback accelerometer and a MEMs accelerometer in the same enclosure, the system will provide a range of seismic data acquisition characteristics. After appropriate comparative analysis and evaluation, this data will provide input to the design decisions of future SMART cable installations.
Significant design work is underway to repackage existing Guralp instruments so they can be accommodated within a reclaimed repeater housing, while the temperature sensor and the APG will be housed in sensor pods connected to each repeater by external cables.
The wet demo will be deployed mid-2022 and connected to the Western Ionian Sea Junction Box that will provide power to the SMART cable demonstrator and data transmission to the shore station in Catania harbor (Figure 9). All acquired data will be fully available to JTF for validation of the wet demo and the data will be open to the scientific community following JTF analysis and quality checking.
4.2 Vanuatu—New Caledonia
The archipelagic countries of Vanuatu and New Caledonia are in the South-West Pacific on either side of the New Hebrides/Vanuatu trench. This trench is a very active, geologically young, subduction zone that regularly generates local to regional tsunamis (cf. Roger et al., 2019).
Vanuatu is the world’s most at-risk country for natural disasters (United Nations World Risk Report, 2016). Due to its location near the seismically active Pacific Rim of high rate, active plate subduction, Vanuatu frequently experiences tsunamigenic earthquakes. Although Vanuatu and New Caledonia themselves have not experienced high death tolls from tsunamis or earthquakes, their tsunamis have historically caused devastation in the region and beyond. Vanuatu and New Caledonia recognize that better earthquake and tsunami monitoring is necessary. Sea level rise also continues to threaten the coastal communities of all Pacific Island nations, including Vanuatu. Higher sea levels will increase both the frequency of coastal damage and typhoon and tsunami inundation areas. Better data on ocean circulation and warming are critical for projecting the specific impacts of these threats to the local ecosystem and economy, and to guide mitigation strategies.
Planning is underway for a cable crossing the trench/subduction zone to improve the international connectivity of Vanuatu and New Caledonia; provide valuable early warning tsunami capabilities for both countries and the region; and better understand geophysics of this subduction zone (Figure 10). The tentative installation date is 2025.
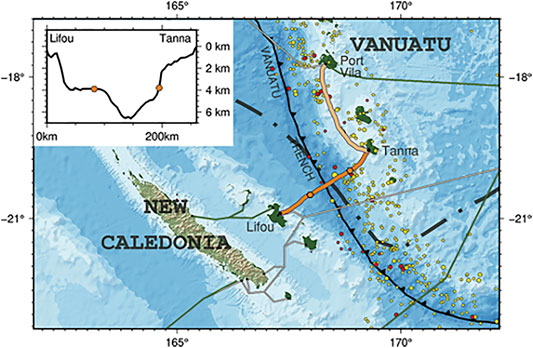
FIGURE 10. Proposed SMART cable connecting Vanuatu and New Caledonia, with a SMART repeater on each side of the Vanuatu/New Hebrides Trench.
4.3 French Polynesia
In French Polynesia at the start of 2021 there were ∼2,700 km of submarine optical fiber telecommunications cable across this oceanic territory, which is as large as Europe and comprised of 118 islands. Natitua is the name of the domestic submarine optical fiber telecommunication network handled by the Postal and Telecommunication Office (OPT) of French Polynesia (PF). Begun in 2017, this network interconnects the Society Islands to the Marquesas Islands and the Tuamotu archipelago. Since 2017 OPT has included SMART cables as an option in their Requests for Proposals (RFPs).
In November 2020 a Natitua extension called “Natitua South Cable” was funded to interconnect Tahiti to Rurutu and Tubuai islands in the Austral archipelago in the southern region of French Polynesia. This project would have an estimated 820 km cable divided in two segments: one of 765 km and another one of 55 km (Figure 11). At the time of this writing, the OPT is evaluating responses to an RFP that included the SMART option.
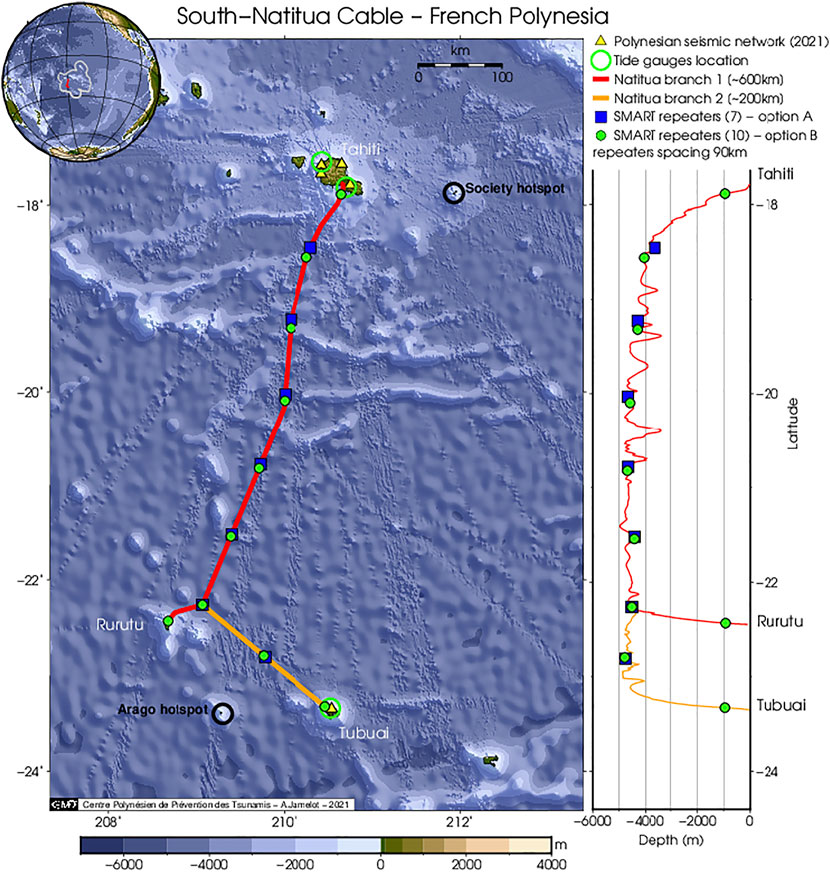
FIGURE 11. The Natitua Cable two branch path configuration with a repeater spacing of 90 km along the cable (blue squares). Solid green markers represent a proposed dense deployment of instrumented repeaters. On the right are the projected depth profiles along each cable path with repeater locations. Most repeaters are at 5,000 m depth so three have been added at 1,000 m depth near each island. The perimeter of the hotspot is marked by a black circle. Open green circles represent tide gauge locations and yellow triangles mark existing onshore seismic stations.
SMART capability in this region will provide many science and societal benefits. The seismic sensor will contribute to a long-term and potentially dynamic tomography investigation on the South Pacific superplume as well as an improved understanding of the regional upper mantle and French Polynesia hotspot properties (Barruol et al., 2009; Obayashi et al., 2016). Two major campaigns of ocean bottom sensors (seismic, pressure and electromagnetic) were conducted between 2003 and 2005 (Suetsugu et al., 2005), and then between 2009 and 2010 (Suetsugu et al., 2012) to illuminate the superplume beneath French-Polynesia. Analysis of the data from the campaigns demonstrated the detection of seismic events that could not be seen by the land seismic network, whose sensitivity is compromised by ocean (microseism) and anthropogenic noise. A SMART cable will consequently improve the regional seismic detection capability handled by the Geophysical Laboratory of Tahiti, French Alternative Energies and Atomic Energy Commission (CEA/LDG). Although French Polynesia is considered essentially aseismic, the 2018–2019 unexpected submarine eruption near Mayotte Island and presence of active volcanism in French Polynesia offer a reminder that appropriate seismic monitoring to establish baselines is prudent.
Currently, tsunamis (>5 cm) can be detected by the French Polynesian coastal tide gage network handled by the University of French Polynesia (Barriot et al., 2012) in addition to the University of Hawaii Sea Level Center (UHSLC) tide gage (Caldwell et al., 2015). The SMART pressure gages will be able to record with sub-millimeter resolution tsunami waves transiting the French Polynesia region. This data will enhance understanding of the tsunami behavior (amplification, reflection, and diffraction) for the three archipelagos (Austral, Society, and Tuamotu). This will drive further research to improve tsunami modeling and thus improve the tsunami forecasts for characterizing alert parameters for more distant impacted regions.
The temperature sensor allows the monitoring of the evolution of the long-term deep ocean temperature over a north-south profile. Such sensors networked along 8° of latitude will enhance our understanding of the potential bottom oceanic circulation and the long-term oceanic climate cycles at 1,000 m and 5,000 m depth (Figure 11) and link it to near surface studies (Rougerie and Rancher, 1994; Martinez et al., 2009; Leichter et al., 2012).
4.4 Indonesia
Indonesia is one of the most active earthquake regions in the world and resides above three converging continental tectonic plates, namely: Indo-Australia to the west and south; Eurasia from the north; and the Philippines plate from the east. Indonesia is therefore highly vulnerable to tectonic earthquakes, volcanic eruptions, and underwater landslides that could trigger both normal tectonic or atypical tsunamis, and is threatened by far- and near-field tsunamis.
The importance of landslide-generated tsunamis is becoming more apparent (Salaree and Okal, 2018). Here we show an example of the estimated cumulative tsunami height due to seismically triggered submarine landslide scenarios (Figure 12). Considering the highly complex triggering mechanism, a cumulative field of peak ground acceleration (PGA) from CMT sources with depth shallower than 40 km was calculated. Fifty-eight dipole source scenarios were designed based on PGA and the underwater slope field. The results not only compel the need for more study of seismically triggered submarine landslides in Indonesia (Salaree et al., 2021) but also highlight the importance of a SMART cable system in detection of this underappreciated threat.
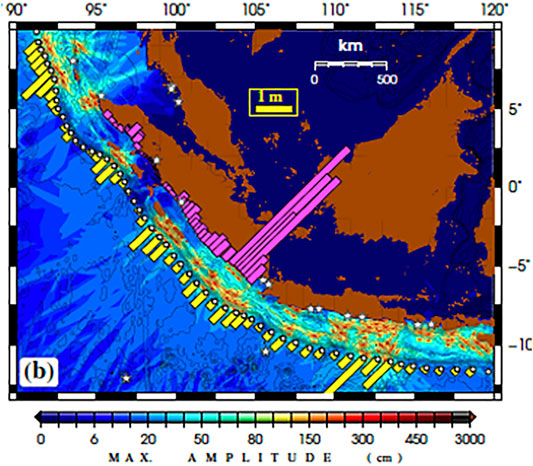
FIGURE 12. For a possible SMART cable (yellow dots) scenario, tsunami wave heights are calculated from 52 landslide scenarios designed for peak ground acceleration >0.3 g based on the bottom slope. Yellow bars show predicted tsunami height at each SMART sensor. Pink bars give tsunami height near the shore (∼60 m water depth). White stars represent existing tide gauges.
The Indonesia Tsunami Early Warning System (InaTEWS) was established following Aceh’s tsunami in 2004. InaTEWS consists of three sub-systems. The upstream part includes observational equipment to monitor seismic vibrations and ocean tsunami wave heights. The acquired data are directly transmitted to the BMKG (Agency for Meteorology Climatology and Geophysics) processing center, which produces information on epicenter location, depth, origin time, magnitude of the earthquake, and its tsunamigenic potential. The resulting early warning information is directly disseminated to potentially affected communities through interface institutions or authorities.
Recently, the BPPT (Agency for the Assessment and Application of Technology) embarked on the development of the SMART-CBT (cable-based tsunami) or Advanced CBT system. The design, which began in early 2020, will accommodate both tsunami sensors as well as data communication. Early single-ended test systems are planned for Labuhan Bajo and Rokatenda, evolving to a double-ended system to be deployed across Makassar Strait connecting East Kalimantan and Mamuju in West Sulawesi (Figure 13). The COVID-19 pandemic, however, is delaying development.
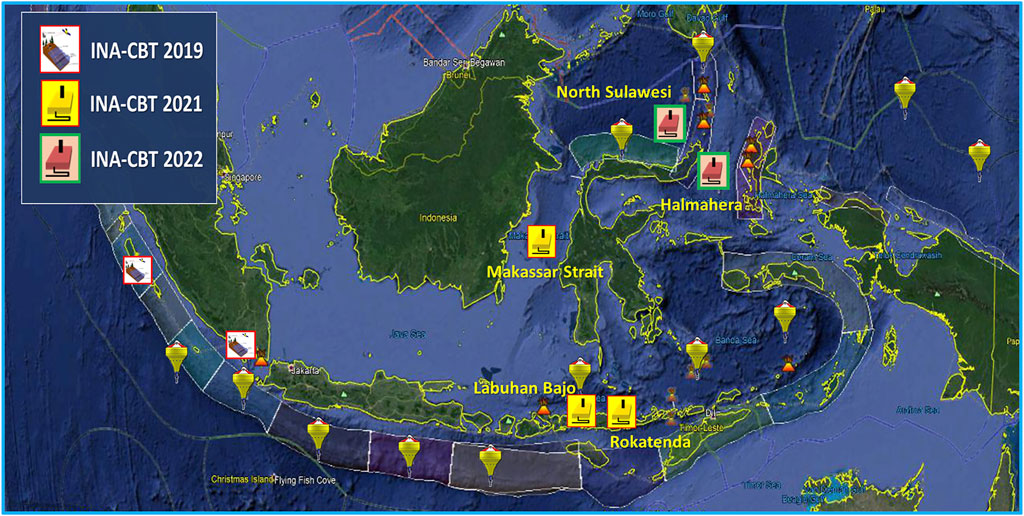
FIGURE 13. Locations of Ina-CBT activities in Indonesia. The rectangle symbols show earlier (white), on-going (yellow), and future (beige) CBT cable systems.
Despite the COVID constraint, BPPT in collaboration with the University of Pittsburgh, United States, Woods Hole Oceanographic Institute, Bandung Institute of Technology (ITB), and Andalas University installed a hybrid cable-based tsunameter in July 2020 in Siberut. The objective is to detect events on the Mentawai-Siberut Megathrust segment. This hybrid system is a combination of optical cable, acoustic wireless links, and several autonomous ocean bottom pressure sensors (tsunameters). An acoustic modem on the end of a short electro-optical shore cable acts as a base transceiver station talking to several tsunameters nearby and in deeper water. The acoustic communications are facilitated by the bottom slope and the thermocline structure. With this configuration, information is quickly sent from instruments 20–30 km away to the mainland.
4.5 Portugal–CAM-2
Continent/Azores/Madeira (CAM) is the submarine telecommunication fiber optic cable system that interconnects the Portuguese mainland with the Azores and Madeira archipelagos in a triangle/ring. The current three cables will be obsolete between 2024 and 2028, the CA cable first and the MA last. The RFP for the new CAM-2 is estimated to be presented in quarter 2, 2022, and follows a clear governmental requirement that the new cables must have seismic and environmental monitoring functionalities (Government of Portugal, 2020).
The CAM cables extend along the plate boundary between Eurasia and Nubia, an offshore domain prone to destructive earthquakes and tsunamis (Figure 14). This area was the source of the largest earthquake in Europe since 1000 (Stucchi et al., 2012), i.e., the November 1, 1755 (Mw 8.5) event, and the largest earthquake in Europe since 1900 causing casualties and destruction, i.e., the February 28, 1969 Mw 7.8 event (Grünthal and Wahlström, 2012). Three other significant earthquakes with M > 7 also occurred on this plate boundary in the 20th century (M7.1, 1939; M8.0, 1941; and Mw 7.9 1975), causing small tsunamis, less than 1 m high (Baptista and Miranda, 2009), as shown in Figure 14.
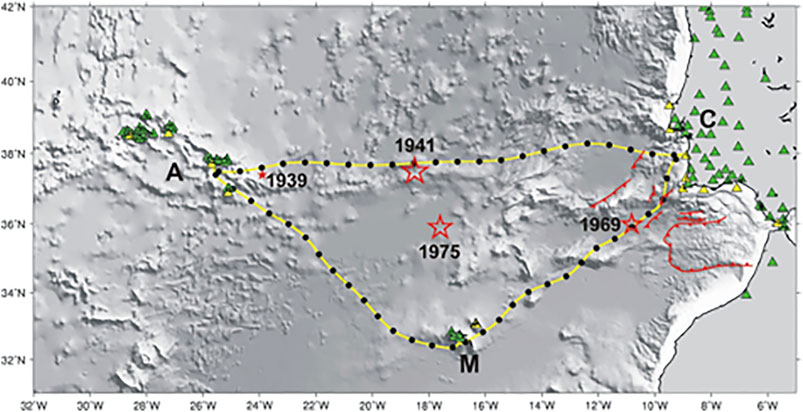
FIGURE 14. Nominal route for the new CAM submarine cable with SMART repeaters (black dots), spaced ∼70 km. The cables are identified by the landing points on both ends, C for the Portuguese mainland, M and A for the Madeira and Azores Archipelagos, respectively. The green triangles denote seismic stations currently monitored by the Instituto Português do Mar e da Atmosfera (IPMA). The yellow triangles show the location of coastal tide-gauges monitored by IPMA. The red stars show the location of 3 M > 7.7 large tsunamigenic earthquakes that occurred in the 20th century. The location of the November 1, 1755 earthquake is uncertain, and the faults shown (red lines) have been proposed as its source.
Mitigation of the hazards generated by offshore tectonic sources requires effective early warning systems for earthquakes and tsunamis. The response of these detection systems must rely on the first seismic and sea level data arriving to the monitoring networks. These are currently seismic land stations and coastal tide gauges (Figure 14). For the likeliest tsunami sources that may affect the Portugal mainland, Omira et al. (2009) showed the need for offshore sea level measurements to ensure at least 10 min advance warning time before the first tsunami arrives at any Portuguese coastal area.
To demonstrate the capability for earthquake and tsunami monitoring of the new SMART CAM cables, we use the tsunami source database in place at Instituto Português do Mar e da Atmosfera (IPMA) as shown on Figure 14. The new CAM layout is notional with sensors every 70 km along the cable track and the first repeater 30 km from the shore (Figure 14).
We computed the estimated tsunami arrival time (ETA) to each of the coastal tide gauges monitored by IPMA and compared these to the ETA computed for the new SMART CAM sensors. The difference reflects improvement in warning time that can be obtained by the instrumented submarine cables, as shown in Figure 15A. The usefulness of each sensor is roughly estimated by the number of tsunami sources reaching it first, as shown by the size of the symbols in Figure 15A.
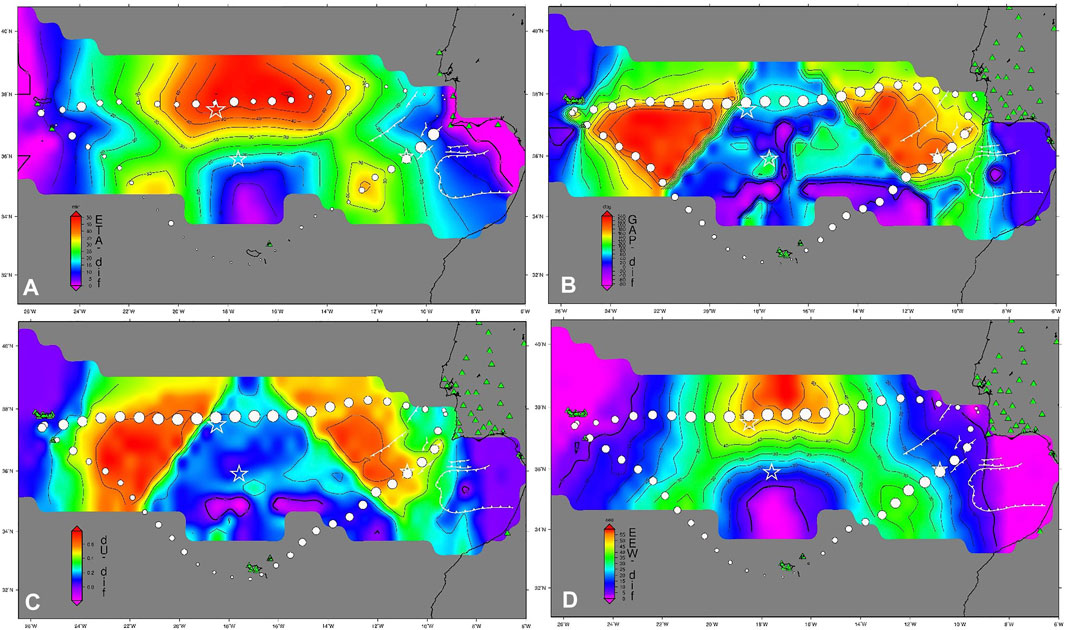
FIGURE 15. (A) Reduction in tsunami arrival time (minutes) obtained by the CAM-2 set of sensors (white circles) when compared to the coastal tide gauge network monitored by IPMA (green triangles). (B) Comparative reduction in azimuthal gap (degrees). (C) Improvement in the network quality metric. (D) Reduction in earthquake early warning time (EEW in seconds) obtained by the CAM-2 set of sensors when compared to the seismic land network monitored by IPMA. The size of the cable sensor symbols is proportional to the number of events used. Purple area defines where the CAM-2 sensors did not improve the result. White stars show the location of 3 M > 7.7 20th century earthquakes that caused small tsunamis. The location of the November 1, 1755 earthquake is uncertain, and we show the tectonic faults (white lines) that are suggested to be at the source of that event by several authors.
At IPMA, following standard operating procedures, a hypocentral location must be provided within 5 min of an event based on the first ten waveforms received. This information and the corresponding tsunami threat level are provided to civil protection and national authorities. The quality of this first computation is critically dependent on the geometry of the ten stations used. We evaluated the contribution of the new SMART CAM network to the improvement of two geometric properties: 1) the maximum azimuthal gap between epicenter and stations; and 2) the network quality metric defined by Bondár and McLaughlin (2009) that also assesses the distribution of the epicenter to station azimuths (0 is the best and 1 means that all stations have the same azimuth). The gain obtained for azimuthal gap and the network quality metric by the new SMART CAM network are shown in Figures 15B,C, respectively. The relevance of each sensor is roughly estimated by the number of earthquake sources each sensor is contributing.
IPMA is testing an Earthquake Early Warning System (EEW) based on the amplitude of seismic waves recorded on the first five stations. With land stations only, the southern Portugal mainland cannot benefit from such a system, as the warning time to the Lisbon area is very short (∼30 s or less). This performance can be greatly improved using the SMART new CAM network of sensors, as shown on Figure 15D. Again, the relevance of each sensor is roughly estimated by the number of earthquake sources to which location each sensor is contributing.
All the examples presented show that the new SMART CAM network can contribute to earthquake and tsunami hazard mitigation for the Portugal mainland, as well as the Azores and Madeira. Using the source areas of historic large earthquakes and tsunamis, modeling using proposed SMART sensor locations indicates a significant improvement in tsunami early warning, earthquake fast location, and strong motion early warning.
4.6 Other Projects
There are several other systems presently in discussion and planning stages worthy of note. The first two are largely government driven, with telecom serving small communities in areas of science and early warning importance.
First, the New Zealand government has recognized that a need exists for improved telecommunications connectivity to the Chatham Islands, a remote island community ∼800 km east of the New Zealand mainland. By adding scientific sensing capability, such a cable could also be leveraged to improve geohazards monitoring in the region (including tsunami and earthquake early warning) and enhance scientific understanding of a large range of geophysical and oceanographic processes. To address this, a workshop was convened in February 2021 to consider how to satisfy these needs. The report (Wallace et al., 2021) summarized the main findings and conclusions of the workshop and background information necessary for considering the development of permanent, offshore observing capability in New Zealand. A primary conclusion of the workshop, and a recommendation of the report, is “that a hybrid cable design incorporating both “in-line” sensors and external sensors connected to branching units, plus fiber strands usable for distributed acoustic sensing (DAS) would provide the best balance between the oceanographic, geophysical, and geohazards monitoring benefits of offshore scientific infrastructure. This approach to the cable design would future-proof the cable and its sensor payloads, maximizing the return on investment as technology improves in decades to come, while ensuring that the scientific components did not compromise the cable’s primary mission.” Discussions and planning regarding this possible cable system (and addition of scientific sensing capability) are currently ongoing.
Second, the US National Science Foundation is interested in a submarine fiber optic telecommunications cable from New Zealand to McMurdo Station in Antarctica, with terabit-scale networking capability that could eliminate current bandwidth constraints faced by researchers, educators, and support functions in the Antarctic, while also reducing the latency of current satellite-based communication. The cable infrastructure can also serve as a scientific platform using SMART Cables with capability to monitor ocean conditions and seismic activity. To document the benefits of such a cable, a workshop (https://www.pgc.umn.edu/workshops/antarctic-cable/) was held 29 June–1 July 2021. The following insights are obtained from the workshop report (Neff et al., 2021). Observations of temperature and pressure on a new SMART cable to McMurdo will immediately provide important climate change metrics in the Southern Ocean, including Antarctic Bottom Water temperature and volume, Antarctic Circumpolar Current transport, and regional sea level rise. The cable’s enabling characteristics would be real time, high frequency sampling, 24/7/365 acquisition, good spatial resolution (∼50 km), the spanning of a major inter-ocean chokepoint, and rare observations below 2000 m. These measurements are invaluable for understanding the progression and causes of climate change and predicting global climate conditions into the future. SMART seismic accelerometers along such a cable would fill a large data gap in the southern oceans that limits the resolution of global seismic Earth models. SMART seismic acceleration data, augmented with inexpensive acoustic and optical fiber sensing, also enable the monitoring of grounded ice motion, ice shelf-breaking tsunamis, marine mammals, seismic ocean thermometry, and micro-earthquakes. The inclusion of additional branching nodes would open unprecedented opportunities in Southern Ocean biogeochemical, ecosystem, and water column sensing, AUV docking, acoustic communications and navigation. All these enhancements to the basic SMART cable would be neutral with respect to the fundamental communications mission of the cable and could enable the first step in a future Southern Ocean Observatory.
In the Atlantic, the GEANT research and education network is seeking ways to provide free fibers for scientific use along spurs of the EllaLink cable, which connects European and South American academic networks (https://www.geant.org/geolab). Different types of interrogators, e.g., Distributed Acoustic Sensing (DAS) or Distributed Temperature Sensing (DTS), could be attached by scientists to carry out distributed sensing along the fiber, although currently this technique is limited to a range of several tens of kilometers.
Lastly, Project Koete, connecting Perth-Darwin-Jakarta-Singapore-Malaysia, with additional branches to serve the Australian Northwest Territories, including offshore oil and gas, is largely commercially driven but will include a SMART component. Specifically, it will be designed to support earthquake and tsunami early warning, as well as monitor the ocean environment (Project Koete, 2021).
5 Other Considerations
5.1 Data Management
Data from SMART cables will transit through the cable fiber to land stations where they will be stored and distributed. Individual countries and cable operators can establish their own data policies, based on each system configuration. However, the JTF is advocating for the Findable, Accessible, Interoperable, Reusable (FAIR) data principles, especially for data critical to Early Warning Systems (seismic and pressure data).
The physical parameters measured by SMART cables are already measured by ocean and land-based systems. For example, an entire data ecosystem already exists for sea-level data though the Global Sea-Level Observing System (GLOSS, https://www.gloss-sealevel.org/), for seismic data through the Incorporated Research Institutions for Seismology (IRIS) Data Management Center (https://ds.iris.edu/ds/nodes/dmc/) or the federated European Integrated Data Archive (EIDA) (Strollo et al., 2021; http://www.orfeus-eu.org/data/eida/), and the US NOAA National Centers for Environmental Information (https://www.ncei.noaa.gov/). Real time data for the purposes of early warning and operational oceanography will make use of the WMO’s Global Telecommunications System (GTS). High sampling rate data (accelerometer, pressure sensors) can also be supplied by established real time protocols already in use by seismic data and tsunami warning centers for land-based seismic sensors, for example seedlink (IRIS, 2021).
For SMART cables within a single country, in many cases national data centers will be the authoritative source of the data. As a specific example, for the CAM-2 system, the Instituto Português do Mar e da Atmosfera (IPMA) will handle the data.
5.2 Legal, Permitting, and Security Concerns
There are various concerns regarding marine science research and the legal and permitting status of the cables (Bressie, 2012). Our approach is, at this early stage, to deal only with domestic projects or between amicable countries and set precedents. If a planned cable route passes through a third party’s waters and they object, the problem can be circumvented by simply not installing SMART in their waters. In the longer term we will work with IOC and WMO to develop a process to handle this. In the end, pragmatic advances may rely upon a priori arrangements with individual governments. The JTF is working with government regulators to encourage the adoption of incentives for SMART cables, such as expedited permitting, reduction in fees, and access.
Such a pragmatic approach also applies to cable integrity and security issues. Up to now, cables have largely been “deaf, dumb and blind” to their environment with damage detected only after a fault. SMART sensors and DAS can be used to improve cable protection, e.g., detect trawlers and dragging anchors before they hit the cable allowing for intervention before damage is done, as well as other external aggression with malign intent, for the benefit of the telecom mission. More generally, data from SMART cables can be used to improve routing of future cables to avoid, for instance, potential landslide areas, given recent experience off Taiwan (Carter et al., 2014) and the Congo River Canyon (Talling et al., 2020).
A concern often raised is that having the locations of sensors public, the cables may become easy targets for military or terrorist action. In fact, this information is already public. Cable route positions are not classified. Preliminary routes are open while final routes are merely business confidential. Cable ships use AIS (commercially and publicly available ship positions) and often publish navigation screen images on social media so that a determined actor would generally be able to obtain cable positions. From inception, submarine cables have occasionally been military targets, when they are usually cut right at the very start of a conflict. A famous example is the British CS Alert cutting German submarine cables at the start of WWI (Winkler, 2008). SMART capability will not change this.
5.3 Costs and Financing
Typical submarine cable system costs range between US $20,000 and US $40,000 per kilometer. We estimate that the incremental cost of SMART capability is about 10% after the research and development costs are recouped by suppliers. During the first years, the cost will likely be higher. For example, a telecom cost of $30,000/km with a system length of 4,000 km and 15% incremental cost yields US $120M telecom + $18M SMART = US $138M total.
Several approaches can be considered to finance the additional cost of adding SMART sensing to telecommunications cables. Such funding can either be provided on a stand-alone basis to directly cover such cost or integrated into the overall financing structures of the cable project.
A variety of institutions may be motivated to provide grant funding for this effort. These include government agencies, international development institutions, and philanthropic foundations who might be interested in supporting early-warning systems for improved disaster resilience for Small Island Developing States (SIDS) and Least Developed Countries (LDCs), or who are seeking to build better real-time data infrastructures for science. Private companies aligned with the UN SDG goals who wish to be considered for Environment, Sustainability, and Governance (ESG) investment may likewise be interested to support such efforts, for instance, out of their Corporate Social Responsibility (CSR) budgets. This could also be the case for technology companies eager to get a foothold in the emerging ocean innovation space for blue infrastructure (Thiele et al., 2020).
A more complex but potentially larger and attractive financing perspective arises if the SMART infrastructure can become part of the overall finance package for the telecoms project (Thiele and Gerber, 2017). In practice, the use of such sensing adds additional beneficiaries to the cable infrastructure: the users of the SMART data. If such users, for instance a government research or operational body (e.g., tsunami early warning centers), are willing to enter into long-term capacity purchase agreements with the telecommunications operator, this additional source of cash flow could be attractive to the subsea cable operator and might be sufficient to cover the additional cost. Furthermore, by enlisting a client that is backed by a government with a solid credit rating, additional senior debt may be made available from international lenders, including potentially at concessional rates from multilateral development banks (Asian Development Bank, 2018).
Overall, a blended finance approach, with some upfront grant funding for project design and development, combined with longer term project debt could provide a solid base for rolling out SMART sensors on ocean cables at a low cost and as a key contribution to an innovative ocean data infrastructure for a sustainable future (Claudet et al., 2020).
5.4 Relationship to Other Programs and Organizations
The JTF is following several paths to encourage adoption by interacting with other entities and stakeholders. Within ITU (hosting the JTF Secretariat) several activities are advancing: a SMART Resolution before the World Technical Standards Assembly; amendments to existing climate and disaster risk reduction resolutions; SMART system recommendations being prepared by Study Group 15/Q8; and participation in the Global Symposium for Regulators. Via an ITU Circular, we are reaching out to all member states, suppliers, “over-the-top” (OTT) content providers (e.g., Google, Facebook), regulators, and development banks, as well as the UN hierarchy of climate, ocean, and disaster risk reduction for support.
Within the IOC, in June 2021, the General Assembly approved a Tsunami Programme explicitly including SMART, formulated by the Tsunami and other Sea Level Related Hazards Warning System (TOWS) Working Group, for the UN Decade of Ocean Science for Sustainable Development. JTF has been endorsed as a project of the UN Decade. All these activities are at a level involving the UN member states.
Within the framework of the UN Decade, we will interact with the Global Ocean Observing System (GOOS) to ensure that the measurements we provide will be assimilated properly into the System. SMART Cables are included as one component of the Deep Ocean Observing Strategy (Levin et al., 2019; https://deepoceanobserving.org/).
6 Concluding Remarks
SMART Cables follow an innovative implementation path outside the classical “oceanography box” with an unusual cast of stakeholders. The sum of combining cable and sensing technology will be greater than the parts. SMART cables can revolutionize access to the global deep ocean and enable unique ocean observations of major importance, while improving cable system performance and integrity. To achieve this, the ocean community and the telecom industry must work together in the context of the UN Decade of Ocean Science and the Blue Economy to produce a global telecom plus science network for societal benefit.
In this paper we show that SMART cables will fill scientific and societal needs via ocean monitoring of essential ocean variables (EOVs) and provide data critical to supporting disaster early warning services, directly and indirectly addressing multiple sustainable development goals. All cable system suppliers have said that SMART cable systems are technically achievable; Alcatel Submarine Networks has stated they will supply SMART capability. Systems are moving ahead without legal, permitting, or security issues, indicating that the establishment of SMART cable capability is tractable. Similarly, systems now underway demonstrate that SMART cable systems can be financially feasible, with the expectation that funding models will adapt to specific situations and change over time as the process matures.
We conclude with the recommendation from the OceanObs’19 conference:
Transition telecom + sensing SMART subsea cable systems from present pilots to trans-ocean and global implementation, to support climate, ocean circulation, sea level monitoring, and tsunami and earthquake early warning and disaster risk reduction.
Author Contributions
BH provided the overall guidance and editing for the paper. CB wrote the introduction. The following authors contributed to the science sections: CR, seismology; SW, NB, and BF, tsunamis; JA and DL, oceanography. SL wrote the technical approach section with WW contributing the part on seismic and pressure sensor specifications. HJ supplied the ocean seismic noise data. GM contributed the InSea Wet Demo section. JA contributed the Vanuatu-New Caledonia section. AS and AES contributed the Indonesia section. AJ contributed the French Polynesia section. LM and JB contributed the Portugal CAM2 section. TT and BH wrote the cost and finance section. FT contributed to all aspects of the paper. Other authors all provided input and editing
Funding
BH was supported by NASA (via JPL) NNN13D462T for the writing of this paper.
Conflict of Interest
NB is employed by Aqua Comms. SL is employed by Ocean Specialists, Inc. MF is employed by Subsea Data Systems, Inc.
The remaining authors declare that the research was conducted in the absence of any commercial or financial relationships that could be construed as a potential conflict of interest.
Publisher’s Note
All claims expressed in this article are solely those of the authors and do not necessarily represent those of their affiliated organizations, or those of the publisher, the editors and the reviewers. Any product that may be evaluated in this article, or claim that may be made by its manufacturer, is not guaranteed or endorsed by the publisher.
Acknowledgments
We gratefully acknowledge discussions and input from Diego Arcas (NOAA, United States), Michael Begnaud (LANL, United States), John Balmer (Guralp Systems, United Kingdom), Laura Beranzoli (INGV, Italy), Esline Garaebiti Bule (Ministry of Climate and Disaster Risk Reduction, Vanuatu), Christopher Hughes (NOC, United Kingdom), David T. Meldrum (SAMS, United Kingdom), Yuelong Miao (BoM, Australia), Manfred Niehus (Instituto de Telecomunicações, Portugal), Yasser Omar (Instituto de Telecomunicações, Portugal), Sasono Rahardjo (BPPT, Indonesia), Mary Rengifo (Tsunami Warning Center, Colombia), Nelly Florida Riama (BMKG, Indonesia), Vasco Sá (Instituto de Telecomunicações, Portugal), Masanao Shinohara (University of Tokyo, Japan), Y. Tony Song (JPL/Caltech, United States), Udrekh (BNTP, Indonesia), and Carlos Zuniga (Servicio Hidrografco y Oceanografco de la Armada, Chile). J. You is acknowledged for providing the initial vision for the SMART cables concept. B. Bay worked on illustrations and M. Izumi and I. Ying on technical editing. Maps in Figures 1, 4 were provided by M. Chandler using GMT. Authors’ and contributors’ individual contributions and the support of their respective institutions are gratefully acknowledged. This is University of Hawaiʻi at Mānoa SOEST Contribution Number 11451. Los Alamos National Laboratory Publication LA-UR-21-29030.
References
Aguzzi, J., Flexas, M. M., Flögel, S., Lo Iacono, C., Tangherlini, M., Costa, C., et al. (2020). Exo-Ocean Exploration with Deep-Sea Sensor and Platform Technologies. Astrobiology. 20, 897–915. doi:10.1089/ast.2019.2129
Alcatel Submarine Networks (2020). Climate Change. Paris, France: Press release. Available at: https://web.asn.com/en/press-release/climate-change.html (Accessed September 29, 2020).
Angove, M., Arcas, D., Bailey, R., Carrasco, P., Coetzee, D., Fry, B., et al. (2019). Ocean Observations Required to Minimize Uncertainty in Global Tsunami Forecasts, Warnings, and Emergency Response. Front. Mar. Sci. 6, 350. doi:10.3389/fmars.2019.00350
Aoi, S., Asano, Y., Kunugi, T., Kimura, T., Uehira, K., Takahashi, N., et al. (2020). MOWLAS: NIED Observation Network for Earthquake, Tsunami and Volcano. Earth Planets Space. 72, 126. doi:10.1186/s40623-020-01250-x
Arbic, B. K., Garner, S. T., Hallberg, R. W., and Simmons, H. L. (2004). The Accuracy of Surface Elevations in Forward Global Barotropic and Baroclinic Tide Models. Deep Sea Res. 51 (25-26), 3069–3101. doi:10.1016/j.dsr2.2004.09.014
Ardhuin, F., Rawat, A., and Aucan, J. (2014). A Numerical Model for Free Infragravity Waves: Definition and Validation at Regional and Global Scalesfinition and Validation at Regional and Global Scales. Ocean Model. 77, 20–32. doi:10.1016/j.ocemod.2014.02.006
Ardhuin, F., Stutzmann, E., Schimmel, M., and Mangeney, A. (2011). Ocean Wave Sources of Seismic Noise. J. Geophys. Res. 116 (C9), C09004. doi:10.1029/2011JC006952
Asian Development Bank (2018). Multilateral Banks Reaffirm Pledge to Support Resilient, Sustainable Infrastructure. News Release, 13 October 2018. Available at https://www.adb.org/news/multilateral-banks-reaffirm-pledge-support-resilient-sustainable-infrastructure [Last accessed. January, 5 2022]
Aucan, J., and Ardhuin, F. (2013). Infragravity Waves in the Deep Ocean: An Upward Revision. Geophys. Res. Lett. 40, 3435–3439. doi:10.1002/grl.50321
Baker-Yeboah, S., Watts, D. R., and Byrne, D. A. (2009). Measurements of Sea Surface Height Variability in the Eastern South Atlantic from Pressure Sensor-Equipped Inverted echo Sounders: Baroclinic and Barotropic Components. J. Atmos. Ocean. Techn. 26 (12), 2593–2609. doi:10.1175/2009JTECHO659.1
Baptista, M. A., and Miranda, J. M. (2009). Revision of the Portuguese Catalog of Tsunamis. Nat. Hazards Earth Syst. Sci. 9 (1), 25–42. doi:10.5194/nhess-9-25-2009
Barnes, C. R., Best, M. M. R., Bornhold, B. D., Juniper, S. K., Pirenne, B., and Phibbs, P. (2007). The NEPTUNE Project—A Cabled Ocean Observatory in the NE Pacific: Overview, Challenges and Scientific Objectives for the Installation and Operation of Stage I in Canadian Waters. Tokyo: Fifth Underwater Technology Symposium, 7p.
Barnes, C. R., Best, M. M. R., Johnson, F. R., and Pirenne, B. (2015). “NEPTUNE Canada: Installation and Initial Operation of the World's First Regional Cabled Ocean Observatory,” in Seafloor Observatories: A New Vision from the Abyss (Heidelberg: Springer Praxis Books), 415–438. doi:10.1007/978-3-642-11374-1_16
Barnes, C. R. (2018). “Quantum Leap in Platforms of Opportunity: Telecommunication Cables,” in Challenges and Innovations in Ocean In-situ Sensors—Measuring Inner Ocean Processes and Health in the Digital Age (Elsevier), 205–216.
Barriot, J. P., Serafini, J., Sichoix, L., Reymond, D., and Hyvernaud, O. (2012). The Tsunami of March 11, 2011 as Observed by the Network of Tide Gauges of French Polynesia. J. Mar. Sci. Tech. 20 (6), 639–646. doi:10.6119/JMST-012-0430-1
Barruol, G., Suetsugu, D., Shiobara, H., Sugioka, H., Tanaka, S., Bokelmann, G. H. R., et al. (2009). Mapping Upper Mantle Flow beneath French Polynesia from Broadband Ocean Bottom Seismic Observations. Geophys. Res. Lett. 36, L14301. doi:10.1029/2009GL038139
Bertin, X., de Bakker, A., van Dongeren, A., Coco, G., André, G., Ardhuin, F., et al. (2018). Infragravity Waves: From Driving Mechanisms to Impacts. Earth-Science Rev. 177, 774–799. doi:10.1016/j.earscirev.2018.01.002
Best, M., Favali, P., Beranzoli, L., Cannat, M., Çağatay, M. N., Dañobeitia, J. J., et al. (2014). EMSO: A Distributed Infrastructure for Addressing Geohazards and Global Ocean Change. oceanog. 27 (2), 167–169. doi:10.5670/oceanog.2014.52
Best, M. M. R., Barnes, C., Bornhold, B., and Juniper, K. (2015). “Integrating Continuous Observatory Data from the Coast to the Abyss: A Multidisciplinary View of the Ocean in Four Dimensions,” in Seafloor Observatories: A New Vision of the Earth from the Abyss. Editors P. Favali, A. de Santis, and L. Beranzoli (Berlin, Heidelberg: Springer Berlin Heidelberg).
Best, M. M. R., Bornhold, B. D., Juniper, S. K., and Barnes, C. R. (2007). “NEPTUNE Regional Cabled Observatory: Science Plan,” in OCEANS 2007 International Meeting of the Marine Technology Society and Institute of Electrical and Electronics Engineers (Vancouver, B.C.: Canada).
Bondár, I., and McLaughlin, K. L. (2009). A New Ground Truth Data Set for Seismic Studies. Seismological Res. Lett. 80 (3), 465–472. doi:10.1785/gssrl.80.3.465
Bressie, K. (2012). Using Submarine Cables for Climate Monitoring and Disaster Warning: Opportunities and Legal Challenges. International Telecommunication Union, 36. Available at https://www.itu.int/dms_pub/itu-t/oth/4B/04/T4B040000160001PDFE.pdf.
Bromirski, P. D., Duennebier, F. K., and Stephen, R. A. (2005). Mid-Ocean Microseisms. Geochem. Geophys. Geosyst. 6 (4), a–n. doi:10.1029/2004GC000768
Butler, R., and Aucan, J. (2018). Multisensor, Microseismic Observations of a hurricane Transit Near the ALOHA Cabled Observatory. J. Geophys. Res. Solid Earth. 123 (4), 3027–3046. doi:10.1002/2017JB014885
Butler, R., Cochran, E., Collins, J., Eblé, M., Evans, J., Favali, P., et al. (2014). The Scientific and Societal Case for the Integration of Environmental Sensors into New Submarine Telecommunication Cables. Joint Task Force on Green Cables. Geneva, Switzerland: International Telecommunication Union. Available at https://www.itu.int/dms_pub/itu-t/opb/tut/T-TUT-ICT-2014-03-PDF-E.pdf.
Caldwell, P. C., Merrifield, M. A., and Thompson, P. R. (2015). “Sea Level Measured by Tide Gauges from Global Oceans,” in Joint Archive for Sea Level Holdings (NCEI Accession 0019568), Version 5.5 (NOAA National Centers for Environmental Information, Dataset). doi:10.7289/V5V40S7W
Carney, M. (2021). Clean and Green Finance. International Monetary Fund . Available at https://www.imf.org/external/pubs/ft/fandd/2021/09/pdf/mark-carney-net-zero-climate-change.pdf [Last accessed. January 6, 2022]
Carter, L., Gavey, R., Talling, P., and Liu, J. (2014). Insights Into Submarine Geohazards from Breaks in Subsea Telecommunication Cables. oceanog. 27 (2), 58–67. doi:10.5670/oceanog.2014.40
Cauzzi, C., and Clinton, J. (2013). A High- and Low-Noise Model for High-Quality Strong-Motion Accelerometer Stations. Earthquake Spectra. 29 (1), 85–102. doi:10.1193/1.4000107
Chadwick, W. W., Nooner, S. L., Zumberge, M. A., Embley, R. W., and Fox, C. G. (2006). Vertical Deformation Monitoring at Axial Seamount since its 1998 Eruption Using Deep-Sea Pressure Sensors. J. Volcanology Geothermal Res. 150, 313–327. doi:10.1016/j.jvolgeores.2005.07.006
Chave, A. D., Luther, D. S., and Thomson, D. J. (2019). High‐ Q Spectral Peaks and Nonstationarity in the Deep Ocean Infragravity Wave Band: Tidal Harmonics and Solar Normal Modes. J. Geophys. Res. Oceans. 124, 2072–2087. doi:10.1029/2018JC014586
Chen, B.-R., Feng, X.-T., Li, Q.-P., Luo, R.-Z., and Li, S. (2015). Rock Burst Intensity Classification Based on the Radiated Energy with Damage Intensity at Jinping II Hydropower Station, China. Rock Mech. Rock Eng. 48, 289–303. doi:10.1007/s00603-013-0524-2
Claudet, J., Bopp, L., Cheung, W. W. L., Devillers, R., Escobar-Briones, E., Haugan, P., et al. (2020). A Roadmap for Using the UN Decade of Ocean Science for Sustainable Development in Support of Science, Policy, and Action. One Earth. 2 (1), 34–42. ISSN 2590-3322. doi:10.1016/j.oneear.2019.10.012
Clinton, J. F., and Heaton, T. H. (2002). Potential Advantages of a Strong-Motion Velocity Meter Over a Strong-Motion Accelerometer. Seismological Res. Lett. 73 (3), 332–342. doi:10.1785/gssrl.73.3.332
Consortium for Ocean Leadership (2010). Ocean Observatories Initiative Final Network Design. Version 2-06-P, Document Control Number 1101-00000, 2010-04-22. Available at: http://www.oceanobservatories.org/wp-content/uploads/2012/04/1101-00000_FND_OOI_ver_2-06_Pub.pdf
Crawford, W. C., and Singh, S. C. (2008). Sediment Shear Properties from Seafloor Compliance Measurements: Faroes-Shetland basin Case Study. Geophys. Prospect. 56, 313–325. doi:10.1111/j.1365-2478.2007.00672.x
Dai, M., Higman, B., Lynett, P. J., Jacquemart, M., Howat, I. M., and Liljedahl, A. K. (2020). Detection and Assessment of a Large and Potentially Tsunamigenic Periglacial Landslide in Barry Arm, Alaska. Geophy. Res. Lett. 47, e2020GL089800. doi:10.1029/2020GL089800
Dahm, T., Tilmann, F., and Morgan, J.-P. (2006). Seismic Broadband Ocean-Bottom Data and Noise Observed with Free-Fall Stations: Experiences from Long-Term Deployments in the North Atlantic and the Tyrrhenian Sea. Bull. Seismological Soc. America. 96, 647–664. doi:10.1785/0120040064
Dañobeitia, J. J., Pouliquen, S., Johannessen, T., Basset, A., Cannat, M., Pfeil, B. G., et al. (2020). Toward a Comprehensive and Integrated Strategy of the European marine Research Infrastructures for Ocean Observations. Front. Mar. Sci. 7, 180. doi:10.3389/fmars.2020.00180
Delory, E., and Pearlman, J. (2018). Challenges and Innovations in Ocean In-Situ Sensors—Measuring Inner Ocean Processes and Health in the Digital Age. Cambridge, MA: Elsevier, Inc.
Duennebier, F. K., and Sutton, G. H. (2007). Why Bury Ocean Bottom Seismometers? Geochem. Geophys. Geosyst. 8 (2), a–n. doi:10.1029/2006GC001428
Duputel, Z., Rivera, L., Kanamori, H., et al. (2011). Real-time W Phase Inversion during the 2011 off the Pacific Coast of Tohoku Earthquake. Earth PlanetSpace. 63, 5. doi:10.5047/eps.2011.05.032
Egbert, G. D., Ray, R. D., and Bills, B. G. (2004). Numerical Modeling of the Global Semidiurnal Tide in the Present Day and in the Last Glacial Maximum. J. Geophys. Res. 109, C03003. doi:10.1029/2003JC001973
European Marine Board (2019). Navigating the Future V: Marine Science for a Sustainable Future. Ostend, Belgium: Position Paper 24 of the European Marine Board. 97894920437570167-9309. doi:10.5281/zenodo.2809392
Favali, P., Beranzoli, L., Best, M. M. R., Delaney, J. R., De Santis, A., Edwards, A. W., et al. (2015). “Concluding Remarks: Perspectives and Long-Term Vision,” in Seafloor Observatories: A New Vision of the Earth from the Abyss. Editors P. Favali, A. de Santis, and L. Beranzoli (Springer Praxis Books), 663–666. doi:10.1007/978-3-642-11374-1_26
Favali, P., Person, R., Barnes, C. R., Kaneda, Y., Delaney, J. R., and Hsu, S-K. (2010). “Seafloor Observatory Science,” in OceanObs’09: Sustained Ocean Observations and Information for Society, Venice Italy, September 21-25. Proceedings. Editors J. Hall, and D. E. Harrison (D. Stammer). doi:10.5270/oceanobs09.cwp.28
Fritz, H. M., and Hager, W. H. (2001). Lituya Bay Case: Rockslide Impact and Wave Run-Up. Sci. Tsunami Haz. 19 (1), 3–19. Available at https://library.lanl.gov/tsunami/.
Galindez-Jamioy, C. A., and López-Higuera, J. M. (2012). Brillouin Distributed Fiber Sensors: an Overview and Applications. J. Sensors. 2012, 1–17. doi:10.1155/2012/204121
GOOS Steering Committee (2019). The Global Ocean Observing System 2030 Strategy. UNESCO Intergovernmental Oceanographic Commision (IOC), Paris. GOOS Report No. 239.
Goto, H., and Morikawa, H. (2012). Ground Motion Characteristics during the 2011 off the Pacific Coast of Tohoku Earthquake. Soils and Foundations. 52 (5), 769–779. doi:10.1016/j.sandf.2012.11.002
Government of Portugal (2020). CAM-2 Announcement. Despacho n.º 9333/2020, Publicação: Diário da República n.º 191/2020, Série II de 2020-09-30. Available at: https://dre.pt/web/guest/pesquisa/-/search/144137764/details/normal?q=9333%2F2020
Grünthal, G., and Wahlström, R. (2012). The European-Mediterranean Earthquake Catalogue (EMEC) for the Last Millennium. J. Seismol. 16 (3), 535–570. doi:10.1007/s10950-012-9302-y
Hazell, N., Lécroart, A., and Marcerou, J.-F. (2007). “Regional cable Observatory Solutions,” in Oceans 2007 International Meeting of the Marine Technology Society and Institute of Electrical and Electronics Engineers (Canada: Vancouver, B.C.). doi:10.1109/oceans.2007.4449231
Heidarzadeh, M., and Satake, K. (2015). Source Properties of the 1998 July 17 Papua New Guinea Tsunami Based on Tide Gauge Records. Geophys. J. Int. 202 (1), 361–369. doi:10.1093/gji/ggv145
Herbers, T. H. C., Elgar, S., and Guza, R. T. (1995). Generation and Propagation of Infragravity Waves. J. Geophys. Res. 100 (C1224), 863–24872. doi:10.1029/95jc02680
Herbers, T. H. C., and Guza, R. T. (1994). Nonlinear Wave Interactions and High-Frequency Seafloor Pressure. J. Geophys. Res. 99 (10), 10. doi:10.1029/94jc00054
Herman, M. W., and Furlong, K. P. (2021). Triggering an Unexpected Earthquake in an Uncoupled Subduction Zone. Sci. Adv. 7 (13), eabf7590. doi:10.1126/sciadv.abf7590
Howe, B. M., Arbic, B. K., Aucan, J., Barnes, C. R., Bayliff, N., Becker, N., et al. (2019). SMART Cables for Observing the Global Ocean: Science and Implementation. Front. Mar. Sci. 6, 424. doi:10.3389/fmars.2019.00424
Howe, B. M., Duennebier, F. K., and Lukas, R. (2015). “The ALOHA Cabled Observatory,” in Ocean Observatories: A New Vision of the Earth from the Abyss (Heidelberg: Springer Praxis Books), 439–463. Part 3, Ch. 17. doi:10.1007/978-3-642-11374-1_17
Hughes, C. W., Elipot, S., Morales Maqueda, M. Á., and Loder, J. W. (2013). Test of a Method for Monitoring the Geostrophic Meridional Overturning Circulation Using Only Boundary Measurements. J. Atmos. Ocean. Tech. 30, 789–809. doi:10.1175/JTECH-D-12-00149.1
Hughes, C. W., Williams, J., Blaker, A., Coward, A., and Stepanov, V. (2018). A Window on the Deep Ocean: The Special Value of Ocean Bottom Pressure for Monitoring the Large-Scale, Deep-Ocean Circulation. Prog. Oceanography. 161, 19–46. doi:10.1016/j.pocean.2018.01.011
Iinuma, T., Hino, R., Kido, M., Inazu, D., Osada, Y., Ito, Y., et al. (2012). Coseismic Slip Distribution of the 2011 off the Pacific Coast of Tohoku Earthquake (M9.0) Refined by Means of Seafloor Geodetic Data. J. Geophys. Res. 117, a–n. doi:10.1029/2012JB009186
IPCC (2021). “Climate Change 2021: The Physical Science Basis,” in Contribution of Working Group I to the Sixth Assessment Report of the Intergovernmental Panel on Climate Change. Editors V. Masson-Delmotte, P. Zhai, A. Pirani, S. L. Connors, C. Péan, S. Bergeret al. (Cambridge University Press).
IRIS (Incorporated Research Institutions for Seismology) (2021). Seedlink Web page. Available at: http://ds.iris.edu/ds/nodes/dmc/services/seedlink/(Accessed December 20, 2021)
Ito, Y., Hino, R., Kido, M., Fujimoto, H., Osada, Y., Inazu, D., et al. (2013). Episodic Slow Slip Events in the Japan Subduction Zone before the 2011 Tohoku-Oki Earthquake. Tectonophysics. 600, 14–26. doi:10.1016/j.tecto.2012.08.022
Janiszewski, H. A., Russel, J. B., Hawley, W. B., Tan, Y. J., Lynner, C., Gaherty, J. B., et al. (2020). 10+ Years of Ocean Bottom Seismometer Noise: Fresh Insights and Persistent Questions. Abstract S059-01, 1-17. San Francisco, CA: AGU Fall Meeting, 2020.
Jayne, S., Roemmich, D., Roemmich, D., Zilberman, N., Riser, S., Johnson, K., et al. (2017). The Argo Program: Present and Future. Oceanog. 30, 18–28. doi:10.5670/oceanog.2017.213
Johns, W. E., Baringer, M. O., Beal, L. M., Cunningham, S. A., Kanzow, T., Bryden, H. L., et al. (2011). Continuous, Array-Based Estimates of Atlantic Ocean Heat Transport at 26.5°N. J. Clim. 24, 2429–2449. doi:10.1175/2010JCLI3997.1
Johnson, G. C., Lyman, J. M., and Purkey, S. G. (2015). Informing Deep Argo Array Design Using Argo and Full-Depth Hydrographic Section Data. J. Atmos. Ocean. Tech. 32, 2187–2198. doi:10.1175/jtech-d-15-0139.1
Johnson, G. C., Purkey, S. G., Zilberman, N. V., and Roemmich, D. (2019). Deep Argo Quantifies Bottom Water Warming Rates in the Southwest Pacific basin. Geophys. Res. Lett. 46, 2662–2669. doi:10.1029/2018GL081685
Johnson, G. C. (2008). Quantifying Antarctic Bottom Water and north Atlantic Deep Water Volumes. J. Geophys. Res. 113, C05027. doi:10.1029/2007JC004477
Joint Task Force Engineering Team (2021). General Requirements for Sensor Enabled and Reliable Telecommunications (SMART) Cable Systems. JTF Engineering Team White Paper (10). Available at https://www.itu.int/en/ITU-T/climatechange/task-force-sc/Documents/General-Requirements-of-a-SMART-Cable-Issue-1.0.pdf.
Joint Task Force (2015a). Functional Requirements of “green” Submarine cable Systems. ITU. Available at: https://www.itu.int/en/ITU-T/climatechange/task-force-sc/Documents/Functional-requirements-2015-05.pdf
Joint Task Force (2015b). Wet Demonstrator: Scope Document and Budgetary Cost Estimate. Available at: https://www.itu.int/en/ITU-T/climatechange/task-force-sc/Documents/Wet-demonstrator-requirements-2015-05.pdf
Joint Task Force (2016). Sensor Enabled Scientific Monitoring and Reliable Telecommunications (SMART) cable Systems: Wet Demonstrator Project Description. Issue 1.0. Available at: https://www.itu.int/en/ITU-T/climatechange/task-force-sc/Documents/Wet-Demonstrator-Design-Issue-1.0.pdf
Kamalov, V., and Cantono, M. (2020). What’s Shaking? Earthquake Detection with Submarine Cables. Available at: https://cloud.google.com/blog/products/infrastructure/using-subsea-cables-to-detect-earthquakes
Kanamori, H., and Rivera, L. (2008). Source Inversion of W Phase: Speeding up Seismic Tsunami Warning. Geophys. J. Int. 175 (1), 228–238. doi:10.1111/j.1365-246x.2008.03887.x
Kanazawa, T., Uehira, K., Mochizuki, M., Takashi, S., Fujimoto, H., Noguchi, S. I., et al. (2016). S-net Project: Cabled Observation Network for Earthquakes and Tsunamis. San Francisco, CA: American Geophysical UnionH43B1840M. Fall Meeting, Abstract #NH43B-1840, Bibcode: 2016AGUFMN.
Kasahara, J., Utada, H., Sato, T., and Kinoshita, H. (1998). Submarine cable OBS Using a Retired Submarine Telecommunication cable: GeO-TOC Program. Phys. Earth Planet. Interiors. 108 (2), 113–127. doi:10.1016/s0031-9201(98)00090-9
Kawaguchi, K., Araki, E., Kaneko, S., and Kaneda, Y. (2008). Design of Deep Ocean Submarine cable Observation Network for Earthquakes and Tsunamis. OCEANS 2008-MTS/IEEE Kobe, 1–4.
Kawaguchi, K., Kaneko, S., Nishida, T., and Komine, T. (2015). “Construction of the DONET Real-Time Seafloor Observatory for Earthquakes and Tsunami Monitoring,” in Ocean Observatories: A New Vision of the Earth from the Abyss. Editors P. Favali, and A. Santis (Heidelberg: Springer Praxis Books), 212–228. Part 2, Ch. 10. doi:10.1007/978-3-642-11374-1_10
Kelley, D. S., Delaney, J. R., and Juniper, S. K. (2014). Establishing a new era of Submarine Volcanic Observatories: Cabling Axial Seamount and the Endeavour Segment of the Juan de Fuca Ridge. Mar. Geology. 352, 426–450. doi:10.1016/j.margeo.2014.03.010
King, B. A., Firing, E., and M.Joyce, T. (2001). Chapter 3.1 Shipboard Observations During WOCE. Int. Geophys. 77, 99–122. doi:10.1016/s0074-6142(01)80114-5
Kohler, M. D., Smith, D. E., Andrews, J., Chung, A. I., Hartog, R., Henson, I., et al. (2020). Earthquake Early Warning ShakeAlert 2.0: Public Rollout. Seismol. Res. Lett. 91, 1763–1775. doi:10.1785/0220190245
Kuna, V. M., and Nábělek, J. L. (2021). Seismic Crustal Imaging Using Fin Whale Songs. Science. 371 (6530), 731–735. doi:10.1126/science.abf3962
Leichter, J. J., Stokes, M. D., Hench, J. L., Witting, J., and Washburn, L. (2012). The Island-Scale Internal Wave Climate of Moorea, French Polynesia. J. Geophys. Res. 117, a–n. doi:10.1029/2012JC007949
Lentz, S., and Howe, B. (2018). Scientific Monitoring and Reliable Telecommunications (SMART) Cable Systems: Integration of Sensors into Telecommunications Repeaters. Kobe, Japan: OCEANS’18 MTS/IEEE Kobe/Techno-Ocean.
Lentz, S., and Phibbs, P. (2012). Engineering Feasibility Study: Using Submarine Cables for Climate Monitoring and Disaster Warning. Geneva, Switzerland: Joint Task Force.
Levin, L. A., Bett, B. J., Gates, A. R., Heimbach, P., Howe, B. M., Janssen, F., et al. (2019). Global Observing Needs in the Deep Ocean. Front. Mar. Sci. 6, 241. doi:10.3389/fmars.2019.00241
Lin, M., and Yang, C. (2020). Ocean Observation Technologies: a Review. Chin. J. Mech. Eng. 33, 32. doi:10.1186/s10033-020-00449-z
Lindsey, N. J., Martin, E. R., Dreger, D. S., Freifeld, B., Cole, S., James, S. R., et al. (2017). Fiber‐Optic Network Observations of Earthquake Wavefields. Geophys. Res. Lett. 4411 (23), 792799–792811. doi:10.1002/2017GL075722
Lindstrom, E., Gunn, J., Fischer, A., McCurdy, A., Glover, L. K., and Members, T. T. (2014). A Framework for Ocean Observing. UNESCO 2012 (revised in 2017). IOC/INF-1284 rev. 2. Available at: https://unesdoc.unesco.org/ark:/48223/pf0000211260
Lo Bue, N., Best, M. M. R., Embriaco, D., Abeysirigunawardena, D., Beranzoli, L., Dewey, R. K., et al. (2021). The Importance of marine Research Infrastructures in Capturing Processes and Impacts of Extreme Events. Front. Mar. Sci. 8, 626668. doi:10.3389/fmars.2021.626668
Longuet-Higgins, M. S. (1950). A Theory of the Origin of Microseisms. Phil. Trans. R. Soc. Lond. A. 243, 1–35. doi:10.1098/rsta.1950.0012
Lu, F., Zhou, H., Peng, X., Yue, J., and Wang, P. (2015). “Technical Preparation and Prototype Development for Long-Term Cabled Seafloor Observatories in Chinese Marginal Seas,” in Ocean Observatories: A New Vision of the Earth from the Abyss (Heidelberg: Springer Praxis Books), 503–529. Part 3, Ch. 19. doi:10.1007/978-3-642-11374-1_19
Lukas, R., Santiago-Mandujano, F., Bingham, F., and Mantyla, A. (2001). Cold Bottom Water Events Observed in the Hawaii Ocean Time-Series: Implications for Vertical Mixing. Deep Sea Res. Oceanographic Res. Pap. 48, 995–1021. doi:10.1016/s0967-0637(00)00078-9
Marra, G., Clivati, C., Luckett, R., Tampellini, A., Kronjäger, J., Wright, L., et al. (2018). Ultrastable Laser Interferometry for Earthquake Detection with Terrestrial and Submarine Cables. Science. 361, 486–490. doi:10.1126/science.aat4458
Martinez, E., Ganachaud, A., Lefevre, J., and Maamaatuaiahutapu, K. (2009). Central South Pacific Thermocline Water Circulation from a High-Resolution Ocean Model Validated against Satellite Data: Seasonal Variability and El Niño 1997-1998 Influence. J. Geophys. Res. 114, C05012. doi:10.1029/2008JC004824
Massion, G., and Raybould, K. (2006). MARS: The Monterey Accelerated Research System. Sea Technol. 47, 39–42.
McCarthy, G. D., Smeed, D. A., Johns, W. E., Frajka-Williams, E., Moat, B. I., Rayner, D., et al. (2015). Measuring the Atlantic Meridional Overturning Circulation at 26°N. Prog. Oceanography. 130, 91–111. doi:10.1016/j.pocean.2014.10.006
McKee, D. C., Yuan, X. J., Gordon, A. L., Huber, B. A., and Dong, Z. Q. (2011). Climate Impact on Interannual Variability of Weddell Sea Bottom Water. J. Geophys. Res.-Oceans. 116, 17. doi:10.1029/2010jc006484
Mildon, Z., Meschis, M., and Meschis, M. (2019). Fault Responsible for the 1908 Messina Earthquake Identified. Temblor. doi:10.32858/temblor.028
National Academies of Sciences, Engineering, and Medicine (2020). Sustaining Ocean Observations: Proceedings of a Workshop in Brief. Washington, DC: The National Academies Press. doi:10.17226/25997
Neff, P. D., Andreasen, J. A., Roop, H. A., Pundsack, J., Howe, B., Jacobs, G., et al. (2021). Antarctic Subsea Cable Workshop Report: High-Speed Connectivity Needs to Advance US Antarctic Science. Saint Paul, MN: University of Minnesota. Available at https://drive.google.com/file/d/1Ao4Hz6-bBheFMpGSR4nMvSZJ9kHpjj0o/view.
Nerem, R. S., Beckley, B. D., Fasullo, J. T., Hamlington, B. D., Masters, D., and Mitchum, G. T. (2018). Climate-Change-Driven Accelerated Sea-Level Rise Detected in the Altimeter Era. Proc. Natl. Acad. Sci. USA. 115, 2022–2025. doi:10.1073/pnas.1717312115
Obayashi, M., Yoshimitsu, J., Sugioka, H., Ito, A., Isse, T., Shiobara, H., et al. (2016). Mantle Plumes beneath the South Pacific Superswell Revealed by Finite Frequency P Tomography Using Regional Seafloor and Island Data. Geophys. Res. Lett. 43 (11), 628634–628711. doi:10.1002/2016GL070793
Omira, R., Baptista, M. A., Matias, L., Miranda, J. M., Catita, C., Carrilho, F., et al. (2009). Design of a Sea-Level Tsunami Detection Network for the Gulf of Cadiz. Nat. Hazards Earth Syst. Sci. 9 (4), 1327–1338. doi:10.5194/nhess-9-1327-2009
Paros, J., Migliacio, P., and Schaad, T. (2012). “Nano-resolution Sensors for Disaster Warning Systems,” in Nano-Resolution Sensors for Disaster Warning Systems. 2012 Oceans-Yeosu. doi:10.1109/OCEANS-YEOSU.2012.6263413
Person, R., Favali, P., Ruhl, H. A., Beranzoli, L., Rolin, J.-F., Waldmann, C., et al. (2015). “From ESONET Multidisciplinary Scientific Community to EMSO Novel European Research Infrastructure for Ocean Observation,” in Ocean Observatories: A New Vision of the Earth from the Abyss (HeidelbergPart: Springer Praxis Books), 3, 531–563. doi:10.1007/978-3-642-11374-1_20
Project Koete (2021). Available at: https://www.fibreexpressway.com/index.html
Purkey, S. G., and Johnson, G. C. (2010). Warming of Global Abyssal and Deep Southern Ocean Waters between the 1990s and 2000s: Contributions to Global Heat and Sea Level Rise Budgets. J. Clim. 23, 6336–6351. doi:10.1175/2010jcli3682.1
Ranasinghe, N., Rowe, C., Syracuse, E., Larmat, C., and Begnaud, M. (2018). Enhanced Global Seismic Resolution Using Transoceanic SMART Cables. Seismol. Res. Lett. 89 (1), 77–85. doi:10.1785/0220170068
Ray, R. D. (2013). Precise Comparisons of Bottom-Pressure and Altimetric Ocean Tides. J. Geophys. Res. Oceans. 118, 4570–4584. doi:10.1002/jgrc.20336
RBR (2017). Introducing Generation3. Available at: https://rbr-global.com/2017/introducing-generation%C2%B3
Roger, J., Pelletier, B., and Aucan, J. (2019). Update of the Tsunami Catalogue of New Caledonia Using a Decision Table Based on Seismic Data and Marigraphic Records. Nat. Hazards Earth Syst. Sci. 19 (7), 1471–1483. doi:10.5194/nhess-19-1471-2019
Rougerie, F., and Rancher, J. (1994). The Polynesian South Ocean: Features and Circulation. Mar. Pollut. Bull. 29, 14–25. doi:10.1016/0025-326X(94)90421-9
Salaree, A., Howe, B. M., Huang, Y., Weinstein, S., and Sakya, A. E. (2021). A Numerical Study of SMART Cables Potential in marine hazard Early Warning for the Sumatra and Java Regions. Pure Appl. Geophys. (submitted). doi:10.31223/X59K7Q
Salaree, A., and Okal, E. A. (2018). The “Tsunami Earthquake” of 13 April 1923 in Northern Kamchatka: Seismological and Hydrodynamic Investigations. Pure Appl. Geophys. 175 (4), 1257–1285. doi:10.1007/s00024-017-1721-9
Sasagawa, G., and Zumberge, M. A. (2013). A Self-Calibrating Pressure Recorder for Detecting Seafloor Height Change. IEEE J. Oceanic Eng. 38, 447–454. doi:10.1109/joe.2012.2233312
Schaad, T. (2009). Nano-Resolution: Oceanic, Atmospheric and Seismic Sensors with Parts-Per-Billion Resolution. Paroscientific, Inc. Technical Note Doc. No. G8218 Rev. F. Available at: http://paroscientific.com/pdf/G8218_Nano-Resolution.pdf
Send, U., and Lankhorst, M. (2011). The Global Component of the US Ocean Observatories Initiative and the Global OceanSITES Project. OCEANS’11 MTS/IEEE Kona. Red Hook, NY: Curran Associates. doi:10.23919/OCEANS.2011.6106959
Shinohara, M., Kanazawa, T., Yamada, T., Machida, Y., Shinbo, T., and Sakai, S. i. (2014). New Compact Ocean Bottom Cabled Seismometer System Deployed in the Japan Sea. Mar. Geophys. Res. 35, 231–242. doi:10.1007/s11001-013-9197-1
Shinohara, M., Yamada, T., Uehira, K., Sakai, S. i., Shiobara, H., and Kanazawa, T. (2021). Development and Operation of an Ocean Bottom Cable Seismic and Tsunami (OBCST) Observation System in the Source Region of the Tohoku‐oki Earthquake. Earth Space Sci. 8, e2020EA001359. doi:10.1029/2020EA001359
Smeed, D. A., Josey, S. A., Beaulieu, C., Johns, W. E., Moat, B. I., Frajka‐Williams, E., et al. (2018). The north Atlantic Ocean Is in a State of Reduced Overturning. Geophys. Res. Lett. 45, 1527–1533. doi:10.1002/2017gl076350
Spinrad, R. (2016). The New Blue Economy: a Vast Oceanic Frontier. EOS Trans. Am. Geophys. Union. 97, 1. doi:10.1029/2016EO053793
Strollo, A., Cambaz, D., Clinton, J., Danecek, P., Evangelidis, C. P., Marmureanu, A., et al. (2021). EIDA: The European Integrated Data Archive and Service Infrastructure Within ORFEUS. Seismol. Res. Lett. 92 (3), 1788–1795. doi:10.1785/0220200413
Suetsugu, D., Shiobara, H., Sugioka, H., Ito, A., Isse, T., Kasaya, T., et al. (2012). TIARES Project-Tomographic Investigation by Seafloor Array experiment for the Society Hotspot. Earth Planet. Spspace. 64, i–iv. doi:10.5047/eps.201.11.002
Suetsugu, D., Sugioka, H., Isse, T., Fukao, Y., Shiobara, H., Kanazawa, T., et al. (2005). Probing South Pacific Mantle Plumes with Ocean Bottom Seismographs. Eos Trans. AGU. 86, 429–435. doi:10.1029/2005eo440001
Talley, L. D., Feely, R. A., Sloyan, B. M., Wanninkhof, R., Baringer, M. O., Bullister, J. L., et al. (2016). Changes in Ocean Heat, Carbon Content, and Ventilation: a Review of the First Decade of GO-SHIP Global Repeat Hydrography. Annu. Rev. Mar. Sci. 8, 185–215. doi:10.1146/annurev-marine-052915-100829
Talling, P., de Silva Jacinto, R., Baker, M., Pope, E., Heijnen, M., Hage, S., et al. (2020). First Direct Monitoring and Time-Lapse Mapping Starts to Reveal How a Large Submarine Fan Works. EGU Gen. Assembly. 2020, EGU2020–2407. doi:10.5194/egusphere-egu2020-2407
Tappin, D. R., Grilli, S. T., Harris, J. C., Geller, R. J., Masterlark, T., Kirby, J. T., et al. (2014). Did a Submarine Landslide Contribute to the 2011 Tohoku Tsunami? Mar. Geology. 357, 344–361. doi:10.1016/j.margeo.2014.09.043
Telegeography (2021). Available at: https://www2.telegeography.com/submarine-cable-faqs-frequently-asked-questions
Thiele, T., Alleng, G., Biermann, A., Corwin, E., Crooks, S., Fieldhouse, P., et al. (2020). Blue Infrastructure Finance: A New Approach, Integrating Nature-Based Solutions for Coastal Resilience. Gland, Switzerland: IUCN
Thiele, T., and Gerber, L. R. (2017). Innovative Financing for the High Seas. Aquat. Conserv: Mar. Freshw. Ecosyst. 27 (S1), 89–99. doi:10.1002/aqc.2794
Tonini, R., Armigliato, A., Pagnoni, G., Zaniboni, F., and Tinti, S. (2011). Tsunami Hazard for the City of Catania, Eastern Sicily, Italy, Assessed by Means of Worst-Case Credible Tsunami Scenario Analysis (WCTSA). Nat. Hazards Earth Syst. Sci. 11 (5), 1217–1232. doi:10.5194/nhess-11-1217-2011
Tunnicliffe, V. J., Barnes, C. R., and Dewey, R. (2008). Major Advances in Cabled Ocean Observatories (VENUS and NEPTUNE Canada) in Shallow and Deep Sea Settings. US/EU-Baltic International Symposium. Tallinn: IEEE/OES. Estonia. 7p
United Nations World Risk Report (2016). Available at: http://collections.unu.edu/view/UNU:5763#viewAttachments.
Wallace, L. M., Townend, J., Stevens, C., Kellett, R. L., De Spuza, J., Giorli, G., et al. (2021). Chatham Islands Cabled Observatory Science Opportunities: Workshop 23-24 February 2021, Summary Report. Lower Hutt (NZ). GNS Sci., 70. doi:10.21420/K1BM-RP28
Wallace, L. M., Webb, S. C., Ito, Y., Mochizuki, K., Hino, R., Henrys, S., et al. (2016). Slow Slip Near the Trench at the Hikurangi Subduction Zone, New Zealand. Science. 352, 701–704. doi:10.1126/science.aaf2349
Wang, D., Becker, N. C., Walsh, D., Fryer, G. J., Weinstein, S. A., McCreery, C. S., et al. (2012). Real-time Forecasting of the April 11, 2012 Sumatra Tsunami. Geophys. Res. Lett. 39, a–n. doi:10.1029/2012GL053081
Webb, S. C. (1998). Broadband Seismology and Noise under the Ocean. Rev. Geophys. 36 (1), 105–142. doi:10.1029/97RG02287
Webb, S. C. (2008). The Earth’s Hum: the Excitation of Earth normal Modes by Ocean Waves. Geophys. J. Int. 174 (2), 542–566. doi:10.1111/j.1365-246X.2008.03801.x
Weller, R. A., Baker, D. J., Glackin, M. M., Roberts, S. J., Schmitt, R. W., Twigg, E. S., et al. (2019). The Challenge of Sustaining Ocean Observations. Front. Mar. Sci. 6, 105. doi:10.3389/fmars.2019.00105
Wilcock, W. S. D., Manalang, D. A., Fredrickson, E. K., Harrington, M. J., Cram, G., Tilley, J., et al. (2021). A Thirty-Month Seafloor Test of the A-0-A Method for Calibrating Pressure Gauges. Front. Earth Sci. 8 (653), 600671. doi:10.3389/feart.2020.600671
Winkler, J. R. (2008). Nexus: Strategic Communications and American Security in World War I. Cambridge, MA: Harvard University Press. ISBN 0-674-02839-2.
World Ocean Initiative (2020). A Sustainable Ocean Economy in 2030: Opportunities and Challenges. The Economist Group Limited. Available at: http://www.woi.economist.com/sustainable-ocean-economy-2030
Worthington, E. L., Frajka‐Williams, E., and McCarthy, G. D. (2019). Estimating the Deep Overturning Transport Variability at 26°N Using Bottom Pressure Recorders. J. Geophys. Res. Oceans. 124, 335–348. doi:10.1029/2018JC014221
Xtera (2016). Line Monitoring and Control in Subsea Networks. Available at: https://xtera.com/wp-content/uploads/2017/05/White-Paper-Line-Monitoring-and-Control-in-Subsea-Networks-Xtera-August-2016.pdf
Keywords: SMART subsea cables, ocean observing, global geophysics, seismology, earthquake and tsunami early warning, environmental disaster risk reduction, submarine telecommunications cables, UN joint task force
Citation: Howe BM, Angove M, Aucan J, Barnes CR, Barros JS, Bayliff N, Becker NC, Carrilho F, Fouch MJ, Fry B, Jamelot A, Janiszewski H, Kong LSL, Lentz S, Luther DS, Marinaro G, Matias LM, Rowe CA, Sakya AE, Salaree A, Thiele T, Tilmann FJ, von Hillebrandt-Andrade C, Wallace L, Weinstein S and Wilcock W (2022) SMART Subsea Cables for Observing the Earth and Ocean, Mitigating Environmental Hazards, and Supporting the Blue Economy. Front. Earth Sci. 9:775544. doi: 10.3389/feart.2021.775544
Received: 14 September 2021; Accepted: 30 December 2021;
Published: 07 February 2022.
Edited by:
Mourad Bezzeghoud, Universidade de Évora, PortugalReviewed by:
Ahmed Reda, Curtin University, AustraliaMairi M. R. Best, Consultant, Sudbury, ON, Canada
Copyright © 2022 Howe, Angove, Aucan, Barnes, Barros, Bayliff, Becker, Carrilho, Fouch, Fry, Jamelot, Janiszewski, Kong, Lentz, Luther, Marinaro, Matias, Rowe, Sakya, Salaree, Thiele, Tilmann, von Hillebrandt-Andrade, Wallace, Weinstein and Wilcock. This is an open-access article distributed under the terms of the Creative Commons Attribution License (CC BY). The use, distribution or reproduction in other forums is permitted, provided the original author(s) and the copyright owner(s) are credited and that the original publication in this journal is cited, in accordance with accepted academic practice. No use, distribution or reproduction is permitted which does not comply with these terms.
*Correspondence: Bruce M. Howe, bhowe@hawaii.edu