Microstructural Mapping of Arctica islandica Shells Reveals Environmental and Physiological Controls on Biomineral Size
 Nils Höche
 Eric O. Walliser1,2
 - 1Institute of Geosciences, University of Mainz, Mainz, Germany
- 2Museum Wiesbaden, Hessisches Landesmuseum für Kunst und Natur, Wiesbaden, Germany
The shells of long-lived bivalves record environmental variability in their geochemical signatures and are thus used extensively in marine high-resolution paleoclimate studies. To possibly overcome the limitations of the commonly employed temperature proxy, the δ18Oshell value, which requires knowledge of the seawater δ18O signature and is prone to diagenetic overprint, the shell microstructures and the morphological properties of individual biomineral units (BMUs) recently attracted research interest as an alternative paleoclimate proxy. In shells of A. islandica, one of the most extensively used and best studied sclerochronological archives, the size of the BMUs increases in warmer temperatures under laboratory circumstances. This study assesses whether this relationship persists under natural growth conditions or whether additional environmental and physiological factors control the BMU size and bias temperature reconstructions. For this purpose, shells from the surface waters of NE Iceland and the Baltic Sea, as well as from deeper waters of the North Sea (100 and 243 m) were analyzed by means of SEM. The BMU sizes were measured by means of image processing software. Results demonstrate a strong effect of temperature on the BMU size at NE Iceland and in the North Sea at 100 m depth. At 243 m depth, however, temperature variability was likely too low (1.2°C) to evoke a microstructural change. At the Baltic Sea, the BMUs remained small, possibly due to physiological stress induced by low salinity and/or hypoxia. Thus, the size of BMUs of A. islandica shells only serves as a relative temperature indicator in fully marine habitats, as long as seasonal temperature amplitudes exceed ca. 1°C. Furthermore, BMU size varied through lifetime with the largest units occurring during age seven to nine. This pattern is possibly linked to the shell growth rate or to the amount of metabolic energy invested in shell growth.
Introduction
Bivalve shells are increasingly used to reconstruct past environmental conditions in aquatic settings with unprecedented temporal resolution (Reynolds et al., 2013; Walliser et al., 2016; de Winter et al., 2021). Such data are of great value to constrain climate models (Schmidt et al., 2014; Cauquoin et al., 2019; Asami et al., 2020). Environmental variations can be recorded by the stable oxygen isotope data (δ18Oshell; Weidman et al., 1994; Peharda et al., 2019; Reynolds et al., 2019), shell growth patterns (Kennish and Olsson, 1974; Witbaard, 1996; Wanamaker et al., 2009) and certain trace elements (Krause-Nehring et al., 2012; Schöne et al., 2013; Füllenbach et al., 2015). As more recently suggested, the microstructural properties of the shells can potentially serve as a proxy for environmental changes as well, specifically the size and shape of individual biomineral units (BMUs), the building blocks of the shell microstructure (Olson et al., 2012; Gilbert et al., 2017; Milano et al., 2017b). In contrast to geochemical properties which are sensitive to diagenetic processes (Cochran et al., 2010; Ritter et al., 2017), the shell microstructure may “survive” slight diagenetic alternations (Brand and Morrison, 1987; Knoll et al., 2016) and still provide useful environmental proxy data as long as no recrystallization occurred. Furthermore, temperature reconstructions based on the shell microstructure might be less affected by other environmental factors than conventional proxies, such as the δ18Oshell, which require knowledge of the δ18Owater signature or salinity. Microstructural properties of the long-lived Arctica islandica have gained particular interest (Milano et al., 2017a; Höche et al., 2021a), because this bivalve species not only forms distinct annual shell growth patterns, but also attains a lifespan of several hundred years (Thompson et al., 1980a; Schöne et al., 2005b; Wanamaker et al., 2008; Butler et al., 2013) and has a broad biogeographic distribution in the northern North Atlantic (Dahlgren et al., 2000; Schöne, 2013), prerequisites for long-term and high-resolution paleoclimate reconstructions in a climatologically highly relevant part of the global ocean.
According to recent laboratory experiments the size of BMUs of A. islandica shells correlates with the water temperature (Höche et al., 2021a). However, it remains unclear whether the same relationship exists in naturally grown individuals permitting temperature reconstructions from microstructural properties. Although food availability and pCO2 have demonstrably no effect on the shell microstructure (Hiebenthal et al., 2013; Stemmer et al., 2013; Milano et al., 2017a; Ballesta-Artero et al., 2018), other environmental factors could potentially bias or overprint the temperature signal recorded by the shell microstructure by affecting physiological processes responsible for biomineralization. In addition, it is unknown whether the morphology of the individual building blocks of the shells, i.e., shape, size and orientation of the biomineral units vary with ontogeny or shell growth rate. Finally, the different shell portions of A. islandica consist of different microstructure types, with the BMUs of each type shaped differently. Crossed-acicular (CA) microstructures have disordered, partially rounded, partially acute BMUs, while growth lines come with irregular simple prisms (ISP; Figure 1). In contrast, homogeneous microstructures consist of ordered, rounded BMUs, whereas fine complex crossed-lamellar (FCCL) microstructures are made of acute, elongated, bidirectionally oriented BMUs (Figure 1). These microstructures, however, are termed differently by different authors and their morphologies have never been quantitatively analyzed and compared to each other. Addressing these questions requires comprehensive, quantitative microstructural data from specimens belonging to different age classes collected from different habitats.
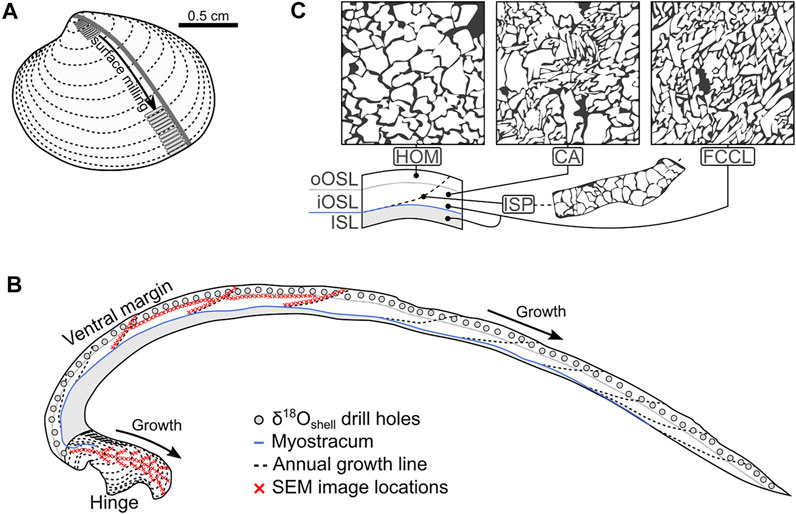
FIGURE 1. Sketch of Arctica islandica showing shell preparation, sampling strategy for stable oxygen isotope and SEM analysis, and microstructure. (A) Two slabs were cut from the valves along the axis of maximum growth (gray line). (B) Polished side of a shell slab; Shell powder samples were obtained by surface milling [gray swaths, (A)], or by drilling in cross-sections [gray holes, (B)]. The shell microstructure was studied under the SEM in the hinge plate and in the ventral shell portion (in the outer shell layer, OSL). To assess spatial variation of BMU size within each of the respective shell portions, image transects were generated along contemporaneously formed regions in the OSL (following annual growth lines) and in transects away from the maximum growth axis of the hinge plate [(B), specimen ICE06-6.2-A6R]. (C) Sketches showing the homogeneous (HOM), crossed-acicular (CA) and fine complex crossed-lamellar (FCCL) microstructures, and where they are present within the ventral margin of the shell. oOSL: outer portion of the OSL; iOSL: Inner portion of the OSL; ISL: Inner shell layer.
Here, we investigate the microstructure of A. islandica shells collected from different coastal and deeper water settings of the NE Atlantic. Some specimens were exposed to strong seasonal and inter-annual variations of temperature and food availability (Northeast Iceland and Baltic Sea), whereas others lived in calmer subsurface waters of the North Sea (Norwegian Trench and East Viking Bank). The size and shape of the BMUs were investigated in scanning electron microscopy (SEM) images by means of machine learning-based image processing software. The present study focuses on the microstructure of the hinge plate, where a temperature influence was previously identified in laboratory-grown specimens. For comparison with data from the hinge portion, the microstructure of the outer shell layer of the ventral margin was also studied. The data were temporally aligned and shell growth rates reconstructed via shell growth pattern and stable oxygen isotope analysis according to established methods (Jones, 1980; Schöne et al., 2005c; Vihtakari et al., 2016). The microstructural data of each locality were compared with environmental and physiological data (growth rate, ontogenetic age) to determine possible controls on the shell microstructure and to assess how confident BMU-based environmental reconstructions can be.
Material and Methods
The studied material comprises nine A. islandica shells collected alive from four localities across Northern Europe (Figure 2A; Table 1). Three shells were collected in 2006 at a water depth of 6.6 m at Þistillfjörður, NE’ Iceland (Marali and Schöne, 2015). Temperature data for this site were available from in situ measurements at Grímsey station (ca. 125 km NWW’ the sampling site; Hanna et al., 2006) and remotely sensed chlorophyll a concentration data (used as a reference for food availability) were acquired from OceanColour (in 1 km distance to the sampling site; Sathyendranath et al., 2019). Three of the studied shells were collected at 24.8 m water depth in the Mecklenburg Bight, Baltic Sea (Schöne et al., 2021), an episodically hypoxic, stratified, eutrophic and polluted environment (Kremling et al., 1997; Karlson et al., 2002; Leipe et al., 2005; Conley et al., 2011; Hansson and Gustafsson, 2011; Carstensen et al., 2014). Here, temperature and chlorophyll a data were acquired from in situ measurements at marine station TF0012 operated by the Leibniz Institute for Baltic Sea Research Warnemünde (https://odin2.io-warnemuende.de/; accessed 14 Jul 2021). Furthermore, two specimens from the Viking Bank, collected at 92 and 100 m water depth (Ehrich, 2007), and one specimen from the Norwegian Trench (243 m depth, 1904) were studied. For these localities, remotely sensed monthly mean temperature data from the World Ocean Atlas (Boyer et al., 2020) were used, with data points (i.e., grid cell centers) located approx 33 and 55.5 km away from the Viking Bank and Norwegian Trench, respectively. Depth-resolved monthly mean chlorophyll a data were acquired from EMODnet chemistry (Norwegian Marine Data Centre, 2019), located 3.2 and 5.7 km away from the Viking Bank and Norwegian Trench, respectively. Differences in depth between the sampling sites and grid cell centers of the remotely sensed data were smaller than 7 m in all cases. From the sub-monthly temperature and chlorophyll a data of Iceland and the Baltic Sea, monthly means and standard deviations were calculated to allow comparisons with the Viking Bank and the Norwegian Trench, where such high-resolution data were not available (Figures 2B,C; Supplementary Data Sheet 1).
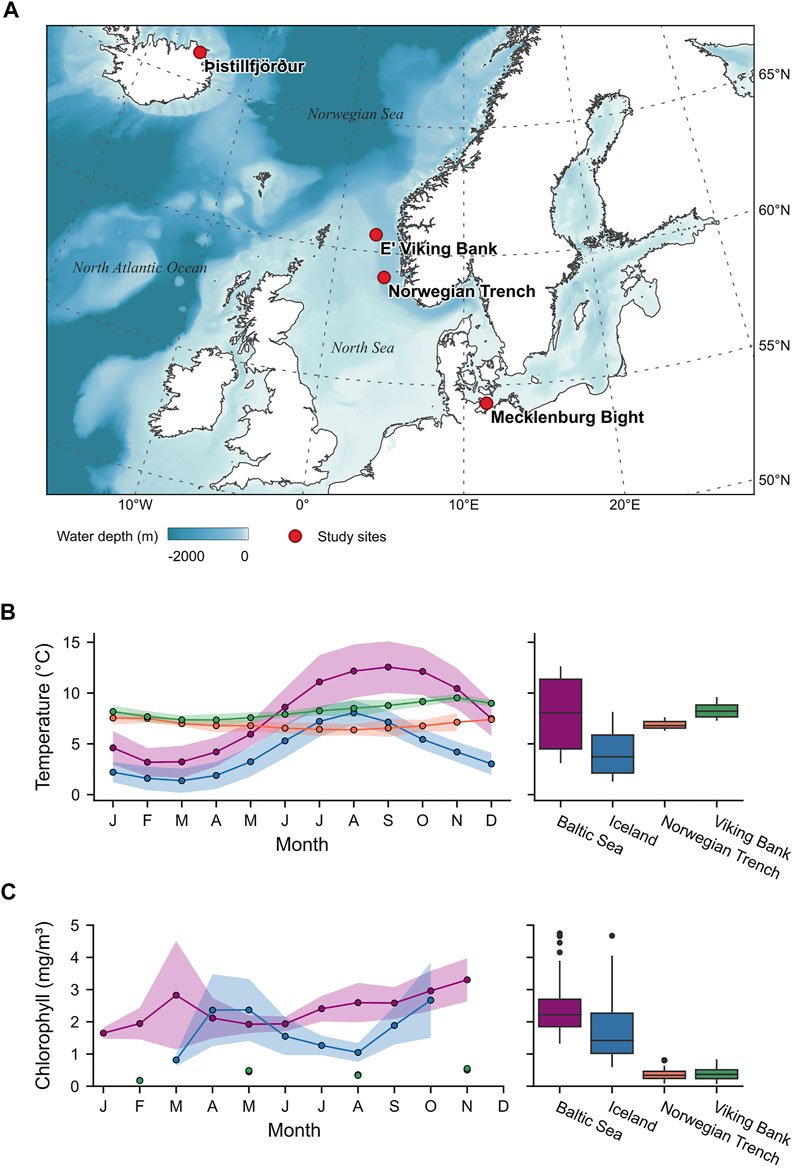
FIGURE 2. Shell (Arctica islandica) collection sites, temperature, and chlorophyll a data. (A) Map of Northern Europe showing the four shell collection sites of this study. Continent contours were taken from NaturalEarth (https://www.naturalearthdata.com/; last access 6 Jul 2021) and bathymetric data were acquired from EMODNet (http://www.emodnet-bathymetry.eu; last access 6 Jul 2021). Note that depths greater than 2000 m are displayed in the same color. (B) Water temperatures and (C) chlorophyll a concentrations shown as monthly averages (left side; solid line: mean; shaded area: ± one standard deviation) and annual ranges (right side) for each of the localities.
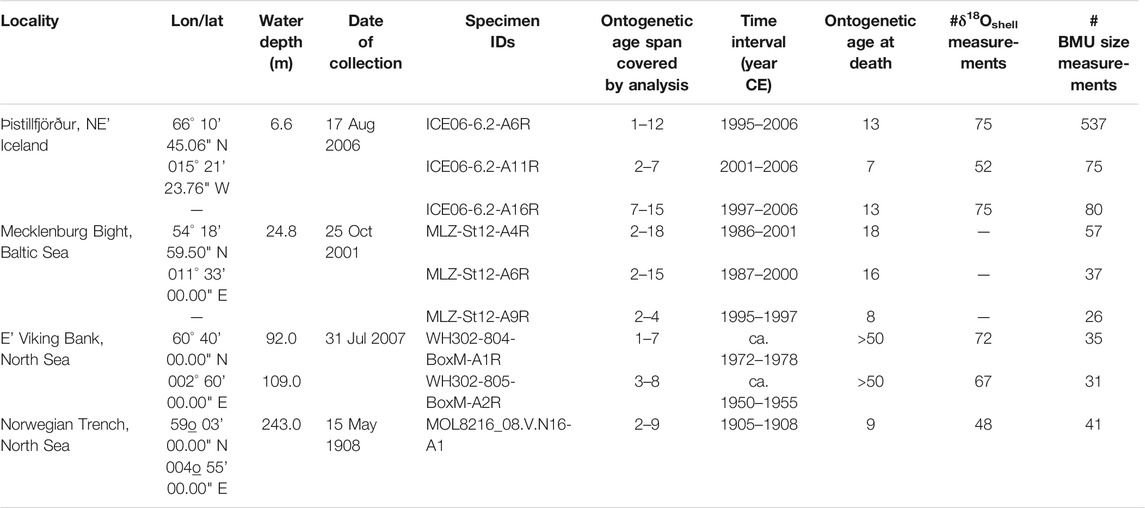
TABLE 1. Overview of the studied Arctica islandica shells.
Shell Preparation
From one valve of each shell, two 3 mm-thick slabs were cut out along the axis of maximum growth (Figure 1A). For this purpose, the valves were glued to acrylic glass cubes using WIKO Multi Power 3 plastic welder and covered along the cutting axis with a protective layer of WIKO 05 metal epoxy resin. After air-curing, specimens were cut with a low-speed rotational saw (Buehler IsoMet 1000) equipped with a diamond-coated wafering thin blade (0.4 mm thickness; Buehler 15LC 11-4255) operated at 200 rpm. The shell slabs were manually ground on glass plates using F800 and F1200 SiC suspensions and subsequently polished with 1 µm Al2O3 on a Buehler MasterTex polishing cloth. After each preparation step, specimens were ultrasonically rinsed with tap water for 6 min. One of the slabs was affixed to a glass slide for growth pattern and stable oxygen isotope analysis, whereas the other slab was attached to a one-inch SEM sample holder with carbon stickers for microstructure analysis (Figure 2B; Supplementary Figure S1).
Determination of Timing and Rate of Shell Formation
Bivalves grow their shells periodically, leading to the deposition of growth increments and lines (Clark, 1974; Clark, 1975). As in most other bivalves, prominent growth lines are formed annually in A. islandica (Thompson et al., 1980a; Ropes et al., 1984; Karney et al., 2011). Growth line formation occurs ca. four weeks after the annual temperature maximum (Thompson et al., 1980a; Jones, 1980; Schöne et al., 2005b). The annual lines can therefore be used to determine the ontogenetic age of the animal and to place the shell record in temporal context. In order to analyze the growth patterns, shells were immersed in Mutvei’s solution (12.5% Glutaraldehyde, 0.5% acetic acid, and 5 g/L alcian blue) and kept at 38°C for 8 min under constant stirring, which stained and fixated the shell organics while gently etching the shell carbonate (Schöne et al., 2005a). After rinsing and air-drying, shells were imaged in sectoral (= one-quarter) dark-field illumination under a Leica Stemi 508 stereomicroscope equipped with a Canon EOS 600D DSLR camera. All sclerochonological measurements (i.e., distances between the annual growth lines, δ18Oshell sampling spots and SEM images) were performed with the image processing software ImageJ (Schneider et al., 2012; Rueden et al., 2017).
Since most of the studied specimens lacked clearly defined subannual growth patterns, the δ18Oshell method was used to place the shell record in temporal context. For this purpose, the paleothermometry equation by (Grossman and Ku, 1986) with the −0.27‰ PDB-SMOW scale correction (Gonfiantini et al., 1995) (Eq. 1) was solved for δ18Oshell (Eq. 2). Then, a predicted seasonal δ18Oshell (model) profile was computed for each locality based on the corresponding instrumental temperature (Figure 2B) and δ18Owater data taken from (LeGrande and Schmidt, 2006) using Eq. 2. Measured δ18Oshell data were aligned to best fit the predicted seasonal δ18Oshell(model) profiles. This way, a precise calendar date could be assigned to each sample. Finally, these data were linearly interpolated to reconstruct the daily growth rate. In case of the Baltic Sea shells, an existing seasonal shell growth model was used (Schöne et al., 2021).
To measure the stable oxygen isotope composition of the shells, carbonate powder samples of ca. 60 µg were taken along the axis of maximum growth using a micro drill (Rexim Minimo KM11G) firmly attached to a binocular microscope equipped with a conical SiC drill bit (300 µm diameter at tip; Gebr. Brasseler GmbH and Co. KG, model no. H52.104.003). For most specimens, sampling was accomplished on the surface of the polished shell slabs, but in case of the thin shells from deeper settings, approx. 100 µm broad swaths were milled on the surface of the valves (surface milling; Figure 1A). Carbonate powders were dissolved in He-flushed borosilicate exetainers at 72°C by adding 99.9% phosphoric acid and the released CO2 gas was measured in continuous flow mode with a ThermoFisher MAT 253 isotope ratio mass spectrometer in coupled to a GasBench II. Stable isotope values were calibrated against an in-house Carrara marble standard (δ18O [V-PDB] = −1.91%) and are given relative to the V-PDB standard. Oxygen isotope values were not corrected for differences in acid fractionation factors between the calcite (Carrara marble) and aragonite (shell), because the source equation for Eq. 1 + Eq. 2, i.e., the paleothermometry equation by Grossman & Ku (1986) is based on uncorrected δ18O values (see Füllenbach et al., 2015, for more details). Measurement accuracy based on blindly measured reference materials of known isotopic composition (NBS-19) was better than 0.04‰.
Scanning Electron Microscopy
Since the contrast between shell carbonate and finely distributed intercrystalline organics in backscatter SEM is insufficient to analyze individual BMUs, they need to be revealed prior to morphometric analysis. This is typically accomplished by slight etching of the BMUs and/or removal of the intercrystalline organic matrices, e.g., by immersion of the shells in weak acids, bleach or hydrogen peroxide (Crippa et al., 2016). This treatment, however, evokes a violent reaction (Lavkulich and Wiens, 1970), alters the original BMU shape (Höche et al., 2021a) and sometimes affects different materials of the shell heterogeneously. To overcome these problems, an ultrafine chemo-mechanical polishing step was instead employed in this study: shell slabs were polished for 10 minutes on a rotational lap (Buehler MetaServ 2000) at 50 rpm using a Buehler MasterTex polishing cloth and Buehler MasterMet polishing suspension. With a grain size of 60 nm, the colloidal silica particles of this suspension were small enough to mechanically erode the finely distributed organic phases, while its alkaline pH of ca. 10.1 aided in the gentle chemical removal of the organics. The resulting shell slab surface was polished very evenly and intercrystalline organics were removed thoroughly while keeping abrasion of the carbonate phase at a minimum (Figures 3A,B).
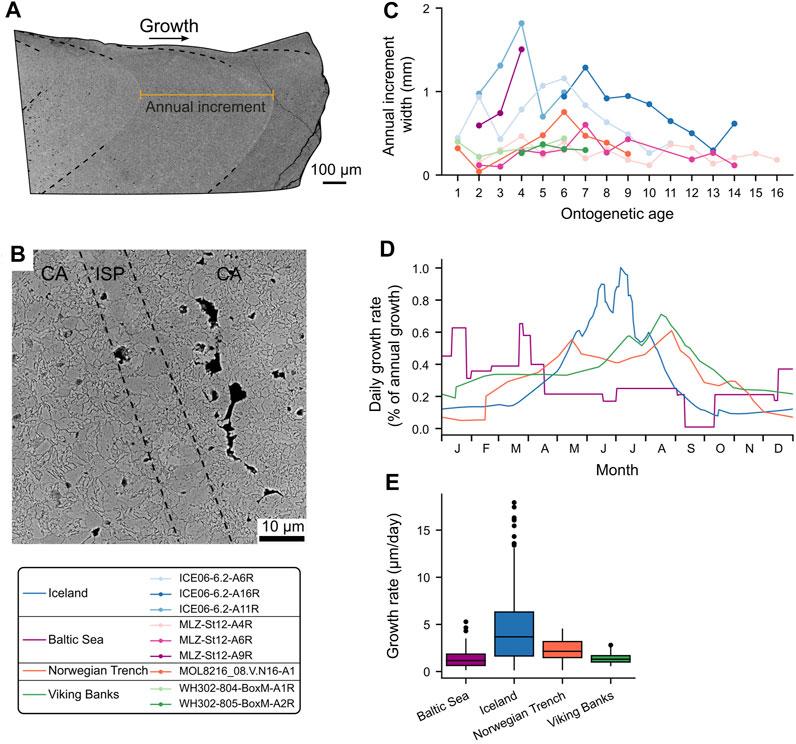
FIGURE 3. Hinge plate of Arctica islandica. (A) Overview of a hinge plate showing the growth direction, annual growth lines (dashed lines) and annual increment (orange). (B) Magnified annual growth line (SEM) showing the typical irregular simple prismatic (ISP) microstructure and the decrease in BMU size in the following crossed-acicular (CA) microstructures. Direction of growth is from lower left to upper right. (C) Annual growth increment curves of the studied specimens. (D) Seasonal growth models (daily resolution) for the studied sites based on the δ18Oshell alignment technique (Supplementary Table S1). Model for the Baltic Sea was obtained from Schöne et al. (2021). (E) Daily shell growth rates of A. islandica at the different study localities.
As a previous study revealed a statistically significant relationship between the BMU size in the hinge plate of laboratory grown specimens and temperature (Höche et al., 2021a), the same shell portions were investigated here (953 images; Table 1). For comparison of BMU data in different contemporaneous portions of the shell, the outer shell layer (OSL) of the ventral margin was also studied (241 images; Table 1). Most images were taken in transects along the maximum growth axis to assess microstructural variation through time (Figure 1B; Supplementary Figure S1). Additionally, images were taken along contemporaneously formed shell portions in the OSL of the ventral margin and in the hinge plate (in specimen ICE06-6.2-A6R) to assess the spatial variability of BMU sizes and to test the reproducibility of the BMU proxy method (Figure 1B).
Images used in BMU morphometry were generated with a Phenom Pro Desktop SEM (3rd generation) equipped with a CeB6 electron source and backscatter electron detectors at 7700x magnification and 10 keV. The images were subsequently processed with the machine-learning based image segmentation program Ilastik (Berg et al., 2019), which classifies each individual BMU as a unique shade of gray based on a prior training of the software. In a set of exemplary input images (randomly selected among the images of this study to cover a wide range of microstructural textures), labels were painted over the pixels to classify them as either BMU or intercrystalline space. Based on the characteristics (i.e., intensity, texture, contour sharpness) of these manually classified regions, the probability of being a BMU (pBMU) was calculated for each remaining pixel. Individual BMUs were then detected in these probability maps by applying a two-step probability threshold (Canny, 1986; Condurache and Aach, 2005). Connected pixels with pBMU > 0.95 were considered as the cores of individual BMUs and were assigned with a unique gray value. These areas were then expanded outward to include neighboring pixels of pBMU > 0.5. This two-step hysteresis thresholding process allows for effective separation of adjoining BMUs, which would otherwise be considered as one entity. The segmented images were inspected visually, and all invalid results (= severe over- or under-splitting of the BMUs) arising from poor image quality due to sample drift or charging effects were discarded (217 of 1194 images). Finally, the size of each BMU in each correctly segmented image was automatically measured and its elongation estimated by fitting an ellipse using the programming language python and image processing library scikit-image (van der Walt et al., 2014). The scripts and classifier used in this study are available online (Höche et al., 2021b) and can be reused in future studies to batch process SEM images acquired under the same settings for BMU morphometry.
Statistical Processing of the Microstructural Data
The BMU raw data comprise one entry for every BMU of each of the 1194 images, marking the need for data reduction techniques. Since previous studies revealed significant heterogeneity among BMU size values and determined a temperature relationship predominantly for the largest BMUs (Höche et al., 2021a), the same statistical measures were used herein. Of each image, the fifteen largest BMUs were selected and means and standard deviations were calculated for their size and elongation. The shell portion, microstructure type, ontogenetic age, and relative position within the annual growth increment corresponding to each image (i.e., BMU data point) were recorded.
To assess relationships between environmental, physiological and BMU morphological parameters at each locality, Pearson correlations (r) and corresponding significance values (p; significance threshold α = 0.05) were computed. In addition, linear models between the BMU size and the environmental and physiological parameters were computed via least squares regression. Trends in BMU size through lifetime of the bivalves were estimated by locally weighted scatterplot smoothing (Cleveland, 1979) using a window size of one-third of the data to represent long-term developments and 2 years of data for the seasonal trends. All calculations were performed using python and the modules SciPy (Virtanen et al., 2020) and statsmodels (Seabold and Perktold, 2010).
Results
Shell Formation: Timing, Rate and Microstructure
Based on annual increment counts, the studied shell portions of the specimens formed before the age of seventeen (Table 1). In the hinge plate, annual increment widths ranged from 0.03 to 1.81 mm and were broadest at around age four to seven (Figure 3C). According to the δ18Oshell-alignment (Supplementary Table S1), studied bivalves formed annual growth lines a few weeks after the annual temperature maximum. Among the specimens from one locality, the timing and rate of shell growth were highly synchronized (Supplementary Table S1), whereas they varied considerably between sampling sites (Figures 3C,E). The Icelandic shells mainly grew from October until late August of the following year and attained maximum growth rates during spring and summer. In contrast, shells from the Viking Bank grew between February and December, with growth rate maxima during late August. The specimen from the Norwegian Trench grew its shell from April to February of the following year, with the fastest shell formation rates during early September (Figure 3D).
The hinge plates were dominated by CA microstructure (occurring in 92.7% of the images). Annual growth lines were easily identified, because they consisted of ISP microstructure (Figures 1C, 3B). In the CA microstructures following an annual line, much smaller BMUs were formed (Figure 3B). These CA microstructures were occasionally replaced by FCCL. FCCL microstructures were also found in the most lateral regions of the hinge plate, i.e., in slower growing portions far away from the main growth axis. FCCL microstructures became more abundant with increasing age. Shells from the Baltic Sea consisted of a larger proportion of FCCL microstructures than those from the other localities (30.5% of images vs. 1.7% of images, respectively). Here, FCCL microstructures were not only found near the annual growth lines, but also in disturbance lines which frequently occurred during summer months.
The ventral margin of the shells was divided into an inner (ISL) and outer layer (OSL) separated by the myostracum (Figure 1B). The outermost portion of the OSL consisted of homogeneous microstructures, which gradually transitioned into CA and FCCL microstructures towards the myostracum. Inner shell layers consisted of FCCL microstructures. Like the hinge plate, annual growth lines of the outer shell layer of the ventral margin consisted of ISP microstructures. These ISP microstructures were most defined in the outer portion of the OSL, whereas they gradually disappeared toward the inner portion of the OSL (iOSL) close to the myostracum.
Size of the Biomineral Units
The size of the BMUs differed distinctly between study localities (Figure 4). Except for the Norwegian Trench and the Baltic Sea, this difference was statistically significant (p < 0.05). Specimens from Iceland formed the largest BMUs (9.44 ± 5.39 µm2), followed by those from the Baltic Sea (6.46 ± 2.80 µm2), while the BMUs were smallest in the deeper environments (Norwegian Trench 5.33 ± 2.51 µm2 and Viking Bank 3.72 ± 1.47 µm2). BMU size data were also heteroscedastic, i.e., size variance increased in portions with larger BMUs. In both the hinge plate and ventral margin, BMUs of FCCL microstructures were significantly smaller (4.9 ± 2.3 µm2) than those of the CA microstructure (8.7 ± 5.1 µm2) and also more elongated (2.41 ± 0.41 in FCCL and 1.97 ± 0.24 in CA; Figure 4B).
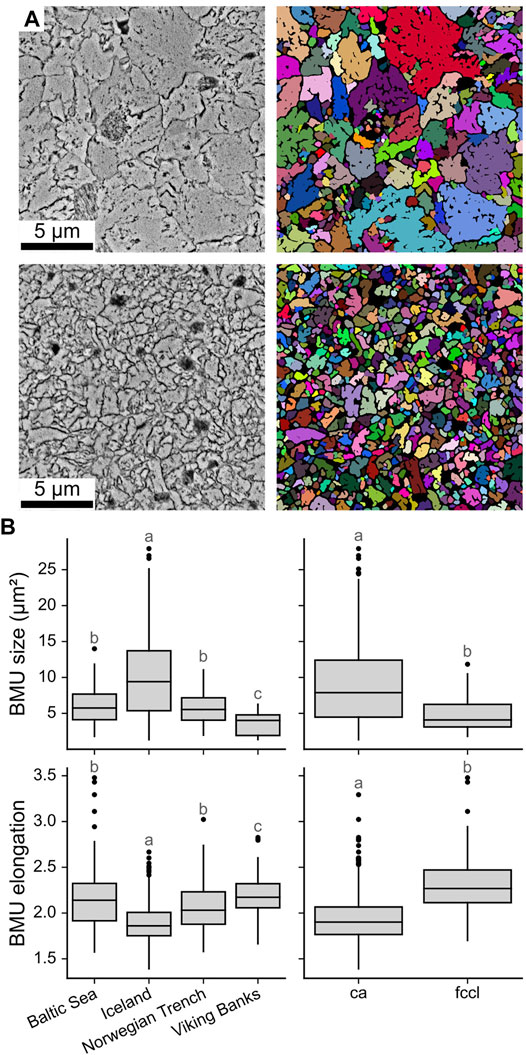
FIGURE 4. SEM image segmentation and BMU morphology data of Arctica islandica. (A) Two shell regions (left) with large and small BMUs, respectively, and their corresponding segmentations (right). For visualization purpose, individual BMUs are displayed in individual colors, whereas the intra- and intercrystalline space is represented in black. (B) Average size and elongation of the 15 largest BMUs of each image of the hinge plates as boxplots for each locality (left) and microstructure type (right). Statistically significantly different groups (p < 0.05) are marked with different letters.
Along the axis of maximum growth in the hinge plate, BMU sizes first increased and then decreased with ontogenetic age (Figure 5). In all shells, BMUs reached their maximum size during age seven to nine. At large, BMU sizes of the hinge plate correlated with the annual growth rate. The broadest annual increments, however, occurred a few years earlier than the largest BMUs, i.e., between age four to seven (Figure 3A). Furthermore, all shells, except those from the Baltic Sea, exhibited seasonal BMU size patterns (Figure 5). This was most evident in the Icelandic shells: BMUs were smallest at the beginning of each growing season, shortly after the annual growth line. Thereafter, BMU size gradually increased, reaching a maximum at around 70–90% of the annual growth increment and decreased toward the following annual line (Figure 5). This intra-annual BMU size trend was not limited to the axis of maximum growth, but was likewise observed in transects away from that axis (Figure 6). Specimens from the Viking Bank showed the same pattern as those from Iceland, yet with a smaller amplitude. The shell from the Norwegian Trench, in contrast, formed the largest BMUs about half way through the annual increments. In Baltic Sea specimens, BMU size variation was poorly synchronized among individuals and did not show a clear pattern over the course of each year. Note that 52 images of the shells from this locality had to be discarded because of problems during image segmentation (arising from highly irregular geometries of the interstitial spaces surrounding the BMUs), which obscured some portions of the shell growth records.
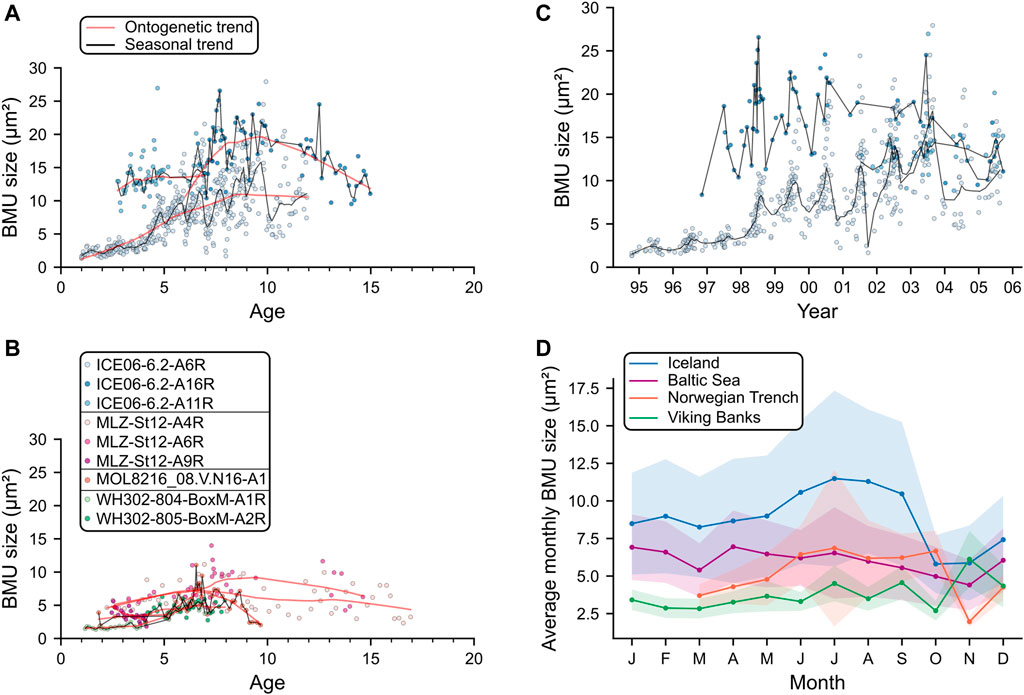
FIGURE 5. Temporal BMU size trends of the hinge plates of Arctica islandica. Ontogenetic BMU size curves for studied specimens from Iceland (A) and the remaining localities (B). At all localities, BMU size exhibited a parabolic trend over the lifetime of the animal (red lines), attaining maximum values at age seven to nine. In addition to this ontogenetic trend, all shells except those from the Baltic Sea exhibited seasonal variation of BMU size (black lines). (C) BMU data of the Icelandic specimens against calendar time. (D) Average monthly BMU sizes of each locality. Trend lines were calculated by locally weighted scatter plot smoothing (Cleveland, 1979) using a window size of one-third of the data for the long-term curves and 2 years of data for the seasonal curves.
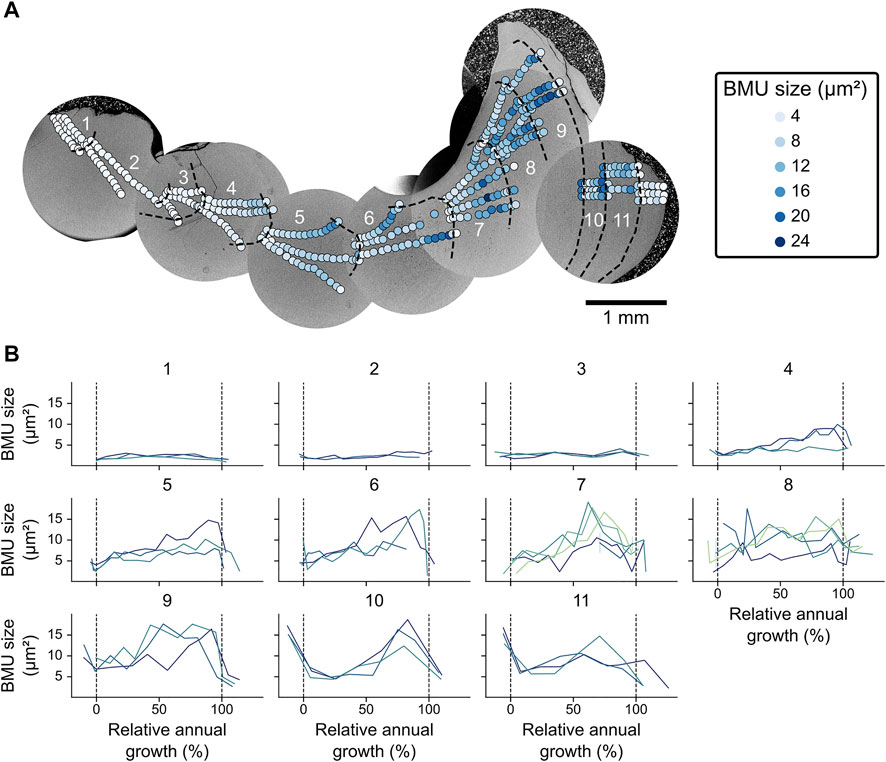
FIGURE 6. Spatial BMU size variability in the hinge plate of Arctica islandica specimen ICE06-6.2-A6R. (A) The BMU size varies strongly across and within the annual growth increments (labeled 1 through 11), but is largely similar in contemporaneously formed portions of the same annual increment. (B) Within each annual increment, the BMU sizes of different transects agree well with each other and show a sinusoidal pattern from age four onward. Merely increment seven and eight exhibited weaker correlation and less prominent seasonal patterns.
In the ventral margin, the size of BMUs of the iOSL was nearly identical to those formed contemporaneously in the hinge plate (Figure 7A). Hinge plate and iOSL also exhibited similar seasonal BMU size patterns. The only exception was observed in specimens from the Norwegian Trench, in which BMUs of the iOSL attained largest sizes at the beginning of the growing season. BMUs had a distinct size pattern from the outer shell surface to the myostracum (Figure 7B). Relative to the average size of all BMUs in a vertical transect, values were smallest in the outermost homogeneous microstructures of the oOSL (z ≈ −1; Eq. 3), but abruptly increased in size near the transition zone to the CA microstructures of the iOSL (to z of up to 3). Toward the myostracum, the BMU sizes decreased slightly (to z ≈ 0) throughout the CA portion of the iOSL until at the transition to FCCL microstructures, a sharp size peak was developed (z of up to 3). Close to the myostracum, the BMUs of the FCCL microstructures remained at a moderate size (z ≈ 0). The BMUs of CA microstructures were most variable in size, whereas FCCL BMUs had little size variation.
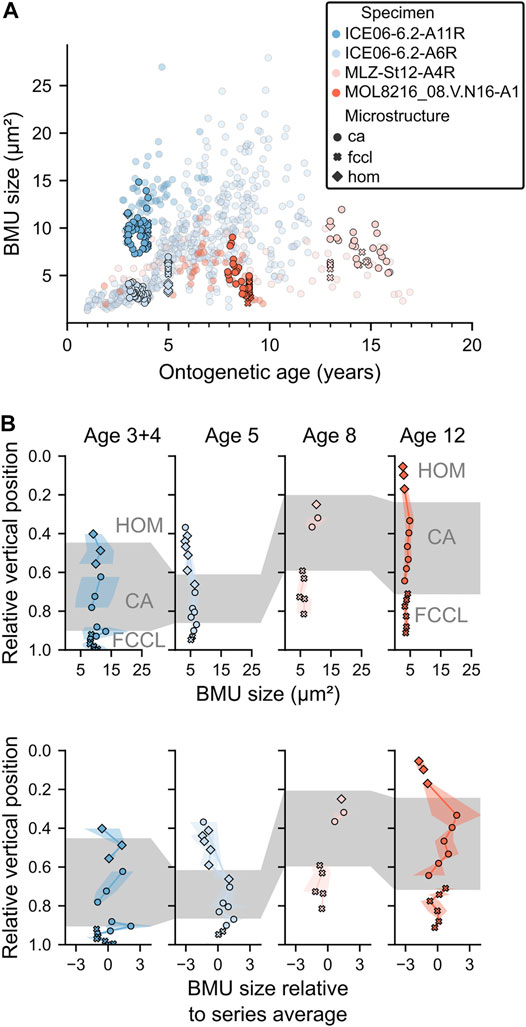
FIGURE 7. BMU sizes in the ventral margin of Arctica islandica shells. (A) BMUs of the ventral margin (solid colors) and the hinge plate (transparent) were almost identically sized and showed the same size patterns over time. (B) BMU sizes in vertical transects through the outer shell layer (OSL) as absolute and relative values. From the outer shell surface toward the myostracum (i.e., 1.0 relative vertical position; x-axis), BMUs were smallest in the homogeneous (HOM) microstructures of the outer portion of the OSL, attained maximum sizes and largest size variances in the crossed-acicular (CA) microstructures of the inner portion of the OSL, and decreased again toward average sizes in the FCCL microstructure near the myostracum.
The BMU morphology was only weakly correlated with the physiological and environmental parameters and did not reveal a common pattern for the studied localities. BMU sizes were weakly, but significantly positively correlated to water temperature at NE Iceland and the Viking Bank (Pearson r = 0.24 and 0.30, respectively; p ≤ 0.5; Figures 8A,E). The opposite, a significant negative correlation, was observed in specimens from the Baltic Sea (r = −0.31; p = 0.05). Linear regression models for BMU size and temperature, revealed similar slopes for Iceland and the Viking Bank (0.52 and 0.66 µm2/°C) but their intercept differed (7.32 versus −1.76°C; Figure 8A). Chlorophyll a concentration and the BMU size were weakly positively correlated at the Viking Bank and Norwegian Trench (r = 0.21 and 0.32), but only the latter was statistically significant. In the specimens from the Baltic Sea and Iceland, in contrast, BMU size was significantly (negatively) correlated to the chlorophyll a concentration (r = −0.19 and 0.31; p < 0.05; Figures 8B,E). Except for some specimens from the Baltic Sea, BMU size and shell growth (i.e., the annual increment widths and the reconstructed seasonal growth rates) was consistently positively correlated (Figures 8C–E). Note, that BMU sizes in specimens from low-seasonality environments (Norwegian Trench, Viking Bank) were stronger correlated to the annual increment width than those of the environments with high seasonality (Iceland, Baltic Sea).
FIGURE 8. Correlation analysis between Arctica islandica hinge plate BMU sizes, shell growth rates, and environmental records. BMU size plotted against (A) average monthly temperature, (B) average monthly chlorophyll a concentration (C) annual increment width and (D) reconstructed daily growth rate at each study locality. Shaded areas represent the density of individual data points, and lines represent linear models. Model parameters are annotated in the plots. (E) Pearson correlation matrices of BMU size (S) and elongation (EL), environmental variables and shell growth parameters for each locality. DGR: daily growth rate; AIW: annual increment width; T: temperature; CHL: chlorophyll a.
Discussion
The BMU size range differed among sampling sites, with the largest BMUs occurring at NE Iceland and smallest at the Norwegian Trench (Figure 4B). However, these differences in BMU size cannot be easily explained by environmental variables such as temperature and diet (Figures 4B, 8A). Firstly, correlations with environmental variables differed greatly among sites (Figure 8). Secondly, microstructural data revealed a common ontogenetic trend in the BMU size (Figure 5). Irrespective of environmental conditions, the largest BMUs were formed between age seven and nine. These BMU size patterns are examined more closely in the following in order to distinguish between environmental and biological processes which may have evoked them.
Environmental Effects on the Shell Microstructure
At Iceland and the Viking Bank, BMU size covaried with the water temperature (Figures 8A,E). As in other bivalve microstructures (Olson et al., 2012; Gilbert et al., 2017; Milano et al., 2017b), larger BMUs were formed in warmer waters, i.e., seasonal BMU size maxima coincided with the seasonal temperature maxima (Figures 2B, 5D). Moreover, seasonal BMU size amplitudes were larger at NE Iceland than at the Viking Bank, likely owing to the greater seasonal temperature range (Figure 2B). At both localities, the temperature sensitivity of BMU size was similar (+0.52 and +0.66 µm2/°C, respectively), and agreed well to findings of previous laboratory experiments using the same bivalve species (+0.50 µm2 /°C; Höche et al., 2021a). All this argues for a causal link between BMU size and temperature, which functions analogously to abiogenic systems, where rising temperature also leads to increased grain size of the precipitated carbonate (Mejri et al., 2014). In the Icelandic specimens, differences in BMU size between individuals of the same age could be explained by temperature differences. For example, specimen ICE06-6.2-A11R formed, during age three to five (corresponding to 2001-2003), BMUs on average 8.8 µm2 larger than specimen ICE06-6.2-A6R at the same age (corresponding to 1997-1999, Figures 5A,C), because temperatures were on average 1.1°C warmer (5.34 and 4.19°C, respectively; Supplementary Material). However, based on the previously determined relationship, this temperature difference would only account for ca. 0.6 µm2 of the observed 8.8 µm2. The intercepts of linear models between BMU size and temperature also differed strongly between specimens and sites (Figure 8A). Furthermore, though statistically significant (p < 0.05), temperature was only weakly correlated to BMU size (r = 0.28–0.29; Figure 8E) suggesting that other environmental and/or biological factors controlled the BMU sizes. In conclusion, BMU size in naturally grown specimens of A. islandica can only serve as a proxy for relative temperature changes.
In contrast to NE Iceland and the Viking Bank, the BMU size of the shell from the Norwegian Trench was negatively correlated to the water temperature, whereas BMU data of shells from the Baltic Sea showed no significant link with temperature (Figure 8A). In case of the Norwegian Trench (243 m depth), this may partly be explained by the lack of high-resolution temperature data, i.e., only monthly average values were available. For comparison, at NE Iceland, the BMU size correlated stronger to the daily temperature data than to the monthly averages (r of 0.29 versus 0.21; r2 of 0.09 versus 0.04). However, at the Viking Bank (100 m depth), BMU size was significantly linked with temperature even though monthly average water data were used. Hence, at the Norwegian Trench and the Baltic Sea, temperature effects on the shell microstructure were minor, and other, unknown factors played a larger role.
In the specimen from the Norwegian Trench, observed negative correlations between BMU size and water temperature were likely spurious, because seasonal minima or maxima of BMU size did not coincide with those of temperature (Figures 2B, 5D). A causal link also seems unlikely because all results published to date indicate the formation of larger BMUs at higher temperatures, rather than the opposite (Milano et al., 2017b; Gilbert et al., 2017). Perhaps, seasonal temperature variability at the Norwegian Trench (∼1.2°C; Figure 2B) was insufficient to produce a seasonal BMU size pattern. However, in specimens from the Viking Bank, seasonal fluctuation of BMU sizes was clearly related to the seasonal temperature oscillation of approx. ±2.2°C. Taken together, this could imply that temperature changes smaller than 1.2–2.2°C may not visibly affect the shell microstructure of A. islandica.
Instead of temperature, dietary conditions could have controlled BMU size, because at the Norwegian Trench, BMU size was weakly positively correlated to the chlorophyll a concentration (r = 0.32, r2 = 0.04; Figure 8). For a variety of reasons, however, food availability was challenging to assess at the study sites. Firstly, as a deposit feeder, A. islandica can rely on various food sources (Winter, 1970; Cargnelli, 1999; Morton, 2011). Thus, a range of different indicators, such as nutritional value of various primary producers in the water, particulate organic matter content, and hydrogeography, should ideally be used to assess food availability. These data, however, are not widely available, so that chlorophyll a concentration was used in this study. Secondly, chlorophyll a concentration does not always represent a good estimation of algal biomass (Kruskopf and Flynn, 2006). And lastly, in situ chlorophyll a data were only available for the Baltic Sea, whereas less precise, remotely sensed satellite data were used for all other localities. For example, satellite data are likely less suitable to characterize the dietary conditions at the Viking Bank (100 m depth) and Norwegian Trench (243 m depth), which are both located well below the photic zone. Chlorophyll a data for NE Iceland were also less reliable, because satellite data are challenging in these optically highly complex coastal surface waters (IOCCG, 2000; Chen et al., 2013; Gholizadeh et al., 2016). Accordingly, quality and resolution of the chlorophyll a data were not sufficient to assess seasonal and interannual variations in food availability. Thus, positive correlations between BMU size and chlorophyll a at the Norwegian Trench and Viking Bank should be interpreted with care. Furthermore, at other localities, e.g., NE Iceland, the BMU sizes were negatively correlated to the chlorophyll a concentration (Figure 8B). A link between food supply and BMU size thus seems highly unlikely, as has also been confirmed by recent laboratory experiments (Milano et al., 2017a; Ballesta-Artero et al., 2018). At most, the deeper water of the Norwegian Trench could represent a special case in which the BMU size is more strongly linked to food availability than in surface waters. This scenario is supported by the fact that seasonal BMU size maxima occurred during autumn at this locality (Figure 5D), the time at which the seasonal thermocline destabilizes and food items are transported to the bottom water (Pohlmann, 1996; Meyer et al., 2011; Rovelli et al., 2016).
Bivalves from the Baltic Sea, however, likewise did not show a significant correlation between BMU size and temperature (Figure 8A) despite warm waters and highly variable temperatures (Figure 2B). However, as demonstrated in laboratory experiments, under normal marine conditions, BMUs of A. islandica shells are larger in warmer waters (Höche et al., 2021a). Perhaps, the BMU size of specimens from the Baltic Sea is still weakly linked to temperature, but effects were overruled by those of other environmental stressors unique to this locality and absent under controlled conditions. These stressors could be low and variable salinity (Supplementary Material), episodic oxygen depletion and eutrophication (Gray et al., 2002; Karlson et al., 2002), high pCO2 (acidification) or pollution (Kremling et al., 1997). pCO2 was shown to leave the shell microstructure of A. islandica largely unaltered (Hiebenthal et al., 2013; Stemmer et al., 2013). Effects of the remaining environmental aspects on the microstructure are poorly studied. At dump sites polluted by trace metals, mortality of A. islandica increases (Kapp, 1980), and juveniles do not settle (Liehr et al., 2005). Polluted sediments thus appear to be unfavorable for this species (Leipe et al., 2005) and may negatively affect its biomineralization processes resulting in smaller BMUs. While A. islandica can survive low-oxygen conditions to some extent (Theede et al., 1969; Philipp et al., 2012), metabolic rates and ventilation rates decline substantially below dissolved oxygen (DO) concentrations of 5 mg/L (Taylor and Brand, 1975a; 1975b). During hypoxia (i.e., DO < 2 mg/L), respiration becomes anaerobic, so that body functions almost come to a complete halt (Oeschger, 1990; Strahl et al., 2011). The extrapallial fluid becomes increasingly acidified (Oeschger, 1990; Strahl et al., 2011), so that biomineralization stops. Since at the Baltic Sea, DO concentrations occasionally fell below 5 mg/L, but rarely below 2 mg/L (Supplementary Data Sheet 1), smaller BMUs may have been formed due to restricted body functions. Low and variable salinity likewise decreases shell growth rate (Hiebenthal et al., 2012) and shortens longevity (Begum et al., 2010). Hence, in the Baltic Sea, smaller BMUs may have been formed due to the low and variable salinity (approx. 19.2), when compared to that of all other studied localities (approx. 34.4; Supplementary Data Sheet 1). Even if the ultimate cause of the reduced BMU size at the Baltic Sea cannot be identified here, the smaller BMUs are likely the result of physiological stress.
To summarize, at Iceland and the Viking Bank, the BMU size was affected by changes in water temperature. The temperature sensitivity of BMU size was comparable among these localities (0.5–0.62 µm2 /°C), suggesting that BMU-based temperature reconstructions can be completed in fully marine, unpolluted settings. The correlation between BMU size and temperature, however, was weak (Pearson r = 0.21–0.26 with monthly averages; 0.29 with daily temperature data) and did not occur at the other studied sites. In the deeper waters of the Norwegian Trench, temperature variability (approx. 1.2°C) was likely too low to evoke significant microstructural changes, whereas at the Baltic Sea, temperature effects were probably overruled by environmental stressors such as the low and variable salinity and/or reduced dissolved oxygen content. BMU size ranges of individuals from the different sites did not reflect the temperature regimes in which they lived. This suggests, that BMU size is not solely controlled by temperature.
Physiological Processes Affecting BMU Size
At all localities except the Baltic Sea, a weak positive link existed between BMU size and annual growth rate (Figures 8C,D). BMU size ranges of specimens from the respective localities reflected shell growth rate ranges (Figures 3E, 4B). Moreover, in the hinge plate, BMU size and shell growth rate varied non-linearly through lifetime (Figures 3C, 5A,B). At first sight, this argues for a coupling between the shell growth rate and the BMU size. However, the following observations speak against this hypothesis. Firstly, the broadest annual increments were formed two to 4 years before the largest BMUs were produced (Figure 9A). Secondly and more importantly, BMU sizes in the hinge plate were nearly the same as in the ventral margin (Figure 7A), even though the latter grew about five times as fast (Höche et al., 2021b). Irrespective of whether a direct or an indirect link exists, BMU size was evidently influenced by the physiology of the bivalve.
FIGURE 9. Interpretation of the coupling between the BMU size of A. islandica shells and early shifts in their metabolism. (A) Sketch of BMU size and shell growth rate patterns over lifetime observed in this study. Both parameters first increased then decreased over lifetime, with their maxima offset by two to 4 years. The levels of BMU size and shell growth rate as well as the amplitude of their changes over lifetime were increased by warmer temperature, whereas stressful environmental conditions led to a decrease. (B) Sketch of energetic developments during the early life stage of A. islandica, after Abele et al. (2008) and Begum et al. (2010). Somatic production (i.e., growth of shell and soft tissue) are prioritized at young age, causing the patterns seen in A. After reaching a sufficient size to escape predation, shell growth slows down because the metabolism prioritizes maturation and reproduction. For further explanations see text.
Perhaps, BMU size and shell growth are regulated by the same underlying biological processes, so that both parameters develop similar patterns over lifetime (Figures 3C, 5A,B) and are coupled to the same environmental variables (Figure 8E). This hypothesis seems reasonable because both BMU size and shell growth are related to biomineralization performance. Bivalve biomineralization is controlled at many levels by the cellular activity of the organism, be it in production and secretion of the organic matrices, in the uptake and transport of carbonate precursor ions (i.e., Ca2+ and HCO3−), or in the establishment of the chemical boundary conditions necessary for mineralization (Wilbur and Saleuddin, 1983; Marin et al., 2012). Organic components, calcium ions and carbonate ions can be acquired via food uptake or filtration (Wilbur and Saleuddin, 1983; Marin et al., 2012), so that the supply of shell material is bound to the feeding and respiration activity of the bivalve as well as its assimilation efficiency (Winter, 1978). Furthermore, HCO3− ions can be hydrated from metabolized CO2 (Marin et al., 2012), so that HCO3− supply is coupled to the metabolic rate. Metabolic energy also supports transmembrane Ca2⁺-ATPase-pumps, which are required to transport Ca2⁺ ions (Carré et al., 2006) and to extrude them into the extrapallial fluid in order to reach supersaturation (Marin et al., 2012; Stemmer et al., 2019). Similar ATP-ase pumps are also involved in the removal of H⁺ from the calcification site for pH regulation (Marin et al., 2012; Stemmer et al., 2019). Since the bivalve metabolism supports these processes, improved metabolic rate ultimately results in accelerated shell growth and, perhaps, larger BMUs. This hypothesis seems plausible because numerous other proxy systems of biogenic carbonates are also influenced by metabolism. For example, it has been suggested that metabolism controls the Sr/Ca ratios and carbon stable isotope composition of aragonitic bivalve shells (Purton et al., 1999; Gillikin et al., 2005, 2007), including A. islandica (Schöne et al., 2011; Wanamaker and Gillikin, 2019).
The increase of BMU size and shell growth rate during youth can be explained by changes in metabolic rate, as the latter increases with body mass following a power law (respiration = a × mass3/4; Figure 9B; Kleiber, 1932; da Silva et al., 2006; Ballesteros et al., 2018). With increasing ontogenetic age, a larger amount of energy becomes available that could support the formation of larger BMUs and faster shell growth. However, BMU size and shell growth rate decrease after the age of ca. four to nine (Figures 3C, 5A,B), whereas metabolic rates of A. islandica do not seem to decline before the age of 100 (Begum et al., 2009; Basova et al., 2012). Moreover, while it was observed that Mytilus edulis down-regulate mitochondrial respiration, ATP production and pH regulation after ca. age five to six (Sukhotin and Pörtner, 2001; Sukhotin et al., 2020), this is likely not the case in A. islandica (Begum et al., 2009). Decreases in BMU size and shell growth rate after age four and seven are thus not simply caused by a decrease in metabolic energy. Instead, according to dynamic energy budget models, during lifetime, A. islandica increasingly shifts its metabolic energy expenditure from shell production toward reproduction (Figure 9B; Abele et al., 2008; Begum et al., 2010). Accordingly, ontogenetic patterns in BMU size and shell growth rate can reflect the amount of metabolic energy available for shell production, which reaches peak values during early stages of life (Begum et al., 2010; Ballesta-Artero et al., 2018).
BMU size trends during the first ca. 20 years of life can thus correspond to the changing amount of energy available for shell growth. However, even if a direct link does not exist, an understanding of the early physiological developments of A. islandica, upon which the aforementioned metabolic budgets were based (Begum et al., 2010), can help to predict and detrend the ‘ontogenetic bias’ of the BMU sizes. Just after settlement of the larvae, metabolism and shell growth occur only at slow rate due to the small body size of the individuals (Figure 9). However, during this early stage of life, shell growth also accelerates most rapidly, because it receives the largest proportion of the increasing metabolic power in order to improve individual survival chances (Kooijman and Kooijman, 2010; Ballesta-Artero et al., 2019). Accordingly, the shell of young A. islandica grows faster than its soft body (Murawski et al., 1982). Shell growth rate reaches a maximum already at around age four (Figure 9). BMU sizes increase concurrently with the metabolic rate and shell growth rate, but formation of the largest BMUs is delayed by two to 3 years. Perhaps, larger BMUs can only form after the first few years of life, when lateral gshell growth rates exceed a certain threshold. Once the shells are large enough to escape predation, shell growth becomes less important and metabolic priority shifts toward soft body growth and maturation (Figure 9B; Kooijman and Kooijman, 2010). Accordingly, the maximum somatic production activity is attained after the formation of the largest BMUs. After maturation, shell growth reaches the negative asymptotic stage (Philipp and Abele, 2010) because the majority of available metabolic energy is now directed toward reproduction (Begum et al., 2010; Kooijman and Kooijman, 2010; Ballesta-Artero et al., 2019). However, the onset of sexual maturity varies greatly between localities and among specimens (Thompson et al., 1980b; Cargnelli, 1999; Thorarinsdottir and Steingrimsson, 2000), whereas BMU size maxima were always attained around age seven to nine (Figure 5). Perhaps, not enough shells of each population were studied in order to portray the full temporal variation of the BMU size maxima. Still, ontogenetic BMU size patterns can be assessed relatively precisely by corresponding shell growth rates. Alternatively, the timing of ontogenetic BMU size changes can be assessed by habitat-specific models of metabolic budgets or by estimates of longevity, age of maturation and shell size to escape the predation window.
Differences in BMU size range among individuals of the studied localities can also be explained by regional differences in shell growth and/or metabolic rate. At NE Iceland for example, BMUs were large and variable in size (Figure 4A) and shells grew fast (Figure 3C), due to the relatively warm and variable temperatures (Figure 2B). Accordingly, the total metabolic throughput estimated for A. islandica of this locality is also quite large (approx. 43,700 kJ; Begum et al., 2010), because warmer temperatures increase metabolic performance (Gillooly et al., 2001). On the other hand, BMUs of specimens from the Baltic Sea were small despite substantial temperature variability (Figures 2B, 4B), which can be explained by the negative effects of low and variable salinity and/or DO content on the metabolism of A. islandica (Taylor and Brand, 1975b; Oeschger, 1990; Strahl, 2011; Basova et al., 2012; Hiebenthal et al., 2012), leading to slow shell growth and formation of smaller BMUs. Lower salinity and oxygen levels have also been found to impair metabolism and shell formation processes of other bivalve species (Sobral and Widdows, 1997; Sillanpää et al., 2020), supporting this hypothesis. Accordingly, estimated lifetime metabolic budgets of Baltic Sea populations are much lower than those of fully marine ones (∼300 kJ at Kiel Bay, approx. 70 km NE’ the site of this study; Begum et al., 2010). Mass-specific metabolic rates, filtration rates, and oxygen consumption rates, in contrast, are all enhanced under physiological stress (Taylor and Brand, 1975b; Basova et al., 2012). However, most of the excess metabolic energy is used for coping with stress and reproduction to ensure population survival (Begum et al., 2010), so that the amount of energy used for shell formation does not increase and BMUs remain small. Lastly, populations of low longevity show almost no metabolic reaction to warming (Begum et al., 2010; Basova et al., 2012) which could explain why Baltic Sea specimens lack a correlation between BMU size and temperature (Figure 8A).
In summary, BMU size of A. islandica is strongly coupled to its physiology, which complicates temperature reconstructions based on the shell microstructure. Changes in BMU size during the first ca. 20 years of life corresponded to variations in shell growth rate and/or shifts in metabolic activity. This early stage of the shell growth record should thus be excluded in BMU-based proxy reconstructions in order to minimize ontogenetic bias. Suboptimal growth conditions, i.e., low salinity and/or low DO conditions, also prevented the formation of large BMUs, likely because physiological stress exerted a negative control on metabolism and shell growth. Hence, BMU size only serves as a temperature proxy in fully oxygenated, fully marine settings.
BMU Size Across Different Shell Portions and Microstructures
The different microstructure types formed BMUs of distinct size and shape. Under the same environmental conditions and at the same ontogenetic age, BMUs of homogeneous microstructure are comparatively small, FCCL BMUs are moderately sized with little size variation but highly elongated, and CA BMUs are larger and more variable in size and of moderate elongation (Figures 4B, 7B). Within one individual, BMUs of the same microstructure formed at the same time varied only slightly in size, regardless of shell portion (hinge and ventral margin) or position within the shell layer (Figures 6, 7), except for two increments of specimen ICE06-6.2-A6R. If BMU size is indeed coupled to the metabolism, the size heterogeneity within these increments might be caused by variations of metabolic rate in different portions of the mantle. A similar effect exists, for example, in Mytilus edulis, where at lateral margins, trace element incorporation into the shell is more strongly controlled by metabolism than along the ventral margin (Klein et al., 1996). However, only the seventh increment of the hinge plate of ICE06-6.2-A6R was substantially curved (Figure 6A), whereas increment eight was not. Still, BMU sizes of different transects through increment eight correlated poorly, so that variations in shell curvature and associated changes in metabolism cannot explain the BMU size heterogeneity.
Baltic Sea specimens formed FCCL microstructures much more frequently than specimens of the other localities, at which CA was predominantly deposited. Since FCCL BMUs are smaller than those of CA microstructures (Figure 4B), BMU size data of Baltic Sea specimens are generally lower than that of the remaining studied localities. Perhaps, correction factors can be applied to facilitate comparisons of BMU size data of different microstructures. Interestingly, FCCL microstructures were mostly formed after disturbance lines and annual lines, i.e., during times of slow shell growth and reduced biomineralization rate. This aligns with the hypothesis that physiological stress reduces metabolism and leads to the formation of small BMUs. Environmental stressors likely evoked the formation of an entirely different microstructure (FCCL instead of CA), as was previously postulated in other studies (Prezant et al., 1988; Tan Tiu and Prezant, 1989; Dunca et al., 2009).
To summarize, each microstructure type (homogeneous, crossed-acicular and fine complex crossed-lamellar) exhibits a specific BMU size range. In order to use BMU size as a proxy for temperature or other environmental or physiological variables, respective measurements should be completed in microstructurally identical shell portions (e.g., CA in iOSL and hinge plate). Otherwise, corrections may be needed. When selecting shell portions for BMU-based proxy reconstructions, higher temporal resolution can be achieved in the ventral margin than in the hinge plate. However, due to microstructural gradation of the ventral margin of A. islandica, preparation quality varied more strongly and image targeting was more challenging to accomplish than in the hinge plate.
Conclusion
The BMU size of A. islandica shells increased with water temperature at NE Iceland and the Viking Bank. Temperature sensitivity of BMU size was comparably strong at these localities, but the size ranges at the two habitats did not reflect the regional temperature regimes, so that the BMU size may only serve as a proxy for relative temperature changes. Furthermore, in the Norwegian Trench, temperature variability (approx. 1.2°C) was likely too low to trigger significant microstuctural changes, or BMU size was controlled more strongly by changes in food availability. In the Baltic Sea, BMUs did not grow significantly larger in warmer waters, despite strong temperature variation. Most probably, challenging environmental conditions encountered at the Baltic Sea, i.e., reduced and variable salinity and/or oxygen levels, led to significantly reduced biomineralization performance and significantly smaller BMUs. As such, the BMU size might only be used as a temperature proxy at undisturbed, fully marine sites.
Furthermore, the BMU size of all specimens changed similarly with age, with the largest units being formed at around age seven to nine. The ontogenetic changes in BMU size covary with those of the shell growth rate and metabolic energy used for shell production. BMU size patterns during the first ca. 20 years prevent the reconstruction of meaningful temperature information during this stage of life. Perhaps, shell growth rate data or metabolic models can be used to constrain the ontogenetic BMU size bias. Alternatively, temperature estimates without ontogenetic bias and with reasonable error ranges could be obtained if only BMUs from the mature stage of the shell growth record were considered.
This study highlights the value of quantitative microstructural mapping of biogenic carbonates to assess the interplay of environmental conditions and shell formation processes. Resource-efficient SEM imaging and user-friendly machine learning applications were able to enable a wide range of new applications in paleoclimatology and biomineralization research. Still, the development of three-dimensional imaging techniques with sub-µm resolution is desirable to overcome the limitations of two-dimensional SEM analysis.
Data Availability Statement
he original contributions presented in the study are included in the article/Supplementary Material and in Höche et al. (2021b).
Author Contributions
NH: Conceptualization, Data Curation, Formal analysis, Investigation, Methodology, Validation, Visualization, Writing—Original Draft, Writing—Review and Editing. EOW: Formal analysis, Investigation, Supervision, Validation, Writing—Review and Editing. BRS: Conceptualization, Funding acquisition, Investigation, Project administration, Resources, Supervision, Validation, Writing—Original Draft, Writing—Review and Editing.
Funding
This research was funded by a grant from the German Research Foundation (DFG) to BRS (SCHO793/20-1).
Conflict of Interest
The authors declare that the research was conducted in the absence of any commercial or financial relationships that could be construed as a potential conflict of interest.
Publisher’s Note
All claims expressed in this article are solely those of the authors and do not necessarily represent those of their affiliated organizations, or those of the publisher, the editors and the reviewers. Any product that may be evaluated in this article, or claim that may be made by its manufacturer, is not guaranteed or endorsed by the publisher.
Acknowledgments
We are indebted to Ingrid Kröncke and Wolfgang Dreyer for sample collection. Michael Maus is greatly acknowledged for help with stable isotope mass spectrometry. We thank the editor and two reviewers for their time and thoughtful comments.
Supplementary Material
The Supplementary Material for this article can be found online at: https://www.frontiersin.org/articles/10.3389/feart.2021.781305/full#supplementary-material
Supplementary Figure S1 | Detailed sketches of the studied shell material.
Supplementary Table S1 | Stable oxygen isotope data alignment and growth rate reconstruction.
References
Abele, D., Strahl, J., Brey, T., and Philipp, E. E. R. (2008). Imperceptible Senescence: Ageing in the Ocean quahogArctica Islandica. Free Radic. Res. 42, 474–480. doi:10.1080/10715760802108849
Asami, R., Yoshimura, N., Toriyabe, H., Minei, S., Shinjo, R., Hongo, C., et al. (2020). High‐Resolution Evidence for Middle Holocene East Asian Winter and Summer Monsoon Variations: Snapshots of Fossil Coral Records. Geophys. Res. Lett. 47, e2020GL088509. doi:10.1029/2020GL088509
Ballesta-Artero, I., Augustine, S., Witbaard, R., Carroll, M. L., Mette, M. J., Wanamaker Alan, D., et al. (2019). Energetics of the Extremely Long-Living Bivalve Arctica Islandica Based on a Dynamic Energy Budget Model. J. Sea Res. 143, 173–182. doi:10.1016/j.seares.2018.09.016
Ballesta-Artero, I., Zhao, L., Milano, S., Mertz-Kraus, R., Schöne, B. R., van der Meer, J., et al. (2018). Environmental and Biological Factors Influencing Trace Elemental and Microstructural Properties of Arctica Islandica Shells. Sci. Total Environ. 645, 913–923. doi:10.1016/j.scitotenv.2018.07.116
Ballesteros, F. J., Martinez, V. J., Luque, B., Lacasa, L., Valor, E., and Moya, A. (2018). On the Thermodynamic Origin of Metabolic Scaling. Sci. Rep. 8, 1448. doi:10.1038/s41598-018-19853-6
Basova, L., Begum, S., Strahl, J., Sukhotin, A., Brey, T., Philipp, E., et al. (2012). Age-dependent Patterns of Antioxidants in Arctica Islandica from Six Regionally Separate Populations with Different Lifespans. Aquat. Biol. 14, 141–152. doi:10.3354/ab00387
Begum, S., Basova, L., Heilmayer, O., Philipp, E. E. R., Abele, D., and Brey, T. (2010). Growth and Energy Budget Models of the BivalveArctica Islandicaat Six Different Sites in the Northeast Atlantic Realm. J. Shellfish Res. 29, 107–115. doi:10.2983/035.029.0103
Begum, S., Basova, L., Strahl, J., Sukhotin, A., Heilmayer, O., Philipp, E., et al. (2009). A Metabolic Model for the Ocean QuahogArctica Islandica-Effects of Animal Mass and Age, Temperature, Salinity, and Geography on Respiration Rate. J. Shellfish Res. 28, 533–539. doi:10.2983/035.028.0315
Berg, S., Kutra, D., Kroeger, T., Straehle, C. N., Kausler, B. X., Haubold, C., et al. (2019). Ilastik: Interactive Machine Learning for (Bio)image Analysis. Nat. Methods 16, 1226–1232. doi:10.1038/s41592-019-0582-9
Boyer, T. P., Garcia, H. E., Locarnini, R. A., Zweng, M. M., Mishonov, A. V., Reagan, J. R., et al. (2020). World Ocean Atlas 2018: Temperature. Available at: https://accession.nodc.noaa.gov/NCEI-WOA18 (Accessed April 28, 2021).
Brand, U., and Morrison, J. O. (1987). Paleoscene #6. Biogeochemistry of Fossil marine-invertebrates. Geosci. Can. 14, 85–107.
Butler, P. G., Wanamaker, A. D., Scourse, J. D., Richardson, C. A., and Reynolds, D. J. (2013). Variability of marine Climate on the North Icelandic Shelf in a 1357-year Proxy Archive Based on Growth Increments in the Bivalve Arctica Islandica. Palaeogeogr. Palaeoclimatol. Palaeoecol. 373, 141–151. doi:10.1016/j.palaeo.2012.01.016
Canny, J. (1986). A Computational Approach to Edge Detection. IEEE Trans. Pattern Anal. Mach. Intell. PAMI-8, 679–698. doi:10.1109/TPAMI.1986.4767851
Cargnelli, L. M. (1999). Essential Fish Habitat Source Document. Ocean Quahog, Arctica Islandica, Life History and Habitat Characteristics. Woods Hole: U.S. Department of Commerce.
Carré, M., Bentaleb, I., Bruguier, O., Ordinola, E., Barrett, N. T., and Fontugne, M. (2006). Calcification Rate Influence on Trace Element Concentrations in Aragonitic Bivalve Shells: Evidences and Mechanisms. Geochimica et Cosmochimica Acta 70, 4906–4920. doi:10.1016/j.gca.2006.07.019
Carstensen, J., Conley, D. J., Bonsdorff, E., Gustafsson, B. G., Hietanen, S., Janas, U., et al. (2014). Hypoxia in the Baltic Sea: Biogeochemical Cycles, Benthic Fauna, and Management. Ambio 43, 26–36. doi:10.1007/s13280-013-0474-7
Cauquoin, A., Werner, M., and Lohmann, G. (2019). Water Isotopes - Climate Relationships for the Mid-holocene and Preindustrial Period Simulated with an Isotope-Enabled Version of MPI-ESM. Clim. Past 15, 1913–1937. doi:10.5194/cp-15-1913-2019
Chen, J., Zhang, M., Cui, T., and Wen, Z. (2013). A Review of Some Important Technical Problems in Respect of Satellite Remote Sensing of Chlorophyll-A Concentration in Coastal Waters. IEEE J. Sel. Top. Appl. Earth Observations Remote Sensing 6, 2275–2289. doi:10.1109/JSTARS.2013.2242845
Clark, G. R. (1974). Growth Lines in Invertebrate Skeletons. Annu. Rev. Earth Planet. Sci. 2, 77–99. doi:10.1146/annurev.ea.02.050174.000453
Clark, G. R. (1975). “Periodic Growth and Biological Rhythms in Experimentally Grown Bivalves,” in Growth Rhythms and the History of the Earth’s Rotation (John Wiley & Sons), 103–117.
Cleveland, W. S. (1979). Robust Locally Weighted Regression and Smoothing Scatterplots. J. Am. Stat. Assoc. 74, 829–836. doi:10.1080/01621459.1979.10481038
Cochran, J. K., Kallenberg, K., Landman, N. H., Harries, P. J., Weinreb, D., Turekian, K. K., et al. (2010). Effect of Diagenesis on the Sr, O, and C Isotope Composition of Late Cretaceous Mollusks from the Western Interior Seaway of North America. Am. J. Sci. 310, 69–88. doi:10.2475/02.2010.01
Condurache, A., and Aach, T. (2005). “Vessel Segmentation in Angiograms Using Hysteresis Thresholding,” in Proceedings of the Ninth IAPR Conference on Machine Vision Applications (Tsukuba, Japan: citeseerx), 16–18.
Conley, D. J., Carstensen, J., Aigars, J., Axe, P., Bonsdorff, E., Eremina, T., et al. (2011). Hypoxia Is Increasing in the Coastal Zone of the Baltic Sea. Environ. Sci. Technol. 45, 6777–6783. doi:10.1021/es201212r
Crippa, G., Ye, F., Malinverno, C., and Rizzi, A. (2016). Which Is the Best Method to Prepare Invertebrate Shells for SEM Analysis? Testing Different Techniques on Recent and Fossil Brachiopods. Boll Soc. Paleontol. Ital. 55, 111–125. doi:10.4435/BSPI.2016.11
da Silva, J. K. L., Garcia, G. J. M., and Barbosa, L. A. (2006). Allometric Scaling Laws of Metabolism. Phys. Life Rev. 3, 229–261. doi:10.1016/j.plrev.2006.08.001
Dahlgren, T. G., Weinberg, J. R., and Halanych, K. M. (2000). Phylogeography of the Ocean Quahog ( Arctica Islandica ): Influences of Paleoclimate on Genetic Diversity and Species Range. Mar. Biol. 137, 487–495. doi:10.1007/s002270000342
de Winter, N. J., Müller, I. A., Kocken, I. J., Thibault, N., Ullmann, C. V., Farnsworth, A., et al. (2021). Absolute Seasonal Temperature Estimates from Clumped Isotopes in Bivalve Shells Suggest Warm and Variable Greenhouse Climate. Commun. Earth Environ. 2, 121. doi:10.1038/s43247-021-00193-9
Dunca, E., Mutvei, H., Göransson, P., Mörth, C.-M., Schöne, B. R., Whitehouse, M. J., et al. (2009). Using Ocean Quahog (Arctica Islandica) Shells to Reconstruct Palaeoenvironment in Öresund, Kattegat and Skagerrak, Sweden. Int. J. Earth Sci. (Geol Rundsch) 98, 3–17. doi:10.1007/s00531-008-0348-6
Ehrich, S. (2007). Walther Herwig III" Cruise 302. Hamburg, Germany: Bundesforschungsanstalt für Fischerei. Available at: https://fdir.brage.unit.no/fdir-xmlui/handle/11250/2357081 (Accessed March 3, 2021).
Füllenbach, C. S., Schöne, B. R., and Mertz-Kraus, R. (2015). Strontium/lithium Ratio in Aragonitic Shells of Cerastoderma edule (Bivalvia) - A New Potential Temperature Proxy for Brackish Environments. Chem. Geology. 417, 341–355. doi:10.1016/j.chemgeo.2015.10.030
Gholizadeh, M., Melesse, A., and Reddi, L. (2016). A Comprehensive Review on Water Quality Parameters Estimation Using Remote Sensing Techniques. Sensors 16, 1298. doi:10.3390/s16081298
Gilbert, P. U. P. A., Bergmann, K. D., Myers, C. E., Marcus, M. A., DeVol, R. T., Sun, C.-Y., et al. (2017). Nacre Tablet Thickness Records Formation Temperature in Modern and Fossil Shells. Earth Planet. Sci. Lett. 460, 281–292. doi:10.1016/j.epsl.2016.11.012
Gillikin, D. P., Lorrain, A., Meng, L., and Dehairs, F. (2007). A Large Metabolic Carbon Contribution to the δ13C Record in marine Aragonitic Bivalve Shells. Geochimica et Cosmochimica Acta 71, 2936–2946. doi:10.1016/j.gca.2007.04.003
Gillikin, D. P., Lorrain, A., Navez, J., Taylor, J. W., André, L., Keppens, E., et al. (2005). Strong Biological Controls on Sr/Ca Ratios in Aragonitic marine Bivalve Shells. Geochem. Geophys. Geosyst. 6, a–n. doi:10.1029/2004GC000874
Gillooly, J. F., Brown, J. H., West, G. B., Savage, V. M., and Charnov, E. L. (2001). Effects of Size and Temperature on Metabolic Rate. Science 293, 2248–2251. doi:10.1126/science.1061967
Gonfiantini, R., Stichler, W., and Rozanski, K. (1995). Standards and Intercomparison Materials Distributed by the International Atomic Energy Agency for Stable Isotope Measurements (IAEA-TECDOC--825). Vienna, Austria: International Atomic Energy Agency. Available at: http://inis.iaea.org/Search/search.aspx?orig_q=RN:27021328 (Accessed May 25, 2021).
Gray, J., Wu, R., and Or, Y. (2002). Effects of Hypoxia and Organic Enrichment on the Coastal marine Environment. Mar. Ecol. Prog. Ser. 238, 249–279. doi:10.3354/meps238249
Grossman, E. L., and Ku, T.-L. (1986). Oxygen and Carbon Isotope Fractionation in Biogenic Aragonite: Temperature Effects. Chem. Geology. Isotope Geosci. section 59, 59–74. doi:10.1016/0168-9622(86)90057-6
Hanna, E., Jónsson, T., Ólafsson, J., and Valdimarsson, H. (2006). Icelandic Coastal Sea Surface Temperature Records Constructed: Putting the Pulse on Air-Sea-Climate Interactions in the Northern North Atlantic. Part I: Comparison with HadISST1 Open-Ocean Surface Temperatures and Preliminary Analysis of Long-Term Patterns and Anomalies of SSTs Around Iceland. J. Clim. 19, 5652–5666. doi:10.1175/JCLI3933.1
Hansson, D., and Gustafsson, E. (2011). Salinity and Hypoxia in the Baltic Sea since A.D. 1500. J. Geophys. Res. 116, C03027. doi:10.1029/2010JC006676
Hiebenthal, C., Philipp, E., Eisenhauer, A., and Wahl, M. (2012). Interactive Effects of Temperature and Salinity on Shell Formation and General Condition in Baltic Sea Mytilus edulis and Arctica Islandica. Aquat. Biol. 14, 289–298. doi:10.3354/ab00405
Hiebenthal, C., Philipp, E. E. R., Eisenhauer, A., and Wahl, M. (2013). Effects of Seawater pCO2 and Temperature on Shell Growth, Shell Stability, Condition and Cellular Stress of Western Baltic Sea Mytilus edulis (L.) and Arctica Islandica (L.). Mar. Biol. 160, 2073–2087. doi:10.1007/s00227-012-2080-9
Höche, N., Walliser, E. O., de Winter, N. J., Witbaard, R., and Schöne, B. R. (2021a). Temperature-induced Microstructural Changes in Shells of Laboratory-Grown Arctica Islandica (Bivalvia). PLOS ONE 16, e0247968. doi:10.1371/journal.pone.0247968
Höche, N., Walliser, E. O., and Schöne, B. R. (2021b). Data for “Microstructural Mapping of A. Islandica Shells Reveals Environmental and Physiological Controls on Biomineral Size. Front. Earth Sci. doi:10.5281/zenodo.5215465
IOCCG (2000). Remote Sensing of Ocean Colour in Coastal, and Other Optically-Complex, Waters. Dartmouth, NS, Canada: International Ocean Colour Coordinating Group. Available at: https://repository.oceanbestpractices.org/handle/11329/515 (Accessed July 28, 2021).
Jones, D. S. (1980). Annual Cycle of Shell Growth Increment Formation in Two continental Shelf Bivalves and its Paleoecologic Significance. Paleobiology 6, 331–340. doi:10.1017/S0094837300006837
Kapp, R. M. (1980). Distribution of Recent Mortalities of the Ocean Quahog, Arctica Islandica, at Two Middle Atlantic Ocean Dumpsites. Available at: https://www.proquest.com/docview/303023213/citation/3FDAF407FA5A46A2PQ/1 (Accessed August 7, 2021).
Karlson, K., Rosenberg, R., and Bonsdorff, E. (2002). Temporal and Spatial Large-Scale Effects of Eutrophication and Oxygen Deficiency on Benthic Fauna in Scandinavian and Baltic Waters: a Review. Oceanogr Mar. Biol. 40, 427–489. doi:10.1201/9780203180594.ch8
Karney, G. B., Butler, P. G., Scourse, J. D., Richardson, C. A., Lau, K. H., Czernuszka, J. T., et al. (2011). Identification of Growth Increments in the Shell of the Bivalve Mollusc Arctica Islandica Using Backscattered Electron Imaging. J. Microsc. 241, 29–36. doi:10.1111/j.1365-2818.2010.03403.x
Kennish, M. J., and Olsson, R. K. (1975). Effects of thermal Discharges on the Microstructural Growth ofMercenaria mercenaria. Geo 1, 41–64. doi:10.1007/BF02426940
Klein, R. T., Lohmann, K. C., and Thayer, C. W. (1996). And Ratios in Skeletal Calcite of Mytilus trossulus: Covariation with Metabolic Rate, Salinity, and Carbon Isotopic Composition of Seawater. Geochimica et Cosmochimica Acta 60, 4207–4221. doi:10.1016/S0016-7037(96)00232-3
Knoll, K., Landman, N. H., Cochran, J. K., Macleod, K. G., and Sessa, J. A. (2016). Microstructural Preservation and the Effects of Diagenesis on the Carbon and Oxygen Isotope Composition of Late Cretaceous Aragonitic Mollusks from the Gulf Coastal Plain and the Western Interior Seaway. Am. J. Sci. 316, 591–613. doi:10.2475/07.2016.01
Kooijman, B., and Kooijman, S. (2010). Dynamic Energy Budget Theory for Metabolic Organisation. Cambridge University Press.
Krause-Nehring, J., Brey, T., and Thorrold, S. R. (2012). Centennial Records of lead Contamination in Northern Atlantic Bivalves (Arctica Islandica). Mar. Pollut. Bull. 64, 233–240. doi:10.1016/j.marpolbul.2011.11.028
Kremling, K., Tokos, J. J. S., Brügmann, L., and Hansen, H.-P. (1997). Variability of Dissolved and Particulate Trace Metals in the Kiel and Mecklenburg Bights of the Baltic Sea, 1990-1992. Mar. Pollut. Bull. 34, 112–122. doi:10.1016/S0025-326X(96)00060-4
Kruskopf, M., and Flynn, K. J. (2006). Chlorophyll Content and Fluorescence Responses Cannot Be Used to Gauge Reliably Phytoplankton Biomass, Nutrient Status or Growth Rate. New Phytol. 169, 525–536. doi:10.1111/j.1469-8137.2005.01601.x
Lavkulich, L. M., and Wiens, J. H. (1970). Comparison of Organic Matter Destruction by Hydrogen Peroxide and Sodium Hypochlorite and its Effects on Selected Mineral Constituents1. Soil Sci. Soc. Am. J. 34, 755–758. doi:10.2136/sssaj1970.03615995003400050025x
LeGrande, A. N., and Schmidt, G. A. (2006). Global Gridded Data Set of the Oxygen Isotopic Composition in Seawater. Geophys. Res. Lett. 33, L12604. doi:10.1029/2006GL026011
Leipe, T., Kersten, M., Heise, S., Pohl, C., Witt, G., Liehr, G., et al. (2005). Ecotoxicity Assessment of Natural Attenuation Effects at a Historical Dumping Site in the Western Baltic Sea. Mar. Pollut. Bull. 50, 446–459. doi:10.1016/j.marpolbul.2004.11.049
Liehr, G. A., Zettler, M. L., Leipe, T., and Witt, G. (2005). The Ocean Quahog Arctica Islandica L.: a Bioindicator for Contaminated Sediments. Mar. Biol. 147, 671–679. doi:10.1007/s00227-005-1612-y
Marali, S., and Schöne, B. R. (2015). Oceanographic Control on Shell Growth of Arctica Islandica (Bivalvia) in Surface Waters of Northeast Iceland - Implications for Paleoclimate Reconstructions. Palaeogeogr. Palaeoclimatol. Palaeoecol. 420, 138–149. doi:10.1016/j.palaeo.2014.12.016
Marin, F., Le Roy, N., and Marie, B. (2012). The Formation and Mineralization of Mollusk Shell. Front. Biosci. S4, 1099–1125. doi:10.2741/s321
Mejri, W., Korchef, A., Tlili, M., and Ben Amor, M. (2014). Effects of Temperature on Precipitation Kinetics and Microstructure of Calcium Carbonate in the Presence of Magnesium and Sulphate Ions. Desalination Water Treat. 52, 4863–4870. doi:10.1080/19443994.2013.808813
Meyer, E. M. I., Pohlmann, T., and Weisse, R. (2011). Thermodynamic Variability and Change in the North Sea (1948-2007) Derived from a Multidecadal Hindcast. J. Mar. Syst. 86, 35–44. doi:10.1016/j.jmarsys.2011.02.001
Milano, S., Nehrke, G., Wanamaker Jr., A. D., Ballesta-Artero, I., Brey, T., and Schöne, B. R. (2017a). The Effects of Environment on Arctica Islandica Shell Formation and Architecture. Biogeosciences 14, 1577–1591. doi:10.5194/bg-14-1577-2017
Milano, S., Schöne, B. R., and Witbaard, R. (2017b). Changes of Shell Microstructural Characteristics of Cerastoderma edule (Bivalvia) - A Novel Proxy for Water Temperature. Palaeogeogr. Palaeoclimatol. Palaeoecol. 465, 395–406. doi:10.1016/j.palaeo.2015.09.051
Morton, B. (2011). The Biology and Functional Morphology of Arctica Islandica (Bivalvia: Arcticidae) - A Gerontophilic Living Fossil. Mar. Biol. Res. 7, 540–553. doi:10.1080/17451000.2010.535833
Murawski, S. A., Ropes, J. W., and Serchuk, F. M. (1982). Growth of the Ocean Quahog, Arctica Islandica, in the Middle Atlantic Bight. Fish. Bull. 80, 21–34.
Norwegian Marine Data Centre (2019). Combined DIVA 4D 6-year Analysis of Water Body Chlorophyll-A 1983-2016 V2018, 18.
Oeschger, R. (1990). Long-term Anaerobiosis in Sublittoral marine Invertebrates from the Western Baltic Sea: Halicryptus Spinulosus (Priapulida), Astarte Borealis and Arctica Islandica (Bivalvia). Mar. Ecol. Prog. Ser. 59, 133–143. doi:10.3354/meps059133
Olson, I. C., Kozdon, R., Valley, J. W., and Gilbert, P. U. P. A. (2012). Mollusk Shell Nacre Ultrastructure Correlates with Environmental Temperature and Pressure. J. Am. Chem. Soc. 134, 7351–7358. doi:10.1021/ja210808s
Peharda, M., Walliser, E. O., Markulin, K., Purroy, A., Uvanović, H., Janeković, I., et al. (2019). Glycymeris Pilosa (Bivalvia) - A High-Potential Geochemical Archive of the Environmental Variability in the Adriatic Sea. Mar. Environ. Res. 150, 104759. doi:10.1016/j.marenvres.2019.104759
Philipp, E. E. R., and Abele, D. (2010). Masters of Longevity: Lessons from Long-Lived Bivalves - A Mini-Review. Gerontology 56, 55–65. doi:10.1159/000221004
Philipp, E. E. R., Wessels, W., Gruber, H., Strahl, J., Wagner, A. E., Ernst, I. M. A., et al. (2012). Gene Expression and Physiological Changes of Different Populations of the Long-Lived Bivalve Arctica Islandica under Low Oxygen Conditions. PLOS ONE 7, e44621. doi:10.1371/journal.pone.0044621
Pohlmann, T. (1996). Calculating the Development of the thermal Vertical Stratification in the North Sea with a Three-Dimensional Baroclinic Circulation Model. Continental Shelf Res. 16, 163–194. doi:10.1016/0278-4343(95)00018-V
Prezant, R. S., Tiu, A. T., and Chalermwat, K. (1988). Shell Microstructure and Color Changes in Stressed Corbicula Fluminea (Bivalvia: Corbiculidae). The Veliger 31, 236–243.
Purton, L. M. A., Shields, G. A., Brasier, M. D., and Grime, G. W. (1999). Metabolism Controls Sr/Ca Ratios in Fossil Aragonitic Mollusks. Geol 27, 1083–1086. doi:10.1130/0091-7613(1999)027<1083:mcscri>2.3.co;2
Reynolds, D. J., Butler, P. G., Williams, S. M., Scourse, J. D., Richardson, C. A., Wanamaker, A. D., et al. (2013). A Multiproxy Reconstruction of Hebridean (NW Scotland) spring Sea Surface Temperatures between AD 1805 and 2010. Palaeogeogr. Palaeoclimatol. Palaeoecol. 386, 275–285. doi:10.1016/j.palaeo.2013.05.029
Reynolds, D. J., Hall, I. R., and Slater, S. M. (2019). An Integrated Carbon and Oxygen Isotope Approach to Reconstructing Past Environmental Variability in the Northeast Atlantic Ocean. Palaeogeogr. Palaeoclimatol. Palaeoecol. 523, 48–61. doi:10.1016/j.palaeo.2019.03.005
Ritter, A.-C., Mavromatis, V., Dietzel, M., Kwiecien, O., Wiethoff, F., Griesshaber, E., et al. (2017). Exploring the Impact of Diagenesis on (Isotope) Geochemical and Microstructural Alteration Features in Biogenic Aragonite. Sedimentology 64, 1354–1380. doi:10.1111/sed.12356
Ropes, J. W., Jones, D., Murawski, S., Serchuk, F., and Jearld, A. (1984). Documentation of Annual Growth Lines in Ocean Quahogs, Arctica Islandica Linné. Fish. Bull. 82, 1–19.
Rovelli, L., Dengler, M., Schmidt, M., Sommer, S., Linke, P., and McGinnis, D. F. (2016). Thermocline Mixing and Vertical Oxygen Fluxes in the Stratified central North Sea. Biogeosciences 13, 1609–1620. doi:10.5194/bg-13-1609-2016
Rueden, C. T., Schindelin, J., Hiner, M. C., DeZonia, B. E., Walter, A. E., Arena, E. T., et al. (2017). ImageJ2: ImageJ for the Next Generation of Scientific Image Data. BMC Bioinformatics 18, 529. doi:10.1186/s12859-017-1934-z
Sathyendranath, S., Brewin, R., Brockmann, C., Brotas, V., Calton, B., Chuprin, A., et al. (2019). An Ocean-Colour Time Series for Use in Climate Studies: The Experience of the Ocean-Colour Climate Change Initiative (OC-CCI). Sensors 19, 4285. doi:10.3390/s19194285
Schmidt, G. A., Annan, J. D., Bartlein, P. J., Cook, B. I., Guilyardi, E., Hargreaves, J. C., et al. (2014). Using Palaeo-Climate Comparisons to Constrain Future Projections in CMIP5. Clim. Past 10, 221–250. doi:10.5194/cp-10-221-2014
Schneider, C. A., Rasband, W. S., and Eliceiri, K. W. (2012). NIH Image to ImageJ: 25 Years of Image Analysis. Nat. Methods 9, 671–675. doi:10.1038/nmeth.2089
Schöne, B. R. (2013). Arctica Islandica (Bivalvia): A Unique Paleoenvironmental Archive of the Northern North Atlantic Ocean. Glob. Planet. Change 111, 199–225. doi:10.1016/j.gloplacha.2013.09.013
Schöne, B. R., Dunca, E., Fiebig, J., and Pfeiffer, M. (2005a). Mutvei's Solution: An Ideal Agent for Resolving Microgrowth Structures of Biogenic Carbonates. Palaeogeogr. Palaeoclimatol. Palaeoecol. 228, 149–166. doi:10.1016/j.palaeo.2005.03.054
Schöne, B. R., Fiebig, J., Pfeiffer, M., Gleβ, R., Hickson, J., Johnson, A. L. A., et al. (2005b). Climate Records from a Bivalved Methuselah (Arctica Islandica, Mollusca; Iceland). Palaeogeogr. Palaeoclimatol. Palaeoecol. 228, 130–148. doi:10.1016/j.palaeo.2005.03.049
Schöne, B. R., Houk, S. D., Freyre Castro, A. D., Fiebig, J., Oschmann, W., Kröncke, I., et al. (2005c). Daily Growth Rates in Shells of Arctica Islandica: Assessing Sub-seasonal Environmental Controls on a Long-Lived Bivalve Mollusk. PALAIOS 20, 78–92. doi:10.2110/palo.2003.p03-101
Schöne, B. R., Huang, X., Zettler, M. L., Zhao, L., Mertz-Kraus, R., Jochum, K. P., et al. (2021). Mn/Ca in Shells of Arctica Islandica (Baltic Sea) - A Potential Proxy for Ocean Hypoxia? Estuarine, Coastal Shelf Sci. 251, 107257. doi:10.1016/j.ecss.2021.107257
Schöne, B. R., Radermacher, P., Zhang, Z., and Jacob, D. E. (2013). Crystal Fabrics and Element Impurities (Sr/Ca, Mg/Ca, and Ba/Ca) in Shells of Arctica Islandica-Implications for Paleoclimate Reconstructions. Palaeogeogr. Palaeoclimatol. Palaeoecol. 373, 50–59. doi:10.1016/j.palaeo.2011.05.013
Schöne, B. R., Wanamaker, A. D., Fiebig, J., Thébault, J., and Kreutz, K. (2011). Annually Resolved δ13Cshell Chronologies of Long-Lived Bivalve Mollusks (Arctica Islandica) Reveal Oceanic Carbon Dynamics in the Temperate North Atlantic during Recent Centuries. Palaeogeogr. Palaeoclimatol. Palaeoecol. 302, 31–42. doi:10.1016/j.palaeo.2010.02.002
Seabold, S., and Perktold, J. (2010). “Statsmodels: Econometric and Statistical Modeling with python,” in Proceeding of the 9th python in science conference (Austin: SCIPY). doi:10.25080/majora-92bf1922-011
Sillanpää, J. K., Cardoso, J. C. d. R., Félix, R. C., Anjos, L., Power, D. M., and Sundell, K. (2020). Dilution of Seawater Affects the Ca2 + Transport in the Outer Mantle Epithelium of Crassostrea gigas. Front. Physiol. 11, 1. doi:10.3389/fphys.2020.00001
Sobral, P., and Widdows, J. (1997). Influence of Hypoxia and Anoxia on the Physiological Responses of the Clam Ruditapes Decussatus from Southern Portugal. Mar. Biol. 127, 455–461. doi:10.1007/s002270050033
Stemmer, K., Brey, T., Gutbrod, M. S., Beutler, M., Schalkhausser, B., and De Beer, D. (2019). In Situ Measurements of pH, CA2+, and Dic Dynamics within the Extrapallial Fluid of the Ocean Quahog Arctica Islandica. J. Shellfish Res. 38, 71–78. doi:10.2983/035.038.0107
Stemmer, K., Nehrke, G., and Brey, T. (2013). Elevated CO2 Levels Do Not Affect the Shell Structure of the Bivalve Arctica Islandica from the Western Baltic. PLOS ONE 8, e70106. doi:10.1371/journal.pone.0070106
Strahl, J., Dringen, R., Schmidt, M. M., Hardenberg, S., and Abele, D. (2011). Metabolic and Physiological Responses in Tissues of the Long-Lived Bivalve Arctica Islandica to Oxygen Deficiency. Comp. Biochem. Physiol. A: Mol. Integr. Physiol. 158, 513–519. doi:10.1016/j.cbpa.2010.12.015
Strahl, J. (2011). Life Strategies in the Long-Lived Bivalve Arctica Islandica on a Latitudinal Climate Gradient–Environmental Constraints and Evolutionary Adaptations. Available at: https://epic.awi.de/id/eprint/25460/1/Dissertation_Julia_Strahl.pdf (Accessed August 26, 2021).
Sukhotin, A. A., and Pörtner, H.-O. (2001). Age-dependence of Metabolism in Mussels Mytilus edulis (L.) from the White Sea. J. Exp. Mar. Biol. Ecol. 257, 53–72. doi:10.1016/S0022-0981(00)00325-7
Sukhotin, A., Kovalev, A., Sokolov, E., and Sokolova, I. M. (2020). Mitochondrial Performance of a Continually Growing marine Bivalve, Mytilus edulis Linnaeus, Depends on the Body Size. J. Exp. Biol. 223, jeb226332. doi:10.1242/jeb.226332
Tan Tiu, A., and Prezant, R. S. (1989). Temporal Variation in Microstructure of the Inner Shell Surface of Corbicula Fluminea (Bivalvia: Heterodonta). Am. Malacological Bull. 7, 65–71.
Taylor, A. C., and Brand, A. R. (1975a). A Comparative Study of the Respiratory Responses of the Bivalves Arctica Islandica (L.) and Mytilus edulis L. To Declining Oxygen Tension. Proc. R. Soc. Lond. B. 190, 443–456. doi:10.1098/rspb.1975.0105
Taylor, A. C., and Brand, A. R. (1975b). Effects of Hypoxia and Body Size on the Oxygen Consumption of the Bivalve Arctica Islandica (L.). J. Exp. Mar. Biol. Ecol. 19, 187–196. doi:10.1016/0022-0981(75)90046-5
Theede, H., Ponat, A., Hiroki, K., and Schlieper, C. (1969). Studies on the Resistance of marine Bottom Invertebrates to Oxygen-Deficiency and Hydrogen Sulphide. Mar. Biol. 2, 325–337. doi:10.1007/BF00355712
Thompson, I., Jones, D. S., and Dreibelbis, D. (1980a). Annual Internal Growth Banding and Life History of the Ocean Quahog Arctica Islandica (Mollusca: Bivalvia). Mar. Biol. 57, 25–34. doi:10.1007/BF00420964
Thompson, I., Jones, D. S., and Ropes, J. W. (1980b). Advanced Age for Sexual Maturity in the Ocean Quahog Arctica Islandica (Mollusca: Bivalvia). Mar. Biol. 57, 35–39. doi:10.1007/BF00420965
Thorarinsdottir, G. G., and Steingrimsson, S. A. (2000). Size and Age at Sexual Maturity and Sex Ratio in Ocean Quahog, Arctica Islandica (Linnaeus, 1767), off Northwest Iceland. J. Shellfish Res. 19, 943–948.
van der Walt, S., Schönberger, J. L., Nunez-Iglesias, J., Boulogne, F., Warner, J. D., Yager, N., et al. (2014). Scikit-image: Image Processing in Python. PeerJ 2, e453. doi:10.7717/peerj.453
Vihtakari, M., Renaud, P. E., Clarke, L. J., Whitehouse, M. J., Hop, H., Carroll, M. L., et al. (2016). Decoding the Oxygen Isotope Signal for Seasonal Growth Patterns in Arctic Bivalves. Palaeogeogr. Palaeoclimatol. Palaeoecol. 446, 263–283. doi:10.1016/j.palaeo.2016.01.008
Virtanen, P., Gommers, R., Oliphant, T. E., Haberland, M., Reddy, T., Cournapeau, D., et al. (2020). SciPy 1.0: Fundamental Algorithms for Scientific Computing in Python. Nat. Methods 17, 261–272. doi:10.1038/s41592-019-0686-2
Walliser, E. O., Lohmann, G., Niezgodzki, I., Tütken, T., and Schöne, B. R. (2016). Response of Central European SST to Atmospheric pCO2 Forcing during the Oligocene - A Combined Proxy Data and Numerical Climate Model Approach. Palaeogeogr. Palaeoclimatol. Palaeoecol. 459, 552–569. doi:10.1016/j.palaeo.2016.07.033
Wanamaker, A. D., and Gillikin, D. P. (2019). Strontium, Magnesium, and Barium Incorporation in Aragonitic Shells of Juvenile Arctica Islandica: Insights from Temperature Controlled Experiments. Chem. Geology. 526, 117–129. doi:10.1016/j.chemgeo.2018.02.012
Wanamaker, A. D., Heinemeier, J., Scourse, J. D., Richardson, C. A., Butler, P. G., Eiríksson, J., et al. (2008). Very Long-Lived Mollusks Confirm 17th century AD Tephra-Based Radiocarbon Reservoir Ages for North Icelandic Shelf Waters. Radiocarbon 50, 399–412. doi:10.1017/S0033822200053510
Wanamaker, A. D., Kreutz, K. J., Schöne, B. R., Maasch, K. A., Pershing, A. J., Borns, H. W., et al. (2009). A Late Holocene Paleo-Productivity Record in the Western Gulf of Maine, USA, Inferred from Growth Histories of the Long-Lived Ocean Quahog (Arctica Islandica). Int. J. Earth Sci. (Geol Rundsch) 98, 19. doi:10.1007/s00531-008-0318-z
Weidman, C. R., Jones, G. A., and Lohmann, K. C. (1994). The Long-Lived molluscArctica Islandica:A New Paleoceanographic Tool for the Reconstruction of Bottom Temperatures for the continental Shelves of the Northern North Atlantic Ocean. J. Geophys. Res. 99, 18305–18314. doi:10.1029/94JC01882
Wilbur, K. M., and Saleuddin, A. S. M. (1983). “Shell Formation,” in ” in the Mollusca. Editors A. S. M. Saleuddin, and K. M. Wilbur (Academic Press), 235–287. doi:10.1016/B978-0-12-751404-8.50014-1
Winter, J. E. (1978). A Review on the Knowledge of Suspension-Feeding in Lamellibranchiate Bivalves, with Special Reference to Artificial Aquaculture Systems. Aquaculture 13, 1–33. doi:10.1016/0044-8486(78)90124-2
Winter, J. E. (1970). “Filter Feeding and Food Utilization in Arctica Islandica L. And Modiolus modiolus L. at Different Food Concentrations,” in Marine Food Chains (University of California Press), 196–206.
Keywords: Arctica islandica, bivalves, shells, microstructure, envrionmental variability, water temperature proxy, sclerochronology, scanning electron microscopy
Citation: Höche N, Walliser EO and Schöne BR (2022) Microstructural Mapping of Arctica islandica Shells Reveals Environmental and Physiological Controls on Biomineral Size. Front. Earth Sci. 9:781305. doi: 10.3389/feart.2021.781305
Received: 13 October 2021; Accepted: 15 December 2021;
Published: 18 January 2022.
Edited by:
Michaël Hermoso, UMR8187 Laboratoire d’Océanologie et de Géosciences (LOG), FranceReviewed by:
Caroline Thaler, UMR8212 Laboratoire des Sciences du Climat et de l'Environnement (LSCE), FranceAntonio Gerardo Checa, University of Granada, Spain
Copyright © 2022 Höche, Walliser and Schöne. This is an open-access article distributed under the terms of the Creative Commons Attribution License (CC BY). The use, distribution or reproduction in other forums is permitted, provided the original author(s) and the copyright owner(s) are credited and that the original publication in this journal is cited, in accordance with accepted academic practice. No use, distribution or reproduction is permitted which does not comply with these terms.
*Correspondence: Nils Höche, nhoeche@uni-mainz.de; Bernd R. Schöne, bernd.schoene@uni-mainz.de