Numerical Simulation of the Effects of Wedge Subduction on the Lithospheric Thermal Structure and the Seismogenic Zone South of Chile Triple Junction
 Changsheng Guo
 Pengchao Sun
 Dongping Wei1,2*
- 1College of Earth and Planetary Science, University of Chinese Academy of Sciences, Beijing, China
- 2Key Laboratory of Computational Geodynamics, Chinese Academy of Sciences, Beijing, China
In contrast to common subduction, the young and thin part of the Antarctic Plate subducts first to the south of the Chile Triple Junction (CTJ), followed by the old and thick part, corresponding to wedge subduction. A finite element model was used to simulate the wedge subduction of the Antarctic Plate and to compare it with the slab subduction of the Nazca Plate. The results show that the CTJ is not only a wedge subduction boundary but also an important factor controlling the lithospheric thermal structure of the overriding plate. The computed heat flow curves are consistent with the data observed near the trench of the two selected profiles. The different slab dips to the north and south of the CTJ are considered to be caused by wedge subduction. When the slabs are young and at the same age, the deep dip of the Antarctic slab is 22° smaller than the Nazca slab. Southward from the CTJ, the slab age of the wedge subduction increases, which leads to a larger slab dip, a colder slab, and a wider seismogenic zone. The effect of the slab age of wedge subduction on the focal depth is smaller than that of the convergence rate. A 4.8-cm/year difference in convergence rate of the wedge subduction results in an 11-km difference in the width of the seismogenic zone and a 10-km difference in the depth of the downdip limit. Among these controlling factors, the convergence rate plays a major role in the different focal depths south and north of the CTJ.
Introduction
Fewer earthquakes occur to the south than the north of the Chile Triple Junction (CTJ) (Figure 1A), and the focal depths south of CTJ are much shallower. A common hypothesis is that the position of the interplate seismogenic zone is mainly controlled by temperature (Tichelaar and Ruff, 1991; Oleskevich et al., 1999; Völker et al., 2011). Temperature is typically lower in the subduction zone, except for the spreading ridge entering subduction zones. Generally, the spreading-ridge subduction is accompanied by several phenomena, such as surface heat flow anomalies, earthquakes, and high geothermal gradients in the lithosphere (Hamza et al., 2005; Agurto-Detzel et al., 2014). Therefore, it is important to study the lithospheric thermal structure of the area in which the ridge is subducting beneath the continental plate.
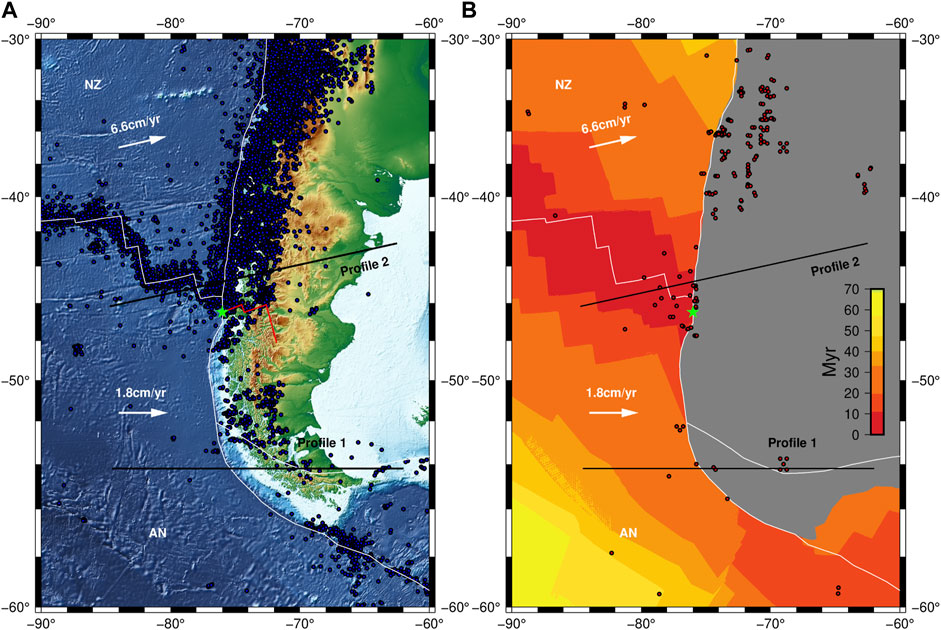
FIGURE 1. Topographic map of the Chile Triple Junction (CTJ). NZ, Nazca plate; AN, Antarctic plate. The CTJ is indicated by the green five-pointed star. White lines are plate boundaries. Subduction vectors (white arrow) are according to Cande and Leslie (1986) and Maksymowicz et al. (2012). The profiles are indicated by the black solid lines. (A) Earthquakes in the area of CTJ. The seismicity data (1906–2021) from the ISC [International Seismological Centre (2021), On-line Bulletin, https://doi.org/10.31905/D808B830] (Bondár and Storchak, 2011; Storchak et al., 2017; Storchak et al., 2020) are symbolized by the blue dots. The location of ridge and transform fault subducted in the past 5.3 Ma is indicated by the red solid line (Maksymowicz et al., 2012). (B) The oceanic crustal age (seton et al., 2020) in the area of CTJ. The heat flow data (Lucazeau, 2019) are symbolized by the red dots.
The CTJ is located at the junction of the Nazca, Antarctic, and South American plates (Figure 1A). It is formed by the subduction of the spreading Chile ridge into the Chile trench (Forsythe and Nelson, 1985). Because of the ridge subduction, the age distributions on the northern and southern sides of the CTJ notably differ. To the north of the CTJ, the Nazca Plate subducts beneath the South American Plate. The oceanic crust age of the Nazca plate increases northward from the CTJ along the Chile trench and eastward from the Chile ridge. To the south of the CTJ, the Antarctic plate subducts beneath the South American Plate after the spreading ridge. The oceanic crust age of the Antarctic Plate increases southward from the CTJ along the trench and decreases from west to east (Figure 1B) (Seton et al., 2020). In other words, to the north of the CTJ, the old and thick part of the Nazca Plate subducts first, followed by the young and thin part, constituting slab subduction. The ridge subduction to the south of the CTJ, however, leads the young and thin part of the Antarctic Plate to subduct first, and should be considered as wedge subduction. As is shown in Figure 1, the CTJ is the wedge subduction boundary, and wedge subduction generally occurs after ridge subduction.
Previous studies of subduction zones have considerably advanced research on oceanic and continental subduction zones (Völker et al., 2011; Leng and Sun, 2019; Liu et al., 2019; Chen et al., 2020; Tang et al., 2020). Relevant research mainly focused on common slab subduction, whereas little attention had been paid to wedge subduction, which may significantly affect the slab dip, lithospheric thermal structure, and seismicity of areas in which spreading ridges are subducted such as the CTJ area. Based on the kinematic history and the oceanic plate age distribution (Figure 1B) south of the CTJ, wedge subduction is common in the south of the CTJ (from 46°30′S to 55°S and farther south) and exhibits similar tectonic characteristics (Breitsprecher and Thorkelson, 2009). Wedge subduction may also have an impact on the thermal structure of the continental lithosphere farther south of the CTJ, which is little affected by the spreading ridge or slab window. In addition to the spreading ridge, factors in the thermal structure of subduction zones include the plate age, convergence rate, the slab dip, rheological properties of the mantle wedge, thickness of the overlying plate, and frictional heating (Leng and Sun, 2019; Tang et al., 2020), the most important of which are the plate age and convergence rate (Leng and Sun, 2019).
We made two profiles to compare the wedge subduction process of the Antarctic Plate with the slab subduction of the Nazca Plate in the south and north of the CTJ, respectively (Figure 1). We selected the two profiles because the slab ages of two plates are similar near the trench (Table 1), but for one, the young part of the plate subducts first; for the other, the old part subducts first. To the south of the CTJ, we selected profile 1 far away from the CTJ. Note that little data have been obtained south of the CTJ, and there is a lack of observations of the slab dip of the Antarctica Plate. The small slab dip of the Antarctic Plate is only kinematically inferred (Breitsprecher and Thorkelson, 2009; Agurto-Detzel et al., 2014). We selected profile 1 south of the CTJ for the following reasons:
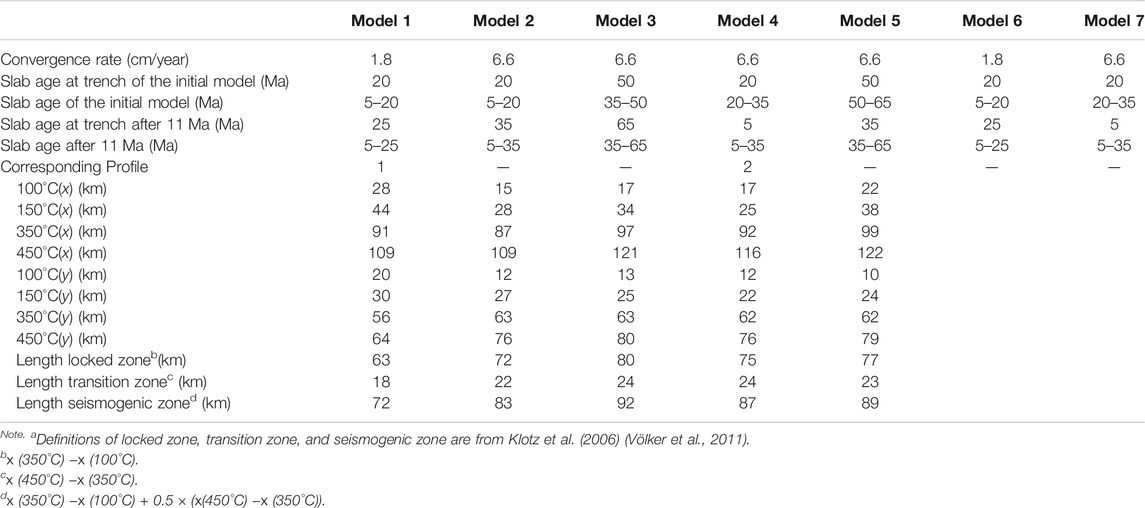
TABLE 1. Slab age and seismogenic zones.a
First, no significant change has been observed in the relative velocities of the Antarctic–South America plates since 6 Ma, and their directions and convergence rates are similar along the strike (Cande and Leslie, 1986; Bourgois et al., 2016).
Second, according to the boundary of the slab window inferred based on kinematics (Breitsprecher and Thorkelson, 2009), the slab window and subducted ridge should exert very limited influence far away from the CTJ. Therefore, the tectonic setting along the strike is similar and can be simplified and analyzed as wedge subduction. In addition, the oceanic crust age of the Antarctic Plate increases southward along the strike (Figure 1B) (Seton et al., 2020).
Although the sediment distribution of the Nazca Plate differs, parameters including the geometry, slab dip, etc., north of the CTJ are similar (Bohm et al., 2002; Lange et al., 2007; Völker et al., 2011). The thermal state of the incoming Nazca Plate significantly varies with the plate age (Völker et al., 2011).
Based on these characteristics, a finite element model was used to simulate the two-dimensional (2D) wedge subduction process of the Antarctic Plate and compare it with the subduction of the Nazca Plate. The effects of the plate age, wedge subduction, and convergence rate on the lithospheric thermal structure and the seismogenic zone of the CTJ area were studied.
Tectonic Setting
Geological and geophysical data for the CTJ, which is in a typical ridge subduction zone, have been gradually accumulated in recent years, providing a basis for numerical simulations (Völker et al., 2011; Ji et al., 2019; Liu et al., 2019; Xu et al., 2019). Due to the ridge subduction and other factors, the thermal anomaly to the south of the CTJ is more significant than that to the north (Hamza et al., 2005; Rotman and Spinelli, 2014). Based on the drilling data, Lagabrielle et al. (2000) inferred that the temperature of the area between the CTJ and about 50 km south of it may reach 800–900°C at a depth from 10 to 20 km.
Wang and Wei (2018) classified the triple junctions worldwide and analyzed their evolutionary characteristics. The three boundaries of the CTJ are a ridge and two trenches, forming an RTT-type (ridge–trench–trench) triple junction (Figure 1). The convergence rate of the Nazca–South America plates is about 6.6 cm/year to the north of the CTJ in the direction almost parallel to transform faults, whereas the convergence rate of the Antarctic–South America is around 1.8 cm/year to the south of the CTJ approximately in the E–W direction (Cande and Leslie, 1986; Angermann et al., 1999; Maksymowicz et al., 2012; Wang et al., 2018) (Figure 1). Compared with other active tectonic regions in the world, little geological data are available for the south of the CTJ. In addition, the crustal structure of South America is among the least studied continental areas on Earth. According to gravity data obtained for the Moho, the depth of the Moho below South America varies greatly. The thickness of the crust in the Andes is more than 65 km, whereas the average thickness of the crust in the northern and eastern parts of South America is around 40 km (van der Meijde et al., 2013).
The CTJ is located at 46°30′S, where the Chile ridge axis is about 10° oblique to the Chile trench (Cande et al., 1987). A series of transform faults divide the Chile ridge into several segments. These ridge segments and transform faults alternately subduct beneath the South American plate (Tebbens et al., 1997). Because of its special geometric structure, the CTJ moves northward when a ridge segment is subducted, representing an RTT-type triple junction. The CTJ moves southward slowly when a transform fault is subducted, representing an FTT-type (fault–trench–trench) triple junction (Forsythe et al., 1986; Maksymowicz et al., 2012). Ridge subduction commonly occurred from 46°30′S to farther than 55°S south of the CTJ in the past 16 Ma (Breitsprecher and Thorkelson, 2009). North of the CTJ, the oceanic crust age of the Nazca Plate increases from 0 Ma at the CTJ to about 37 Ma at 32.8°S along the trench (Tebbens et al., 1997; Flueh et al., 1998; Zelt et al., 2003). South of the CTJ, the age of the Antarctic Plate increases to about 30 Ma along the trench (Seton et al., 2020) (Figure 1B).
Statistics show that few earthquakes occur south of the CTJ, whereas more earthquakes can be observed in the north (Murdie et al., 1993) (Figure 1A). South of 43°S, the focal depths are generally shallow, and the Wadati–Benioff (WB) plane is not observable because of the lack of interplate seismic data. This may be due to the subduction of very young lithosphere (Kirby et al., 1996; Lange et al., 2007; Agurto-Detzel et al., 2014). The WB plane is well constrained north of 43°S (Agurto-Detzel et al., 2014). Between 36°and 43.5°S, the WB plane has a dip ranging from around 30–33 (Bohm et al., 2002; Lange et al., 2007).
Numerical Model
Basic Equations
In this paper, numerical models were built by the 2D finite element method “ASPECT” (Kronbichler et al., 2012), which solves the three conservation equations of, respectively, momentum, mass, and heat.
1) Stokes equation:
where
2) Conservation of mass is approximated by the incompressible continuity equation:
3) Heat conservation equation:
where
Visco-Plastic Rheology
ASPECT regards the mantle as a high-viscosity fluid. The common rheological criteria used in geodynamics are adopted in this paper (Billen and Gurnis, 2001; Lallemand et al., 2005; Jadamec et al., 2013; Holt et al., 2015; Leng and Gurnis, 2015). The viscosity for dislocation or diffusion creep is defined as:
where
In case of diffusion creep, m
Thus, the viscous stress is defined as:
where
The ductile rheology is combined with a brittle/plastic rheology to yield an effective visco-plastic rheology. In our implementation, it is defined by the Drucker–Prager criterion (Davis and Selvadurai, 2002):
where
The final effective viscosity
Model Set-Ups
Based on the geological background of the CTJ, we built a series of 2D geodynamic numerical models, which fall into Antarctic models and Nazca models, respectively, corresponding to wedge and slab subduction.
Model 1, which simulates the wedge subduction of the Antarctic Plate, corresponds to profile 1 with the convergence rate set as 1.8 cm/year (Figure 1) (Cande and Leslie, 1986; Maksymowicz et al., 2012). The other four models, i.e., Models 2–5, were built to investigate the effect of the slab age and wedge subduction on the lithospheric thermal structure with a set convergence rate of 6.6 cm/year. Models 2 and 3 correspond to wedge subduction, and Models 4 and 5 represent slab subduction. The slab of Model 3 is older than that of Model 2, and the slab of Model 5 is older than that of Model 4. When the calculation finishes, the slab age of Model 4 is the same as that of Model 2 and the slab age of Model 5 is the same as that of Model 3. The slab ages of Models 1–5 are shown in Table 1. Model 4 is a simplification based on profile 2.
The computational domain is 2,500 × 660 km; the continental and oceanic plates are 1,500- and 1,000-km long, respectively. To our knowledge, there is a lack of direct observation of the slab dip of Antarctic plate, which is only inferred to be smaller than that of the Nazca Plate (Breitsprecher and Thorkelson, 2009; Agurto-Detzel et al., 2014). Since there are rarely earthquakes south of CTJ, there have been many different tomographic models depending on the various cases in reality. These models differ greatly for this area. On the basis of the tomography (Figure 2) and previous numerical model settings for the CTJ (van der Hilst and de Hoop, 2005; Scherwath et al., 2006, 2009; Simmons et al., 2010; Völker et al., 2011; Maksymowicz et al., 2012) and the comparison of different initial slab dips (Surface Heat Flow and Seismogenic Zone and Seismicity Data), the initial slab dips of Models 1–5 were set in a way in which it gradually increases with the depth from 0° at the trench to 30° at about 120-km deep.
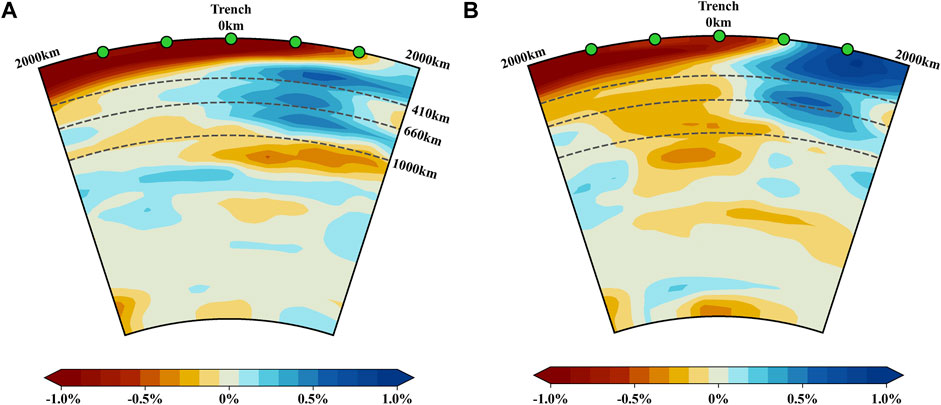
FIGURE 2. Vertical cross sections of P wave velocity perturbations (Simmons et al., 2010) along the profiles shown in Figure 1. (A) Profile 1 (at 54°12′S). (B) Profile 2 (at 44°48′S).
The initial temperature field and the boundary conditions were set as follows: The upper boundary was maintained at a constant temperature of 0°C. The temperature at the lithosphere–asthenosphere boundary was set as 1,300°C (Tetreault and Buiter, 2012). An initial geothermal gradient of 0.25°C/km was set for the asthenosphere; thus, the temperature at the lower boundary was set as 1,440°C (Tetreault and Buiter, 2012). A plate cooling model was used for the oceanic plate with a maximum plate thickness of 95 km. The thickness and initial temperature field of the oceanic lithosphere were calculated according to the plate age (Stein and Stein 1992; Richards et al., 2018):
where a is the asymptotic thermal plate thickness, Tm is the basal temperature,
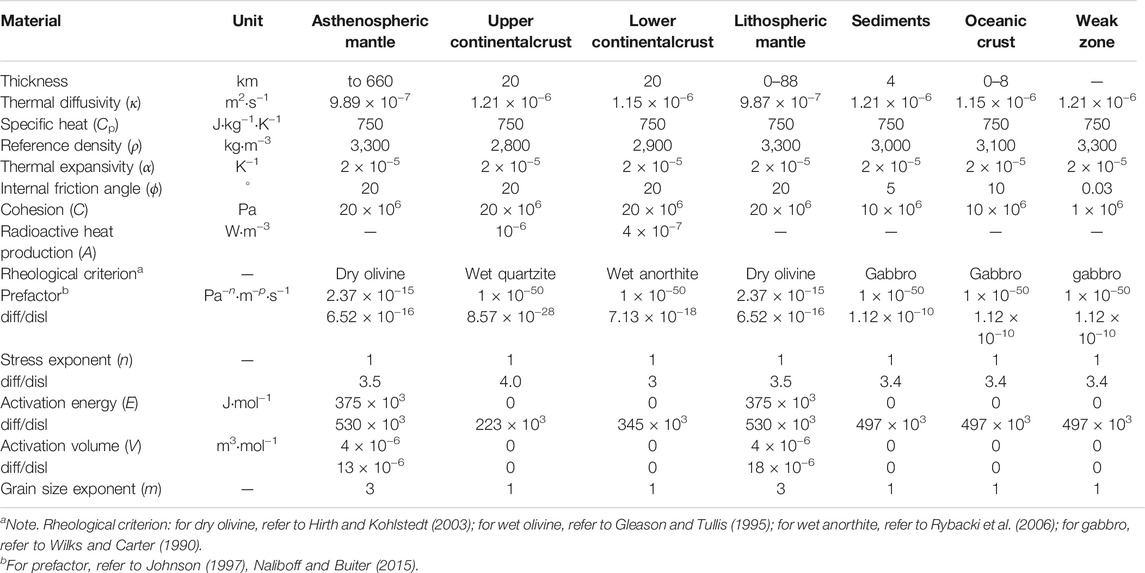
TABLE 2. Relevant parameters of numerical model.
A constant velocity was applied to the upper part of the left boundary to simulate the convergence of the plates and also applied to the lower part in the opposite direction (Liu et al., 2019). The upper boundary was a free surface and the right and lower boundaries were set to be free slip (Figure 3). The parameters obtained in relevant studies are listed in Table 2 (Tetreault and Buiter, 2012; Liu et al., 2019). For the radioactive heat production, this study refers to Xu et al. (2019) and, for the viscosity values, Glerum et al. (2018) and Liu et al. (2019).
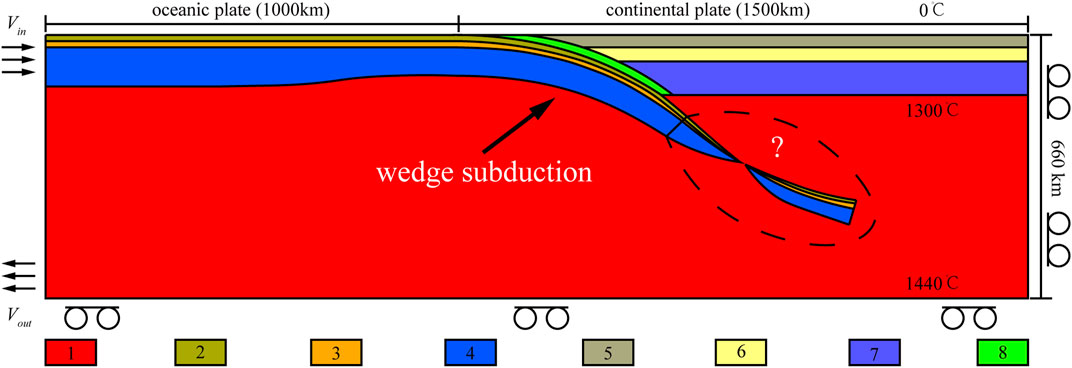
FIGURE 3. Initial setups and boundary conditions of the wedge subduction. Wedge subduction is a type of subduction in which the young and thin part of the slab subducts first, and the old and thick part subducts later. Surrounded by the dotted line is the truncated part with unclear tectonic structure indicated by the question mark. Colors are used to indicate different compositional fields: 1, asthenospheric mantle; 2, sediments; 3, oceanic crust; 4, lithospheric mantle; 5, upper continental crust; 6, lower continental crust; 7, lithospheric mantle; 8, weak zone. Viscosity of mantle can be calculated with relevant parameters (Table 2). All these parameters come from the rheological experiments on dislocation creep and diffusion creep of dry olivine (Hirth and Kohlstedt, 2013).
According to the initial slab length, a calculation of 5.5 Ma was needed to obtain the initial temperature field of the slab. The calculation process is as follows: First, the boundary velocity was set as 0, and a calculation of 5.5 Ma was carried out. Subsequently, a boundary velocity corresponding to the actual convergence rate was applied to the left boundary, and another calculation of 5.5 Ma was done. In total, the model was run for 11 Ma. After that, the plate ages of Models 1 and 4 match those of profiles 1 and 2, respectively, in Figure 1. The slab ages of the models and the corresponding relationship between the models and profiles are shown in Table 1.
Results
We built a series of models to investigate the effects of wedge subduction (Table 1). Due to the lack of observations of the slab dip south of the CTJ, we focused, in Slab Dip, on the effect of wedge subduction on slab dip. In Surface Heat Flow and Seismogenic Zone and Seismicity Data, the computed heat flow and seismogenic zones of the models, which had different initial slab dips, were compared with the observed data. We chose the initial slab dip, which is more consistent with the observed data to determine the effect of wedge subduction on the seismogenic zone (Seismogenic Zone and Seismicity Data) and the temperature field (Temperature Field). The effects of slab age and convergence rate are discussed in Slab Dip, Temperature Field.
Slab Dip
The Nazca model in which the old part subducted first corresponded to slab subduction, whereas the Antarctic model in which the young part subducted first corresponded to wedge subduction. Typically, the slab dip gradually increases with the depth and stops growing at about 80–150 km deep. Beneath this depth, it remains almost constant down to the boundary between the upper and lower mantle (Lallemand et al., 2005). According to the definition of the shallow dip and the deep dip of Lallemand et al. (2005), the mean shallow dips and mean deep dips of Models 2, 3, 4, and 5 are given in Figure 4.
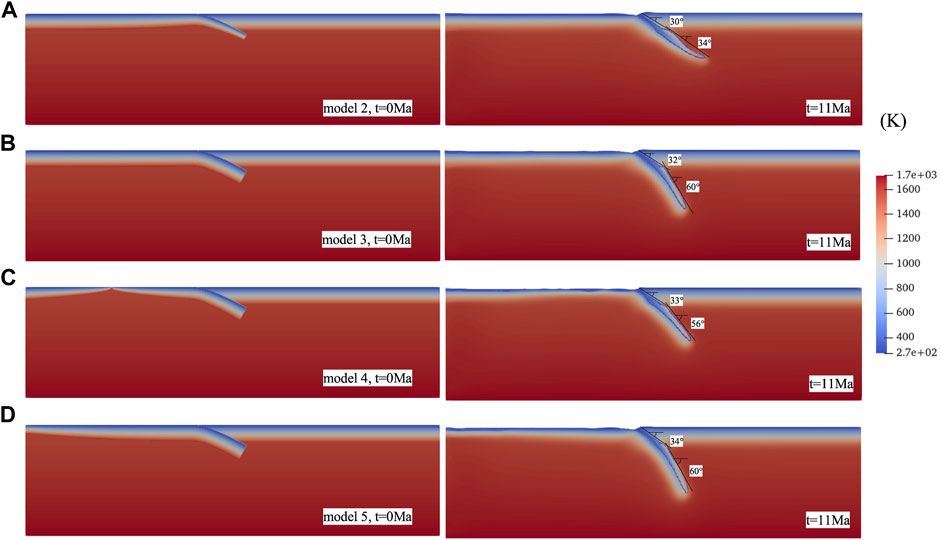
FIGURE 4. Temperature fields and slab dips of Models 2–5; convergence rate = 6.6 cm/year. On the left and right are, respectively, the initial and final temperature fields. The upper and lower dips on the right are the mean shallow dips and the mean deep dips according to Lallemand et al. (2005). Sediment contours are indicated by the solid blue lines in right models, and the upper parts of the outlines are the upper surface of the slabs (A) Model 2, wedge subduction with a young slab. (B) Model 3, wedge subduction with an old slab. (C) Model 4, slab subduction with a young slab. (D) Model 5, slab subduction with an old slab.
The solid blue lines in Figures 4 and 5 are the sediment contours. Figure 5 shows the evolution of the sediment outlines. The upper parts of the outlines are the upper surface of the slabs. As is shown in Figure 4, the older the slab, the greater the slab dip. In the Antarctic models, for example, the slab of Model 2 is younger than that of Model 3 and the mean shallow dip and mean deep dip of Model 2 are about 2° and 26° smaller than those of Model 3 (Figure 4A, B). In the Nazca models, the slab of Model 4 is younger than that of Model 5, and the mean shallow dip and mean deep dip of Model 4 are around 1° and 4° smaller than those of Model 5 (Figure 4C, D).
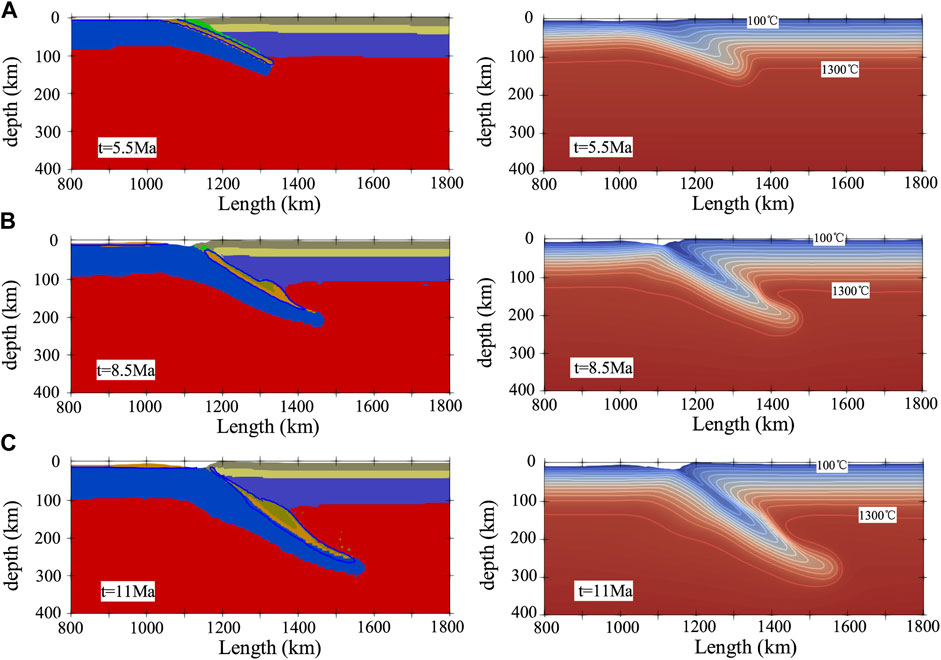
FIGURE 5. Evolution of material field (left) and temperature field (right) of Model 2 (wedge subduction with a young slab). (A) t = 5.5 Ma. (B) t = 8.5 Ma. (C) t = 11 Ma. Sediment contours are indicated by the solid blue lines in the material field. The solid white lines indicate isotherms in the temperature field (right), with a minimum of 100°C and a maximum of 1,300°C.
When the slab ages of the wedge subduction and the slab subduction are the same, the slab dip of wedge subduction is smaller than that of slab subduction. For example, the mean shallow dip and mean deep dip of Model 2 (Antarctic model, Figure 4A) are, respectively, about 3° and 22° smaller than that of Model 4 (Nazca model, Figure 4C). The slabs of Model 3 and Model 5 are too old for their thickness to increase with age, so they have similar slap dips (Figure 4B, D). Among Models 2, 3, 4 and 5, Model 2 has the smallest slap dip. Based on the results above, the slab dip differences of the areas north and south of the CTJ are considered a consequence of the wedge subduction.
Surface Heat Flow
In the effort to obtain a more reasonable initial slab dip, an initial slab dip of 15° was applied to Models 6 and 7. Except for the initial slab dip, the other settings of Models 6 and 7 were the same as those of Models 1 and 4. Figure 6 shows the observed surface heat flow (Lucazeau, 2019) and computed surface heat flow of the different models. In the Antarctic models, the observed heat flow data is too limited to constrain the initial slab dip (Figure 6A). In the Nazca models, the heat flow of Model 4 with an initial slab dip of 30°is more consistent with observed data in the vicinity of the trench than that of Model 7 (Figure 6B).
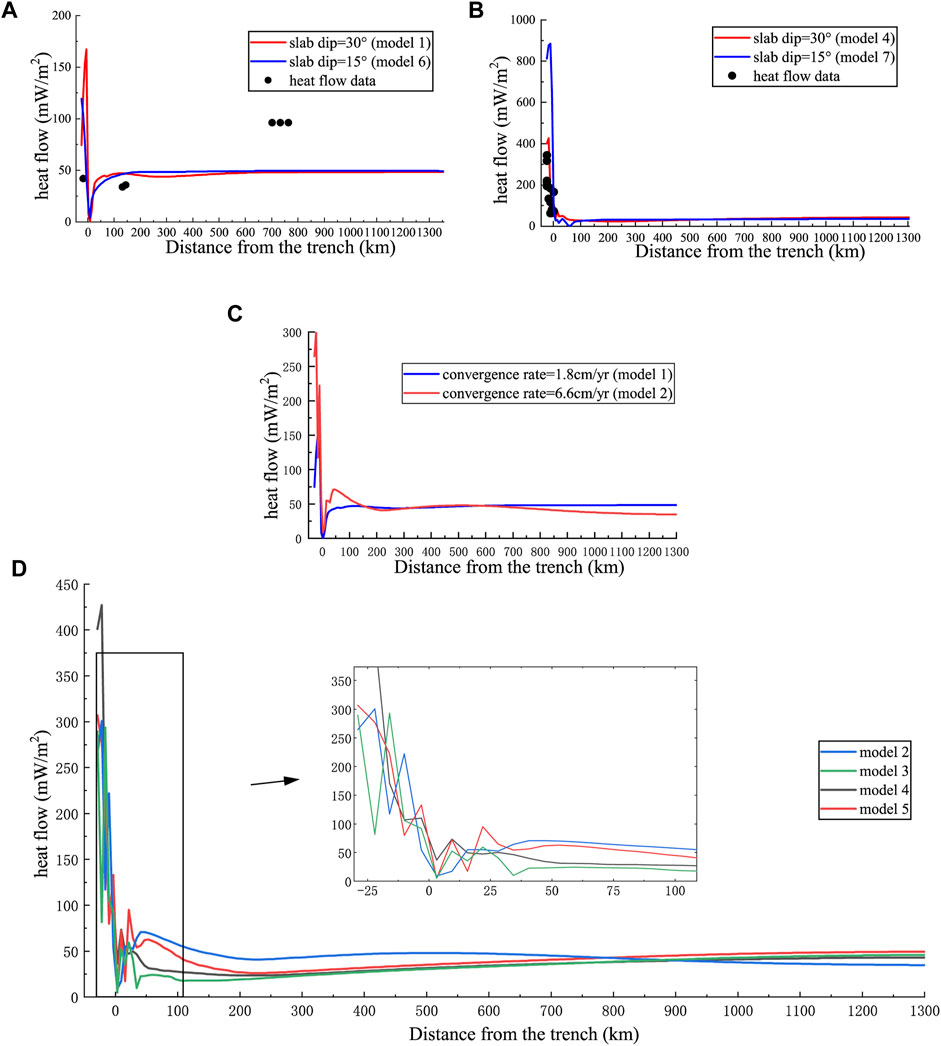
FIGURE 6. Results of the surface heat flow ahead of the trench. Observed heat flow is marked by the black dots. Solid lines correspond to heat flow results of different models. (A) Profile 1. (B) profile 2. (C) Comparison between heat flow results of different convergence rates. (D) Comparison between heat flow results of Models 2, 3, 4, and 5. Model 2, wedge subduction with a young slab; Model 3, wedge subduction with an old slab; Model 4, slab subduction with a young slab; Model 5, slab subduction with an old slab.
The larger the convergence rate, the higher the maximum heat flow in the vicinity of the trench. The convergence rate of Model 1 is smaller than that of Model 2, and the maximum heat flow of Model 1 is 133.7°mW/m2 lower than that of Model 2 in the oceanic plate and 23.7°mW/m2 lower in the forearc (Figure 6C).
The surface heat flow, including the oceanic surface heat flow and forearc heat flow, is generally high in the vicinity of the trench (Figure 6). The surface heat flow in the forearc is complex and depends on several factors such as the topography of the overlying plate or the different slab dips. As is shown in Figure 6D, the forearc heat flow of Model 2 is high, and the heat flow values of Models 3, 4, and 5 gradually stabilize and are almost the same far away from the trench.
Generally, the younger the plate is, the higher the maximum oceanic surface heat flow is in the vicinity of the trench (Figure 6D). In the Antarctic models, the oceanic plate of Model 2 is younger than that of Model 3, and the maximum oceanic heat flow of Model 2 (300.8 mW/m2) is higher. The maximum forearc heat flow of Model 2 (70.8mW/m2) is higher than that of Model 3 (59.2°mW/m2; Figure 6D), which is related to the young slab and small slab dip. In the Nazca models, the oceanic plate of Model 4 is younger than that of Model 5, and the maximum oceanic heat flow of Model 4 is higher (427.0 mW/m2) in the vicinity of the trench, which is related to the young plate and adjacent ridge. However, the maximum forearc heat flow of Model 5 (94.7 mW/m2) is higher than that of Model 4 (73.2 mW/m2).
Seismogenic Zone and Seismicity Data
The position of the interplate seismogenic zone is related to the interplate seismicity and primarily controlled by temperature (Tichelaar and Ruff, 1991; Oleskevich et al., 1999; Völker et al., 2011). The earthquake distribution in Chile (Tichelaar and Ruff, 1991; Oleskevich et al., 1999; Völker et al., 2011) and in the Nazca subduction zone is consistent with this hypothesis. Klotz et al. (2006) generally defines 1) the interseismic locked zone as the region in which the plate contact is at temperatures from 100°C to 350°C, 2) the temperature range from 350°C to 450°C as the transition zone from full locking to full slip, and 3) the seismogenic zone as the width of the locked zone plus half the width of the transition zone (Völker et al., 2011).
The seismicity data (1906–2021) in the vicinity of the profiles from the ISC (International Seismological Centre (2021), On-line Bulletin, https://doi.org/10.31905/D808B830) (Bondár and Storchak, 2011; Storchak et al., 2017; 2020) were projected to profile 1 and profile 2 to contrast with seismogenic zones of our models (Figure 7).
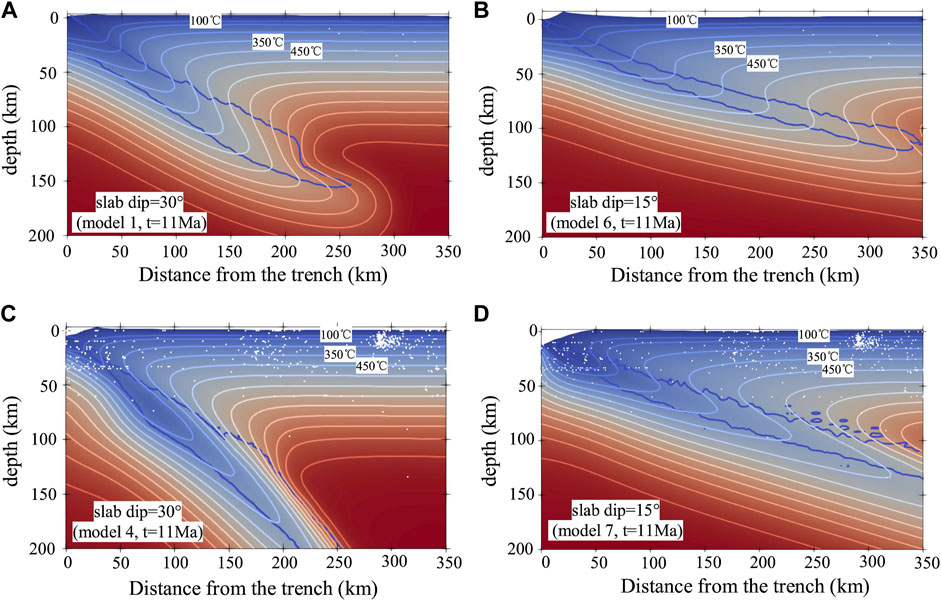
FIGURE 7. Earthquakes in the vicinity of the trench. Earthquakes of profile 1 and profile 2 are indicated by the white circles. (A) Profile 1, initial slab dip = 30°, convergence rate = 1.8 cm/yr (Model 1) (B) profile 1, initial slab dip = 15°, convergence rate = 1.8 cm/yr (Model 6) (C) profile 2, initial slab dip = 30°, convergence rate = 6.6 cm/yr (Model 4) (D) profile 2, initial slab dip = 15°, convergence rate = 6.6 cm/yr (Model 7).
The seismicity data of profile 1 is too little to constrain the seismogenic zone south of the CTJ. In the north of the CTJ, the seismicity data of profile 2 are more consistent with Model 4 than with Model 7 in the seismogenic zone. However, the observed deep seismic events within the slab of profile 2 are more consistent with Model 7 than with Model 4. This is due to the shallow and deep dip of the slab increase during the subduction in Model 4. In the Slab dip section, it is found that the different slab dips of the areas north and south of the CTJ are due to the wedge subduction. Therefore, the initial slab dip of profile 1 and profile 2 were set to be the same. Based on the comparison of the seismogenic zone and heat flow, the numerical models with an initial slab dip that gradually increases from 0° to 30° (Models 1–5) better reflect the interplate seismogenic zone and surface heat flow than those with a dip of 15° (Models 6–7). The widths of the seismogenic zones of Models 1–5 according to the definitions of Klotz et al. (2006) are shown in Table 1.
When the slab subduction and wedge subduction are of the same, old slab age and convergence rate, the width of the seismogenic zone of the former is smaller than that of the latter. As Table 1 shows, the width of the seismogenic zone of Model 5 is 3 km narrower than that of Model 3. The opposite results were obtained for slabs with the same young age and convergence rate, as is illustrated by the 4-km-wider seismogenic zone in Model 4 compared with Model 2. Generally, the widths of the locked zone, transition zone, and seismogenic zone of Model 2 are smaller than those of the other models when the convergence rate is 6.6 cm/year (Table 1).
The older the slab, the wider the seismogenic zone. For instance, the slab of Model 5 is older than that of Model 4, and the seismogenic zone of Model 5 is 2 km wider than that of Model 4. The slab of Model 3 is older than that of Model 2, and the seismogenic zone of Model 3 is 9 km wider than that of Model 2.
The seismogenic zone related to wedge subduction widens with the increase in the convergence rate. The convergence rate of Model 2 is larger than that of Model 1, and the seismogenic zone of Model 2 is 11 km wider than that of Model 1 (Table 1). Besides, as is shown in Table 1, the intersections of the slab surface with the 350°C and 450°C isotherms of Model 2 are much deeper than those of Model 1. The depth of the downdip limit of the seismogenic zone of Model 2 is about 10 km deeper than that of Model 1.
Temperature Field
Figure 8 shows the temperature field within 350 km ahead of the trench. Affected by the subduction of the cold slab, the temperature in the vicinity of the upper surface of the slab is low. In contrast, the overlying plate far away from the slab is only slightly affected. The x- and y-coordinates at the intersections of the upper surface of the slab with the isotherms of 100°C, 150°C, 350°C, and 450°C (Figure 8) are shown in Table 1.
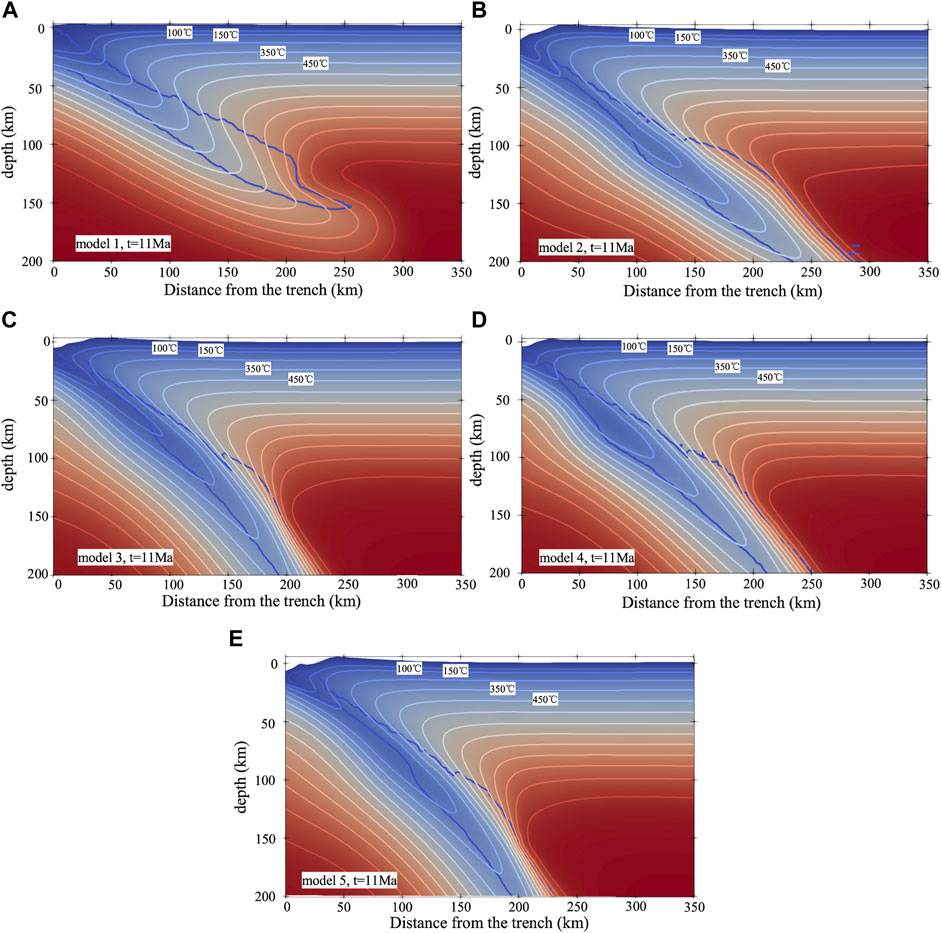
FIGURE 8. Temperature fields within 350 km ahead of the trench. Sediment contours are indicated by the solid blue lines. (A) Model 1, wedge subduction with a young slab, convergence rate = 1.8 cm/yr (B) Model 2, wedge subduction with a young slab, convergence rate = 6.6 cm/yr (C) Model 3, wedge subduction with an old slab, convergence rate = 6.6 cm/yr (D) Model 4, slab subduction with a young slab, convergence rate = 6.6 cm/yr (E) Model 5, slab subduction with an old slab, convergence rate = 6.6 cm/yr.
At the same age, the slab of wedge subduction tends to be hotter than that of slab subduction horizontally. As Table 1 shows, the slab ages of Models 4 and 2 are the same, and the x-coordinates of Model 4 at intersections of the slab surface with the 100, 350, and 450°C isotherms are larger than those of Model 2. Compared with the differences between their x-coordinates, the differences between the y-coordinates of Models 2 and 4 are much smaller.
Generally, the older the slab is, the lower the temperature is in the vicinity of the upper surface of the slab in the horizontal direction. In the Antarctic models, for example, the slab of Model 2 is younger than that of Model 3. The x-coordinates of Model 2 at the intersections of the slab surface with the isotherms of 100, 150, 350, and 450 °C are smaller than those of Model 3. For Models 2–5, the difference in the y-coordinates is much smaller than the difference in the x-coordinates (Table 1). For example, the maximum difference in the x-coordinates between Models 4 and 5 is 13 km at the 150°C isotherm, whereas the maximum difference in the y-coordinates is 3 km at the 450°C isotherm.
The temperature in the vicinity of the slab surface lowers with a decrease in the convergence rate horizontally. In the Antarctic models, the convergence rate of Model 1 is smaller than that of Model 2. The x-coordinates of Model one at the intersections of the slab surface with the isotherms of 100, 150, 350, and 450°C are larger than or equal to those of Model 2 (Table 1). In addition, the y-coordinates of Model 1 at the intersections of the slab boundary with the 100°C and 150°C isotherms are 8 and 3 km, respectively, deeper than those of Model 2, whereas at the intersections of the slab boundary with the 350 and 450°C isotherms, the y-coordinates of Model 1 are, respectively, 7 and 12 km shallower than those of Model 2. This means that the convergence rate has a more significant effect on the temperature field than the slab age in the vertical direction.
Discussions
There are significant differences in seismicity and slab dip between the south and north of the CTJ. According to our results and the inference of Breitsprecher and Thorkelson (2009), the slab dip of the wedge subduction zone should be small south of the CTJ. The slab dip (Slab dips between the south and north of the Chile Triple Junction section) and the seismogenic zone (Seismogenic zones between the south and north of the Chile Triple Junction section) are controlled by the slab age, wedge subduction, and convergence rate.
Slab Dips Between the South and North of the Chile Triple Junction
Our simulations show that the slab dip of the Antarctic Plate, which increases southward from the CTJ, is smaller than that of the Nazca Plate when the same slab age is chosen. To the south of the CTJ, the slab between the CTJ and profile 1 is younger than that of profile 1 and, thus, its slab dip is smaller than that of profile 1. It is also smaller than the dip of the Nazca slab (profile 2) because the slab dip of profile 2 is almost the smallest to the north of the CTJ (Slab Dip). This is consistent with the tomography of the area south of the CTJ in the vicinity of 47°30S, which shows a smaller slab dip compared with the Nazca Plate (Maksymowicz et al., 2012). However, there is a lack of evidence farther south, But the results are consistent with the inference of Breitsprecher and Thorkelson (2009) based on kinematics. In addition, the slab age is generally considered to be the main factor in the change of the slab dip. The older the oceanic plate age, the greater the slab dip (Jarrard, 1986; Stern, 2002). Tomographic evidence, the tomography in the vicinities of 45°30′S, 44°30′S (Maksymowicz et al., 2012), 43°S (Scherwath et al., 2006; 2009), 38°S (Contreras-Reyes, et al., 2008), and farther north (van der Hilst and de Hoop, 2005), shows that the slab dip increases northward from the CTJ. Our results show that, with the slab age, the slab dip increases when the slabs are young but remains almost unchanged when the slabs are old. The results in Slab Dip show that the slab age and slab dip increase northward from profile 2, which is also consistent with the tomographic evidence above.
Seismogenic Zones Between the South and North of the Chile Triple Junction
If we adopt the definitions of Klotz et al. (2006), the simulation results of Models 2 and 3 show that the temperature of the Nazca slab decreases, and the width of the seismogenic zone increases northward from the CTJ (Seismogenic Zone and Seismicity Data, Temperature Field). This is consistent with the numerical simulation results of Völker et al. (2011), the width of the seismogenic zone Wang et al. (2007) inferred from GPS measurements, and the earthquake distribution to the north of the CTJ (Figure 1).
Wedge subduction significantly affects the seismogenic zone. Our simulation results show that the seismogenic zone of the Antarctic slab is narrower than that of the Nazca slab when the slabs are young. The seismogenic zone of profile 1 is 15 km narrower than that of profile 2 (Table 1). Then the seismogenic zone of profile 1 is narrower than that of the Nazca slab because the seismogenic zone of profile 2 is almost the narrowest to the north of the CTJ. The slab between the CTJ and profile 1 is younger than that of profile 1, so its seismogenic zone is narrower than that of profile 1 and much narrower than that of the Nazca Plate. Our simulations by considering exclusively the slab age and convergence rate show that the width of the seismogenic zone increases southward from the CTJ to profile 1. In addition, a few earthquakes occur to the south of the CTJ according to statistics (Murdie et al., 1993). South of 43°S, the WB plane is not observable for the young age of the Antarctic slab, as proposed by Kirby et al. (1996), Lange et al. (2007), and Agurto-Detzel et al. (2014). This hypothesis is also supported by our finding that the younger slab corresponds to a narrower seismogenic zone. Besides, the oldest slab age of the Antarctic Plate (at the trench) is around 30 Ma, as Figure 1 shows. Therefore, old slabs do not exist south of the CTJ. In fact, the spreading ridge raises the temperature of the South America Plate to a much higher degree and leads to a much narrower seismogenic zone in the vicinity of the CTJ than our simulation results indicate. This may cause difficulties in observing the WB plane, while wedge subduction is not conducive to this phenomenon. Thus, the wedge subduction, slab age, and convergence rate have weaker effects than ridge subduction on the width of the seismogenic zone.
The focal depth is generally shallower south of, than north of, the CTJ (Agurto-Detzel et al., 2014). Because of the wedge subduction, the slab dip of the Antarctic Plate is smaller than that of the Nazca Plate (Slab dip section). Although the Antarctic slab is hotter and has a smaller dip than the Nazca slab, our results suggest that there is little difference between the depths of the seismogenic zones of wedge subduction and slab subduction (Table 1). The downdip limit depth of the seismogenic zone of Model 2 is approximately 1 km deeper than that of profile 2 (Model 4), but 10 km deeper than that of profile 1 (Model 1). Therefore, the effects of slab age and wedge subduction on the focal depth are smaller than that of convergence rate, and the difference between the convergence rate of the Antarctic Plate and that of the Nazca Plate is a main cause of the different focal depths to the south and north of the CTJ. To the north of the CTJ, slip distributions of a 900-km-long rupture zone terminate at a similar depth were inversed by Barrientos and Ward (1990) and Moreno et al. (2009) (Völker et al., 2011). Our results show that the downdip limit of the seismogenic zone increases by only about 2 km, while the slab age increases by 30 Ma, which is consistent with the results of Barrientos and Ward (1990) and Moreno et al. (2009). However, this is inconsistent with the statistics related to the focal depths of the area between 36°S and 40°S (Bohm et al., 2002). In conclusion, the CTJ is not only a wedge subduction boundary but also an important factor controlling the lithospheric thermal structure of the overriding plate. Without considering the spreading ridge beneath the South American plate, the differences in the slab dip, seismic distribution, and focal depth between the northern and southern sides of the CTJ are consistent with the results of our simulation controlled by the plate age, the wedge subduction, and the convergence rate.
Effect of dehydration and other processes
Several processes that occur in the subduction zone, such as shear heating, partial melting, hydrothermal cooling, and dehydration, were not covered in this study. Dehydration and partial melting are related to element recycling, intermediate and deep earthquakes, and double seismic zones (Seno et al., 2001; Li and Ni, 2020). Dehydration is essentially a result of the slab responding to the temperature and pressure change during subduction. Dehydration has significantly different effects in cold and hot subduction zones (Li and Ni, 2020). The subduction zone to the north of the CTJ is cold and that to the south is hot. The slab north of the CTJ can, thus, retain more water at greater depths, whereas the slab south of the CTJ dehydrates extensively at shallower depths. Shear heating and hydrothermal cooling are related to the thermal structure of the subduction zone. These processes and their occurrences north of the CTJ are discussed in Völker et al. (2011). The shear heating may give rise to a higher heat flow and a hotter slab south of the CTJ, corresponding to a narrower seismogenic zone; in contrast, the effect of hydrothermal circulation is the opposite of it, leading to a lower heat flow and a colder slab.
Complexity of the Subduction Process South of the Chile Triple Junction
The observed data of the area to the south of the CTJ are scant. In this paper, effects of the wedge subduction of Antarctica plate are determined based on 2D numerical simulations. However, south of the CTJ, the thermal structure and seismicity near the CTJ are mainly affected by the spreading ridge subduction, which is a very complex 3D process. In this study, we discuss the effect of wedge subduction on the vicinity of the CTJ only based on the results obtained for the area far away from the CTJ.
The geological conditions in the CTJ area are complex, particularly the lithospheric thermal structure, and the distribution of seismogenic zones are affected by a series of factors such as the ridge subduction, the slab window, the plate age, the slab dip, the hydrothermal circulation, volcanic activities, and the uneven thickness of the lithosphere. With the ridge subduction and other factors ruled out, the effects of the slab age and convergence rate on the lithospheric thermal structure and seismogenic zone were investigated in this paper. The results of our simulations, however, are still complex, especially those obtained for the forearc heat flow. In fact, compared with the plate age and convergence rate, the ridge subduction and the slab window have greater effects of on the thermal structure of the lithosphere of the area south of the CTJ, where the WB plane cannot be observed. Although a series of studies showed that the definition of the seismogenic zone in Klotz et al. (2006) is in good agreement with geological observations on the north of the CTJ, several limitations and uncertainties remain with respect to the mechanism controlling interplate earthquakes. For future research, we will consider the effects of the different factors during the ridge subduction in the CTJ area.
Conclusion
1) The difference between the slab dip north and south of the CTJ is considered due to wedge subduction. When the slabs are old and at the same age, the slab dips of slab subduction and wedge subduction are similar. When the slabs are young and at the same age, the Antarctic slab has a deep dip 22° smaller, a temperature higher, and a seismogenic zone 4 km narrower than those of the Nazca slab.
2) The slab age of the wedge subduction southward from the CTJ increases and leads to a larger slab dip, a colder slab in the horizontal direction, and a wider seismogenic zone.
3) The effect of the slab age of wedge subduction on the focal depth is smaller than that of the convergence rate. The difference between the convergence rate of the Antarctic and that of the Nazca plates plays a major role in the different focal depths to the south and north of the CTJ. The smaller the convergence rate, the shallower the seismogenic zone. A difference of 4.8 cm/year in the convergence rate of the wedge subduction processes results in an 11-km difference in the width of the seismogenic zone and a 10-km difference in the depth of the downdip limit.
4) The computed heat flow curves are consistent with the data obtained in the vicinity of the trench. The younger the plate is, the higher the maximum oceanic heat flow is in the vicinity of the trench. The oceanic heat flow reaches up to 427.0 mW/m2. The larger the convergence rate, the higher the maximum heat flow. A difference of 4.8 cm/year in the convergence rate of the wedge subduction processes leads to a heat flow difference of 133.7 mW/m2 in the oceanic plate and one of 23.7 mW/m2 in the forearc.
Data Availability Statement
Publicly available datasets were analyzed in this study. These data can be found here: The seismic data (1906–2021) for this study can be found in the ISC [International Seismological Centre (2021), On-line Bulletin (Bondár and Storchak, 2011; Storchak et al., 2017; 2020)] (https://doi.org/10.31905/D808B830). The heat flow data for this study can be found in Lucazeau (2019) (https://agupubs.onlinelibrary.wiley.com/doi/10.1029/2019GC008389).
Author Contributions
CG conceptualized the study, developed the methodology, performed the numerical simulation and validation, and wrote the manuscript. PS performed the investigation, data curation, and validation. DW acquired the funding and supervised the study.
Funding
This work was supported by the National Natural Science Foundation of China (41874115).
Conflict of Interest
The authors declare that the research was conducted in the absence of any commercial or financial relationships that could be construed as a potential conflict of interest.
Publisher’s Note
All claims expressed in this article are solely those of the authors and do not necessarily represent those of their affiliated organizations, or those of the publisher, the editors, and the reviewers. Any product that may be evaluated in this article, or claim that may be made by its manufacturer, is not guaranteed or endorsed by the publisher.
Acknowledgments
We would like to thank Dr. Lin Chen and Dr. Wei Leng for their constructive suggestions and comments. Some of the figures were generated using the Generic Mapping Tools (GMT) (Wessel et al., 2019).
References
Agurto-Detzel, H., Rietbrock, A., Bataille, K., Miller, M., Iwamori, H., and Priestley, K. (2014). Seismicity Distribution in the Vicinity of the Chile Triple Junction, Aysén Region, Southern Chile. J. South Am. Earth Sci. 51, 1–11. doi:10.1016/j.jsames.2013.12.011
Angermann, D., Klotz, J., and Reigber, C. (1999). Space-geodetic Estimation of the Nazca-South America Euler Vector. Earth Planet. Sci. Lett. 171, 329–334. doi:10.1016/S0012-821X(99)00173-9
Assumpção, M., Feng, M., Tassara, A., and Julià, J. (2013). Models of Crustal Thickness for South America from Seismic Refraction, Receiver Functions and Surface Wave Tomography. Tectonophysics 609, 82–96. doi:10.1016/j.tecto.2012.11.014
Bagherbandi, M., Bai, Y., Sjöberg, L. E., Tenzer, R., Abrehdary, M., Miranda, S., et al. (2017). Effect of the Lithospheric thermal State on the Moho Interface: A Case Study in South America. J. South Am. Earth Sci. 76, 198–207. doi:10.1016/j.jsames.2017.02.010
Barrientos, S. E., and Ward, S. N. (1990). The 1960 Chile Earthquake: Inversion for Slip Distribution from Surface Deformation. Geophys. J. Int. 103, 589–598. doi:10.1111/j.1365-246x.1990.tb05673.x
Billen, M. I., and Gurnis, M. (2001). A Low Viscosity Wedge in Subduction Zones. Earth Planet. Sci. Lett. 193 (1-2), 227–236. doi:10.1016/S0012-821X(01)00482-4
Bohm, M., Lüth, S., Echtler, H., Asch, G., Bataille, K., Bruhn, C., et al. (2002). The Southern Andes between 36° and 40°S Latitude: Seismicity and Average Seismic Velocities. Tectonophysics 356 (4), 275–289. doi:10.1016/S0040-1951(02)00399-2
Bondár, I., and Storchak, D. (2011). Improved Location Procedures at the International Seismological Centre. Geophys. J. Int. 186, 1220–1244. doi:10.1111/j.1365-246X.2011.05107.x
Bourgois, J., Lagabrielle, Y., Martin, H., Dyment, J., Frutos, J., and Cisternas, M. E. (2016). A Review on Forearc Ophiolite Obduction, Adakite-like Generation, and Slab Window Development at the chile Triple junction Area: Uniformitarian Framework for Spreading-ridge Subduction. Pure Appl. Geophys. 173 (10-11), 3217–3246. doi:10.1007/978-3-319-51529-8_2
Breitsprecher, K., and Thorkelson, D. J. (2009). Neogene Kinematic History of Nazca-Antarctic-Phoenix Slab Windows beneath Patagonia and the Antarctic Peninsula. Tectonophysics 464 (1-4), 10–20. doi:10.1016/j.tecto.2008.02.013
Cande, S. C., and Leslie, R. B. (1986). Late Cenozoic Tectonics of the Southern Chile Trench. J. Geophys. Res. 91, 471–496. doi:10.1029/JB091iB01p00471
Cande, S. C., Leslie, R. B., Parra, J. C., and Hobart, M. (1987). Interaction between the Chile Ridge and Chile Trench: Geophysical and Geothermal Evidence. J. Geophys. Res. 92 (B1), 495–520. doi:10.1029/JB092iB01p00495
Chen, L., Liu, L., Capitanio, F. A., Gerya, T. V., and Li, Y. (2020). The Role of Pre-existing Weak Zones in the Formation of the Himalaya and Tibetan Plateau: 3-D Thermomechanical Modelling. Geophys. J. Int. 221, 1971–1983. doi:10.1093/gji/ggaa125
Contreras-Reyes, E., Grevemeyer, I., Flueh, E. R., and Reichert, C. (2008). Upper Lithospheric Structure of the Subduction Zone Offshore of Southern Arauco peninsula, Chile, at ∼38°S°. J. Geophys. Res., 113(B07303), 1–19. doi:10.1029/2007JB005569
Davis, R. O., and Selvadurai, A. P. S. (2002). Plasticity and Geomechanics. Cambridge University Press.
Flueh, E. R., Vidal, N., Ranero, C. R., Hojka, A., von Huene, R., Bialas, J., et al. (1998). Seismic Investigation of the continental Margin off- and Onshore Valparaiso, Chile. Tectonophysics 288, 251–263. doi:10.1016/S0040-1951(97)00299-0
Forsythe, R. D., Nelson, E. P., Carr, M. J., Kaeding, M. E., Herve, M., Mpodozis, C., et al. (1986). Pliocene Near-Trench Magmatism in Southern Chile: A Possible Manifestation of ridge Collision. Geol 14, 3–27. doi:10.1130/0091-7613(1986)14<23:PNMISC>2.0.CO;2
Forsythe, R., and Nelson, E. (1985). Geological manifestations of ridge collision: evidence from the Golfo de Penas-Taitao Basin, southern Chile. Tectonics 4, 477–495. doi:10.1029/TC004i005p00477
Gleason, G. C., and Tullis, J. (1995). A Flow Law for Dislocation Creep of Quartz Aggregates Determined with the Molten Salt Cell. Tectonophysics 247 (1-4), 1–23. doi:10.1016/0040-1951(95)00011-B
Glerum, A., Thieulot, C., Fraters, M., Blom, C., and Spakman, W. (20182018). Nonlinear Viscoplasticity in ASPECT: Benchmarking and Applications to Subduction. Solid Earth 9 (2), 267–294. doi:10.5194/se-9-267-2018
Hamza, V. M., Dias, F. J. S. S., Gomes, A. J. L., and Terceros, Z. G. D. (2005). Numerical and Functional Representations of Regional Heat Flow in South America. Phys. Earth Planet. Interiors 152, 223–256. doi:10.1016/j.pepi.2005.04.009
Hirth, G., and Kohlstedt, D. (2003). Rheology of the Upper Mantle and the Mantle Wedge: A View from the Experimentalists. Geophys. Monogr., 83–105. doi:10.1029/138GM06
Holt, A. F., Buffett, B. A., and Becker, T. W. (2015). Overriding Plate Thickness Control on Subducting Plate Curvature. Geophys. Res. Lett. 42 (10), 3802–3810. doi:10.1002/2015GL063834
Jadamec, M. A., Billen, M. I., and Roeske, S. M. (2013). Three-dimensional Numerical Models of Flat Slab Subduction and the Denali Fault Driving Deformation in South-central Alaska. Earth Planet. Sci. Lett. 376, 29–42. doi:10.1016/j.epsl.2013.06.009
Jarrard, R. D. (1986). Relations Among Subduction Parameters. Rev. Geophys. 24 (2), 217–284. doi:10.1029/RG024i002p00217
Ji, Y., Yoshioka, S., Manea, V. C., Manea, M., and Suenaga, N. (2019). Subduction thermal Structure, Metamorphism and Seismicity beneath north-central Chile. J. Geodynamics 129, 299–312. doi:10.1016/j.jog.2018.09.004
Johnson, C. (1997). RANALLI, G. 1995. Rheology of the Earth, 2nd Ed. Xv + 413 Pp. London, Glasgow, Weinheim, New York, Tokyo, Melbourne, Madras: Chapman & Hall. Price £29.95 (Paperback). ISBN 0 412 54670 1, 2nd Ed. London. Geol. Mag.Geological Mag. 134 (3), 409–421. doi:10.1017/S0016756897226981
Kirby, S., Engdahl, E. R., and Denlinger, R. (1996). Geophysical Monograph Series. Washington D.C: American Geophysical Union, 195–214.Intermediate-depth Intraslab Earthquakes and Arc Volcanism as Physical Expressions of Crustal and Uppermost Mantle Metamorphism in Subducting Slabs
Klotz, J., Abolghasem, A., Khazaradze, G., Heinze, B., Vietor, T., Hackney, R., et al. (2006). The Andes-Active Subduction Orogeny, 65–89. doi:10.1007/978-3-540-48684-8_4Long-Term Signals in the Present-Day Deformation Field of the Central and Southern Andes and Constraints on the Viscosity of the Earth's Upper Mantle
Kronbichler, M., Heister, T., and Bangerth, W. (2012). High Accuracy Mantle Convection Simulation through Modern Numerical Methods. Geophys. J. Int. 191 (1), 12–29. doi:10.1111/j.1365-246X.2012.05609.x
Lagabrielle, Y., Guivel, C., Maury, R. C., Bourgois, J., Fourcade, S., and Martin, H. (2000). Magmatic-tectonic Effects of High thermal Regime at the Site of Active ridge Subduction: the Chile Triple Junction Model. Tectonophysics 326, 255–268. doi:10.1016/S0040-1951(00)00124-4
Lallemand, S., Heuret, A., and Boutelier, D. (2005). On the Relationships between Slab Dip, Back-Arc Stress, Upper Plate Absolute Motion, and Crustal Nature in Subduction Zones. Geochem. Geophys. Geosyst. 6, a–n. AGU Fall Meeting Abstracts. doi:10.1029/2005GC000917
Lange, D., Rietbrock, A., Haberland, C., Bataille, K., Dahm, T., Tilmann, F., et al. (2007). Seismicity and Geometry of the South Chilean Subduction Zone (41.5°S-43.5°S): Implications for Controlling Parameters. Geophys. Res. Lett. 34, L06311. doi:10.1029/2006GL029190
Leng, W., and Gurnis, M. (2015). Subduction Initiation at Relic Arcs. Geophys. Res. Lett. 42 (17), 7014–7021. doi:10.1002/2015GL064985
Leng, W., and Sun, Y. D. (2019). Numerical Studies of thermal Structure for the continental Subduction Zones. Earth Sci. 44 (12), 3993–3997 [in Chinese with English abstract]. doi:10.3799/dqkx.2019.253
Li, W., and Ni, H. (2020). Dehydration at Subduction Zones and the Geochemistry of Slab Fluids. Sci. China Earth Sci. 63 (12), 1925–1937. doi:10.1007/s11430-019-9655-1
Li, Z. H., and Shi, Y. L. (2016). Constraints of 3-D Plate Geometry on the Dynamics of continental Deep Subduction. Chin. J. Geophys. 59 (8), 2806–2817. (in Chinese with English abstract). doi:10.6038/cjg20160808
Liu, M. X., Wei, D. P., and Shi, Y. N. (2019). Effect of Plate Interface Geometry on the Evolution of Subduction. Chin. J. Geophys. 62 (1), 78–87. (in Chinese with English abstract).
Lucazeau, F. (2019). Analysis and Mapping of an Updated Terrestrial Heat Flow Data Set. Geochem. Geophys. Geosyst. 20 (8), 4001–4024. doi:10.1029/2019GC008389
Maksymowicz, A., Contreras-Reyes, E., Grevemeyer, I., and Flueh, E. R. (2012). Structure and Geodynamics of the post-collision Zone between the Nazca-Antarctic Spreading center and South America. Earth Planet. Sci. Lett. 345-348, 27–37. doi:10.1016/j.epsl.2012.06.023
Moreno, M. S., Bolte, J., Klotz, J., and Melnick, D. (2009). Impact of Megathrust Geometry on Inversion of Coseismic Slip from Geodetic Data: Application to the 1960 Chile Earthquake. Geophys. Res. Lett. 36, L16310. doi:10.1029/2009GL039276
Murdie, R. E., Prior, D. J., Styles, P., Flint, S. S., Pearce, R. G., and Agar, S. M. (1993). Seismic Responses to ridge-transform Subduction:Chile Triple junction. Geol 21, 1095–1098. doi:10.1130/0091-7613(1993)021<1095:srtrts>2.3.co;2
Naliboff, J., and Buiter, S. J. H. (2015). Rift Reactivation and Migration during Multiphase Extension. Earth Planet. Sci. Lett. 421, 58–67. doi:10.1016/j.epsl.2015.03.050
Oleskevich, D. A., Hyndman, R. D., and Wang, K. (1999). The Updip and Downdip Limits to Great Subduction Earthquakes: Thermal and Structural Models of Cascadia, South Alaska, SW Japan, and Chile. J. Geophys. Res. 104, 14965–14991. doi:10.1029/1999JB900060
Richards, F. D., Hoggard, M. J., Cowton, L. R., and White, N. J. (2018). Reassessing the Thermal Structure of Oceanic Lithosphere with Revised Global Inventories of Basement Depths and Heat Flow Measurements. J. Geophys. Res. Solid Earth 123, 9136–9161. doi:10.1029/2018JB015998
Rotman, H. M. M., and Spinelli, G. A. (2014). Remarkably Consistent thermal State of the South central Chile Subduction Zone from 36°S to 45°S. J. Geophys. Res. Solid Earth 119, 3503–3516. doi:10.1002/2013JB010811
Rybacki, E., Gottschalk, M., Wirth, R., and Dresen, G. (2006). Influence of Water Fugacity and Activation Volume on the Flow Properties of fine-grained Anorthite Aggregates. J. Geophys. Res. 111, a–n. doi:10.1029/2005JB003663
Scherwath, M., Contreras-Reyes, E., Flueh, E. R., Grevemeyer, I., Krabbenhoeft, A., Papenberg, C., et al. (2009). Deep Lithospheric Structures along the Southern central Chile Margin from Wide-angleP-Wave Modelling. Geophys. J. Int. 179, 579–600. doi:10.1111/j.1365-246X.2009.04298.x
Scherwath, M., Flueh, E., Grevemeyer, I., Tillman, F., Contreras-Reyes, E., and Weinrebe, W. (2006). Investigating Subduction Zone Processes in Chile. Eos Trans. AGU 87 (27), 265. doi:10.1029/2006EO270001
Seno, T., Zhao, D., Kobayashi, Y., and Nakamura, M. (2001). Dehydration of Serpentinized Slab Mantle: Seismic Evidence from Southwest Japan. Earth Planet. Sp 53, 861–871. doi:10.1186/BF03351683
Seton, M., Müller, R. D., Zahirovic, S., Williams, S., Wright, N. M., Cannon, J., et al. (2020). A Global Data Set of Present‐Day Oceanic Crustal Age and Seafloor Spreading Parameters. Geochem. Geophys. Geosyst. 21, 1–15. doi:10.1029/2020GC009214
Simmons, N. A., Forte, A. M., Boschi, L., and Grand, S. P. (2010). GyPSuM: A Joint Tomographic Model of Mantle Density and Seismic Wave Speeds. J. Geophys. Res. 115, B12310. doi:10.1029/2010JB007631
Stein, C. A., and Stein, S. (1992). A Model for the Global Variation in Oceanic Depth and Heat Flow with Lithospheric Age. Nature 359 (6391), 123–129. doi:10.1038/359123a0
Storchak, D. A., Harris, J., Brown, L., Lieser, K., Shumba, B., and Di Giacomo, D. (2020). Rebuild of the Bulletin of the International Seismological Centre (ISC)-part 2: 1980-2010. Geosci. Lett. 7, 18. doi:10.1186/s40562-020-00164-6
Storchak, D. A., Harris, J., Brown, L., Lieser, K., Shumba, B., Verney, R., et al. (2017). Rebuild of the Bulletin of the International Seismological Centre (ISC), Part 1: 1964-1979. Geosci. Lett. 4, 32. doi:10.1186/s40562-017-0098-z
Tang, J., Chen, L., Meng, Q., and Wu, G. (2020). The Effects of the thermal State of Overriding continental Plate on Subduction Dynamics: Two-Dimensional thermal-mechanical Modeling. Sci. China Earth Sci. 63, 1519–1539. doi:10.1007/s11430-019-9624-1
Tebbens, S. F., Cande, S. C., Kovacs, L., Parra, J. C., LaBrecque, J. L., and Vergara, H. (1997). The Chile ridge: A Tectonic Framework. J. Geophys. Res. 102, 12035–12059. doi:10.1029/96JB02581
Tetreault, J. L., and Buiter, S. J. H. (2012). Geodynamic Models of Terrane Accretion: Testing the Fate of Island Arcs, Oceanic Plateaus, and continental Fragments in Subduction Zones. J. Geophys. Res. 117 (B8), a–n. doi:10.1029/2012JB009316
Tichelaar, B. W., and Ruff, L. J. (1991). Seismic Coupling along the Chilean Subduction Zone. J. Geophys. Res. 96 (B7), 11997. doi:10.1029/91JB00200
van der Hilst, R. D., and de Hoop, M. V. (2005). Banana-doughnut Kernels and Mantle Tomography. Geophys. J. Int. 163, 956–961. doi:10.1111/j.1365-246X.2005.02817.x
van der Meijde, M., Julià, J., and Assumpção, M. (2013). Gravity Derived Moho for South America. Tectonophysics 609, 456–467. doi:10.1016/j.tecto.2013.03.023
Völker, D., Grevemeyer, I., Stipp, M., Wang, K., and He, J. (2011). Thermal Control of the Seismogenic Zone of Southern central Chile. J. Geophys. Res. 116, 1–20. doi:10.1029/2011JB008247
Wang, K., Hu, Y., Bevis, M., Kendrick, E., Smalley, R., Vargas, R. B., et al. (2007). Crustal Motion in the Zone of the 1960 Chile Earthquake: Detangling Earthquake-Cycle Deformation and Forearc-Sliver Translation. Geochem. Geophys. Geosyst. 8, a–n. doi:10.1029/2007GC001721
Wang, S., Yu, H., Zhang, Q., and Zhao, Y. (2018). Absolute Plate Motions Relative to Deep Mantle Plumes. Earth Planet. Sci. Lett. 490, 88–99. doi:10.1016/j.epsl.2018.03.021
Wang, Z. S., and Wei, D. P. (2018). Research Progress on the Formation and Evolution of Triple Junctions of Global Plate Motions. Prog. Geophys. 33 (5), 1834–1843 [in Chinese with English abstract]. doi:10.6038/pg2018BB0286
Wessel, P., Luis, J. F., Uieda, L., Scharroo, R., Wobbe, F., Smith, W., et al. (2019). The Generic Mapping Tools Version 6. Geochem. Geophys. Geosyst. 20, 5556–5564. doi:10.1029/2019GC008515
Wilks, K. R., and Carter, N. L. (1990). Rheology of Some continental Lower Crustal Rocks. Tectonophysics 182 (1-2), 57–77. doi:10.1016/0040-1951(90)90342-6
Xu, J. J., Wang, Z. S., Wang, S. P., and Wei, D. P. (2019). Numerical Simulation of the Lithospheric thermal Structure in the Subduction Zone of the South Chile Triple junction. Chin. J. Geophys. 62 (12), 4729–4737. [in Chinese with English abstract]. doi:10.6038/cjg2019M0592
Keywords: Chile Triple Junction, wedge subduction, seismogenic zone, plate age, thermal structure, numerical simulation
Citation: Guo C, Sun P and Wei D (2021) Numerical Simulation of the Effects of Wedge Subduction on the Lithospheric Thermal Structure and the Seismogenic Zone South of Chile Triple Junction. Front. Earth Sci. 9:782458. doi: 10.3389/feart.2021.782458
Received: 24 September 2021; Accepted: 09 November 2021;
Published: 21 December 2021.
Edited by:
Lijun Liu, University of Illinois at Urbana-Champaign, United StatesReviewed by:
Lin Chen, Institute of Geology and Geophysics (CAS), ChinaWei Leng, University of Science and Technology of China, China
Copyright © 2021 Guo, Sun and Wei. This is an open-access article distributed under the terms of the Creative Commons Attribution License (CC BY). The use, distribution or reproduction in other forums is permitted, provided the original author(s) and the copyright owner(s) are credited and that the original publication in this journal is cited, in accordance with accepted academic practice. No use, distribution or reproduction is permitted which does not comply with these terms.
*Correspondence: Dongping Wei, dongping@ucas.ac.cn