Variability in Soil Moisture by Natural and Artificial Snow: A Case Study in Mt. Balwang Area, Gangwon-do, South Korea
 Yalalt Nyamgerel
 Hyejung Jung
 Dong-Chan Koh
 Kyung-Seok Ko
 Jeonghoon Lee
- 1Department of Science Education, Ewha Womans University, Seoul, South Korea
- 2Korea Institute of Geoscience and Mineral Resources, Daejeon, South Korea
Soil moisture is an important variable for understanding hydrological processes, and the year-round monitoring of soil moisture and temperature reflect the variations induced by snow cover and its melt. Herein, we monitored the soil moisture and temperature in high (two sites) and low (two sites) elevation regions with groundwater sampling near the Mt. Balwang area in Gangwon-do, South Korea from Sep 2020 to May 2021. This study aims to investigate the temporal and spatial variations in soil moisture and temperature due to snow (natural and artificial snow) and its melt. A ski resort has been operating in this area and has been producing artificial snow during winter periods; thus, the spring snowmelt comprises both natural and artificial snow. The effect of soil freezing and thawing, wind conditions, vegetation covers, the timing and intensity of snow cover and snowmelt were differed in the monitoring sites. The high elevation sites 1 and 2 exhibit the relatively longer and consistent snow cover than the low elevation sites. Particularly, site 2 show late (May 8) snow melting even this site is in south slope of the Mt. Balwang. The relatively steady and moist soil layers at sites 1, 2, and 3 during the warm period can be considered as influential points to groundwater recharge. Moreover, the differences between the mean δ18O (−9.89‰) of the artificial snow layers and other samples were low: in the order of surface water (0.04‰) >groundwater (−0.66 and −1.01‰) >natural snow (1.34 and −3.80‰). This indicates that the imprint of artificial snow derived from surface water and with decreasing amount of natural snow around the Mt. Balwang region, the results support the assumption that the potential influence of artificial snowmelt on groundwater quality. This study helps to understand the snow dynamic and its influence on the hydrological processes in this region by combining the hydro-chemical and isotopic analysis.
Introduction
Water entry into soil and its movement plays an essential role in surface runoff, groundwater recharge, evapotranspiration, soil erosion, and chemicals transport in surface and subsurface waters (Rawls et al., 1993). Soil moisture changes spatially and temporally (Brocca et al., 2010), and it is a key parameter in hydrological and climatic models (An et al., 2017; Vogel et al., 2017; Karthikeyan et al., 2017; Ye et al., 2019), and climate change studies (May et al., 2015). Moreover, soil moisture determines the partitioning of the incoming solar radiation and long wave radiation into outgoing long wave radiation, latent heat flux, ground heat flux, and sensible heat flux (Pachepsky et al., 2003). Furthermore, the direct infiltration of precipitation and surface water through thin soil layers into the underground affects the water availability for agricultural demands and water resources in many alpine regions (Hartmann et al., 2014; Wei et al., 2021).
Spring snowmelt and its infiltration play a crucial role in the annual water budget in many temperate catchments (Smith et al., 2017). The timing of snow cover and snowmelt is important for downstream water and groundwater supplies. Additionally, the snow cover thickness affects the soil freeze–thaw cycle and changes the soil aggregate stability (Xiao et al., 2019). The changes in snowmelt period and duration of snow-covered period are also essential for the operation of ski resorts (Heo and Lee, 2010). From 1987 to 2016, the snowmelt season has been observed to occur earlier in the High Mountain Asia region mainly due to the recent increase in the air temperature (Lee et al., 2012). However, the increasing trend in the snowmelt season in some regions is related to the changes in the snowmelt regime (Smith et al., 2017). Identifying snow and snowmelt seasons in heterogeneous environments like High Mountain Asia regions, is generally difficult (Smith et al., 2017). Moreover, the artificial snow produced for ski sports affects the timing of the snowmelt and ground temperatures in the alpine environments. Deep artificial snow acts as an insulator that prevents soil from freezing, and massive artificial snow induces long snow covers (Rixen et al., 2004). Compared to natural snow, artificial snow is more homogenous and contains spherical crystals and more ice layers. Furthermore, the large mass of artificial snow slows down the melting process (Mosimann, 1987). The potential influence on the vegetation cover (Jones et al., 2001; Rixen et al., 2003) and the physical disruption by frozen soil also affects the soil biogeochemistry (e.g., increase in soil nitrate and changes in soil carbon) (Groffman et al., 2001).
At large scale, surface soil moisture can be determined by measuring the brightness temperature as an intensity of natural thermal emission on the land surface using aircraft and satellite instruments with active and passive microwave sensors (Pachepsky et al., 2003). However, ground-based measurements of soil moisture and temperature are more direct and accurate for determining the watershed hydrology, which is difficult to measure using the microwave sensors that are designated for large-scale measurements (Choi et al., 2010). Fifteen to thirty-five observations are required to obtain a mean value within 2% absolute error for areas with complex topography (Brocca et al., 2010). The soil moisture determined using microwave instruments (AMSR-E and MODIS NDVI) is weakly correlated with the ground-based soil moisture measurements (Choi et al., 2010). Soil moisture varies seasonally and exhibits lower values in the winter (frozen soil) and higher values in the warm period, and it affects the precipitation and vegetation cover (Choi et al., 2010; Wei et al., 2021). Moreover, the uncertainties in the in-situ sensors increases with variability in soil properties and intensity of recharge events (Wu et al., 2021). Soil temperature sensors placed 2–10 cm below the soil surface have also been used to detect the presence or absence of snow cover (Lundquist and Lott, 2008; Schmid et al., 2012). By comparing the continuous long-term measurement of soil moisture and temperature by in-situ sensors with meteorological data (e.g., precipitation and air temperature), the increase in soil moisture by precipitation and melting of frozen ices in the soils was determined (Seo et al., 2020). Moreover, a year-round measurement using the 5TM (Decaton, United States) sensors was effectively performed to study the thermal diffusivity and active layer thickness in cold environment (Barton Peninsula, Antarctica) (Kim et al., 2020). Additionally, the snowmelt from a seasonal snowpack or ice and its isotopic (δ18O and δD) variation are important parameters for studying the snowmelt hydrology, particularly for the accurate hydrograph separation of spring runoff (Taylor et al., 2002; Lee et al., 2010; Lee, 2014a; Kim et al., 2017; Ham et al., 2019).
This study focuses on the field observation of soil moisture and temperature in heterogeneous mountain area where the effect of snow cover and snowmelt, especially from artificial snow (ski resort) to the catchment hydrology has not been studied. Lee et al. (2012) reported that the air temperature (1972–2010) in this area increased with large variation in annual precipitation amount. The erosion of sediments, nutrients pollutants from mountainous watersheds during typhoons (Zhang et al., 2007) has been observed; thus, the effects of extreme hydrologic events induced by climate change are important (Park et al., 2010). Additionally, the increasing intensity of summer monsoon has been affecting the water quality in many reservoirs and rivers (Park et al., 2010), and the intensity and frequency are expected to be increase in the future (Kim et al., 2018). Moreover, the decrease in winter snowfall (natural snow) (Lee et al., 2012) could increase the use of artificial snow and consequently the contribution of artificial snowmelt during the spring melting season. We have installed in-situ sensors of soil moisture and temperature at high and low elevation sites in the Mt. Balwang area. This study aims to analyze the temporal and spatial changes in soil moisture caused by natural and artificial snow cover and its melting. Furthermore, the meteorological data from nearby automatic weather stations are compared with the monitoring data. The detection of soil moisture changes and snowmelt timing with hydro-chemical analysis of groundwater, surface water, rainwater, natural and artificial snow would help to understand the snow dynamics and its influence on hydrological processes.
Study Area and Methods
The monitoring sites are located within approximately 5.5 km range near to the Mt. Balwang area (720–1,458 m a.s.l) in Pyeongchang township, Gangwan-do province, South Korea, where the 2018 Winter Olympics were held. Specifically, the area of Daegwallyeong-myeon of Pyeongchang township, where Mt. Balwang is located, is 221.69 km2, and the amount of groundwater used is 1,145.40 × 103 m3/year (data from 2014). The groundwater usage portion is as follows: 50.0% for living, 47.0% for agriculture and fishery, and 2.9% for industrial use (K-water, 2015). Agricultural activities are very active due to the vegetable farming and large-scale ranches at high altitudes, and most of the land other than agricultural land constitutes forests (Lee, 2014b). The monitoring sites are within the operational area of the Yongpyong ski resort (total area 17.4 km2) and artificial snow produced using surface water is used for winter ski sports. In this region, the human activities are particularly enhanced during ski seasons (November–April) mainly due to the tourists at the ski resort. The Mt. Balwang area is composed of Permian–Triassic sandstones and shales and late Jurassic granites that intruded into the sedimentary layer (Won and Lee, 1992). The sedimentary rocks and granites are distributed in the southern and northern part of the study regions (Won and Lee, 1992; Kwon, 2001). According to the Unified Soil Classification System (USCS), the soil in the study area is mainly sandy and contains clay and silt and it is classified into well-graded sand (SW, SW-SM and SW-SC), but some soil layers classified as poorly-graded sands (SP-SM and SP-SC) (Kim et al., 2020). Based on the pumping tests performed on the groundwater well (300 m depth) of Mt. Balwang in 2018 and 2019; the hydraulic conductivity was 1.91 × 10⁻⁷ and 5.94 × 10⁻⁸ m/s, respectively. Moreover, the aquifer thickness was 228 and 251.94 m, respectively. Based on these results, it was determined that the aquifer material was predominantly silty sand.
In this region, the accumulated annual precipitation was observed to be 1,317.78 ± 296.19 mm and the minimum and maximum temperatures reached −7.35 ± 1.74°C (Jan or Dec) and 21.15 ± 0.83°C (July or August), respectively between 2010 and 2020 according to the Daegwanryeong automatic weather station (AWS) (https://data.kma.go.kr). Around 77% of the total precipitation occurred in the warm period (summer and autumn) as a form of rain and the residual 23% of the precipitation occurred in the cold period (spring and winter) as a form of both snow and rain.
Frequency domain reflectometry sensors of soil moisture and soil temperature (TEROS 12 by METER Group, Inc., United States) were installed at four locations at different depth intervals: top (8–12 cm) and bottom (20.5–32.5 cm) (Figures 1, 2; Table 1). The observations were performed from September 25, 2020, to May 21, 2021, to cover both warm and cold seasons. Note that the monitoring duration and depth intervals slightly differed between the sites and there was some data loss inducing discontinuity. The observations from Nov 3, 2020, to Apr 14, 2021 (coincided period), were compared to study the spatial differences between the sites (Table 2; Figures 3, 4). The sensor accuracy for soil moisture (volumetric water content or VWC) is ±0.03 m3/m3 for typical mineral soils. Concerning the temperature measurement, the sensors operate within the range from −40 to 60°C temperature range with the accuracy of ±0.3°C (for −40 to 0°C) to 0.5°C (for 0–60°C). Two sensors were placed at high elevations on the north (Site 1) and south (Site 2) slopes of Mt. Balwang that are surrounded by trees (Figure 2). A relatively thick accumulation of snow layers was expected in these two high elevation sites. At site 1 we expect dominant accumulation of artificial snow while site 2 receives mainly natural snow (Table 1). At the lower elevation (770 and 720 m a.s.l) sites (site 3 and 4), which are not forested areas (open area), patchy natural snow accumulation was expected. Site 3 was on the bottom slope of Mt. Balwang while site 4 was beside the river.
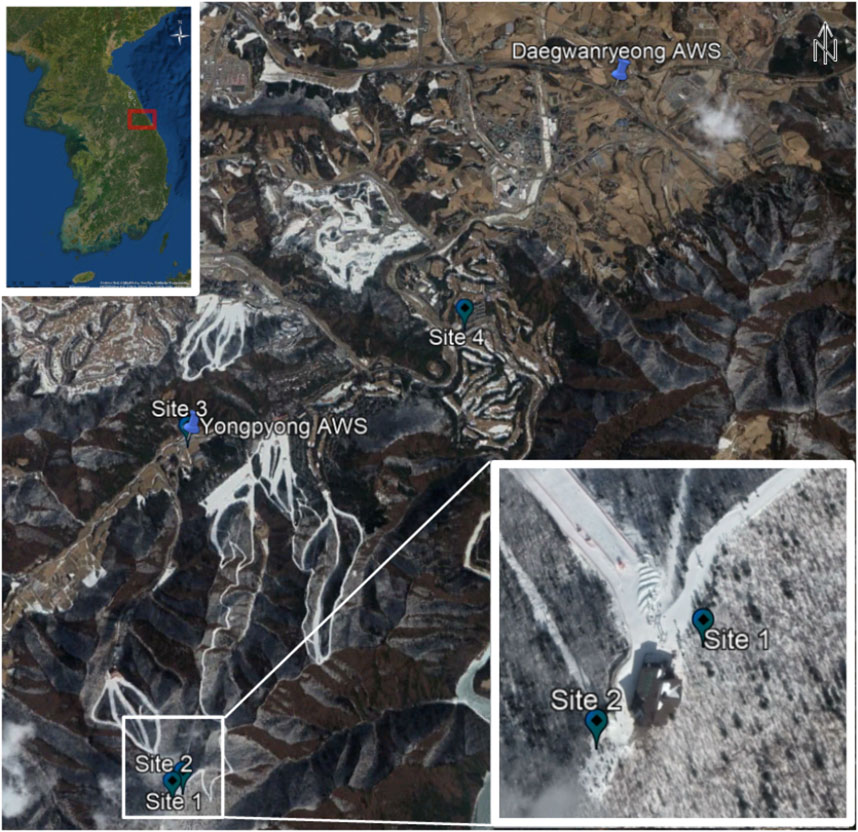
FIGURE 1. Location of the four monitoring sites and two automatic weather stations (Yongpyong AWS and Daegwangryeong AWS) in the Mt. Balwang region, Gangwon-do, South Korea. Both high elevation sites (Site 1 and Site 2) and low elevation sites (Site 3 and Site 4) are located in the operational area of the Yongpyong ski resort.
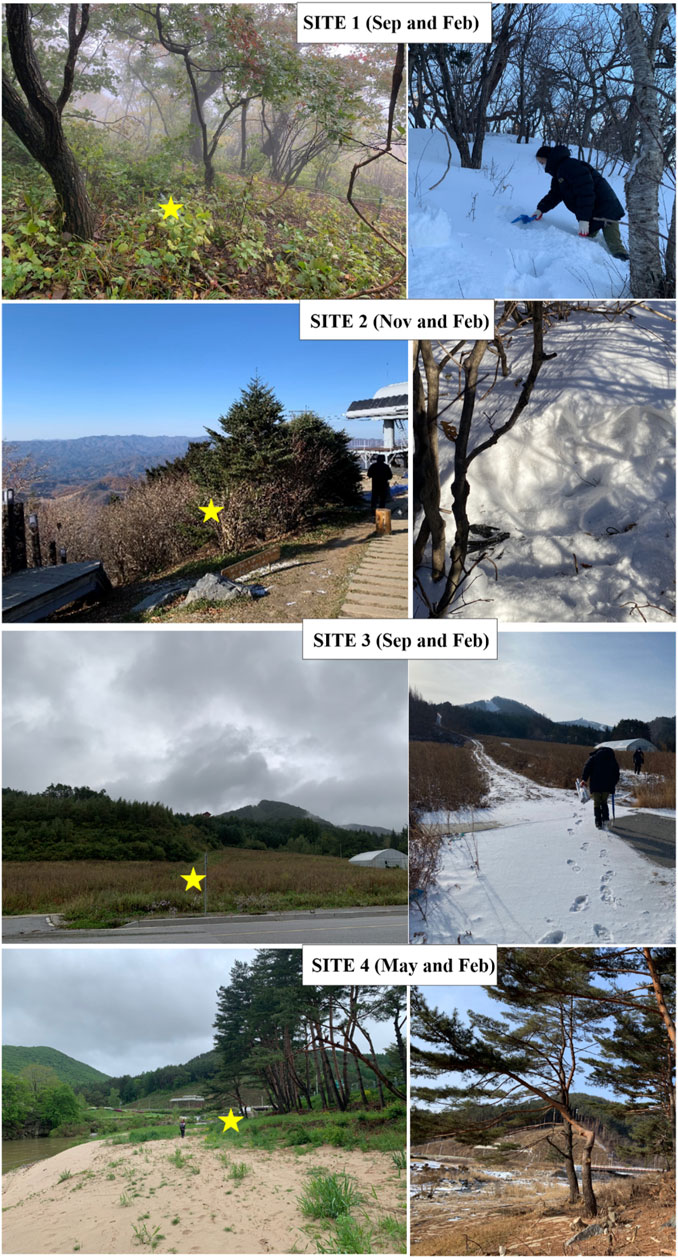
FIGURE 2. Site description by surface topography, snow coverage, vegetation coverage, and wind field (open or close area). Yellow stars indicate the approximate location of the sensors.
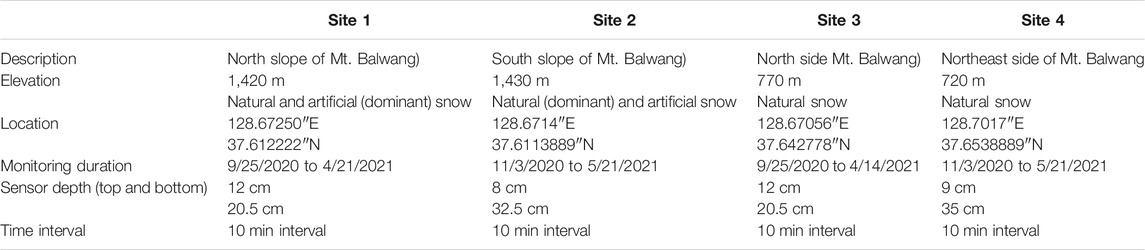
TABLE 1. Monitoring site information.
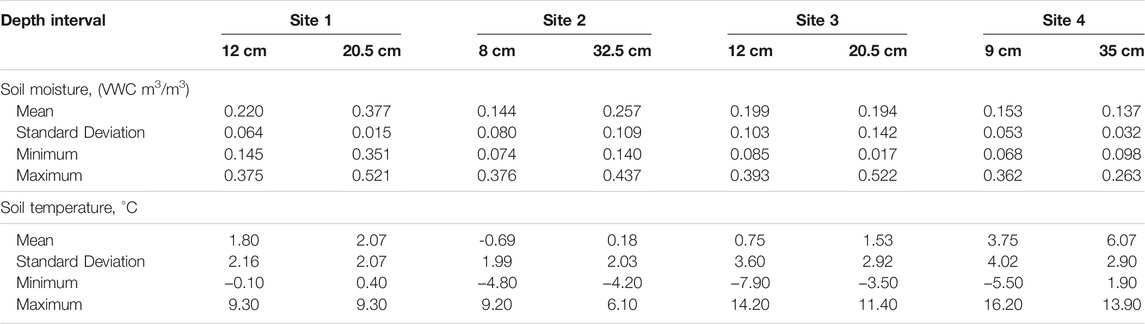
TABLE 2. Comparison of mean, standard deviation, minimum, maximum of soil moisture and soil temperatures at monitoring sites during the observation between Nov 3, 2020, to 14 Apr 2021.
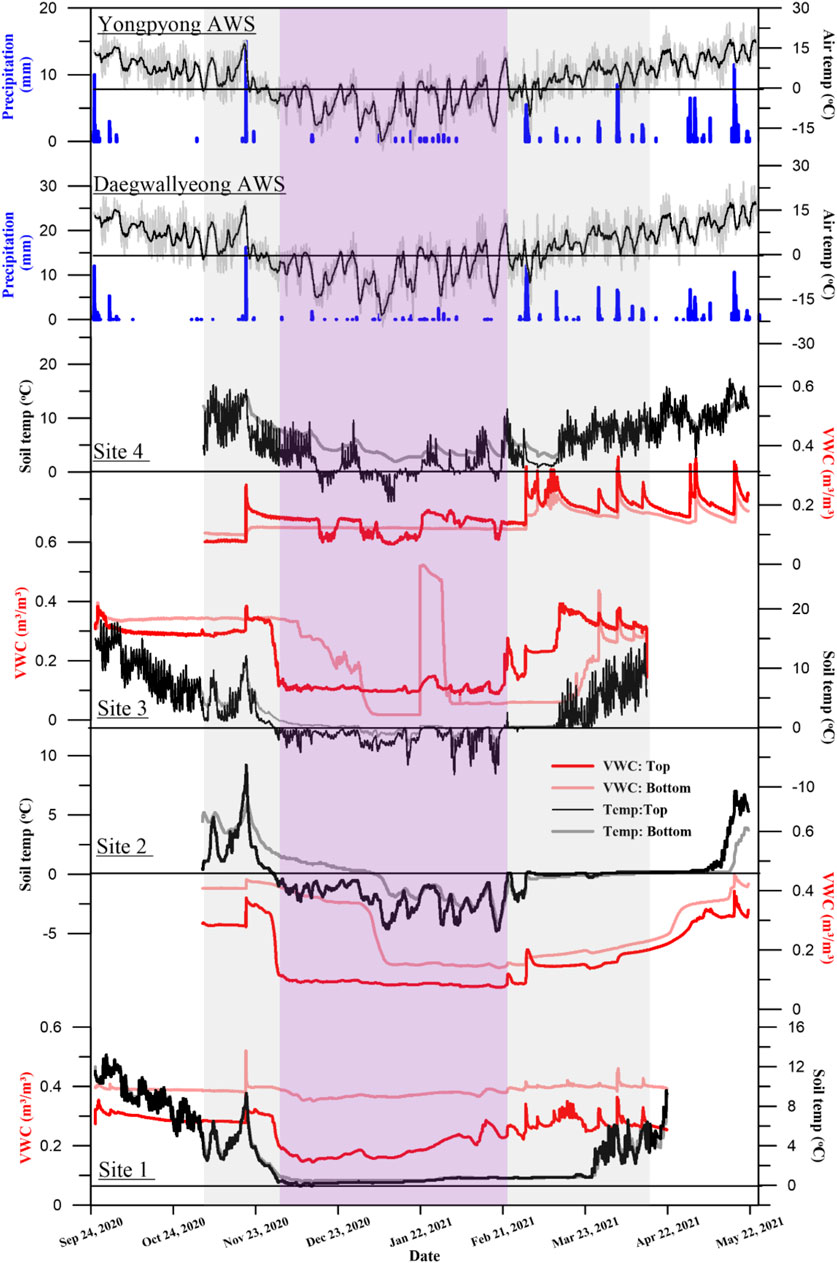
FIGURE 3. Temporal variation of soil moisture (VWC) and soil temperature from the monitoring data in comparison with the precipitation and air temperature data from the automatic weather stations (Yongpyong and Daegwallyeong). Black lines indicate 0°C temperature, the gray shaded area denotes the period from Nov 3, 2020, to Apr 14, 2021, while the purple shaded area highlights the conditions during the cold period (snow cover and soil freezing)
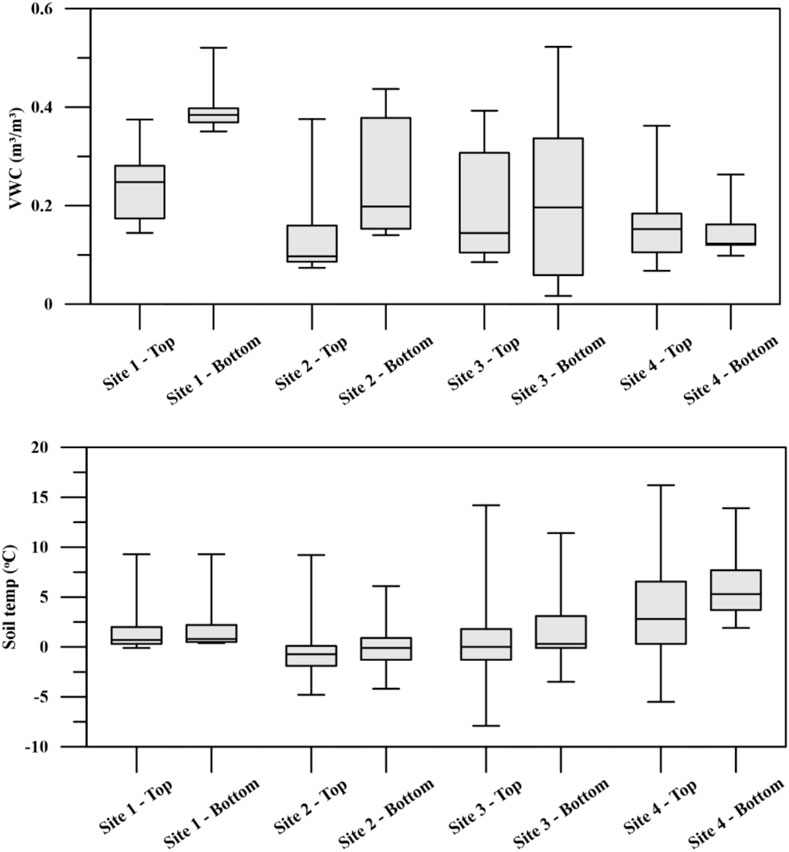
FIGURE 4. Box plot of soil moisture and soil temperature at the four sites during the period from Nov 3, 2020 to Apr 14, 2021.
The temperature and moisture observations by the sensors placed in the top layer (8–12 cm) were used to identify the presence of the snow cover (Taras et al., 2002; Lundquist and Lott, 2008; Schmid et al., 2012; Zhang et al., 2021). The mean daily standard deviations (MDr) of soil temperature and moisture values were calculated to evaluate the duration of snow cover and the signal of snow melting. To identify the presence of snow cover, we subtracted the MDr values from the threshold value 0.2 (Schmid et al., 2012). If the MDr>0, we expect the insulating snow cover over the surface snow. Also, we consider the soil surface temperature (top layer) below to 0°C as soil freezing. Thereafter, the meteorological data from Yongpyong and Daegwanryeong weather stations were compared with the monitoring data. The Yongpyong AWS is near site 3 while Daegwanryong AWS is approximately 3–9 km from the monitoring sites (Figure 1).
Finally, two snow pits of natural (50 cm deep) and artificial snow (100 cm deep) were dug at high elevation sites using a plastic scoop on Feb 10, 2021. The groundwater samples from two wells (150 and 250 m depth) near the high elevation sites (site 1 and 2) and the surface water that was used for artificial snowmaking were also collected at this time. The major ionic and water isotopic compositions of the samples were analyzed at the Korea Institute of Geoscience and Mineral Resources (KIGAM). Cations were analyzed using inductively coupled plasma-atomic emission spectrometry (Optima 7300DV, Perkin Elmer, Waltham, MA, United States) and anions were analyzed using ion chromatography (Dionex Aquion, Sunnyvale, CA, United States). The oxygen and hydrogen isotopic compositions of the samples were measured via cavity ring-down spectroscopy (L2140-i, Picarro, Santa Clara, CA, United States). The results were reported in δ-notation (‰) relative to the Vienna Standard Mean Ocean Water (VSMOW 2). The primary standards including VSMOW2, Greenland Ice Sheet Precipitation and Standard Light Antarctic Precipitation by the International Atomic Energy Agency, as well as KIGAM laboratory standards were used to calibrate the stable isotopic compositions. The analytical uncertainties of δ18O and δD were 0.1 and 0.5‰, respectively (Jung et al., 2013).
Results and Discussion
Temporal Variations of Soil Moisture and Soil Temperature
Figure 3 shows the temporal (whole monitoring period) variations of soil moisture and temperature at the top and bottom depths for the four sites. Table 2 and Figure 4 display the comparison of the soil moisture and temperatures measured during Nov 3, 2020, to Apr 14, 2021, and this period is highlighted with gray in Figure 3. The soil moisture and temperature variations were distinct for each site, exemplifying the different soil characteristics and meteorological conditions at each site. The patterns of soil moisture and soil temperature measurements in the top layers fluctuated more and show exhibited quicker responses to the abrupt temperature change and rainfall events than those in the bottom layers. Except for site 4, the soil moisture in the bottom layers was generally higher than that in the top layers, indicating the importance of vertical infiltration (Kim and Jung, 2014). The significant peak corresponding to the rainfall input and the relatively steady and moist soil layers at sites 1, 2, and 3 during the warm period (except the cold period) can be considered as influential points to groundwater recharge.
The factors affecting the snow depth on hillslopes are mainly wind and vegetation cover (forested or open area) (Pipes and Quick, 1987; Deems et al., 2006; Vystavna et al., 2021). The mean value of soil moisture was relatively low at site 4 (top layer: 0.153 ± 0.053 m3/m3, bottom layer: 0.137 ± 0.032 m3/m3), while that at site 1, a high elevation site, showed large values of 0.220 ± 0.064 and 0.377 ± 0.015 m3/m3 for top and bottom layers, respectively. The statistical test indicates significant differences (not same) of the soil moistures at top layers at the sites (p < 0.0001). The larger values at the high elevation sites than those at the low elevation sites likely imply low wind influence, persistent snow cover (both natural and artificial), and low infiltration to soil. The range of soil temperature variations was slightly broad at the low elevation sites that are not surrounded by forested area (open area). Furthermore, the wind effect was evident at the high elevation sites (forested area); the site 2 exhibited lower temperatures than site 1 as the site location was facing windward. Soil temperatures and moistures in each layer were positively correlated (0.74 < r > 0.39) except for those at site 4 during the entire monitoring period. This exception at site 4 may be due to the dryness and openness to wind.
Air temperature and precipitation data from Daegwanryeong and Yongpyong AWS are plotted in Figure 3. Precipitation (rainfall) induced increases in water content during the warm period was visible, particularly, the at low elevation site 4 (beside the river), the soil moisture was more sensitive to the precipitation events and sharp and consistent peaks were exhibited the large and low precipitation events. This can be due to the relatively dry soil without accumulated snow cover during winter and open area (no trees) to receiving the precipitation in this site. The high elevation sites (sites 1 and 2) exhibited double signal of increasing soil moisture by rainfall and melting snow accumulated during the winter. Site 3 also generally exhibited the influence of the precipitation increase and melting snow in the soil moisture.
Influence of Snow Cover on Soil Moisture and Soil Temperature
The soil moisture in the top layers rapidly declined when the soil surface temperature (top layer) dropped below 0°C (cold period). This soil freezing was observable for sites 2, 3, and 4. At site 2, the cold period was longer (from Nov 29 to March 27) than that at other sites and the mean soil moisture was 0.094 ± 0.021 m3/m3. Soil freezing (top layer) was assumed with cold windy condition and inconsistent snow cover at site 2. Moreover, at site 1 the temperature dropped below 0°C during only 5 days (Dec 9 to Dec 13) and was steady and slightly higher than 0°C on most days from end of Nov to end of March. Thus, soil layers at site 1 were assumed to be partially frozen, and the soil moisture (top layer) abruptly declined in November and then gradually increased. Additionally, a thick and persistent snow cover with low wind effect was assumed because the soil temperature was steady during the cold period. At site 3, the cold period (below 0°C) lasted from Nov 29 to Feb 28 and the soil moisture (top) was steady (0.107 ± 0.018 m3/m3). This steady moisture content indicates the freezing of the top layer of soil; cold windy conditions were assumed at this location. In the bottom layer of site 3, the soil moisture suddenly increased and reached 0.52 m3/m3 during 23 Jan to 29 Jan 2021. This sudden increase was expected to have occurred due to external influence because the soil temperature and moisture in the top layers did not exhibit any significant changes. Lastly, at site 4, no fluctuation was observed in the soil moisture in the bottom layer; however, that in the top layer significantly fluctuated. This fluctuation could be due to the absence of a persistent snow cover and windy conditions at site 4. The cold period in site 4 continued from Dec 15 to Feb 19. In the bottom layers at site 1 and 4, the soil moisture was relatively constant (no freezing) during the cold period. In contrast, sites 2 and 3 exhibited the late freezing with abruptly declining soil moisture in the bottom layers, corresponding to below zero temperatures.
The mean daily standard deviation (MDr) of soil temperature and moisture at top layers were shown in Figure 5. The large daily standard deviations of soil moisture correspond to precipitation events, and it was more evident for site 4. The near-surface soil temperatures at sites 3 and 4 exhibited large diurnal temperature oscillations, while at site 2 exhibited relatively small oscillations. To identify the duration of insulating snow cover, we first select the MDr which are greater than 0.2 (threshold value) (Schmid et al., 2012). The number of days with MDr values greater than 0.2, were 133, 136, 20, and 46 for site 1, 2, 3, and 4 respectively. These values include warm period (e.g., Sep and May) and we excluded the days in warm period.
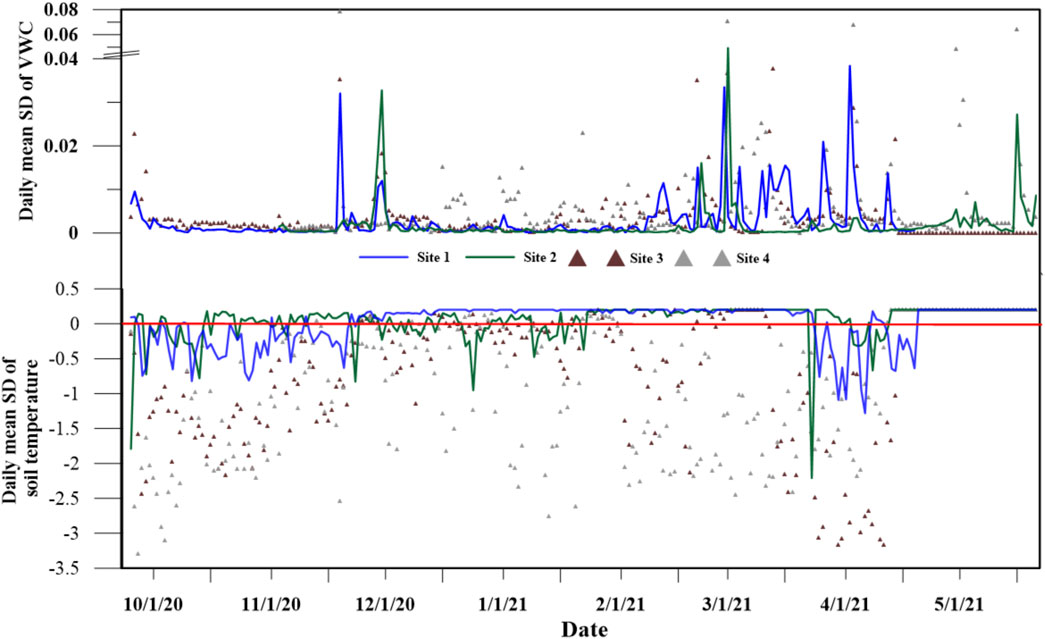
FIGURE 5. Changes in mean standard deviation of daily soil moisture at the top layers. For soil temperatures the values are calculated by subtracting from the threshold value of 0.2. The values above 0 indicate lower SD which represent existence of snow cover during the cold period.
By combining the days with surface soil temperatures below 0°C, the duration of snow cover in site 1 was between Nov 29 and March 24 (115 days). For site 2, the surface soil was expected to be frozen between Nov 29 to Mar 27 with patchy snow cover. While from Mar 3 (after precipitation peak) to May 8 (66 days) indicate relatively consistent snow cover. In site 3, lower variation in the surface temperature was occurred only 46 days which started Nov 24 then end on March 11. In site 4, only 20 days had a lower standard deviation than the threshold value which indicate the inconsistent snow cover in this site. The soil thawing and snow melting signal was earliest (Mar 12) at site 3 compared to the high elevation sites (site 1 and 2). Even the snow at site 2 was expected to melt earlier because the location is in the south slope of the Mt. Balwang, the snow melting signal was late in site 2 (May 8) than site 2 (Mar 27). These results indicate the melting of artificial and natural snow and their contribution to groundwater recharge are spatially and temporally variated (up to ∼1.5 months difference) in this region.
The sites were located windward, which was particularly important for sites with patchy and shallow snow depths where the snow was blown away by wind and the soil surface was exposed (Vystavna et al., 2021). To summarize, during the winter period, site 1 exhibited a persistent (relatively deeper) snow cover, which acted as an insulating snow layer inducing constant soil temperatures. Sites 2 (Nov 29 to Mar 27) and 3 exhibited shallow snow cover (large variation in soil temperature), which can be blown away by wind, and cold temperatures, which induced soil freezing (relatively steady soil moisture). Lastly, site 4 exhibited no persistent snow cover and no consistent freezing during winter period.
The timing and availability of the snow cover differed at the four sites depending on the site characteristics, and they were determined from the soil moisture and temperature measurements in the surface layer. The results demonstrate the presence of insulating snow layer (both natural and artificial), soil freezing, and wind conditions at the monitoring sites. Thus, the foremost cause for the change can be corresponds to the site characteristics including windward direction, vegetation cover (Wang et al., 2021; Vystavna et al., 2021) and early melt due to tree well ( Lundquist and Lott, 2008; Vystavna et al., 2021). Rainfall induced increases in water content during the warm period were visible at all the sites; the high elevation sites exhibited double detection in the soil moisture by rainfall and spring snowmelt.
Isotopic and Chemical Compositions of Snow, Surface Water, and Groundwater
By combining the field observations of soil moisture and temperature, we expect the influence of hydrological variations in mountainous areas for the catchment hydrological processes can be effectively evaluated using the hydro-chemical and water stable isotopes (Jung et al., 2021). Particularly, water stable isotopes in accordance with the temporal and spatial variations are widely used to identify water sources (Jeelani et al., 2010). The major ion concentration and stable water isotopic composition of surface water, snow pit (natural and artificial) and groundwater samples for high elevation site are shown in Figures 6, 7 and Table 3. The water quality of groundwater is accompanied by changes in mineral composition and content according to the water-rock reaction characteristics. As described in the geological characteristics of the Mt. Balwang area, the water–rock reaction is thought to be negligible because the Mt. Balwang area is composed of sandstone and most crude minerals are composed of quartz with very low mineral solubility.
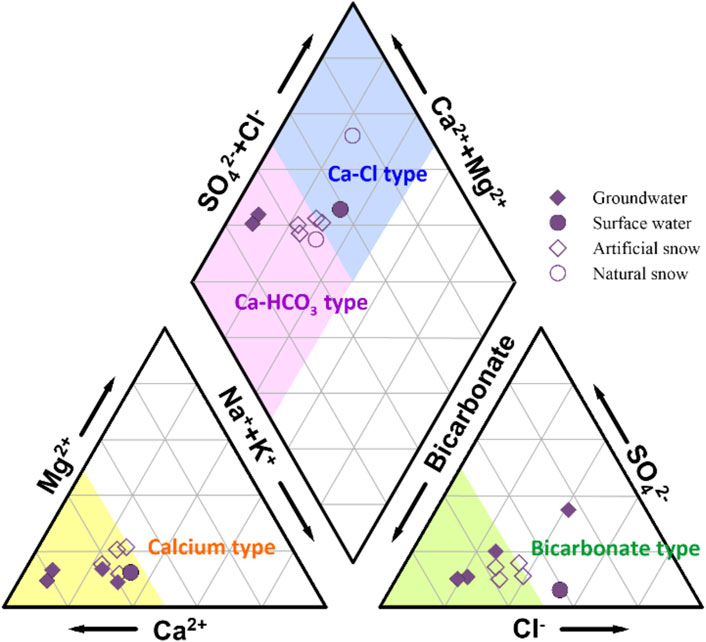
FIGURE 6. Piper diagram of surface water, artificial snow, natural snow, and groundwater samples.
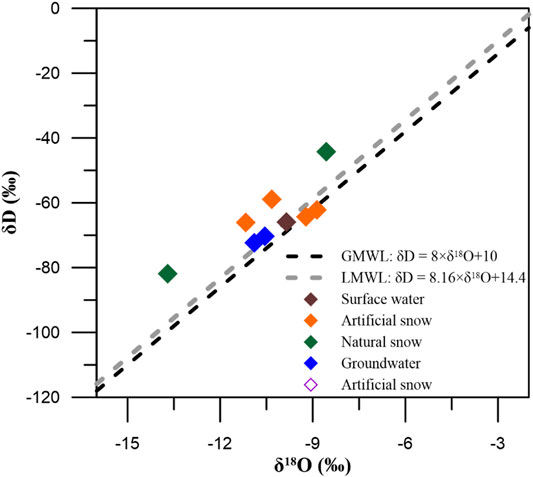
FIGURE 7. δ18O and δD biplot of groundwater, artificial snow, natural snow, and groundwater with GMWL (Craig, 1961) and LMWL (GNIP data reported in Gautam et al. (2020)).
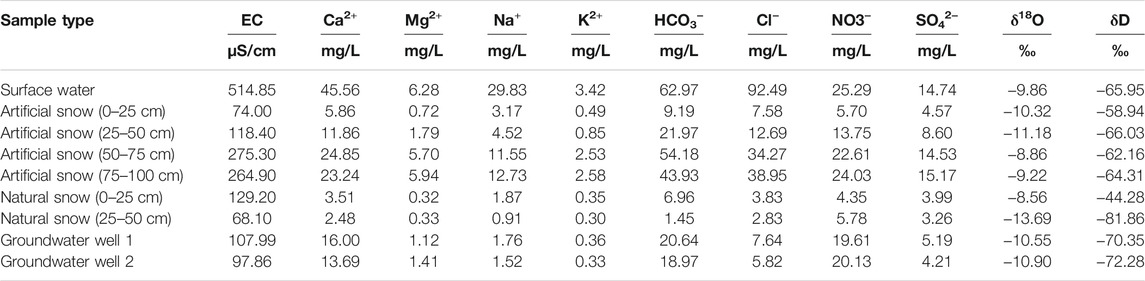
TABLE 3. Major ionic and water isotopic composition of surface water, artificial snow, natural snow, and groundwater sampled on Feb 2021.
The δ18O and δD, values of the surface water and groundwater were consistent with the local meteoric water line (LMWL) (Gautam et al., 2020) and global meteoric water line (GMWL) (Craig, 1961), while those of the natural and artificial (top 0–50 cm layer) snow samples deviated values from LMWL and GMWL (Figure 7). The bottom (25–50 cm) and top (0–25 cm) layer samples of the natural snow layers exhibited 5.13‰ difference in δ18O, which is likely suggests changes in the moisture source or the different timing of snow deposition. On the other hand, the artificial snow samples exhibited a slightly small difference of 2.32‰. Moreover, the differences between the mean δ18O (−9.89‰) of artificial snow samples and other samples (surface water, groundwater, and natural snow) decreased in the following order: surface water (0.04‰) >groundwater (−0.66 and −1.01‰) >natural snow (1.34 and −3.80‰). The results likely to verify the similarity between artificial snow and the surface water that was used to produce it.
Both artificial and natural snow samples exhibited different values depending on the depth difference. Groundwater and artificial snow samples were classified as Ca–HCO3− type, which likely indicates the influence of the weathering of granitic rocks (Koh et al., 2009). The surface water was Ca–Cl type. In natural snow samples, Cl− ions were dominant at 25–50 cm depth (bottom layer or older snow) while HCO3− ions were dominant at the depth of 0–25 cm (top layer or new snow). The top layer (new snow layer) of natural snow indicates the mixing of artificial snow during the sampling period. Generally, the ionic composition was higher in the surface water samples and lower in the natural snow samples (Table 3). Although the artificial snow layers exhibited different ionic composition values at each depth, the average concentration was higher than that of the natural snow samples. The ionic concentration values increased in the order of surface water > artificial snow > groundwater > natural snow. Although the results are based on one-time sampling, they support the assumption that the surface water used for artificial snow affects the groundwater quality.
The higher amount and mineral-enriched water input by artificial snow than that by natural snow influences the local hydrology and erosion intensity (Mosimann, 1998). The importance of the contribution of snow (winter precipitation) to groundwater recharge has been emphasized in numerious studies (e.g., Ingraham and Taylor, 1989; Maule et al., 1994; Smith et al., 2017). According to the 10-year observation data (2010–2020) from Daegwanryeong AWS, the air temperature did not significantly change. However, the precipitation amount decreased (R2 = 0.47, n = 10, p = 0.021) in cold seasons (winter and spring) and increased in the warm seasons (summer and autumn). This trend was also previously observed in this region between 1972 and 2010 (Lee et al., 2012). The amount of surface water used for artificial snow generally increases when the annual snowfall decreases and the snow loss increases (Heo and Lee, 2010). Thus, the decreasing amount of natural snow with the increasing consumption of surface water for producing artificial snow could increase the contribution of artificial snowmelt recharging to groundwater. The soil moisture and temperature measurements allow us to understand the timing and abundance of snow coverage from both natural and artificial snow. The duration of snow coverage varies depending on the location, which induces earlier or later recharge. Although our monitoring was performed on a small scale and was short-term, our results are supportive for explaining the effect of snowmelt in a hydrological cycle, particularly artificial snowmelt, in the study region. Furthermore, more dense observation and frequent sampling will improve the study results. By combining the in-situ measurements (soil moisture and temperature) with comprehensive hydro-chemical and isotopic data, we will be able to understand the snow dynamics and its influence on the hydrological processes including water movement, solute transport in the soil, infiltration, and groundwater recharge.
Conclusion
Soil moisture and temperature were monitored using in-situ sensors installed at high and low elevation sites in the Mt. Balwang area, Gangwon-do Korea. The timing and intensity of snow cover and snowmelt differed the four sites depending on the site characteristics (windward direction, vegetation cover, intensity of snowfall and artificial snow), and they could be detected from the soil moisture and temperature measurements on the surface layer. The high elevation sites (sites 1 and 2) exhibit the relatively longer and consistent snow cover than the low elevation sites. Particularly site, 2 show late (May 8) snow melting even this site is located in south slope of the Mt. Balwang. It can be concluded that the relatively steady and moist soil layers at sites 1, 2, and 3 during the warm period can be considered as influential points to groundwater recharge. The water samples displayed increasing ionic concentration in the order of surface water > artificial snow>groundwater>natural snow. Moreover, the similarity between the water stable isotopic compositions of artificial snow and surface water demonstrates the imprint of surface water. The effect of artificial snow on groundwater quality can be expected to increase with decreasing amount of natural snow due to the increasing contribution of artificial snowmelt recharging to groundwater. The combination of the in-situ measurements (soil moisture and temperature) with comprehensive hydro-chemical and isotopic data, will be helpful for understanding the snow dynamics and its influence on the hydrological processes in this region.
Data Availability Statement
The raw data supporting the conclusion of this article will be made available by the authors, without undue reservation.
Author Contributions
Conceptualization and designation by JL, YN, D-CK and K-SK. Field works by JL, YN and HJ, and YN is responsible for the writing original draft preparation. All authors contributed to the interpretation of the results and provided critical feedback on the manuscript.
Funding
This study was supported by a research grant by a National Research Council of Science and Technology grant from the Korean government (CAP-17-05-KIGAM) and a grant from Korea Polar Research Institute (PE21100).
Conflict of Interest
The authors declare that the research was conducted in the absence of any commercial or financial relationships that could be construed as a potential conflict of interest.
Publisher’s Note
All claims expressed in this article are solely those of the authors and do not necessarily represent those of their affiliated organizations, or those of the publisher, the editors and the reviewers. Any product that may be evaluated in this article, or claim that may be made by its manufacturer, is not guaranteed or endorsed by the publisher.
Acknowledgments
We are grateful to the Korean Meteorological Administration (http://www.kma.go.kr/) for providing meteorological data from the Yongpyong and Daegwanryeong automatic weather stations. Many thanks to administration of the Yongpyong resort for the supports during field works.
References
An, W., Li, Z., Wang, S., Wu, X., Lu, Y., Liu, G., et al. (2017). Exploring the Effects of the “Grain for Green” Program on the Differences in Soil Water in the Semi-Arid Loess Plateau of China. Ecol. Eng. 107, 144–151. doi:10.1016/j.ecoleng.2017.07.017
Brocca, L., Melone, F., Moramarco, T., and Morbidelli, R. (2010). Spatial-Temporal Variability of Soil Moisture and its Estimation Across Scales. Water Resour. Res. 46 (2), 1–14. doi:10.1029/2009wr008016
Choi, M., Hur, Y.-M., Kim, H., Kim, T.-W., and Ahn, J.-H. (2010). Passive Microwave Soil Moisture Evaluations by Ground-Based Measurements in Korea. Int. Arch. Photogrammetry, Remote Sensing Spat. Inf. Sci. - ISPRS Arch. 38, 132–136. Available at: https://www.isprs.org/proceedings/XXXVIII/part7/b/pdf/132_XXXVIII-part7B.pdf
Craig, H. (1961). Isotopic Variations in Meteoric Waters. Science 133, 1702–1703. doi:10.1126/science.133.3465.1702
Deems, J. S., Fassnacht, S. R., and Elder, K. J. (2006). Fractal Distribution of Snow Depth from Lidar Data. J. Hydrometeorol. 7, 285–297. doi:10.1175/JHM487.1
Gautam, M. K., Song, B.-Y., Shin, W.-J., Bong, Y.-S., and Lee, K.-S. (2020). Spatial Variations in Oxygen and Hydrogen Isotopes in Waters and Human Hair across South Korea. Sci. Total Environ. 726, 138365. doi:10.1016/j.scitotenv.2020.138365
Groffman, P. M., Driscoll, C. T., Fahey, T. J., Hardy, J. P., Fitzhugh, R. D., and Tierney, G. L. (2001). Effects of Mild winter Freezing on Soil Nitrogen and Carbon Dynamics in a Northern Hardwood forest. Biogeochemistry 56, 191–213. doi:10.1023/a:1013024603959
Ham, J.-Y., Hur, S. D., Lee, W. S., Han, Y., Jung, H., and Lee, J. (2019). Isotopic Variations of Meltwater from Ice by Isotopic Exchange Between Liquid Water and Ice. J. Glaciol. 65 (254), 1035–1043. doi:10.1017/jog.2019.75
Hartmann, A., Goldscheider, N., Wagener, T., Lange, J., and Weiler, M. (2014). Karst water resources in a changing world: Review of hydrological modeling approaches. Rev. Geoph. 52, 218–242. doi:10.1002/2013RG000443
Heo, I-H., and Lee, S-H. (2010). The Impact of Climate Changes on Ski Industry in Central Region of Korea: The Case of Yongpyong, Yangji, Jisan Ski Resort. Korean Geograph. Soc. 45 (4), 444– 460. Available at: https://www.koreascience.or.kr/article/JAKO201031559287306.page.
Ingraham, N. L., and Taylor, B. E. (1989). The Effect of Snowmelt on the Hydrogen Isotope Ratios of Creek Discharge in Surprise Valley, California. J. Hydrol. 106, 233–244. doi:10.1016/0022-1694(89)90074-7
Jeelani, G., Feddema, J. J., van der Veen, C. J., and Stearns, L. (2012). Role of Snow and Glacier Melt in Controlling River Hydrology in Liddar Watershed (Western Himalaya) Under Current and Future Climate. Water Resour. Res. 48, W12508. doi:10.1029/2011WR011590
Jones, H. G., Pomeroy, J. W., Walker, D. A., and Hoham, R. W. (2001). Snow Ecology. Cambridge and New York: Cambridge University Press: Press Syndicate of the University of Cambridge, 378.
Jung, Y.-Y., Koh, D.-C., Shin, W.-J., Kwon, H.-I., Oh, Y.-H., and Lee, K.-S. (2021). Assessing Seasonal Variations in Water Sources of Streamflow in a Temperate Mesoscale Catchment with Granitic Bedrocks Using Hydrochemistry and Stable Isotopes. J. Hydrol. Reg. Stud. 38, 100940. doi:10.1016/j.ejrh.2021.100940
Jung, Y. Y., Koh, D.-C., Lee, J., and Ko, K. S. (2013). Applications of Isotope Ratio Infrared Spectroscopy (IRIS) to Analysis of Stable Isotopic Compositions of Liquid Water. Econ. Environ. Geol. 46, 495–508. doi:10.9719/EEG.2013.46.6.495
Karthikeyan, L., Pan, M., Wanders, N., Kumar, D. N., and Wood, E. F. (2017). Four Decades of Microwave Satellite Soil Moisture Observations: Part 2. Product Validation and Inter-satellite Comparisons. Adv. Water Resour. 109, 236–252. doi:10.1016/j.advwatres.2017.09.010
Kim, C.-S., Lee, J.-Y., Kim, H., Jeon, W.-H., and Kim, K. (2020). Evaluation of Time Series of Soil Moisture and Soil Temperature and Computation of Apparent thermal Diffusivity of Active Layer in the Barton Peninsula, Antarctica. J. Geol. Soc. Korea. 56 (5), 571–585. doi:10.14770/jgsk.2020.56.5.571
Kim, G., Cha, D.-H., Park, C., Lee, G., Jin, C.-S., Lee, D.-K., et al. (2018). Future Changes in Extreme Precipitation Indices over Korea. Int. J. Climatol 38, e862–e874. doi:10.1002/joc.5414
Kim, H., Cho, S.-H., Lee, D., Jung, Y.-Y., Kim, Y.-H., Koh, D.-C., et al. (2017). Influence of Pre-event Water on Streamflow in a Granitic Watershed Using Hydrograph Separation. Environ. Earth Sci. 76, 76–82. doi:10.1007/s12665-017-6402-6
Kim, S., and Jung, S. (2014). Estimation of Mean Water Transit Time on a Steep Hillslope in South Korea Using Soil Moisture Measurements and Deuterium Excess. Hydrol. Process. 28, 1844–1857. doi:10.1002/hyp.9722
Koh, D.-C., Kim, E.-Y., Ryu, J.-S., and Ko, K.-S. (2009). Factors Controlling Groundwater Chemistry in an Agricultural Area with Complex Topographic and Land Use Patterns in Mid-western South Korea. Hydrol. Process. 23, 2915–2928. doi:10.1002/hyp.7382
Kwon, D. H. (2001). The Geomorphological Features of Balwangsan and its Usage. Geograph. J. Korea 35, 249–260. Available at: https://papersearch.net/thesis/article.asp?key=1951114
Lee, J-Y., Jeon, W-H., Park, Y., and Lim, H-G. (2012). Status and prospect of Groundwater Resources in Pyeongchang, Gangwon-Do. J. Geol. Soc. Korea 48 (5), 435–444. Available at: http://www.dbpia.co.kr/journal/articleDetail?nodeId=NODE02013288
Lee, T-S. (2014b). Water Ecological Health Survey Report of Non-point Pollution Management Branch. Gangwon Institute of Health and Environment.
Lee, J. (2014a). A Numerical Study of Isotopic Evolution of a Seasonal Snowpack and its Meltwater by Melting Rates. Geosci. J. 18, 503–510. doi:10.1007/s12303-014-0019-5
Lee, J., Feng, X., Faiia, A., Posmentier, E., Osterhuber, R., and Kirchner, J. (2010). Isotopic Evolution of Snowmelt: A New Model Incorporating mobile and Immobile Water. Water Resour. Res. 46 (11), 1–12. doi:10.1029/2009WR008306
Lundquist, J. D., and Lott, F. (2008). Using Inexpensive Temperature Sensors to Monitor the Duration and Heterogeneity of Snow-Covered Areas. Water Resour. Res. 44, W00D16. doi:10.1029/2008WR007035
Maule, C. P., Chanasyk, D. S., and Muehlenbachs, K. (1994). Isotopic Determination of Snow-Water Contribution to Soil Water and Groundwater. J. Hydrol. 155, 73–91. doi:10.1016/0022-1694(94)90159-7
May, W., Meier, A., Rummukainen, M., Berg, A., Chéruy, F., and Hagemann, S. (2015). Contributions of Soil Moisture Interactions to Climate Change in the Tropics in the GLACE–CMIP5 experiment. Clim. Dyn. 45 (11-12), 3275–3297. doi:10.1007/s00382-015-2538-9
Mosimann, T. (1998). Beschneiungsanlagen in der Schweiz. Weitere Entwicklung – Umweltverträglichkeit und Folgerungen für die Prüfung und Bewilligung von Beschneiungsanlagen. Bubendorf und Hannover: Studie im Auftrag des Schweizerischen Verbandes der Seilbahnunternehmungen.
Mosimann, T. (1987). Geo-ecological Impacts of Ski Piste Construction in the Swiss Alps. Appl. Geogr. 5, 29–37.
Pachepsky, Y., Radcliffe, D., and Selim, H. (2003). Scaling Methods in Soil Physics. Boca Raton: CRC Press.
Park, J.-H., Duan, L., Kim, B., Mitchell, M. J., and Shibata, H. (2010). Potential Effects of Climate Change and Variability on Watershed Biogeochemical Processes and Water Quality in Northeast Asia. Environ. Int. 36, 212–225. doi:10.1016/j.envint.2009.10.008
Pipes, A., and Quick, M. C. (1987). Modelling Large Scale Effects of Snow Cover in Large Scale Effects of Seasonal Snow Cover. Editors B. E. Goodison, R. G. Barry, and J. Dozier (Wallingford, Oxfordshire: IAHS Publication), 151–160.
Rawls, W. J., Ahuja, L. R., Brakensiek, D. L., Shirmohammadi, A., and Maidment, D. R. (1993). “Infiltration and Soil Water Movement,” in Handbook of Hydrology. (New York, NY: McGraw-Hill).
Rixen, C., Haeberli, W., and Stoeckli, V. (2004). Ground Temperatures Under Ski Pistes with Artificial and Natural Snow. Arctic, Antarctic, Alpine Res. 36 (4), 419–427. doi:10.1657/1523-0430(2004)036[0419:gtuspw]2.0.co;2
Rixen, C., Stoeckl, V., and Ammann, W. (2003). Does Artificial Snow Production Affect Soil and Vegetation of Ski Pistes? A Review. Perspect. Plant Ecol. Evol. Syst. 5, 219–230. doi:10.1078/1433-8319-00036
Schmid, M.-O., Gubler, S., Fiddes, J., and Gruber, S. (2012). Inferring Snowpack Ripening and Melt-Out from Distributed Measurements of Near-Surface Ground Temperatures. Cryosphere 6, 1127–1139. doi:10.5194/tc-6-1127-2012
Seo, D. H., Han, W. S., Park, E., Jeong, J., Oh, Y.-Y., Kim, H.-J., et al. (2020). Analyses and Numerical Evaluation of Integrated Time-Series Monitoring Datasets Including CO2 Concentration and Fluxes at Controlled CO2 Release Site in South Korea. J. Hydrol. 590, 125213. doi:10.1016/j.jhydrol.2020.125213
Smith, T., Bookhagen, B., and Rheinwalt, A. (2017). Spatiotemporal Patterns of High Mountain Asia's Snowmelt Season Identified with an Automated Snowmelt Detection Algorithm, 1987–2016. Cryosphere 11 (5), 2329–2343. doi:10.5194/tc-11-2329-2017
Taras, B., Sturm, M., and Liston, G. E. (2002). Snow-ground Interface Temperatures in the Kuparuk River Basin, Arctic Alaska: Measurements and Model. J. Hydrometeor 3, 377–394. doi:10.1175/1525-7541(2002)003<0377:sgitit>2.0.co;2
Taylor, S., Feng, X., Williams, M., and McNamara, J. (2002). How Isotopic Fractionation of Snowmelt Affects Hydrograph Separation. Hydrol. Process. 16 (18), 3683–3690. doi:10.1002/hyp.1232
Vogel, M. M., Orth, R., Cheruy, F., Hagemann, S., Lorenz, R., Hurk, B. J. J. M., et al. (2017). Regional Amplification of Projected Changes in Extreme Temperatures Strongly Controlled by Soil Moisture‐temperature Feedbacks. Geophys. Res. Lett. 44, 1511–1519. doi:10.1002/2016GL071235
Vystavna, Y., Matiatos, I., and Wassenaar, L. I. (2021). Temperature and Precipitation Effects on the Isotopic Composition of Global Precipitation Reveal Long-Term Climate Dynamics. Sci. Rep. 11, 18503. doi:10.1038/s41598-021-98094-6
Wang, Z., Feng, X., Yao, Z., Ma, Z., and Ji, G. (2021). Spatial-temporal Simulations of Soil Moisture Content in a Large Basin of the Loess Plateau, China. J. Sens. doi:10.1155/2021/6638728
Wei, X., Zhou, Q., Cai, M., and Wang, Y. (2021). Effects of Vegetation Restoration on Regional Soil Moisture Content in the Humid Karst Areas-A Case Study of Southwest China. Water 13 (3), 321. doi:10.3390/w13030321
Wu, R., Lamontagne-Hallé, P., and McKenzie, J. M. (2021). Uncertainties in Measuring Soil Moisture Content with Actively Heated Fiber-Optic Distributed Temperature Sensing. Sensors 21 (11), 3723. doi:10.3390/s21113723
Xiao, L., Yao, K., Li, P., Liu, Y., and Zhang, Y. (2019). Effects of Freeze-Thaw Cycles and Initial Soil Moisture Content on Soil Aggregate Stability in Natural Grassland and Chinese pine forest on the Loess Plateau of China. J. Soil Sediment. 20, 1222–1230. doi:10.1007/s11368-019-02526-w
Ye, L., Fang, L., Shi, Z., Deng, L., and Tan, W. (2019). Spatio-Temporal Dynamics of Soil Moisture Driven by ‘Grain for Green’ Program on the Loess Plateau, China. Agric. Ecosyst. Environ. 269, 204–214. doi:10.1016/j.agee.2018.10.006
Zhang, Z.-H., Peng, H.-Y., and Kong, Y. (2021). Effects of the “Grain for Green” Program on Soil Water Dynamics in the Semi-arid Grassland of Inner Mongolia, China. Water 13 (15), 2034. doi:10.3390/w13152034
Keywords: soil moisture, soil temperature, snowmelt, artificial snow, snow
Citation: Nyamgerel Y, Jung H, Koh D-C, Ko K-S and Lee J (2022) Variability in Soil Moisture by Natural and Artificial Snow: A Case Study in Mt. Balwang Area, Gangwon-do, South Korea. Front. Earth Sci. 9:786356. doi: 10.3389/feart.2021.786356
Received: 30 September 2021; Accepted: 01 December 2021;
Published: 05 January 2022.
Edited by:
Arash Malekian, University of Tehran, IranReviewed by:
Ali Keshavarzi, University of Tehran, IranBabak Vaheddoost, Bursa Technical University, Turkey
Copyright © 2022 Nyamgerel, Jung, Koh, Ko and Lee. This is an open-access article distributed under the terms of the Creative Commons Attribution License (CC BY). The use, distribution or reproduction in other forums is permitted, provided the original author(s) and the copyright owner(s) are credited and that the original publication in this journal is cited, in accordance with accepted academic practice. No use, distribution or reproduction is permitted which does not comply with these terms.
*Correspondence: Jeonghoon Lee, jeonghoon.d.lee@gmail.com