Impact of urban expansion on grain production in the Japan Sea Rim region
 Xiaoli Shen1
  Da Zhang
 Yue Quan
- 1College of Integration Sciences, Yanbian University, Yanji, China
- 2College of Geography and Ocean Sciences, Yanbian University, Yanji, China
The Japan Sea Rim (JSR) region is the core area for the future sustainable development of Northeast Asia. Effectively assessing the impact of urban expansion on grain production is of great significance for achieving sustainable development goals (SDGs), such as SDG2 Zero Hunger, and promoting sustainable development in Northeast Asia. Only a few studies have assessed the impact of urban expansion on grain production in the JSR. In this study, we initially analyzed urban expansion in the JSR for the period 1992 to 2050. Then, we assessed the impact of urban expansion on cropland net primary productivity (NPP) based on NPP data. Finally, we evaluated the impact of urban expansion on grain production in the JSR. The results indicated that urban land expanded from 21,509 km2 to 42,501 km2 in the JSR between 1992 and 2020 (an increase of 1.98 times), and the occupation of cropland caused by urban expansion resulted in a decrease of 2.21 million t in grain production. Urban land will continue to expand from 2020 to 2050, which will cause grain production to decrease by 1.68 (1.02–2.24) million t. China will experience the most serious loss of grain production, accounting for 62.93% (56.69–71.60%) of the total grain production loss in the JSR. Considering the situation for the period 1992–2020, the impact of urban expansion on grain production will be moderated in the future. Thus, the future grain production loss will be reduced by 24.18% (8.80–53.98%). However, future urban expansion will continue to have a negative impact on regional food security. Therefore, we suggest that urban development should be reasonably regulated and high-quality cropland should be protected. Meanwhile, we should strengthen international cooperation and optimize food and economic trade among different countries in the JSR to ensure food security and promote sustainable regional development.
1 Introduction
The Japan Sea Rim (JSR) region refers to a typical transition area that includes Heilongjiang, Jilin, and Liaoning provinces in China, the Russian Far East, the Democratic People’s Republic of Korea (DPRK), Korea, and Japan (Ding et al., 1990; Lo and Yeung, 1995; Wang et al., 2019). The region is not only an important channel to the North Pole for the five East Asian countries but also an important meeting point of the Belt and Road Initiative and the “Silk Road on Ice.” Therefore, the JSR will be the core area for the synergetic development of Northeast Asia in the future. Its land area covers approximately 1.99 million km2, making up 4.47% of the entire land area in Asia. Its population is roughly 349 million, making up 7.63% of Asia’s total population. The gross domestic product (GDP) was reported as approximately 77.5 trillion US dollars in 2019, representing 23.79% of the total GDP in Asia at that time (National Statistical Offices and World Bank, 2020). Conducting related research on human-land relationship has great significance for understanding human activities in this region, predicting future environmental changes, and promoting regional sustainable development in the JSR.
In 1968, Japan proposed the Economic Circle of the Japan Sea, which meant that the JSR entered the phase of international cooperation. In 1999, China, Japan, and Korea attended ASEAN Plus Three (APT) and reached agreements on political security, economic and trade exchanges, and regional sustainable development goals (SDGs). In 2012, under the framework of the Regional Comprehensive Economic Partnership (RCEP), China, Japan, and Korea participated in economic cooperation in the free trade zone. In 2013, China proposed the Belt and Road Initiative, which was linked to the New Northern Policy of Korea and the Road of Peace and Prosperity of Japan, further promoting coordinated regional development and international cooperation. In 2019, China, Japan, and Korea successfully held the CHN-JPN-KOR Free Trade Agreement (FTA) conference to explore new paths of regional cooperation in the fields of economic exchanges, ecological conservation, and disaster reduction (Sun and Feng, 2020). In 2022, under the framework of the RCEP, China, Japan, and Korea will participate in a free trade relationship for the first time and further realize regional economic integration in Northeast Asia. However, due to the constraints of climate conditions and geographical location, substantive regional cooperation in the JSR is relatively rare. Furthermore, few relevant scientific studies have been conducted regarding this area. As global warming and melting sea ice intensify, the future seaworthiness of the Arctic waterway will increase significantly, and the JSR will become an important channel for Arctic waterways (Yumashev et al., 2017; Huang et al., 2021). Urban expansion refers to a land-use change process that transforms non-urban land into urban land (He et al., 2016). It is an important manifestation of human activities. Food trade is the main form of international trade among the five countries in the JSR. Quantifying the impact of urban expansion on grain production could not only reveal human activities and their impacts on food security, but also provide a solid basis for conducting international cooperation studies between countries in the fields of food trade, economic trade, and economic flows in future studies. Thus, relevant research in the JSR is greatly needed to promote the future coordinated and sustainable development of Northeast Asia.
During urban expansion, cropland has always been the main source of new urban land. With the continuous occupation of cropland via urban expansion, cropland net primary productivity (NPP) has decreased, posing a serious threat to grain production and food security (Zhang et al., 2017; Huang et al., 2020; Wu et al., 2020; Zhang et al., 2021). From 1992 to 2016, global urban land area increased from 0.28 million km2 to 0.62 million km2, and the ratio of urban land area to the entire land area increased from 0.18% to 0.41%, with an annual growth rate of 3.5% (He et al., 2019; Huang et al., 2020). During this process, 45.90% of the new urban land came from cropland, and cropland NPP and grain production decreased by 58.71 TgC and 1.44 × 10⁷ t, respectively, having a serious negative impact on food security (Huang et al., 2020). This negative impact will continue in the near future (Seto et al., 2012; Chen et al., 2020). Hence, assessing the impact of urban expansion on grain production is of great significance for achieving the SDGs of zero hunger, improving human well-being, and promoting regional sustainable development (Wu, 2013, 2022).
Recently, several studies using different scales have been conducted to assess the impact of urban expansion on grain production. On the global scale, Bren et al. (2017) evaluated the impact of global urban expansion on grain production for 2000 to 2030, and found that future urban expansion will lead to a 3.70% loss in grain production. Chen et al. (2020) figured that global urban expansion for 2015–2100 will lead to a decline of 2–3% in rice production, 1–3% in wheat production, and 1–4% in maize production, seriously threatening global food security. Huang et al. (2020) assessed the impact of urban expansion on global grain production from 1992 to 2016, and found that grain production decreased by 1.44 × 10⁷ t. On the national and regional scales, He et al. (2017) found that urban expansion in China resulted in a decrease of 12.50 million t in grain production from 1992 to 2015, thus having a negative impact on food security. Yang et al. (2019) used the northern part of North Korea as a study area and estimated the impact of urban expansion on grain production from 2015 to 2050. Findings indicated that future urban expansion will reduce grain production by 1.47–5.02 t. From the referenced studies, we found that they have quantified the impact of urban expansion on grain production according to different scales. However, there is no comprehensive understanding of the impact of historical urban expansion on grain production, as well as the potential impacts originating from future urban expansion in the JSR. Therefore, we used the existing framework and methods in this study to assess the impact of urban expansion on grain production for the JSR and compared the five countries, which has great significance in understanding human activities in this region and conducting in-depth studies in the near future.
The purpose of this study is to evaluate the impact of urban expansion on grain production in the JSR from 1992 to 2050. To achieve this objective, we initially analyzed urban expansion using the global urban-land product for the same period. Subsequently, we quantified the impact of urban expansion on cropland NPP using spatial analysis. Finally, we evaluated the impact of urban expansion on grain production. The results of this study provide useful information for understanding the impact of urban expansion on grain production and promoting sustainable development in Northeast Asia.
2 Study area and data
2.1 Study area
The JSR (118°50′E–156°31′E, 24°03′–57°03′N) includes Heilongjiang, Jilin, and Liaoning provinces in China; the Khabarovsk Krai, Primorsky Krai, and Sakhalin Island regions in Russia; and the DPRK, Korea, and Japan, with a total area of 1.99 million km2 (Figure 1). The areas of China, Russia, and Japan are 791.50 thousand km2, 610.90 thousand km2 and 371.30 thousand km2, respectively, accounting for 39.70%, 30.64%, and 18.62% of the total land area of the JSR. The land areas of the DPRK and Korea are 122,100 km2 and 98,100 km2, respectively, corresponding to 6.12% and 4.92% of the entire JSR. The terrain of the JSR is high in the north and east, and low in the south and west. The climate gradually evolves from temperate monsoon to temperate oceanic monsoon from northwest to southeast, showing an obvious climate gradient.
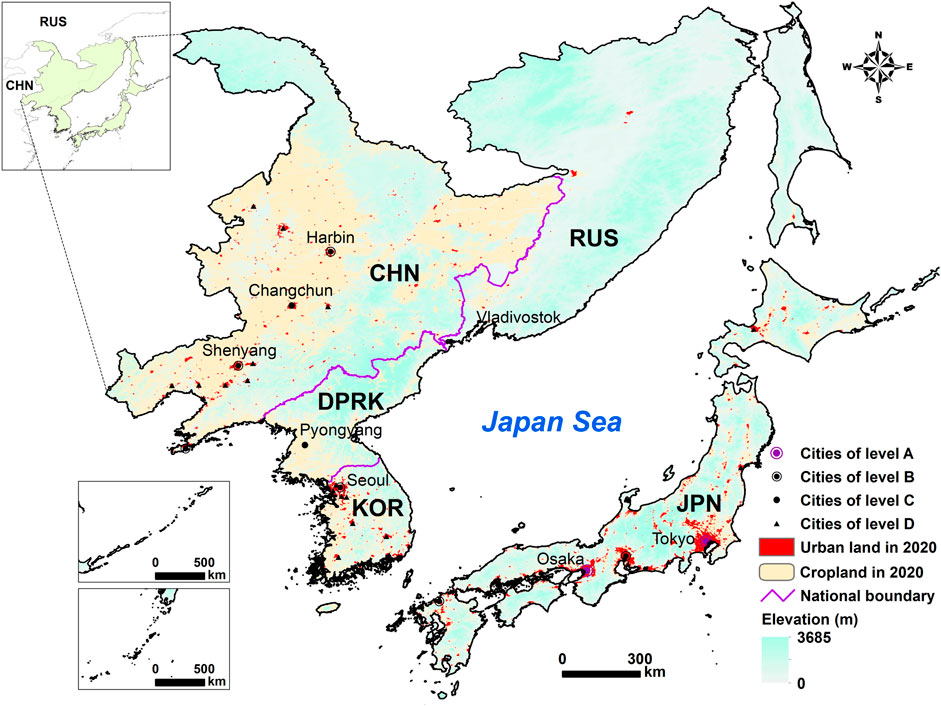
FIGURE 1. The study area. Notes: Cities of level A, B, C, and D refer to different kinds of cities. Cities of level A refer to the kind of city, for which urban populations exceeding 10 million. Cities of level B refer to the cities with urban population between 10 and 5 million. In addition, cities of level C refer to the kind of city, for which urban populations between 5 and 3 million. Cities of level D refer to the kind of city with the smallest population, for which the urban population below 3 million.
In 2019, the total population in the JSR was approximately 349 million, accounting for 7.63% of the total population in Asia, with an urbanization rate of approximately 68.24%. Among the five aforementioned countries, Japan had the largest population (i.e., 126.86 million), representing 36.38% of the total population in the JSR. DPRK had the smallest population, representing only 7.36% of the total population in the JSR. In addition, the GDP in the JSR in 2019 was approximately 77.5 trillion US dollars, corresponding to 23.79% of the total GDP in Asia. Specifically, Japan had the largest GDP, accounting for approximately 68.08% of the total GDP in the JSR. In the DPRK, the GDP was the smallest, representing only 0.21% of the area’s total GDP.
2.2 Data
This study used five types of data. The first was urban land data for 1992–2016, obtained from He et al. (2019), based on nighttime light, vegetation index, and land surface temperature data. These urban land data were produced using deep learning, with an overall accuracy of 90.89%. In addition, urban land data for 2020 in the JSR were obtained through visual interpretation by referring to Kuang et al. (2021), with an overall accuracy above 90%. The second dataset was urban land data for 2020–2050, simulated by He et al. (2021) using shared socioeconomic pathways (SSPs) and a cellular automata model. These data were simulated using future population data from SSPs. The SSPs provided a future urban development scenario framework by considering social institutions, economic development, and government policies for different countries worldwide, which could reflect the differences between countries (O’Neill et al., 2017). The third dataset was land use and land cover (LULC) data from 1992, obtained from the European Space Agency’s Climate Change Initiative Land Cover Project (CCI-LC) (http://maps.elie.ucl.ac.be/CCI/viewer/index.php). The fourth dataset comprised NPP data from 2000 to 2020. These data were obtained from MOD17A3HGF data issued by NASA’s Earth Observing System Data and Information System, with a spatial resolution of 500 m. The fifth dataset comprised geographical ancillary data, including administrative boundaries and city centers. All data were uniformly resampled to 1,000 m, following the Universal Transverse Mercator (UTM) coordinate system.
3 Methods
3.1 Quantifying the dynamics of urban expansion
In this study, we first quantified urban expansion in the JSR using the 1992–2020 and 2020–2050 urban land datasets (Figure 2). Second, combined with the spatial overlay of LULC and NPP data, we analyzed the impact of urban expansion on cropland NPP using LULC, urban land, and NPP data. Finally, using the harvest index and conversion coefficient, we evaluated the impacts of urban expansion on grain production based on the impacts on cropland NPP originating from urban expansion.
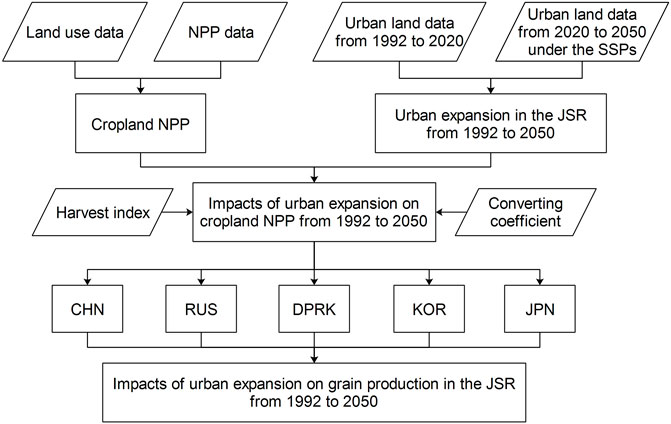
FIGURE 2. Flowchart.
We initially calculated the urban land areas of the JSR and five countries using urban land data from 1992 to 2020, and simulated urban land data from 2030 to 2050 based on the SSPs. According to He et al. (2017), we used the annual growth of urban land (AGU) and the annual growth rate of urbanized land (AGR) to quantify urban expansion in the JSR, specifically, the increase and growth rate in urban land areas. The calculation formulas for these two indicators are expressed in equations Eq. 1 and Eq. 2:
where
3.2 Quantifying the impact of urban expansion on cropland NPP
Referring to Milesi et al. (2003), Yan et al. (2009), and He et al. (2017), two methods were used to assess the impact of urban expansion on cropland NPP. One method is to estimate the impact of urban expansion on the cropland NPP by quantifying the changes in the cropland NPP between the “pre-urban” and “post-urban” conditions. The other method is to assess the impacts on cropland NPP originating from urban expansion by calculating the cropland NPP based only on the cropland NPP in the “pre-urban” condition. Given that cropland NPP is simultaneously influenced by urban expansion and climate change, the first method cannot effectively eliminate the effects of climate change. Therefore, we used the second method in this study to assess the impact of urban expansion on cropland NPP, which was developed by Milesi et al. (2003). In this study, cropland NPP in 1992 was first quantified using LULC and NPP data. Next, we quantified the impact of urban expansion on cropland NPP using the spatial superposition method. Owing to the lack of NPP data in 1992, we used the average value of MODIS NPP for 2000–2020 as the 1992 NPP according to Huang et al. (2020), which found that this proxy was valid and reliable and could further eliminate the effects of climate change on cropland NPP. The formula for the impact of urban expansion on cropland NPP is expressed in Eq. 3:
where
3.3 Quantifying the impact of urban expansion on grain production
To assess the impact of urban expansion on grain production, we converted NPP to grain production using the harvest frequency index and coefficient for converting carbon content to dry matter according to Huang et al. (2020) and Ju et al. (2010). Based on the impact of urban expansion on cropland NPP, its impact on grain production was evaluated. This formula can be expressed as Eq. 4:
where
4 Results
4.1 Urban expansion in the JSR from 1992 to 2050
From 1992 to 2020, the JSR experienced rapid and huge urban expansion. The urban land area expanded from 21,509 km2 to 42,501 km2, increasing by 1.98 times in urban land. The AGR was 2.46%, and the proportion of urban land to the total land area across the JSR increased from 1.08% to 2.13% (Figure 3, Supplementary Appendix Figures SA1−SA4). Among the five countries, urban land expanded the most in Japan, followed by that in China. Specifically, urban land in Japan expanded from 16,378 km2 to 25,384 km2 during this period. The new urban land area was 9,006 km2, with an AGR of 1.58%, accounting for 42.90% of the total new urban land area in the JSR. In China, urban land expanded from 1,489 km2 in 1992 to 9,719 km2 in 2020. The new urban land area was 8,230 km2, with an AGR of 6.93%, corresponding to 39.21% of the total new urban land area in the JSR. Urban land in the DPRK expanded the least, with an increase of 198 km2 in new urban land, representing only 0.94% of the total new urban land across the entire JSR.
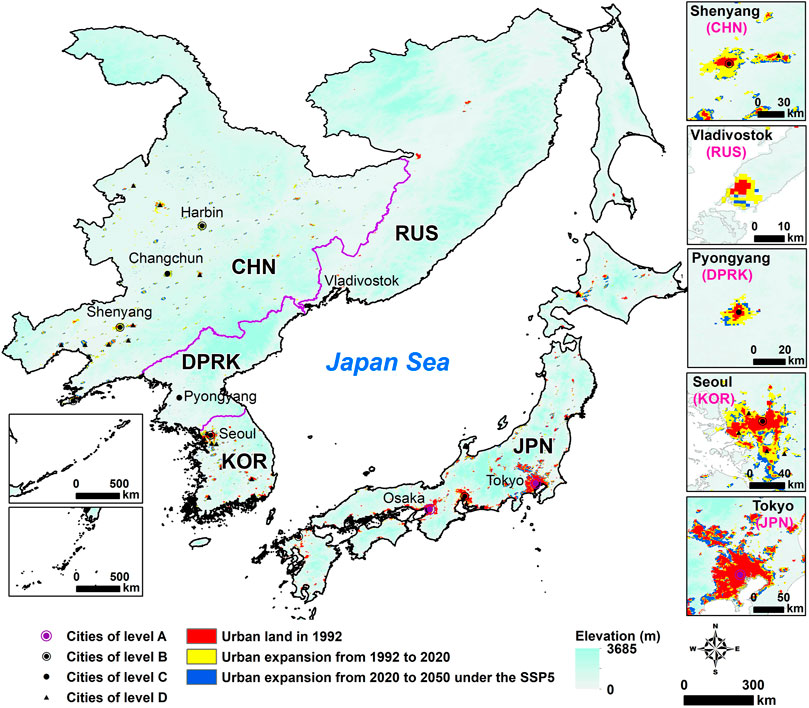
FIGURE 3. Urban expansion in the JSR under the SSP5 from 1992 to 2050.
From 2020 to 2050, urban land will continue to expand in the JSR. The urban land in the JSR is predicted to grow from 42,501 km2 in 2020 to 51,647.20 (48,383–55,039) km2 in 2050 under the SSPs, representing an average increase of 1.22 (1.14–1.30) times in urban land, with an AGR of 0.65% (0.43–0.87%). The proportion of urban land to the total land area of JSR will increase from 2.13% to 2.59% (2.43–2.76%) (Figure 3; Table 1). New urban land will be mainly concentrated in China and Japan. Specifically, urban land in China is expected to grow from 9,719 km2 to 13,642.20 (12,247–14,316) km2 during this period, with an AGU of 130.77 (84.27–153.73) km2 and an AGR of 1.14% (0.77–1.30%), accounting for 42.89% (36.66–51.91%) of the entire new urban land area in the JSR. In Japan, urban land will increase from 25,384 km2 to 29,048.40 (27,547–31,268) km2 in this period, with an AGU of 122.15 (72.10–196.13) km2 and an AGR of 0.45% (0.27–0.70%), accounting for 40.06% (31.84–46.93%) of the entire new urban land area in the JSR. In the DPRK, urban land will grow the least. New urban land will only increase by 84.80 (71–98) km2, accounting for only 0.93% (0.78–1.21%) of the new urban land across the entire JSR.
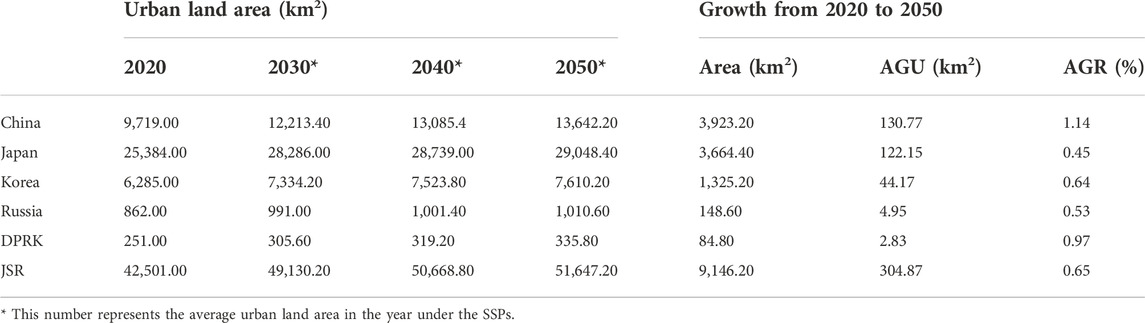
TABLE 1. Urban land growth in the JSR from 2020 to 2050 under the SSPs.
4.2 Impact of urban expansion on cropland NPP in the JSR from 1992 to 2050
From 1992 to 2020, urban expansion caused cropland NPP loss of approximately 3.68 TgC, with an annual loss rate of 0.06%, accounting for 0.35% of the total NPP in this period (Table 2). The greatest cropland NPP loss was experienced in Japan, followed by China and Korea, and Russia experienced the least loss. The cropland NPP loss in Japan caused by urban expansion was 2.05 TgC, with an annual loss rate of 0.17%, accounting for 55.65% of the total loss across the entire JSR. The cropland NPP loss in China and Korea were 0.87 TgC and 0.74 TgC, accounting for 23.52% and 20.19%, respectively, of the total loss across the entire JSR.
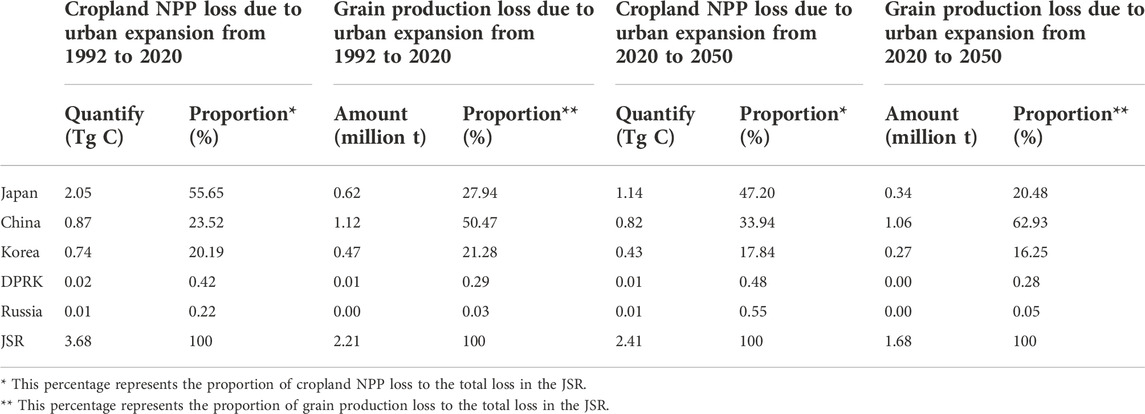
TABLE 2. Cropland NPP loss and grain production loss due to urban expansion from 1992 to 2050.
From 2020 to 2050, urban expansion in the JSR will continue to cause cropland NPP loss, with a loss of 2.41 (1.43–3.55) TgC, accounting for 0.23% (0.13–0.33%) of the total NPP from 2000 to 2020 (Table 2). The annual loss rate of cropland NPP will be 0.04% (0.02–0.05%). Specifically, due to future urban expansion, cropland NPP loss will be concentrated primarily in Japan, China, and Korea. Japan will experience the most cropland NPP loss—that is, 1.14 (0.61–1.93) TgC, with an annual loss rate of 0.09% (0.05–0.16%), accounting for 47.20% (37.63–54.47%) of the total loss in the JSR. In China and Korea, the cropland NPP loss will be 0.82 (0.49–0.99) TgC and 0.43 (0.31–0.60) TgC, respectively, with an annual loss rate of 0.02% (0.01–0.03%) and 0.07% (0.05–0.09%), accounting for 33.94% (27.76–44.00%) and 17.84% (16.11–21.59%), respectively, of the total loss across the entire JSR. The cropland NPP loss in the DPRK will be only 0.01 (0.01–0.02) TgC, accounting for only 0.48% (0.43–0.58%) of the total loss for the entire JSR.
4.3 Impact of urban expansion on grain production in the JSR from 1992 to 2050
From 1992 to 2020, the occupation of cropland caused by urban expansion resulted in a decrease of 2.21 million t in grain production in the JSR. Meanwhile, the grain production decreased the most in China by 1.12 million t, with an annual loss rate of 0.02%, representing 50.47% of the total grain production loss in the JSR (Table 2). The grain production losses in Japan and Korea were 0.62 million t and 0.47 million t, respectively, with annual loss rates of 0.16% and 0.11%, accounting for 27.94% and 21.28%, respectively, of the total loss across the entire JSR.
From 2020 to 2050, urban expansion in the JSR will reduce grain production by 1.68 (1.02–2.24) million t with the occupation of cropland (Table 2). Grain production in China will incur the most serious loss, with a decrease of 1.06 (0.63–1.27) million t, corresponding to 62.93% (56.69–71.60%) of the total production in the JSR. The annual loss rate for grain production will be 0.02% (0.01–0.03%). In Japan and Korea, the grain production loss will be 0.34 (0.19–0.58) million t and 0.27 (0.20–0.38) million t, respectively, with annual loss rates of 0.09% (0.05–0.16%) and 0.07% (0.05–0.09%), accounting for 20.48% (14.33–26.03%) and 16.25% (13.74–19.25%) of the total loss across the JSR.
The impact of urban expansion on grain production will be moderated in the future, compared to the impact from 1992 to 2020. From 2020 to 2050, urban expansion in the JSR will cause grain production to decrease by 1.68 million t, which is 24.18% lower than the historical loss (i.e., 2.21 million t), and the average annual loss rate will decrease by 23.45% (Figure 4). Among the five countries, the impact of future urban expansion on grain production in Japan will experience the most obvious slowdown compared to the historical impact, and future urban expansion will result in a decrease of 0.34 million t in grain production, which is 44.42% lower than the historical loss (i.e., 0.62 million t), and the annual loss rate of grain production will be 42.29% lower than the historical annual loss rate. In Korea and the DPRK, future urban expansion will cause grain production to decrease by 0.27 million t and 4.68 thousand t, and the grain production loss will be reduced by 42.10% and 25.98%, respectively, compared with the historical loss. The annual loss rates of grain production will be reduced by 40.51% and 25.93%, respectively. In China, future urban expansion will cause grain production to decrease by 1.06 million t. Compared with the historical loss, the future loss will be reduced by 5.46%, and the annual loss rate of grain production will decrease by 4.85%.
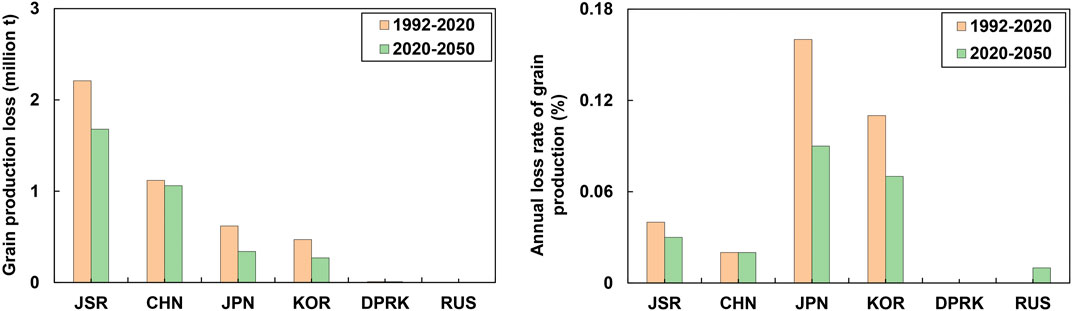
FIGURE 4. Grain production loss and annual loss rate of grain production due to urban expansion from 1992 to 2050.
5 Discussion
5.1 Reliability of grain production based on NPP and simulated urban land data from 2020 to 2050
Recently, NPP data have been widely used to quantify grain production on large spatial and temporal scales because of the advantages of wide coverage and long time series (He et al., 2017; Huang et al., 2020; Wang et al., 2020). Therefore, we verified the reliability and validity of the grain production calculations by NPP with statistical data. First, we obtained the average grain yield data of the five countries based on the data released by the Food and Agriculture Organization of the United Nations (FAO) and other statistical data, and calculated the grain yield for each county using the grain yield and LULC data for the five countries. Grain production, calculated based on NPP and statistical data, was then extracted using county boundaries for the five countries. Finally, the correlation between the two grain production results was calculated and analyzed. The results showed positive correlations between these two results for the five countries, with correlation coefficients ranging from 0.948 to 0.996. The highest correlation coefficient was 0.996 for Russia, followed by China, with a correlation coefficient of 0.977. The correlation coefficient for Korea was the lowest (0.948). These results indicate that NPP data can be effectively utilized to calculate grain production in the JSR (Figure 5).
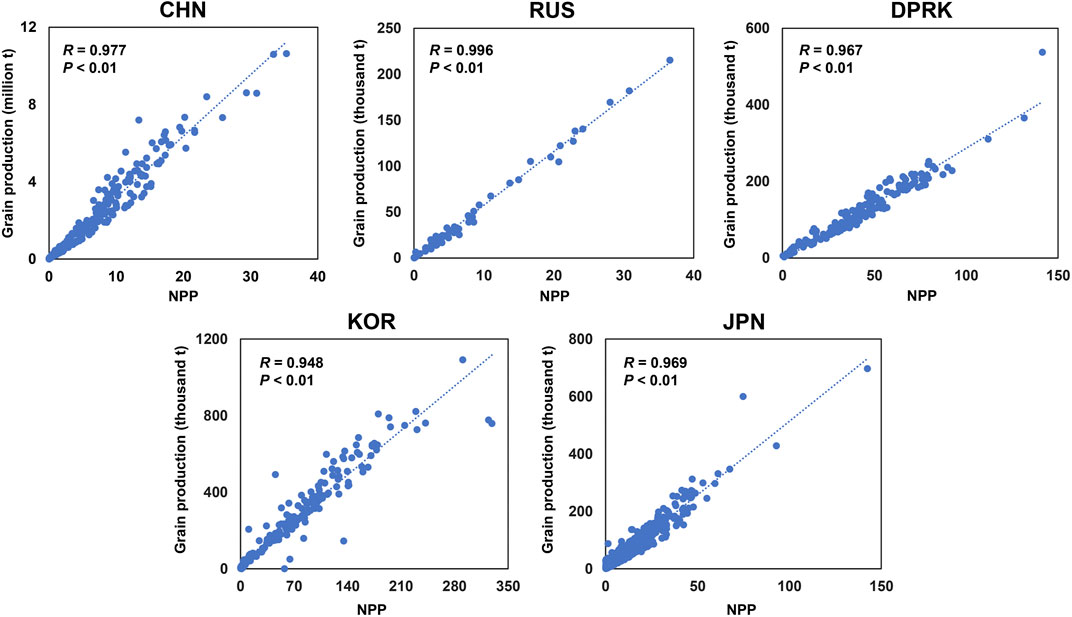
FIGURE 5. The correlation between NPP and grain production in the five countries.
In addition, we selected Shenyang, Changchun, and Harbin in China, Seoul in Korea, and Osaka and Tokyo in Japan to verify the reliability of future urban land data by comparing the urban land data used in this study with those issued by Huang et al. (2019), Chen et al. (2020), and Li et al. (2021). Meanwhile, the overall accuracy (OA), quantity disagreement (QD), allocation error (AD), and Kappa coefficients were used to measure the agreement between the two urban land datasets. Specifically, we compared urban land data for 2050 using these four types of urban land measures. We found that the OA was 61.46–92.68%, QD was 0.54–28.44%, AD was 0.89–13.99%, and Kappa coefficient was 0.49–0.80 (Supplementary Appendix Table SA1). Thus, the future urban land data used in this study have certain reliability and can be utilized in investigations regarding the JSR (Figure 6).
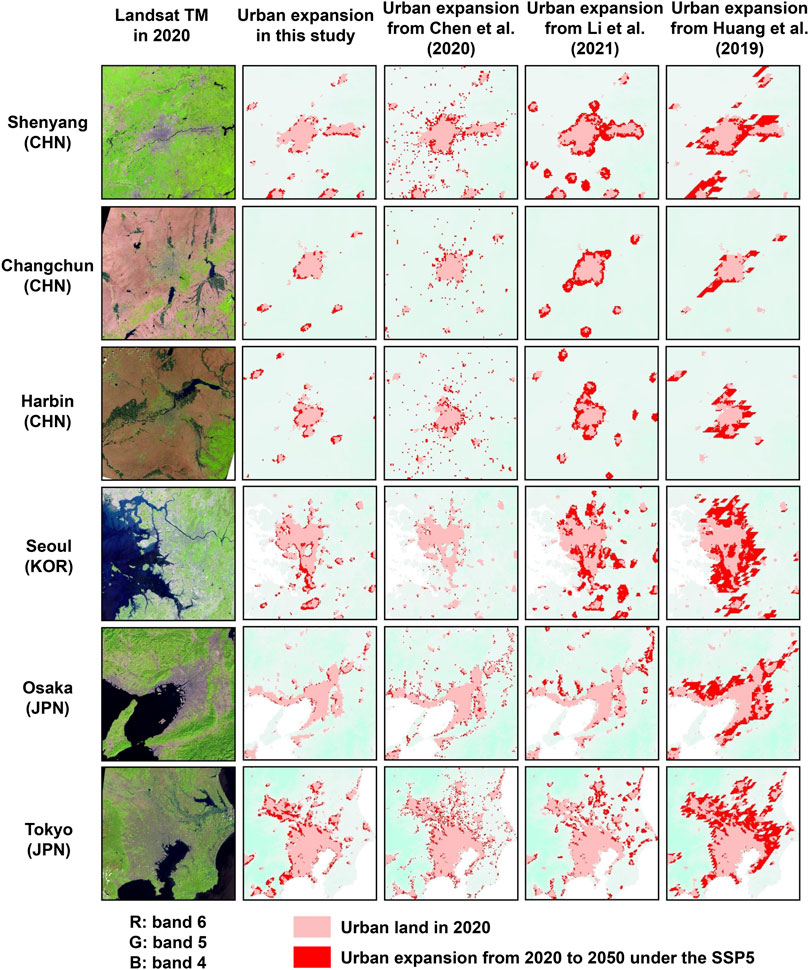
FIGURE 6. Comparison of urban expansion from 2020 to 2050 from this study and the other data issued by Huang et al. (2019), Chen et al. (2020), and Li et al. (2021).
5.2 Projected decrease in cropland loss and proportion of cropland in the future were the main reasons for the moderation of grain production loss
Given the influence of urban expansion, the projected decrease in cropland loss in the future was the main reason for the moderation of grain production loss. From 2020 to 2050, the new urban land area in the JSR is projected to be 9,146.20 km2, and the projected cropland area occupied by urban expansion is 6,562 km2. Compared with the cropland loss resulting from urban expansion from 1992 to 2020 (i.e., 15,396 km2), the amount of cropland loss will be reduced by 58.82%. Moreover, the future cropland area will decrease at a rate of 218.73 km2/a, which is 61.57% lower than the cropland loss rate from 1992 to 2020 (i.e., 569.14 km2/a).
Furthermore, among the sources of new urban land, the reduction in the proportion of cropland is anticipated to be another reason for the slowdown in grain production loss. From 2020 to 2050, approximately 71.75% of the new urban land in the JSR will come from cropland, which is lower than the historical percentage of 73.34%. Among the five aforementioned countries, the proportion of cropland loss to new urban land in Japan and the DPRK will decrease by 7.32% and 9.55%, respectively. However, the proportion of occupied cropland to new urban land in China, Korea, and Russia is projected to increase by 3.37%, 2.75%, and 2.03%, respectively.
5.3 Implications for ensuring food security and achieving SDGs in the JSR
Food security has always been an important issue faced by all five countries in the JSR. Although Japan is the second largest grain importer in the world, it has become an aging society. Facing problems such as declining agricultural production value, decreasing agricultural labor force, increasing abandoned cropland, and declining grain self-sufficiency, Japan must rely on expanding foreign imports to satisfy domestic food demand. From 1960 to 2018, the ratio of import dependence on grain, meat, vegetables, and oils in Japan increased by 35.70%, 36.00%, 20.50%, and 14.20%, respectively, resulting in decreases of 27.00% and 30.00% in the degrees of comprehensive grain and staple grain self-sufficiency, respectively (Ping, 2018; Han, 2021). Due to the constraints of limited cultivated land, Korea has given up self-sufficiency in wheat and corn and has mainly relied on grain imports. In 2019, Korea imported 3.94 million tons of wheat and 11.89 million tons of corn, and the degree of self-sufficiency for wheat and corn dropped to approximately 1–3% (Yao and Xia, 2021). In addition, the food crisis and food security issues in the DPRK have always been daunting for the country’s sustainable development, and the decline in grain production resulting from future urban expansion may further exacerbate the food crisis (Yang et al., 2019). This study revealed that future urban land will continue to expand and grain production will continue to experience significant losses. Although future losses will be lower than historical losses, food security and the achievement of SDGs will also be negatively influenced by various factors such as global climate change, unstable international grain prices, and COVID-19.
Therefore, we suggest that rapid urban expansion should be controlled, and high-quality croplands, forests, grasslands, and wetlands with high ecosystem services should be protected to avoid direct occupation by urban expansion (Huang et al., (2019); Ke and Tang, 2019; Huang and Ke, 2020; Sun et al., 2022). Second, degraded and important croplands should be restored to ensure and improve productivity (Zhang et al., 2019; Wang et al., 2022). Finally, against the background of the Belt and Road Initiative, we suggest strengthening regional cooperation, optimizing grain trade and economic exchanges, and ensuring food security to promote regional sustainable development.
5.4 Future perspectives
In this study, we quantified and evaluated the impact of urban expansion on grain production in the JSR for 1992–2050, which is meaningful for promoting regional sustainable development. However, this study had several limitations. First, we used the average value of MODIS NPP for 2000–2020 as the benchmark, and assumed that the NPP of each grid was constant to assess the impact originating from urban expansion, which could ignore the fact that the NPP of each grid was actually changing. Second, we simulated the impact of future urban expansion on grain production but did not consider the possible impact of future climate change on grain production (He et al., 2015; Fang et al., 2020). Third, we did not consider relevant policies, such as land management policies for protecting croplands and corresponding policies for food security, when assessing the impacts of urban expansion on grain production. However, these limitations did not influence the major findings of this study. By combining remote sensing data and future urban land products, we evaluated the impact of future urban expansion on grain production rapidly and reliably, which could represent the maximum range of grain production losses caused by future urban expansion and have theoretical and practical significance for sustainable development in Northeast Asia.
In the future, we will use multi-source remote sensing data and big data to represent the long-term NPP dynamics more precisely. We then evaluate the potential coupled impacts of grain production under the dual influences of future climate change and human activities. Tele-connected food supply, international grain trade, and food imports will also be considered. Finally, we will consider relevant policies for protecting high-quality croplands and food security when simulating future urban expansion and assessing its impact on grain production in future studies.
6 Conclusion
The JSR experienced rapid urban expansion for the period 1992–2020, with the urban land area expanding from 21,509 km2to 42,501 km2 (an increase of 1.98 times). Rapid urban expansion caused a decrease of 2.21 million t in grain production because of the occupation of cropland. Among the five countries cited in this study, China experienced the largest decrease in grain production, accounting for 50.47% of the total decrease in grain production in JSR. From 2020 to 2050, urban land will continue to expand from 42,501 km2 to 51,647.20 (48,383–55,039) km2, an increase of 1.22 (1.14–1.30) times in the JSR. Future urban expansion will decrease by 1.68 (1.02–2.24) million t of grain production. In addition, grain production in China will decrease by 1.06 (0.63–1.27) million t, accounting for 62.93% (56.69–71.60%) of the total grain production loss in the JSR.
The impact of urban expansion on grain production will be moderated in the future, compared with the impact from 1992 to 2020. From 2020 to 2050, grain production loss resulting from urban expansion in the JSR will be reduced by 24.18% compared to the historical loss. Meanwhile, in Japan, future urban expansion will cause a decrease in grain production of 0.34 million t, which will be 44.42% lower than the historical loss. Although the grain production loss caused by future urban expansion will slow down, the cropland occupied by future urban expansion will continue to have a negative impact on regional food security. Therefore, we suggest that future urban expansion be regulated. Furthermore, high-quality croplands should be protected in the JSR. In addition, regional food security should be ensured by strengthening international cooperation and optimizing the grain trade and economic exchanges to promote sustainable development in Northeast Asia (Tilman et al., 2011, Chen et al., 2017, Du et al., 2020, Yan et al., 2021, Xing et al., 2022, Yang et al., 2022).
Data availability statement
The raw data supporting the conclusions of this article will be made available by the authors, without undue reservation.
Author contributions
XS performed the experiments and analysed the data. DZ and YN designed the study and planned the analysis. XS and DZ drafted the manuscript. YN and YQ contributed to revising the manuscript. FY and YY contributed to collect and download the data. All authors contributed to the interpretation of findings, provided revisions to the manuscript, and approved the manuscript.
Funding
This research was supported by the National Natural Science Foundation of China (Grant Nos. 42271314, 41801184 and 41771094). This research was also supported by the Jilin Science and Technology Development Program (Grant No. 20210203138SF), and the Chinese Academy of Engineering (Grant No. 2021-XY-31).
Conflict of interest
The authors declare that the research was conducted in the absence of any commercial or financial relationships that could be construed as a potential conflict of interest.
Publisher’s note
All claims expressed in this article are solely those of the authors and do not necessarily represent those of their affiliated organizations, or those of the publisher, the editors and the reviewers. Any product that may be evaluated in this article, or claim that may be made by its manufacturer, is not guaranteed or endorsed by the publisher.
Supplementary material
The Supplementary Material for this article can be found online at: https://www.frontiersin.org/articles/10.3389/feart.2022.1025069/full#supplementary-material
References
Bren, A. C., Reitsma, F., Baiocchi, G., Barthel, S., Güneralp, B., Erb, K. H., et al. (2016). Future urban land expansion and implications for global croplands. Proceedings of the National Academy of Sciences of the United States of America, 114(34):8939–8944, doi:10.1073/pnas.1606036114
Chen, G. Z., Li, X., Liu, X. P., Chen, Y. M., Liang, X., Leng, J. Y., et al. (2020). Global projections of future urban land expansion under shared socioeconomic pathways. Nat. Commun. 11 (1), 537. doi:10.1038/s41467-020-14386-x
Chen, T., Huang, Q. H., Liu, M., Li, M. C., Qu, L. A., Deng, S. L., et al. (2017). Decreasing net primary productivity in response to urbanization in Liaoning Province, China. Sustainability 9 (2), 162. doi:10.3390/su9020162
Ding, S. B., Chen, C., and Wang, L. Q. (1990). Economic regionalization in the Sea of Japan and our countermeasures. Ocean Coast. Dev.04, 8–12.
Du, Y. N., Xu, Y. L., Zhang, L. Y., and Song, S. F. (2020). Can China’s food production capability meet her peak food demand in the future? Int. Food Agribus. Manag. Rev. 23, 1–17. doi:10.22434/ifamr2018.0116
Fang, Z. H., Liu, Z. F., He, C. Y., Tu, M. Z., Zhao, R., and Lu, W. L. (2020). Will climate change make Chinese People more comfortable? A scenario analysis based on the weather preference index. Environ. Res. Lett. 15, 084028. doi:10.1088/1748-9326/ab9965
Han, C. H. (2021). Japanese Policies of Farming Structure, the Straits of Agricultural Development in Japan and their Significance. J. Hist. Econ. Thought 02, 37–60.
He, C. Y., Liu, Z. F., Gou, S. Y., Zhang, Q. F., Zhang, J. S., and Xu, L. L. (2019). Detecting global urban expansion over the last three decades using a fully convolutional network. Environ. Res. Lett. 14 (3), 034008. doi:10.1088/1748-9326/aaf936
He, C. Y., Liu, Z. F., Wu, J. G., Pan, X. H., Fang, Z. H., Li, J. W., et al. (2021). Future global urban water scarcity and potential solutions. Nat. Commun. 12, 4667. doi:10.1038/s41467-021-25026-3
He, C. Y., Liu, Z. F., Xu, M., Ma, Q., and Dou, Y. Y. (2017). Urban expansion brought stress to food security in China: Evidence from decreased cropland net primary productivity. Sci. Total Environ. 576, 660–670. doi:10.1016/j.scitotenv.2016.10.107
He, C. Y., Zhang, D., Huang, Q. X., and Zhao, Y. Y. (2016). Assessing the potential impacts of urban expansion on regional carbon storage by linking the LUSD-urban and InVEST models. Environ. Model. Softw. 75, 44–58. doi:10.1016/j.envsoft.2015.09.015
He, C. Y., Zhao, Y. Y., Huang, Q., Zhang, Q. X., and Zhang, D. (2015). Alternative future analysis for assessing the potential impact of climate change on urban landscape dynamics. Sci. Total Environ. 532, 48–60. doi:10.1016/j.scitotenv.2015.05.103
Huang, H., and Ke, X. L. (2020). Demarcating of permanent prime farmland for synergy of farmland protection and urban expansion of Wuhan. J. Geo-Information Sci. 22 (3), 592–604. doi:10.12082/dqxxkx.2020.190414
Huang, J. X., Zhang, T. Y., Cao, Y. F., Ge, Q. S., and Yang, L. S. (2021). The evolution of navigation performance of Northeast Passage under the scenario of Arctic sea ice melting. Acta Geol. Sin 76 (05), 1051–1064. doi:10.11821/dlxb202105001
Huang, K. N., Li, X., Liu, X. P., and Seto, K. C. (2019). Projecting global urban land expansion and heat island intensification through 2050. Environ. Res. Lett. 14 (11), 114037. doi:10.1088/1748-9326/ab4b71
Huang, Q.X., Zhao, X., He, C.Y., Yin, D., and Meng, S.T. (2019). Impacts of urban expansion on wetland ecosystem services in the context of hosting the Winter Olympics: a scenario simulation in the Guanting Reservoir Basin, China. Reg. Environ. Change 19 (08), 2365–2379. doi:10.1007/s10113-019-01552-1
Huang, Q. X., Liu, Z. F., He, C. Y., Gou, S. Y., Bai, Y. S., Wang, Y. H., et al. (2020). The occupation of cropland by global urban expansion from 1992 to 2016 and its implications. Environ. Res. Lett. 15 (8), 084037. doi:10.1088/1748-9326/ab858c
Ju, W. M., Gao, P., Zhou, Y. L., Chen, J. M., Chen, S., and Li, X. F. (2010). Prediction of summer grain crop yield with a process-based ecosystem model and remote sensing data for the northern area of the Jiangsu Province, China. Int. J. Remote Sens. 31, 1573–1587. doi:10.1080/01431160903475357
Ke, X. L., and Tang, L. P. (2019). Impact of cascading processes of urban expansion and cropland reclamation on the ecosystem of a carbon storage service in Hubei Province, China. Acta Ecol. Sci. 39 (2), 672–683. doi:10.5846/stxb201712042177
Kuang, W. H., Du, G. M., Lu, D. S., Dou, Y. Y., Li, X. Y., Zhang, S., et al. (2021). Global observation of urban expansion and land-cover dynamics using satellite big-data. Sci. Bull. 66 (4), 297–300. doi:10.1016/j.scib.2020.10.022
Li, X. C., Zhou, Y. Y., Hejazi, M., Wise, M., Vernon, C., Iyer, G., et al. (2021). Global urban growth between 1870 and 2100 from integrated high resolution mapped data and urban dynamic modeling. Commun. Earth Environ. 2 (1), 201. doi:10.1038/s43247-021-00273-w
Lo, F. C., and Yeung, Y. M. (1995). Emerging world cities in Pacific Asia. Tokyo: United Nations University Press.
Milesi, C., Elvidge, C. D., Nemani, R. R., and Running, S. W. (2003). Assessing the impact of urban land development on net primary productivity in the southeastern United States. Remote Sens. Environ. 86, 401–410. doi:10.1016/s0034-4257(03)00081-6
O’Neill, B. C., Kriegler, E., Ebi, K. L., Kemp-Benedict, E., Riahi, K., Rothman, D. S., et al. (2017). The roads ahead: Narratives for shared socioeconomic pathways describing world futures in the 21st century. Glob. Environ. Change 42, 169–180. doi:10.1016/j.gloenvcha.2015.01.004
Ping, L. Q. (2018). The Shift of Japanese Agricultural Policy: From Social Policy to Industrial Policy. Contemporary Econ. Japan 37 (2), 1–12. doi:10.16123/j.cnki.issn.1000-355x.2018.02.001
Ren, J., Chen, Z., Tang, H., and Shi, R. (2006). Regional yield estimates for winter wheat based on net primary production model. Trans. CSAE, 22, 111–117.
Seto, K. C., Giineralp, B., and Hutyra, L. R. (2012). Global forecasts of urban expansion to 2030 and direct impacts on biodiversity and carbon pools. Proc. Natl. Acad. Sci. U. S. A. 109 (40), 16083–16088. doi:10.1073/pnas.1211658109
Sun, L., and Feng, Z. (2020). Regional Economic and Trade Cooperation Status, Problems and Path Promotion in Northeast Asia. J. Shenyang Normal Univ. 44 (01), 1–10. doi:10.19496/j.cnki.ssxb.2020.01.001
Sun, Y. H., Nan, Y., Zhang, D., Yang, Y. M., Gan, X. G., and Piao, L. C. (2022). Environmental degradation in the transnational area of Changbai Mountain based on multiple remote sensing data. Land Degradation & Development, 33(1), doi:10.1002/ldr.4360
Tilman, D., Balzer, C., Hill, J., and Befort, B. L. (2011). Global food demand and the sustainable intensification of agriculture. Proc. Natl. Acad. Sci. U. S. A. 108 (50), 20260–20264. doi:10.1073/pnas.1116437108
Wang, D. D., Chen, X., and Zhang, D. (2022). Study on ecological environmental quality assessment based on cultivated land protection—A case study on Anyang. Natural Resour. Inf. 258 (06), 57–64.
Wang, J. W., Zhang, D., Nan, Y., Liu, Z. F., and Qi, D. K. (2020). Spatial patterns of net primary productivity and its driving forces: A multi-scale analysis in the transnational area of the Tumen river. Front. Earth Sci. 14, 124–139. doi:10.1007/s11707-019-0759-7
Wang, Z. M., Zhang, B., and Yu, H. (2019). Resources and environment of Northeast Asia. Changchun, Jilin: Jilin University Press.
Wu, J. G. (2022). A new frontier for landscape ecology and sustainability: Introducing the world's first atlas of urban agglomerations. Landsc. Ecol. 37, 1721–1728. doi:10.1007/s10980-022-01475-z
Wu, J. G. (2013). Landscape sustainability science: Ecosystem services and human well-being in changing landscapes. Landsc. Ecol. 28, 999–1023. doi:10.1007/s10980-013-9894-9
Wu, Y., Wu, Z., and Liu, X. (2022). Dynamic changes of net primary productivity and associated urban growth driving forces in Guangzhou city, China. Environ. Manag. 65, 758–773. doi:10.1007/s00267-020-01276-7
Xing, Z. H., Li, X. Y., Shi, Z. Y., Gu, S., and Wu, H. T. (2022). Urban expansion and its carbon emission effect of urban agglomeration in central and southern Liaoning. Remote Sens. Nat. Resour. 1–8.
Yan, H. M., Liu, J. Y., Huang, H. Q., Tao, B., and Cao, M. K. (2009). Assessing the consequence of land use change on agricultural productivity in China. Glob. Planet. Change 67, 13–19. doi:10.1016/j.gloplacha.2008.12.012
Yan, Y. L., Yu, T., and Chen, H. (2021). Development stages, spatial expansion and dynamic mechanism of national urban agglomerations. Areal Res. Dev. 40 (5), 51–57. doi:10.969/j.issn.1003-2363.2021.05.009
Yang, Y. M., Nan, Y., Liu, Z. F., Zhang, D., and Sun, Y. H. (2022). Direct and indirect losses of natural habitat caused by future urban expansion in the transnational area of Changbai Mountain. Sustainable Cities and Society 63, 102487, doi:10.1016/j.scs.2020.102487
Yang, Y. M., Zhang, D., Nan, Y., Liu, Z. F., and Zheng, W. (2019). Modeling urban expansion in the transnational area of Changbai mountain: A scenario analysis based on the zoned land Use scenario dynamics-urban model. Sustain. Cities Soc. 50, 101622. doi:10.1016/j.scs.2019.101622
Yao, Y. C., and Xia, Y. (2021). The Current Situation, Policy, and Enlightenment of Food Security in Japan and South Korea. Northeast Asia Forum 30 (5), 83–98. doi:10.13654/j.cnki.naf.2021.05.006
Yumashev, D., Hussen, K. V., Gille, J., and Whiteman, G. (2017). Towards a balanced view of arctic shipping: Estimating economic impacts of emissions from increased traffic on the northern sea Route. Clim. Change 143 (5), 143–155. doi:10.1007/s10584-017-1980-6
Zhang, D., Huang, Q. X., He, C. Y., and Wu, J. G. (2017). Impacts of urban expansion on ecosystem services in the Beijing-Tianjin-Hebei urban agglomeration, China: A scenario analysis based on the shared socioeconomic pathways. Resour. Conservation Recycl. 125, 115–130. doi:10.1016/j.resconrec.2017.06.003
Zhang, D., Huang, Q. X., He, C. Y., Yin, D., and Liu, Z. W. (2019). Planning urban landscape to maintain key ecosystem services in a rapidly urbanizing area: A scenario analysis in the Beijing-Tianjin-Hebei urban agglomeration, China. Ecol. Indic. 96, 559–571. doi:10.1016/j.ecolind.2018.09.030
Keywords: urban expansion, net primary productivity, grain production, impact, sustainable development
Citation: Shen X, Zhang D, Nan Y, Quan Y, Yang F and Yao Y (2023) Impact of urban expansion on grain production in the Japan Sea Rim region. Front. Earth Sci. 10:1025069. doi: 10.3389/feart.2022.1025069
Received: 22 August 2022; Accepted: 27 September 2022;
Published: 10 January 2023.
Edited by:
Qingxu Huang, Beijing Normal University, ChinaReviewed by:
Qiang Feng, Shanxi University of Finance and Economics, ChinaZihan Xu, Peking University, China
Jing Fu, East China Sea Fisheries Research Institute, Chinese Academy of Fishery Sciences, China
Copyright © 2023 Shen, Zhang, Nan, Quan, Yang and Yao. This is an open-access article distributed under the terms of the Creative Commons Attribution License (CC BY). The use, distribution or reproduction in other forums is permitted, provided the original author(s) and the copyright owner(s) are credited and that the original publication in this journal is cited, in accordance with accepted academic practice. No use, distribution or reproduction is permitted which does not comply with these terms.
*Correspondence: Da Zhang, zhangda@ybu.edu.cn