A novel gas sands characterization and improved depositional modeling of the Cretaceous Sembar Formation, Lower Indus Basin, Pakistan
 Furqan Aftab
 Mohammad Zafar
 Muhammad Iqbal Hajana
 Waqar Ahmad
- Department of Earth and Environmental Sciences, Bahria University, Islamabad, Pakistan
The Lower Indus Basin of Pakistan has substantial hydrocarbon potential with the Cretaceous Sembar Formation as its principal source rock. While studies have identified the shale gas potential of the Sembar Formation, no extensive research has been conducted to evaluate the hydrocarbon potential of thick packages of sands encountered within it. This study is intended to fill this research gap by identifying the hidden-untapped thick packages of sands of the Sembar Formation for the first time in the Khewari and Gambat areas. We use well log and seismic reflection data to define the thickness, depth distribution, and petrophysical properties for reservoir characterization. This integrated modeling identifies favorable zones for gas production and the spatial distribution of sand packages with excellent reservoir properties in thickness (≈200 m), almost continuous sand packages suitable for hydrocarbon exploration. The Suleman-01 well has a very good hydrocarbon reservoir potential with 70% sand volume, approximately 13% effective porosity, 3.57 millidarcys average permeability, and approximately 58–60% hydrocarbon saturation. We suggest that the post-collisional tectonics of the Indian and Eurasian plates affected the depositional geometry of the Sembar Formation in such a way that it trends from shallower to deeper from western to eastern parts of the study area. Similarly, reservoir quality sands follow the positive upward trend from west to east toward the Indian shield. We propose that the approach implemented in this study is applicable to the entire Lower Indus Basin and further toward the Rajasthan Basin in India in the east and Zagros fold-and-thrust belt in Iran in the west. This approach would help assess the undeveloped hydrocarbon potential of the Sembar Formation sands and related formations in South Asia and worldwide.
1 Introduction
The International Energy Agency forecasted that the annual global natural gas demand will increase 31% by 2040. Asia is the hub of the greatest energy demand. The ever increasing energy demand and swift depletion of natural gas reservoirs drastically imbalance the worldwide demand and supply equation. Every sedimentary depositional system exhibits unique architectural ingredients having different elements and features based on its environment of deposition and transport processes. Three-dimensional filling of a basin with an array of lithofacies and sediments within a specific environment of deposition is known as the depositional system (Toosy et al., 2021). Clastic depositional systems are influenced by three main factors, namely, 1) regional basin tectonics, 2) sea level fluctuations, and 3) the rate, type, and source of sediment supply. Regional tectonics influence basin bathymetry, basin margins, and geometry. They also control the local structures within the area, which may dictate the entry points for sediments and their distribution within a basin. Sea level fluctuations influence eustatic sea level changes, tectonically induced changes, and variations in clastic input. The rate, type, and source of sediment supply are the manifestations of depositional processes, hinterland type and climate, and nearshore system and shelf system shape and type (Richards et al., 1998). All the reservoir characteristics like shape, size, sorting, orientation, thickness, and continuity are a function of the three aforementioned factors that influence the clastic depositional systems. Understanding these geologic complexities that influence the petroleum reservoir performance is vital in determining the likelihood of the success of any prospect. Thorough and comprehensive understanding of the depositional architecture of any reservoir by modeling of all its components along with the characterization of its reservoir properties is inevitable not only to maximize the chances for the placement and orientation of accurate well location but also to enhance the production from a particular reservoir (Slatt, 2006).
The Sembar Formation is well-known for its unconventional potential and as a hydrocarbon source rock for conventional petroleum play in the Lower Indus Basin of Pakistan, which is the largest onshore basin of the country (Ali et al., 2022). The oil-to-source correlation along with geochemical analyses strongly advocated that the bulk of the hydrocarbons generated in the Indus Basin of Pakistan are derived from the Lower Cretaceous Sembar Formation and equivalent strata (Wandrey et al., 2004). The Sembar Formation is predominantly shale with intercalations of sand packages (Shah, 1977). Many exploration wells drilled through the Sembar Formation have documented the presence of thick shale and sand packages of few hundred meters such as those encountered in the Suleman-01, Aradin-01, Khario-01, Duljan Re-Entry-01, and other wells. The provenance of these thick sand packages and their hydrocarbon potential, if any, are currently unknown. Deeply buried sand facies packages vary in thickness and are heterogeneous due to varying sand–shale ratios, overburden, hydrocarbon maturation and migration, seal, trapping mechanism, porosity, and permeability. These are few factors that make Cretaceous sand geology quite complex and challenging. While these factors present challenges for successfully exploiting the sands of the Sembar Formation, the unit’s hydrocarbon potential is quite large.
One-dimensional quantitative reservoir property modeling could not be performed better than petrophysical modeling (Ajisafe and Ako, 2013). Various techniques have been proposed in the literature for defining lithology and pore fluids, as well as for identifying hydrocarbon–water contacts (Castagna and Swan, 1997; Qiao and An, 2007; Ahmed et al., 2016). The target properties of these methods such as porosity, permeability, volume of shale, water saturation, and hydrocarbon saturation are vital for reservoir assessment through careful and precise transformation of wireline log data in to the reservoir rock properties through petrophysical analysis (Ali et al., 2018; Senosy et al., 2020). Structural and stratigraphic well correlation is pivotal in mapping the vertical and lateral variation and distribution of a particular formation in terms of variation in thickness and depositional extent (Yilmaz, 2001). Seismic structural and stratigraphic interpretation is quite effective in mapping the accurate depth and lateral extent of a reservoir formation (Rezaee, 2015; Aziz et al., 2018). Seismically derived isochron and isopach mapping integrated with tracking the lateral variation of a seismic signature is effective in resolving the depositional architecture, provenance, seismic terminations, and thickness variation trend of a particular reservoir formation beyond the well control (Toosy et al., 2021).
Volumetric calculations, source rock screening, and petroleum system modeling indicate that the Sembar Formation has a significant gas potential (Sheikh and Giao, 2017). Physical characteristics and chemical composition make the Sembar Formation a proven source rock of the Lower Indus Basin (Ahmed et al., 2013). Studies on the geochemical analyses of the Sembar Formation shale demonstrate that it is a good source rock with a total organic carbon content (TOC) ranging between 0.5 and 3.5%, with an average of 1.4%. Vitrinite reflectance values range from immature (<0.6%) to overmature (>1.35%), and the unit contains mixed type-II and type-III kerogen (Wandrey et al., 2004). One-dimensional maturity modeling of the Sembar Formation suggests that this formation is sufficiently mature to be exploited for its shale gas potential, and it can also charge sand intercalations for a successful petroleum play (Qayyum et al., 2016). Environment of deposition, thermal maturity, mineralogy, and effective reservoir parameters like thickness and porosity proved the Sembar Formation as an ideal prospect for its shale gas potential (Aziz et al., 2018).
To justify the significance and novelty of this research, multiple case studies related to the Sembar Formation have been compared and considered. A lot of previous research studies on shale intervals of the Sembar Formation have been carried out and published in the past, but no extensive research work is published on the sand intervals of the Sembar Formation until now. For example, Ali et al. (2022) computed the thermal maturity and total organic carbon content for the demarcation of “sweet spot targets” for hydraulic fracturing of the Sembar shale as an unconventional resource. Aziz et al. (2018) also computed TOC from both seismic and well logs. Sheikh and Giao (2017) performed a comprehensive study on shale gas potential for the Sembar Formation shale, using primary data for geochemical analysis through rock eval pyrolysis, burial history plots, petroleum system modeling, volumetric estimation, and computation of retained gas in the shale. Qayyum et al. (2016) plotted burial history charts and thermal maturity models for the evaluation of source rock potential of the Sembar Formation. Ahmad et al. (2013) comprehensively modeled the geochemical parameters and estimated the expelled and retained volume of generated hydrocarbons along with unconventional reservoir characteristics present in the Sembar Formation shale. These authors and previous researchers had targeted shale sections of the Sembar and tried to explore it as an unconventional reservoir, using organic geochemistry as their primary tool along with some secondary approaches like thermal maturity modeling and shale gas potential of the Sembar Formation using well log data. However, until now, no one has published any substantial research regarding the provenance and hydrocarbon potential of thick sand packages encountered within deeper levels of the Sembar Formation.
This study aimed to bridge this scientific research gap by the identification of sand facies in the Sembar Formation along with the demarcation of “sweet spots” for its inherent reservoir potential through integrated modeling, mapping, and correlation via the application of reservoir characterization techniques using integrated seismic and well data. This study incorporated the spatial distribution of sand facies within the Sembar Formation in the Khewari and Gambat areas (Figure 1). We use integrated well log correlations coupled with a seismic signature and seismically derived isochron and isopach mapping to define the spatial distribution of sand facies of the Sembar Formation. Our study also examines the structural variations at the level of Sembar sands using seismic mapping and petrophysical analysis to assess its hydrocarbon potential. The outcomes of this study help geoscience researchers to explore untapped intervals of Cretaceous gas sands and hence link Sembar conventional hydrocarbon potential with its unconventional potential.
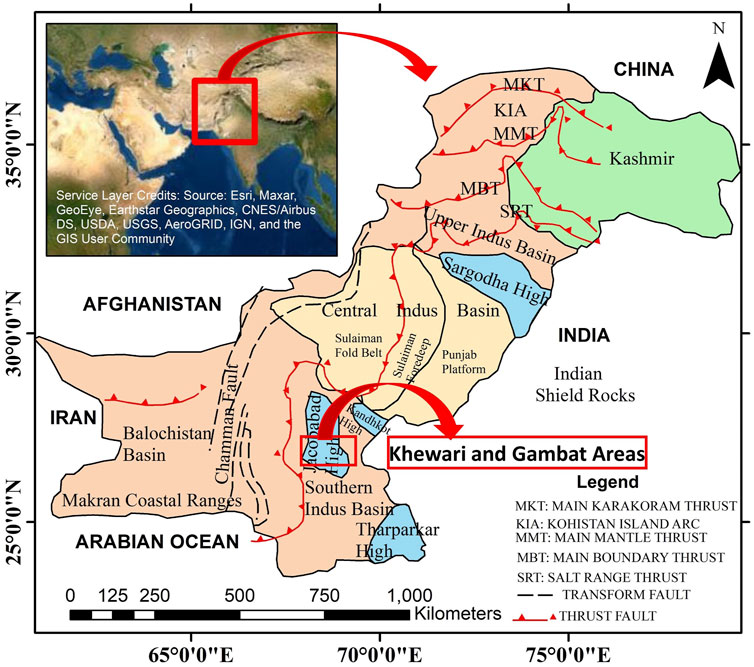
FIGURE 1. Tectonic map with major geologic features and sedimentary basins of Pakistan with the highlighted study area of this research work modified after Kadri (1995).
2 Tectonic evolution and geological setting
The tectonic history and evolution of the Indian plate began when the eastern Gondwanaland (Antarctica–India–Australia) was separated from the western Gondwanaland (Africa–South America) during Late Jurassic–Early Cretaceous. The Cretaceous Sembar Formation was deposited in the Aptian age (approximately 120 Ma ago) when greater India was separated from the eastern Gondwanaland. Structural and stratigraphic features of the Lower Indus Basin are the direct manifestation of the movement and collision of the Indian plate with the Eurasian plate (January 1997). Marine shale, sandstone, and limestone of the Lower Goru and Sembar Formations were deposited on the regional, previously erosive surface when the Indian plate drifted northward during the early Cretaceous (Abbasi, 2008). The Indian plate rotated counterclockwise after its collision with the Eurasian plate and closure of Tethys, marking the onset of the development of the Sulaiman and Kirthar fold-and-thrust belt (Jadoon et al., 1994). This collision of the Indian plate resulted in shearing along the western margin of the plate, which reactivated the extensional normal faulting in the Lower Indus Basin. In contrast, the Upper Indus Basin of Pakistan deformed within a compressional regime (Kemal, 1991). Based on paleogeographic reconstructions, the Indian plate acted as an isolated island during its long, northward drift in the Cretaceous period (Scotese et al., 1988). The Indian plate remained inundated with marine water during the Cretaceous time because of a higher sea level. The southern portion of the Indian plate uplifted because of its rifting from Antarctica during the early Cretaceous. This process resulted in the development of a gently dipping continental shelf and a foreland basin that extends from the eastern margin of the Punjab platform and continues to the western margin of the Sulaiman fold-and-thrust belt. The Lower Indus Basin had a relatively low sediment supply during the Neocomian age, as strongly suggested by lithofacies analyses (Yousaf, 2020). This period is characterized by subsidence and rise of sea level. Prior to this phase of transgression, there was a phase of regression with the sea level decline during the Lower (early) Cretaceous (approximately 145—130 Ma ago) with greater sediment supply. Hence, along with shale, thick sandstone beds, especially at the deeper levels of the Sembar Formation, were deposited. These sand units have been encountered during drilling of various wells of the Lower Indus Basin (Yousaf, 2020). A marine shelf environment coupled with regression continued during the Late Cretaceous, which resulted in the deposition of the Pab Sandstone, mostly in the western part of the basin (Wandrey et al., 2004).
Sedimentary basins of Pakistan have a large spectrum of hydrocarbon accumulations preserved in subsurface rocks over a large span of the geologic time scale. The Indus and Balochistan Basins are the two largest onshore sedimentary depocenters of Pakistan. The Indus Basin encompasses an area of 138,000 square kilometers and exhibits internal structural variation, reflecting its complex tectonic regime. The basin has significant hydrocarbon potential that draws attention from geoscientists and industry for decades (Sheikh and Giao, 2017). In total, prospective sedimentary basins of Pakistan occupy an area of around 540,000 km2, out of which 280,000 km2 is the Cretaceous system. The Indus Basin is further divided into two based on its tectonic and structural variation, namely, Upper and Lower Indus Basin. The Lower Indus Basin is further divided into Central and Southern Indus Basin. Our study area is located at the junction of the Central and Southern Indus Basin, more specifically situated at the Jacobabad–Khairpur High, where Jacobabad–Khairpur and Mari–Kandhkot Highs (together termed as Sukkur rift) separate the two basins (Raza and Ahmed, 1990). The Southern Indus Basin is bounded by the Sukkur rift in the north, Indian shield in the east, the axial belt and marginal zone of the Indian plate in the west, and the Arabian Sea in the south. Divergence began between the Indian plate and Gondwanaland onset in the Late Jurassic and hence resulted in the extensional regime of the Lower Indus Basin (Kadri, 1995).
The Cretaceous Sembar Formation has a heterogeneous lithological characteristic because of the multiple provenances and variety of sediment transport processes controlling sediment deposition. The age of the Sembar Formation is defined to be Neocomian (Lower Cretaceous), as evidenced by the Belemnite biostratigraphy with the abundance of the clay mineral glauconite as a primary characteristic of the formation (Figure 2). The Sembar Formation is present across the entire Indus Basin with shale as a primary component followed by intercalations of sandstones, siltstones, and minor limestones, with thicknesses varying from few hundred meters to 1 km (Abbasi, 2008). The sandstone encountered in the Sembar Formation is thought to be derived from the Indian shield sediments. The depositional architecture of the Sembar Formation suggested that the environment of deposition of this formation varied from the west of the Indian shield on a broad shelf, continental slope to deep marine environment. The Sembar Formation exhibits a robust petroleum system with oil and gas depicted by this formation at various intervals in multiple wells, indicating a reducing depositional condition. The proven source rock in platform fields of Badin, huge quantity of accumulated gas in the Sulaiman province, potential sandstone reservoirs at various intervals of different wells, and favorable chances of oil migration against faults from the Sembar source into the underlying Jurassic formations make sands of the Sembar Formation an attractive potential reservoir for exploration (Kadri, 1995; Abbasi, 2008).
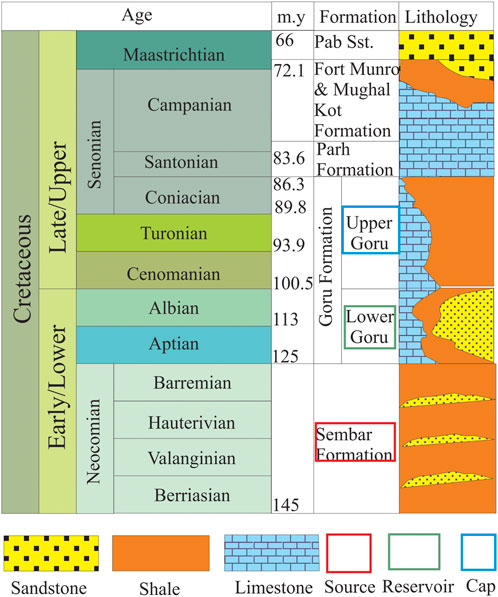
FIGURE 2. Generalized stratigraphic panel for the Lower Indus Basin of Pakistan modified after Yousaf (2020).
3 Materials and methods
The methods applied in this research are centered on well log and seismic data analysis. There are relatively few wells drilled through the Sembar Formation in the Central and Lower Indus Basin of Pakistan. Of these, only few wells penetrate the Sembar Formation and encountered Chiltan limestone. Our study focused on four wells with diverse litho-stratigraphy. These exploration wells include the Khario-01 in the northeast, Suleman-01 and Aradin-01 in the east, and Duljan Re-Entry-01 in the northwest part of the study area. All wells were drilled to a depth that they have substantial penetrations of the Sembar Formation, with the Suleman-01 well drilled to the base of the Sembar Formation. The primary target of these wells was basal and massive sands of the Lower Goru Formation. The secondary target of these wells was the Sembar Formation sand units. We analyzed 12 2-D seismic lines of multiple vintages on the Khewari and Gambat area blocks (Figure 3). The seismic data for the Khewari area block used in this study were acquired and processed by the Oil and Gas Development Company Limited from 2001 to 2005, whereas the seismic data of the Gambat area block used in this study were acquired by British Gas Exploration and Production and processed by Robertson Research International Limited in 1996. The acquisition and processing parameters of seismic data used in this study are shown in Table 1. The Suleman-01 and Aradin-01 wells were drilled in 2012, whereas the Khario-01 and Duljan Re-Entry-01 wells were drilled in 2007 and 2005, respectively. The wireline logs were acquired and processed by Schlumberger in the same years of well drilling.
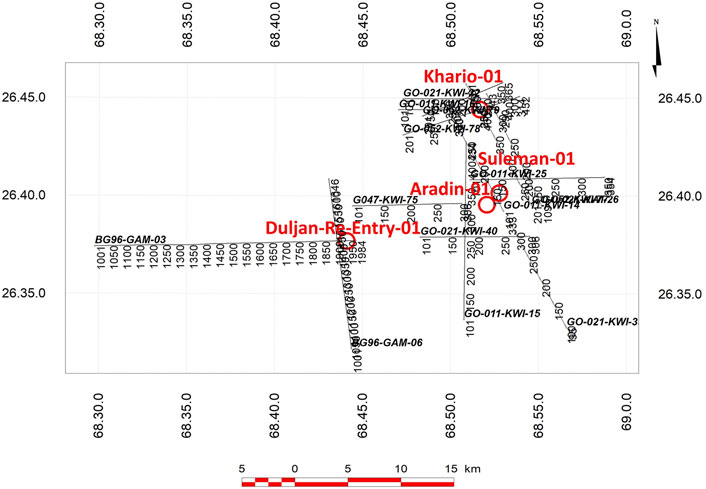
FIGURE 3. Seismic and well base map of the Khewari and Gambat areas.
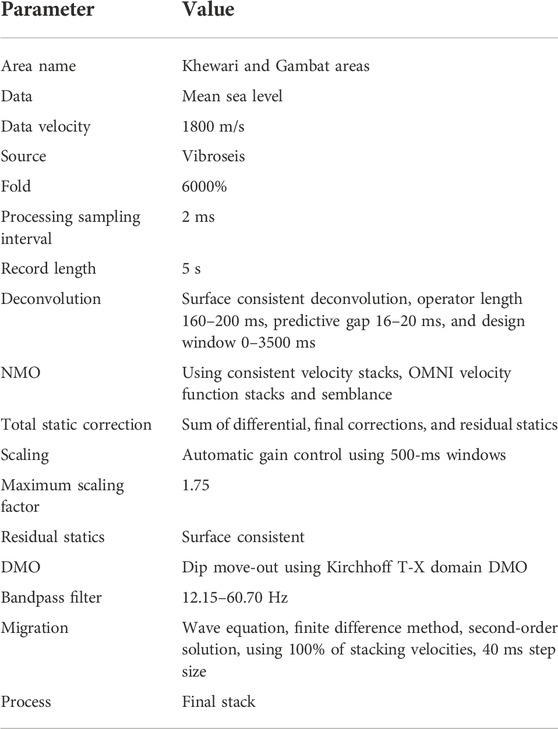
TABLE 1. Seismic data acquisition and processing parameters of the Khewari and Gambat areas used in this study.
We used the GVERSE GeoGraphix suite to perform our integrated modeling of the sands of the Sembar Formation because of the software’s powerful mapping and prospect generation capabilities, including various modules, such as Well Base, GVERSE Petrophysics, Zone Manager, X Section, GVERSE Geophysics, and GeoAtlas. All of our data were georeferenced with the World Geodetic System 1984, and our maps were developed using GVERSE GeoGraphix in an Ultimate Transverse Mercator Zone 42 North (66 E—72 E longitude). For the well data, we conducted a thorough quality check before the beginning of our analysis (Mahmood et al., 2018). Well log curve availability check was performed through available well log curve set inventory and log headers. Standardization between all well log curves was performed through curve mnemonics and curve-aliasing tools. Seismic data were verified in line length, number of shot points, CMP, shot number, X and Y coordinates with seismic headers, and parameter testing techniques. Figure 4 shows the workflow chart of the methodology adopted in this research.
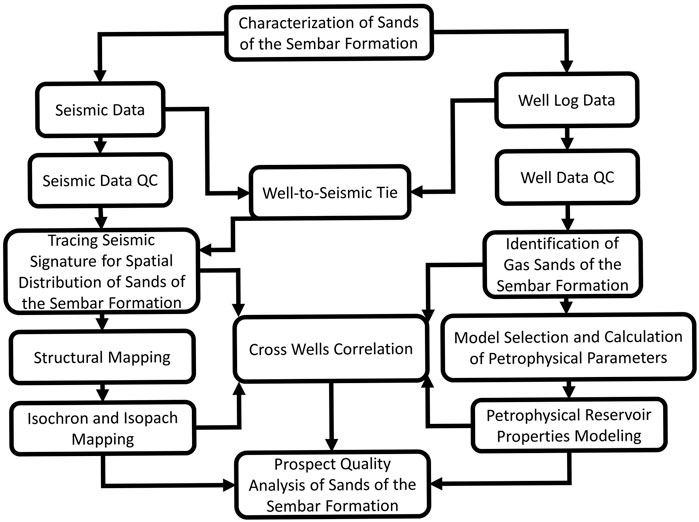
FIGURE 4. Workflow chart of the methodology adopted in this study.
3.1 Petrophysical analysis
A complete suite of log curves including, but not limited to, caliper, spontaneous potential, gamma ray, computed gamma ray, micro spherically focused log, latero log shallow, latero log deep, bulk density, and neutron and sonic (both compressional and shear) log curves, was available in the Log ASCII Standard file format of study wells. Sands in the Sembar Formation were picked in all wells using the estimation of the volume of the shale by the computed gamma ray log curve to avoid perturbations from uranium. Sandier zones were further minimized and focused after the application of hydrocarbon (oil and gas effects) and water profile filters using porosity and fluid indicator logs. Petrophysical reservoir parameters (volume of shale, total porosity, effective porosity, permeability, water, and hydrocarbon saturation) were estimated using GVERSE petrophysics for initial identification of potential prospective sand intervals of the Sembar Formation.
3.2 Correlation of wells
Well tops of all the wells were successfully loaded in the well base module with respective lithology filled against each formation. The structural correlation between all the four wells was established to see structural variation in sands of the Sembar Formation due to the up dip and down dip structural heterogeneities present between all the wells, especially because of the distance factor. Sand thickness variation in the Sembar Formation was noticed via correlating the wells stratigraphically to see the deposition pattern of sands within and in between the four wells.
3.3 Well-to-seismic tie
Datum, resolution, and scale differences between well and seismic data necessitates precise well-to-seismic tie for accurate well-cum-seismic modeling. The corridor stack is the direct output of the vertical seismic profile, which is the most accurate and up to date technique for well-to-seismic tie. Accurate vertical velocity estimation at a particular formation depth using the check shot survey is quite in use next to vertical seismic profiling for demarcating the true reflector time on the seismic section (Yilmaz, 2001). In case of non-availability of the two techniques, generation of synthetic seismogram using sonic and density log curves could be used. Seismic data processing picked velocity functions using stacking average velocity (available above every shot point on seismic section) is the last way to get control of true horizon picking before the onset of seismic interpretation after generating a time-depth chart. The well-to-seismic tie was established in the current research using the true vertical velocity and hence vertical time coupled with the depth with good correlation coefficient using the Suleman-01 well data. Velocity functions were also solved for the remaining two wells for more precise horizon picking. Time of top of Basal Sands, Talhar Shale, Massive Sands, Sembar Formation, and Chiltan were picked. The challenging part of this well-to-seismic tie was the accurate picking of the time of sands of the Sembar Formation because of the non-availability of its well top depth. The time–depth relationship correlated with the encountered depth of sands of the Sembar Formation in Suleman-01 well coupled with tracing the seismic signature of the strata helped in true picking of time of the Sembar sands on the seismic section.
3.4 Horizons and fault marking
Six horizons, namely, top of Basal Sands, Talhar Shale, Massive Sands, Sembar Formation, sands of Sembar Formation, and Chiltan identified by well-to-seismic tie (with Suleman-01 well) were marked on the control line following the lateral continuity of the seismic signature. The mis-tie analysis was performed before proceeding with the seismic interpretation to the rest of the seismic lines. Negligible mis-ties of around 7–13 milliseconds were adjusted on required seismic lines to compensate the difference in vintage and processing parameters because the seismic lines belong to two different blocks, acquired at different times. After this step, all the horizons were exfoliated on the rest of the seismic lines using the loop tie with good match at tie points. Faults were marked initially on all and nearby control lines and then correlated on all the intersecting lines based on structural variation, displacement, and discontinuity in strata, first on all the seismic sections, then traced it on the entire seismic base map.
3.5 Mapping time and depth surfaces
Because the surface seismic signature is displayed in two-way time units, hence, all the picked horizons manifested the subsurface strata in two-way time units. Two-way structural time contour maps were generated for target horizons, top of the Sembar Formation and sands of the Sembar Formation. The triangulated velocity model method was used as a depth conversion method with global triangulated as a velocity model. Interpretation data were used as reference data with seismic horizons/well formation tops as a data source with average velocity as a mean for depth conversion. The minimum curvature gridding algorithm was used for fastest execution of the mapping grid layer into time and depth contour maps.
3.6 Isochron and isopach mappings
Time- and thickness-based variation in sands of the Sembar Formation across the entire seismic extent beyond the well control were populated using isochron and isopach mapping, respectively. An isochron map shows contour lines of equal time between two seismic events, whereas an isopach map shows contour lines of equal thickness between two seismic events (Afzal et al., 2009). The top and base (which is top of Chiltan) of sands of the Sembar Formation on all seismic lines were traced to manifest time- and thickness-based variation regionally.
4 Results and discussion
Based on the methodology described in the previous section, this section will sequentially explain the results of the techniques adopted in the depositional modeling and characterization of gas sands of the Sembar Formation. The results of reservoir characterization based on petrophysical modeling will be discussed in the first step. Structural complexities and seismic signatures for spatial distribution of sands of the Sembar Formation are laterally extended from the well-to-seismic extent in the second step. Regional depositional architecture based on well-to-seismic integration followed by structural and stratigraphic correlation by geologic mapping is discussed as the third and last step.
4.1 Petrophysical modeling
Petrophysics is a very handy discipline in establishing the bridge between core/well cuttings and seismic data set because its scale and resolution lies in between the two (Afzal et al., 2009). Petrophysical analysis is the backbone of reservoir characterization. All the reservoir properties will either precisely or erroneously be extrapolated from this one-dimensional modeling (Ali et al., 2018). Therefore, an accurate petrophysical model is a key to precisely unravel the true potential of a reservoir (Qadri et al., 2019; Haque et al., 2022). The Suleman-01 was chosen as a reference well for the display of detailed petrophysical modeling for this study because it is the deepest drilled well with a complete suite of log curves available in its Log ASCII standard file. Demarcation of sands of the Sembar Formation and estimation of five key reservoir parameters, that is, volume of shale, marking of hydrocarbon profile and gas effect, porosity (average and effective), permeability, and water and hydrocarbon saturation, along with their results will be discussed as follows.
4.1.1 Demarcation of sands of the Sembar Formation
The total thickness of the Sembar Formation in the reference well, Suleman-01, is 665 m with the top and bottom of the Sembar Formation encountered at 3,785 m and 4,450 m, respectively. Gamma ray logging and estimation of the volume of shale suggested the presence of almost a 200-m-thick package of gas sands in the lower section of the Sembar Formation from 4,070 to 4,270 m interval of well (Figure 5). Similar thick and thin packages of gas sands are also encountered at the deeper levels of the Sembar Formation in Aradin-01, Khario-01, and Duljan Re-Entry-01 wells.
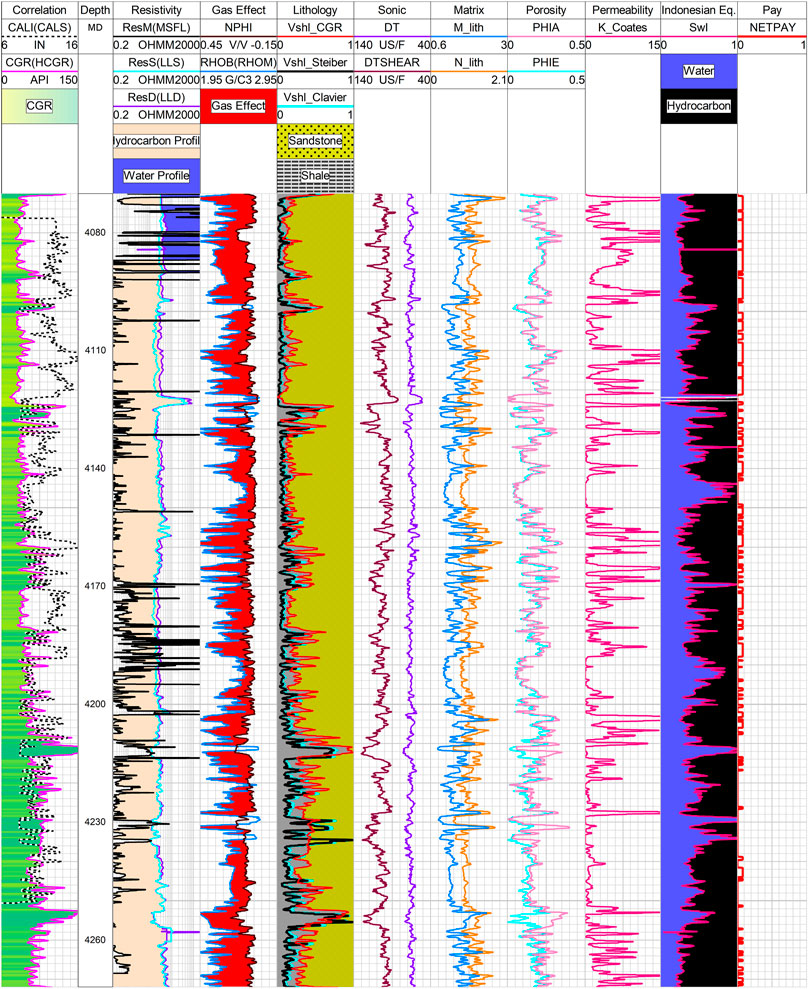
FIGURE 5. Detailed petrophysical modeling of the Suleman-01 well in a complete reservoir zone of ∼200-m-thick sands of the Sembar Formation from 4070 to 4270 m.
4.1.2 Volume of shale
Volume of the shale is the most important petrophysical parameter upon which the accurate estimation of all other reservoir properties depends upon like porosity and water saturation (Ashraf et al., 2019). Estimation of the true volume of shale in predominantly shale or shaly sand formation is another challenge because this estimation by the popular gamma ray index method overestimates the shale volume because the heterogeneous characteristics of shale does not follow the straight line linear relationship between gamma ray index and volume of shale mentioned in Eq. 1 (Poupon and Gaymard, 1970). Various non-linear methods that incorporate the anisotropic behavior of shaly sand lithology and gives the best estimates of shale volume are (Stieber, 1970; Clavier et al., 1971) with their empirical Eqs. 2, 3 as follows:
where IGR is the gamma ray index, GRlog is the raw log curve recorded values, GRmin is gamma ray minimum, GRmax is gamma ray maximum, Vshl(Clavier) is the volume of shale estimated by the Clavier method, and Vshl(Steiber) is the volume of shale estimated by the Steiber method. The linear gamma ray index method can be equated to the volume of shale in clean sands, but in case of dirty sands, non-linear methods are best to use for precise results, especially the Steiber method is more suitable for gas-saturated reservoirs (Adeoti et al., 2009). Above all other methods, specialized modern logs like spectral gamma ray (SGR) and computed gamma ray (CGR) logs are known to best compute the shale volume of dirty sands. SGR with thorium, potassium, and uranium curves estimates separate spectra of each radioactive component present in the formation, whereas CGR gives a combined estimation of the thorium and potassium contents excluding the uranium component. Fortunate availability of GR, SGR, and CGR well log curves in the Suleman-01 well allowed the computation of volume of shale by all the aforementioned methods and test the implications of each one of them. Computation of the volume of shale by the Steiber and Clavier methods using simple gamma ray log curves given with minimum shale volume. Volume of shale estimated with thorium and CGR log curves is almost the same (as both curves overlay each other) but a little more than the Steiber and Clavier methods (Figure 5). Since the CGR log curve is available in all four wells (unlike SGR) to best serve the correlation purpose and more accurately calculated the volume of shale because it incorporates the thorium and potassium contents only, therefore, the volume of shale estimated using the CGR log curve provides us with an average estimated volume of shale in the gas sand zone of Suleman-01 well as 0.2918 (29.18%). This is the average value for an entire 200-m gas sand zone with major upper portion containing approximately 89% sands and 11% shale as compared to 71% sand presence in the deeper part of the well (Figure 5).
4.1.3 Hydrocarbon profile and gas effect
The presence of highly resistive hydrocarbons is indicated by relatively high LLD values with an average of approximately 565.51 ohmmeter in the 200-m thick gas sand zone of Suleman-01 well as this log curve reads the resistivity of an un-invaded zone. MSFL and LLS have shown a large separation, but LLS and LLD have displayed a very small separation. This small contrast between intermediate and high resistivity values provides insight about the presence of oil in small quantity. Integration with porosity logs has shown that the gas saturated zone in and around the well bore affects both bulk density and neutron porosity log recordings in a way that bulk density decreases because gas is the least dense fluid among hydrocarbons, whereas the neutron porosity curve also decreases toward a lower side because the bombarded neutrons got captured by a greater number of hydrogens in the gas hydrocarbon of the formation due to similar atomic weight (Rider, 1986). This incorporation of gas decreased the two opposite scaled bulk density—neutron porosity curves gave rise to a crossover filled with a red gas effect in 95% of the zone of interest from 4,070 to 4,270 m (Figure 5).
4.1.4 Porosity
Porosity is an important reservoir property to precisely estimate the true capacity of a sedimentary rock to store fluids in its pore spaces (Rider, 1986). Well logs run in a gas-filled reservoir zone affects both porosity logs, that is, neutron and density logs with underestimated and overestimated porosities, respectively (Peters, 2012). Neutron tool measure porosity directly (PHIN), whereas density-derived porosity (PHID) is a function of density of a rock’s matrix (RHOM) taken as 2.65 g/cc for sandstone, bulk density of a rock (RHOB) measured by the density log curve, and density of a drilling fluid (RHOF) taken as 1.38 g/cm3 given in log header, computed by Eq. 4 (Glover, 2000). Combination of the density and neutron porosity results in an average porosity (PHIA) that is used to minimize the effect of over- and under-estimation of porosity given by Eq. 5 (Glover, 2000). Interconnectivity of rock pore spaces excluding the effect of volume of shale is effective porosity (PHIE) mentioned in Eq. 6 (Glover, 2000).
The arithmetic average calculated values in the 200-m-thick gas sand zone of Suleman-01 well was 0.1857 (18.57%) for average porosity and 0.1310 (13.10%) for effective porosity (Figure 5).
Mineral and fluid identification of a rock can be effectively determined using the Schlumberger CP-8 M-N plot for mineral identification. M and N are porosity-independent lithology identification parameters (formulas mentioned in Eqs. 7, 8) except in gas-bearing zones, where slowness in time of sound wave in fluid is DTfld taken as 185 μs/ft, slowness or change in sonic P-wave measured by sonic log is DT, bulk density of a rock is RHOB measured by the density log curve, and density of a drilling fluid is RHOF taken as 1.38 g/cm3 given on log header. PHIN is a neutron log porosity measured, and PHINF is a neutron log porosity measured in a water-based drilling mud taken as 1.00.
The average computed M and N values are 1.4096 and 1.0981, respectively, which calibrate and confirm the presence of gas demarcated by bulk density-neutron porosity cross-over in the reservoir zone, as shown in Figure 5.
4.1.5 Permeability
A porous medium’s permeability, such as a reservoir rock, is a measurement of how well fluids may pass through its network of linked pore spaces. Permeability is affected by layering, sorting, clay swelling, pore size, cementation, compaction, and sphericity of grains. Permeability is also affected by and affects capillary pressure, displacement pressure, effective porosity, and irreducible water saturation. Lowest achievable water saturation by displacement through oil or gas up to a certain extent is known as irreducible water saturation (Raza et al., 2015). After the Tixier and Timur models proposed in 1949 and 1968, respectively, Coates and Dumanoir proposed their model of permeability estimation in 1974 (Balan et al., 1995). This model of Coates and Dumanoir was the first model with the application of various corrections that satisfies zero porosity and zero permeability at 100% irreducible water saturation (Balan et al., 1995). Therefore, this method is also valid for the shale formations and for those that are not at irreducible or residual water saturation. Permeability is a function of interconnectivity of pore spaces within the rock matrix determined by effective porosity (PHIE) along with irreducible water saturation (Swirr), further modified by Coates and Denoo in 1981 (Balan et al., 1995), where permeability has an inverse relationship with irreducible water saturation. Computation of permeability given by the Coates model is a function of effective porosity (PHIE) and irreducible water saturation (Swirr) mentioned in Eq. 9.
Average computed permeability (k) in millidarcy in a reservoir zone calculated by Coates formula obtained an average value of 3.57 millidarcys from a range of 0–35.86 millidarcys (Figure 5).
4.1.6 Water saturation and net pay
There are many water saturation models proposed by many, but the most simple and classical model is formulated empirically (Archie, 1942), as given in Eq. 10. Archie-type formations are those where both formation conductivity and formation water conductivity dropped down to zero in clean (sandier) formations (Archie, 1942). However, the shale sand case is not simple. Application of Archie equation resulted in an overestimation of water saturation and hence missed a pay zone. An extra conductive term is required to include the conductivity effect of shale to compute true water saturation of the formation proposed by Poupon and Leveaux (1971) known as the Indonesian model, given in Eq. 11. Both the models are applied in this study, and it is noted that the average water saturation estimated through Indonesian equation is 0.42 (42%), which is remarkably less as compared to Archie’s derived water saturation computed in the reservoir zone of sands of the Sembar Formation.
where
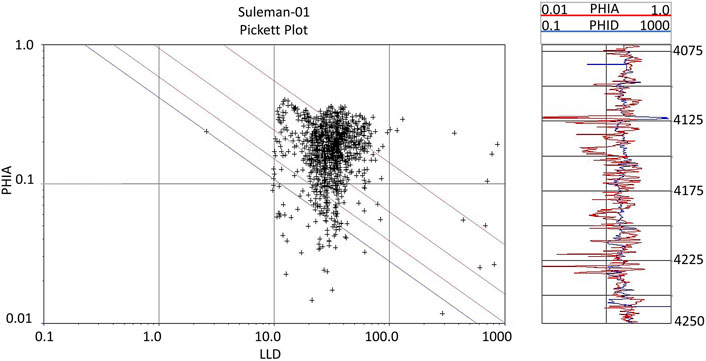
FIGURE 6. Computation of formation water resistivity Rw from 4075 to 4250 m reservoir interval through the Pickett plot method using average porosity (fraction) and latero log deep resistivity (ohmmeters) curves.
The promising prospective zone within the entire 200-m-thick gas sand zone was subjected to cut off values, as mentioned in Eq. 12 of three main petrophysical parameters with volume of shale as 30%, effective porosity as 7%, and water saturation as 50%. The overall net pay zone is almost 70% of the entire reservoir zone.
where Vshl is the volume of shale, PHIE is the effective porosity, and SwI is the water saturation estimated through Indonesian equation, as measured in the previous section. All the measured reservoir properties like volume of shale, marking of the hydrocarbon profile and gas effect, porosity (average and effective), permeability, and water and hydrocarbon saturation are shown in the form of log curves in Figure 5.
4.2 Spatial distribution of sands in the Sembar Formation
After the detailed reservoir characterization of the gas sands of the Sembar Formation at all the wells, the next step was to spatially map the presence and distribution of these gas sand packages using the seismic data beyond the well control. The Suleman-01 and Aradin-01 wells are closest in their location to seismic line O-011-KWI-14, and Duljan Re-Entry-01 was closely tied with seismic line BG96-GAM-03. The GR log curve decreased suddenly at the inception of sands of the Sembar Formation. This GR log curve was correlated with peak amplitude on seismic data using time-depth chart to precisely pick the seismic reflector of sands of the Sembar Formation, as shown in Figure 7 and Figure 8. The reflector of the top and bottom of sands in the Sembar Formation was marked at a depth corresponding to a two-way time point of 2,650 ms and 2,820 ms on seismic line O-011-KWI-14, respectively. The reflector of sands of the Sembar Formation is then jump-correlated on well control lines and marked on the entire seismic extent through a loop tie. Tops of Basal Sands, Talhar Shale, Massive Sands, Sembar Formation, and Chiltan are also marked across the entire seismic extent for reference. The seismic reflector of sands of the Sembar Formation got attenuated and hence difficult to trace, especially in the western part of the study area due to the increase in the shale content (Figure 8). Like this, the western portion of the study region saw severe tectonic activity and faulting due to its proximity to the western limit of the Jacobabad High (Figure 8).
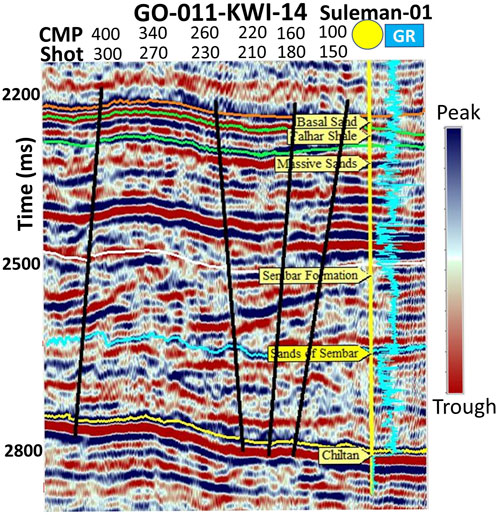
FIGURE 7. Interpreted seismic line O-011-KWI-14 of the Khewari block with GR log superimposed on it along with marked horizons and faults on it.
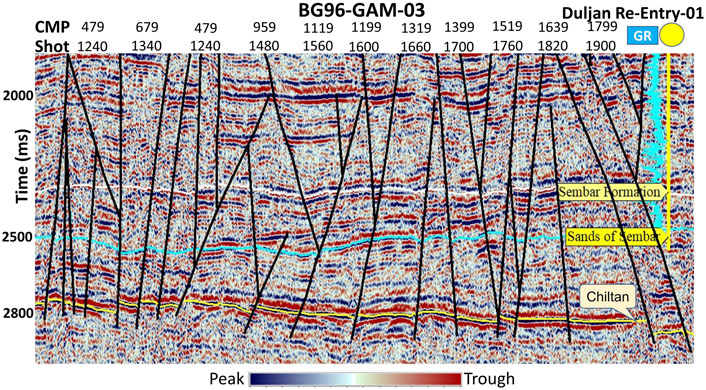
FIGURE 8. Interpreted seismic line BG96-GAM-03 of the Gambat block with GR log superimposed on it along with marked horizons and faults on it.
In the study area, there is normal faulting and a strike–slip component. These trans-tensional tectonics severely restricted the vertical throw of the faults to very less. Most of the major faults initiated from the early Cretaceous, penetrated down, and tied to Jurassic strata with the demarcation of horst and graben structures in the study area. Many splays of the faults were originated from these main faults. Three major faults were traced on the seismic base map trending in a northwest–southeast orientation, based on the available seismic data. Two-way time and depth contour maps were furnished with contour intervals of 5 ms and 10 m, respectively. These contour maps depicted shallower onset of sands of the Sembar Formation within the Gambat area block, which is at the western boundary of Jacobabad High, and these sands eventually go deeper since the inception of the Khewari area block in the eastern part of the study area. Suleman-01 and Aradin-01 wells were drilled on two-way fault-bounded closure on the horst block along northwest–southeast trending faults. The Khario-01 well was drilled on three-way fault-bounded closure on the tilted fault block along northwest–southeast trending faults, as shown in Figure 9 and Figure 10.
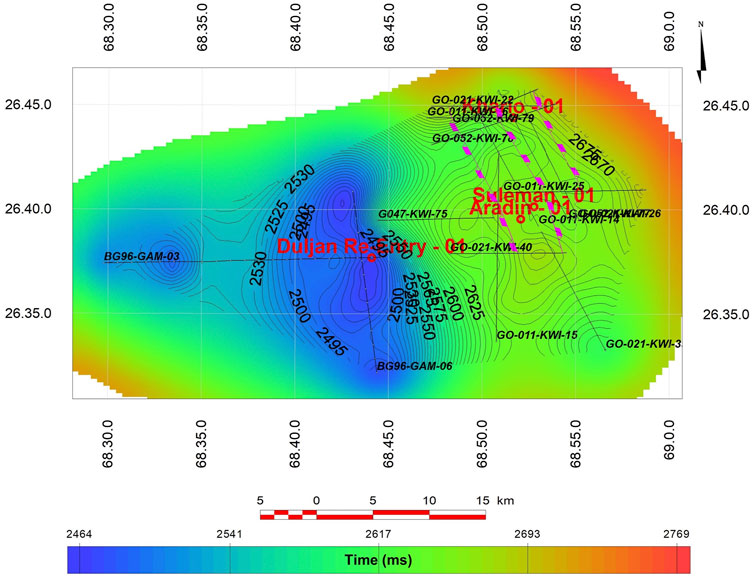
FIGURE 9. Two-way time structural map of sands of the Sembar Formation.
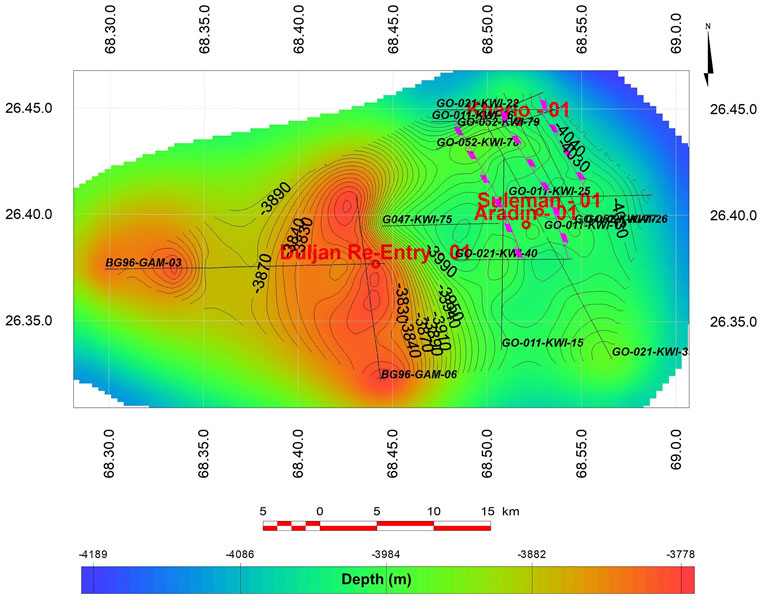
FIGURE 10. Depth structure map of sands of the Sembar Formation.
4.3 Well-to-seismic integration for the depositional modeling of gas sands of the Sembar Formation
All four wells' structural correlation from west to east was modeled using the mean sea level as the reference data. In comparison to the other wells, the Duljan Re-Entry-01 well is situated at the border of a structural high and was drilled down from shallow surface data, as shown in Figure 11. Stratigraphic correlation compares the well tops of the Sembar Formation in all four wells from west to east. The Sembar Formation’s top was found in the Duljan Re-Entry-01 well at 353.4 m and 410.71 m of thickness, the Aradin-01 well at 3,797 m and 473 m of thickness, the Suleman-01 well at 3,785 m and 665 m of thickness, and the Khario-01 well at 3773 m and 368 m of thickness. The reservoir zone within sands of the Sembar Formation in all four wells is marked based on petrophysical analysis, as shown in Figure 12.
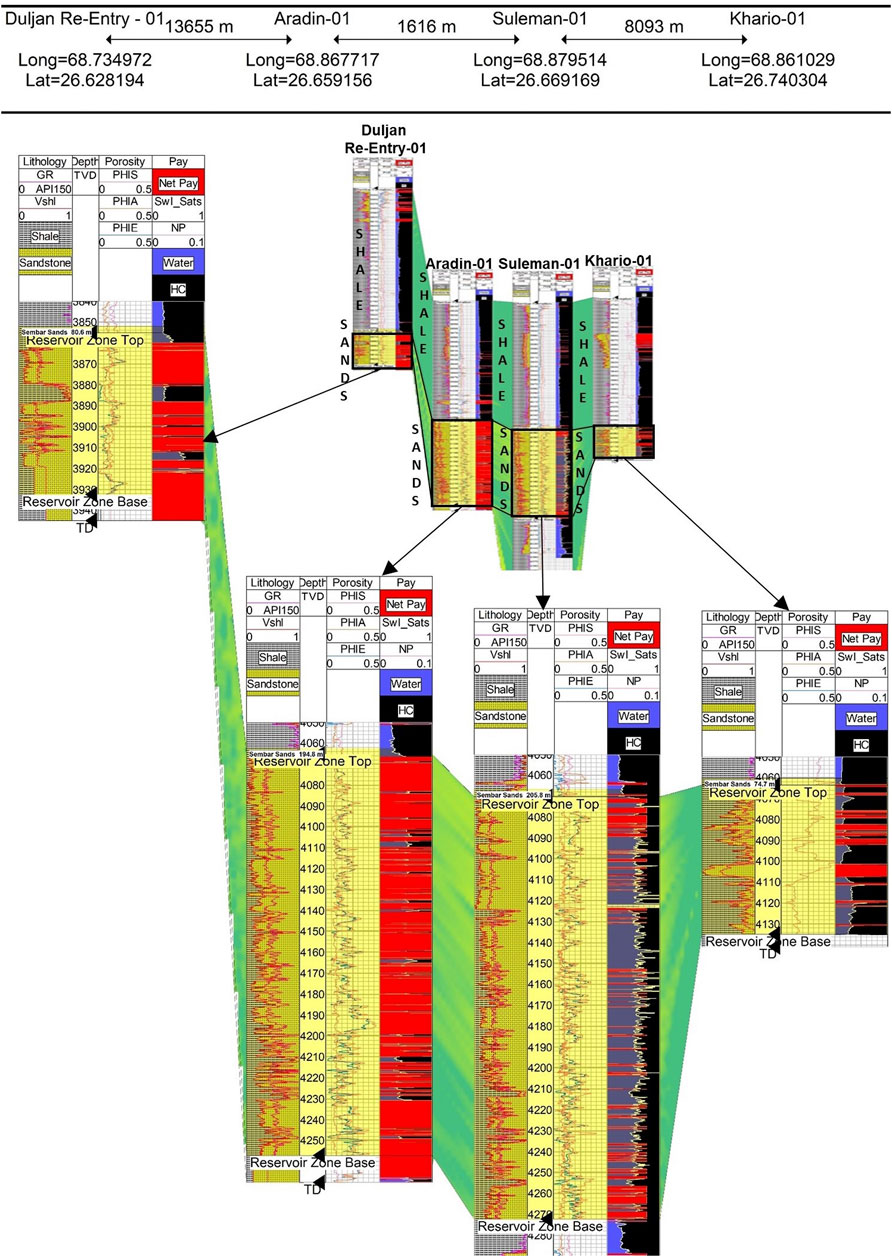
FIGURE 11. Structural correlation of wells; Duljan Re-Entry-01, Aradin-01, Suleman-01, and Khario-01 (structurally shallower from the west to east).
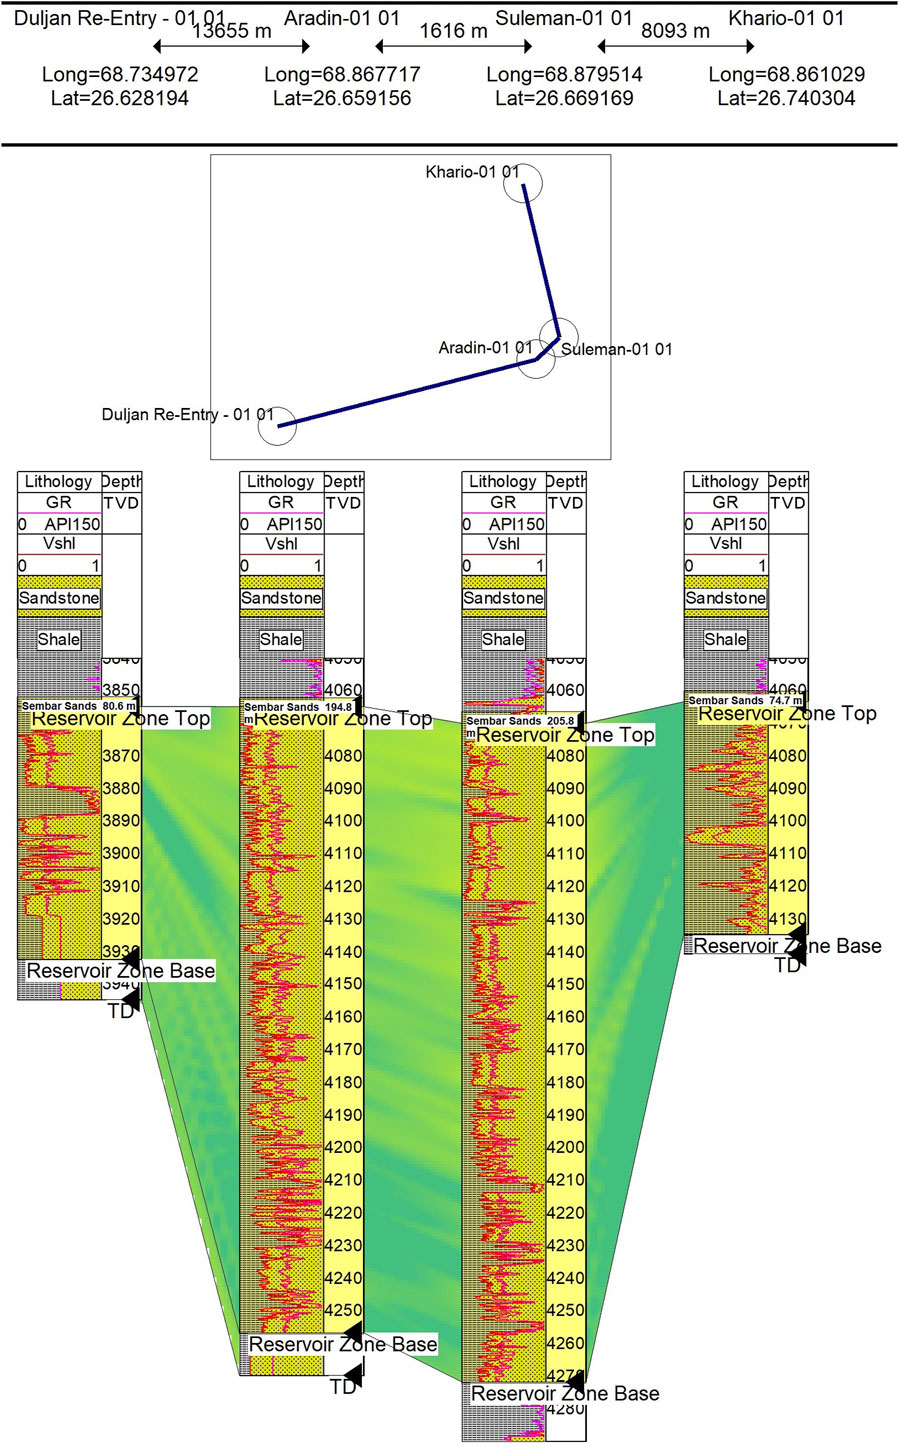
FIGURE 12. Stratigraphic correlation of wells; Duljan Re-Entry-01, Aradin-01, Suleman-01, and Khario-01 from west to east.
The Suleman-01 well is the only well in our study which is drilled to the base of the Sembar Formation. Because of data limitations, isochron and isopach mapping must be linked with well-based stratigraphic correlation in order to accurately map the thickness trend and depositional modeling of sands in the Sembar Formation. With the integration of well and seismic data, time- and thickness-based contour mapping between two seismic events, i.e., the top and base of Sembar Formation (top of Chiltan), was created. The contour intervals used to create the isochron and isopach maps were 15 ms and 10 m, respectively. This allowed us for the regional picking of the top and base of the Sembar Formation on the entire seismic data. To measure the thickness of the Sembar Formation sands, time units were converted to thickness units (Figure 13 and Figure 14). According to the isochron and isopach maps, sands of the Sembar Formation were deposited at a shallow level in the west and became deeper toward the east. Similarly, the thickness trend of sands is higher, lower, and then again higher in western, central, and eastern side of the study area, respectively. Therefore, as indicated by the earlier study by Kadri (1995), the thickness of sands of the Sembar Formation is typically increasing from west to east, indicating proximity to the source. Sands in the Sembar Formation are abundant in the center and close to the formation’s eastern boundaries in the Lower Indus Basin, but they tend to diminish in the west, where alluvial plains function as a trap for sand accumulation. While shale in the Lower Indus Basin’s Sembar Formation is abundant in the west and tends to decrease correspondingly to the formation's eastern boundaries (Kadri, 1995).
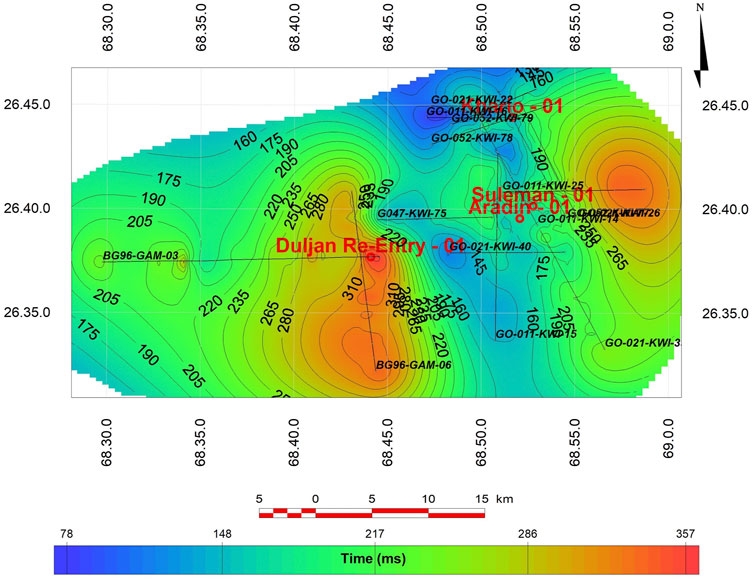
FIGURE 13. Isochron map of sands of the Sembar Formation (blue shows minimum thickness, whereas red shows maximum thickness).
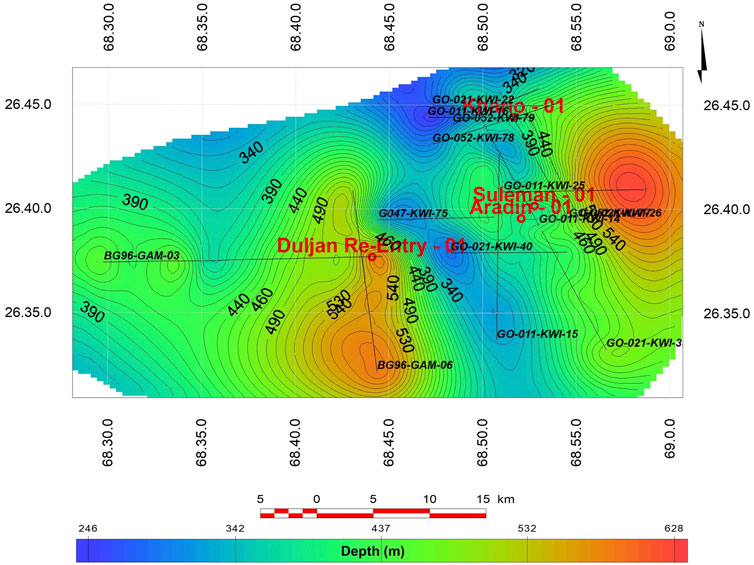
FIGURE 14. Isopach map of sands of the Sembar Formation (blue shows minimum thickness, whereas red shows maximum thickness).
4.4 Implications of this study and a way forward
A summary of reservoir properties for the Sembar Formation sands is listed in Table 2. The predominant sand unit is about 200 m thick, with an average porosity of 18% and effective porosity of 13%. The 58% hydrocarbon saturation is commercially viable to explore, not only within the Indus Basin but also across the adjacent international borders as well. The most prolific and productive sections of the Sembar Formation also extend to the east and west of this study area in the Rajasthan Basin of India and in the Zagros fold-and-thrust belt in Iran, respectively (Klett et al., 2011; Opera et al., 2013). These reservoir properties are encouraging enough to investigate and drill for the hydrocarbons, as shown in Figure 15A. The average permeability is relatively low among all other reservoir properties. There is a slight decrease in permeability with depth, as shown by the trend line in Figure 15B. This low average of permeability is due to sandstone diagenesis, compaction, and overburden pressure at such a great depth, as compared to conventional sandstone permeabilities of other gas fields in Pakistan, as reported by Raza et al. (2015). However, nevertheless, the permeability average is about 3.5 millidarcys, which is much higher than the tight-sandstone category having permeability less than 0.1 millidarcy (Zhang et al., 2012). The gross thickness of the Sembar Formation tends to increase from around 50 m to more than 1,000 m and thickens toward the depocenter from the northwest to southeast in the Lower Indus Basin as documented by Shah (2009); Ahmad et al. (2013). The earlier work of these and other scholars, whose research contributions are mentioned in 1.1 had used primary data like core samples and well cuttings from shale units of the Sembar Formation, calibrates the validity of our depositional modeling and architecture of the Sembar Formation suggested in this study. We recommend that in order to further advance our study, core-plug-derived reservoir parameters within sands of the Sembar Formation should be integrated with high-resolution three-dimensional seismic grid and populated beyond the well control using seismic inversion algorithms.
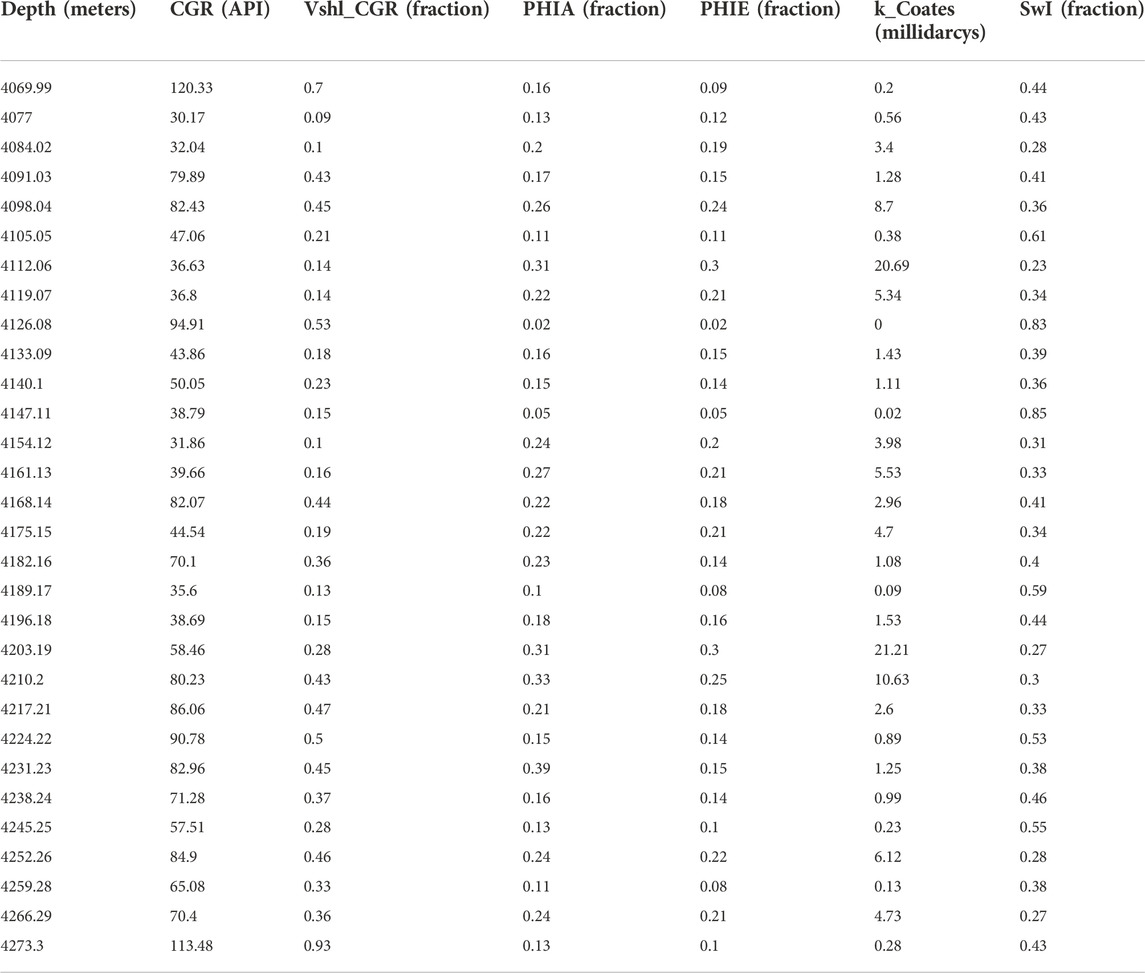
TABLE 2. Quantitative analysis of the petrophysical properties computed in the Sembar Formation sands.
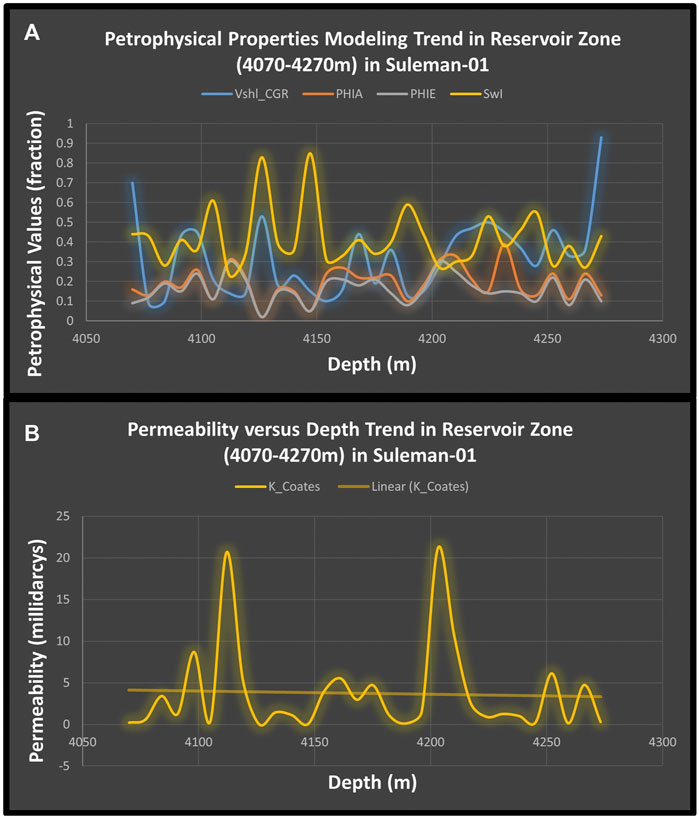
FIGURE 15. (A) Petrophysical properties modeling trend in the sand reservoir zone (4070–4270 m), Suleman-01 well. (B) Permeability vs depth in the reservoir zone (4070–4270 m), Suleman-01 well.
5 Conclusion
We analyze well logs and 2-D seismic data to model the hydrocarbon reservoir potential of thick packages of gas sands within the Sembar Formation in the Khewari and Gambat areas of the Lower Indus Basin. Petrophysical modeling in the wells of Khewari and Gambat blocks has shown up to a maximum of ∼200 m continuous thick packages of gas sands with excellent hydrocarbon reservoir properties. These include at least 70% or higher sand–shale ratio, approximately 13% effective porosity, 3.57 millidarcys average permeability, and approximately 58–60% hydrocarbon saturation. These reservoir properties between wells of the Khewari and Gambat blocks make a strong case for prospectivity for sands of the Sembar Formation. Seismic structural mapping shows the presence of northwest–southeast trending gently dipping normal faults between the horst and graben structures. These faults likely include a strike–slip component reflecting the trans-tensional tectonics of the study area. Fault complexity enhances from the east to west toward the Jacobabad–Khairpur High. The tilted fault blocks with two-way and three-way dip closures serve as potential traps. Mapping of the spatial distribution of sands in the Sembar Formation yields two primary conclusions: first, the structural orientation of the Indian and Eurasian plates developed by post-collisional tectonism in such a way that the Sembar Formation at shallower levels is more highly structured in the western part of the study area. Second, the thickness and reservoir quality of the Sembar Formation sands is increasing from the west to east, showing proximity to a source near the eastern limit of the Indian shield. Since the Sembar Formation is also extending toward the Rajasthan Basin in India in the eastern part, and toward the Zagros fold-and-thrust belt in Iran in the western part of the study area, the methodology applied in this study could be applied to regionally assess the untapped hydrocarbon potential of sands of the Sembar Formation.
Data availability statement
The original contributions presented in the study are included in the article/Supplementary Material; further inquiries can be directed to the corresponding author.
Author contributions
FA provided the main conceptual idea, literature review, implementation of methodology, data interpretation and analysis, and writing and review of the manuscript. MZ supervised the study and meticulously reviewed the manuscript. MIH put forward the research idea, contributed to data analysis, and reviewed the manuscript. WA contributed to furnishing the maps. All authors contributed to the article and approved the final and submitted version.
Acknowledgments
Authors would like to thank Directorate General of Petroleum Concession (DGPC) Pakistan for allowing the use of seismic and well log data for research and publication purposes. We also thank LMKR Pakistan for providing the license of GVERSE GeoGraphix software for geological and geophysical interpretation and modeling. FA would like to thank Higher Education Commission of Pakistan for the award of an International Research Support Initiative Program (IRSIP) scholarship to conduct research at Tufts University, United States. Special thanks to the Department of Earth and Planetary Sciences, Harvard University, United States for providing the office space, technical assistance, and laboratory facility of the Structure Geology and Earth Resources group for the author’s entire period of research work in the United States. Special acknowledgement for the Department of Earth and Climate Sciences, Tufts University, United States and Department of Earth and Environmental Sciences, Bahria University, Islamabad, Pakistan for providing the office, laboratory facility, and technical assistance to complete this study. Special thanks to Prof. John H. Shaw from the Department of Earth and Planetary Sciences, Harvard University, United States and Prof. Grant Garven from the Department of Earth and Climate Sciences, Tufts University, United States, for the technical input and meticulous review for the improvement of this manuscript. The authors also acknowledge and would like to thank the reviewers for their suggestions and insightful comments for the improvement of this manuscript.
Conflict of interest
The authors declare that the research was conducted in the absence of any commercial or financial relationships that could be construed as a potential conflict of interest.
Publisher’s note
All claims expressed in this article are solely those of the authors and do not necessarily represent those of their affiliated organizations, or those of the publisher, the editors, and the reviewers. Any product that may be evaluated in this article, or claim that may be made by its manufacturer, is not guaranteed or endorsed by the publisher.
References
Abbasi, A. (2008). Stratigraphy and historical geology of Pakistan. Pakistan: Department and National Centre of Excellence in Geology, University of Peshawar.
Adeoti, L., Ayolabi, E., and James, P. (2009). An integrated approach to volume of shale analysis: Niger delta example. World Appl. Sci. J. 7, 448–452.
Afzal, J., Kuffner, T., Rahman, A., and Ibrahim, M. (2009). “Seismic and well-log based sequence stratigraphy of the early Cretaceous, Lower Goru C sand of the Sawan gas field, middle Indus Platform, Pakistan,” in Proceedings of the PAPG/SPE Annual Technical Conference, Islamabad, Pakistan, November 17–18, 2009.
Ahmad, N., Mateen, J., Shehzad, K., Mehmood, N., and Arif, F. (2013). Shale gas Potential of lower Cretaceous Sembar formation in middle and lower Indus basin, Pakistan. Pak. J. Hydrocarb. Res. 22, 51–62.
Ahmed, N., Khalid, P., and Anwar, A. W. (2016). Rock physics modeling to assess the impact of spatial distribution pattern of pore fluid and clay contents on acoustic signatures of partially-saturated reservoirs. Acta Geod. geophys. 51 (1), 1–13. doi:10.1007/s40328-015-0101-0
Ahmed, W., Azeem, A., Abid, M. F., Rasheed, A., and Aziz, K. (2013). “Mesozoic structural architecture of the middle Indus Basin, Pakistan-controls and implications,” in Proceedings of the PAPG/SPE Annual Technical Conference, Islamabad, Pakistan, November 26–27, 2013, 1–13.
Ajisafe, Y., and Ako, B. (2013). 3-D seismic attributes for reservoir characterization of Y field Niger Delta, Nigeria. IOSR J. Appl. Geol. Geophys. 1 (2), 23–31. doi:10.9790/0990-0122331
Ali, A., Alves, T. M., and Amin, Y. (2022). Integrated geophysical analysis of the Sembar Formation, central Indus basin, as an unconventional resource. J. Nat. Gas. Sci. Eng. 101, 104507. doi:10.1016/j.jngse.2022.104507
Ali, A., Alves, T. M., Saad, F. A., Ullah, M., Toqeer, M., and Hussain, M. (2018). Resource potential of gas reservoirs in South Pakistan and adjacent Indian subcontinent revealed by post-stack inversion techniques. J. Nat. Gas. Sci. Eng. 49, 41–55. doi:10.1016/j.jngse.2017.10.010
Archie, G. E. (1942). The electrical resistivity log as an aid in determining some reservoir characteristics. Trans. AIME 146 (01), 54–62. doi:10.2118/942054-G
Ashraf, U., Zhu, P., Yasin, Q., Anees, A., Imraz, M., Mangi, H. N., et al. (2019). Classification of reservoir facies using well log and 3D seismic attributes for prospect evaluation and field development: A case study of sawan gas field, Pakistan. J. Pet. Sci. Eng. 175, 338–351. doi:10.1016/j.petrol.2018.12.060
Aziz, O., Hussain, T., Ullah, M., Bhatti, A. S., and Ali, A. (2018). Seismic based characterization of total organic content from the marine Sembar shale, Lower Indus Basin, Pakistan. Mar. Geophys. Res. 39 (4), 491–508. doi:10.1007/s11001-018-9347-6
Balan, B., Mohaghegh, S., and Ameri, S. (1995). “State-of-the-art in permeability determination from well log data: Part 1-A comparative study, model development,” in SPE Eastern Regional Meeting, Morgantown, West Virginia. doi:10.2118/30978-MS
Castagna, J. P., and Swan, H. W. (1997). Principles of AVO crossplotting. Lead. edge 16 (4), 337–344. doi:10.1190/1.1437626
Clavier, C., Hoyle, W., and Meunier, D. (1971). Quantitative interpretation of thermal neutron decay time logs: Part I. Fundamentals and techniques. J. Pet. Tech. 23 (06), 743–755. doi:10.2118/2658-A-PA
Haque, A. E., Qadri, S. T., Bhuiyan, M. A. H., Navid, M., Nabawy, B. S., Hakimi, M. H., et al. (2022). Integrated wireline log and seismic attribute analysis for the reservoir evaluation: A case study of the mount messenger formation in kaimiro field, taranaki basin, New Zealand. J. Nat. Gas. Sci. Eng. 99, 104452. doi:10.1016/j.jngse.2022.104452
Jadoon, I. A., Lawrence, R. D., and Lillie3, R. J. (1994). Seismic data, geometry, evolution, and shortening in the active Sulaiman fold-and-thrust belt of Pakistan, southwest of the Himalayas. Am. Assoc. Pet. Geol. Bull. 78 (5), 758–774. doi:10.1306/A25FE3AB-171B-11D7-8645000102C1865D
Kadri, I. B. (1995). Petroleum geology of Pakistan. Karachi, Pakistan: Pakistan Petroleum Limited. Feroz Sons (Pvt.) Ltd.
Kemal, A. (1991). Geology and new trends for petroleum exploration in Pakistan. Pak. Assoc. Pet. Geol. Bull., 16–57.
Klett, T., Schenk, C., Wandrey, C., Brownfield, M., Charpentier, R., Cook, T., et al. (2011). Assessment of potential shale gas resources of the Bombay, cauvery, and krishna–godavari provinces. India: USGS. doi:10.3133/fs20113131
Mahmood, M. F., Ahmad, Z., and Ehsan, M. (2018). Total organic carbon content and total porosity estimation in unconventional resource play using integrated approach through seismic inversion and well logs analysis within the Talhar Shale, Pakistan. J. Nat. Gas. Sci. Eng. 52, 13–24. doi:10.1016/j.jngse.2018.01.016
Opera, A., Alizadeh, B., Sarafdokht, H., Janbaz, M., Fouladvand, R., and Heidarifard, M. H. (2013). Burial history reconstruction and thermal maturity modeling for the middle cretaceous–early miocene petroleum System, southern Dezful Embayment, SW Iran. Int. J. Coal Geol. 120, 1–14. doi:10.1016/j.coal.2013.08.008
Peters, E. J. (2012). Advanced petrophysics: Dispersion, interfacial phenomena. Austin, Texas, United States: Greenleaf Book Group.
Poupon, A., and Gaymard, R. (1970). “The evaluation of clay content from logs,” in Proceedings of the SPWLA 11th Annual Logging Symposium: OnePetro, Los Angeles, California, May 3–6, 1970.
Poupon, A., and Leveaux, J. (1971). “Evaluation of water saturation in shaly formations,” in Proceedings of the SPWLA 12th Annual Logging Symposium, Dallas, Texas, May 2–5, 1971.
Qadri, S., Islam, M. A., and Shalaby, M. (2019). Application of well log analysis to estimate the petrophysical parameters and evaluate the reservoir quality of the Lower Goru Formation, Lower Indus Basin, Pakistan. Geomech. Geophys. Geo-energ. Geo-resour. 5 (3), 271–288. doi:10.1007/s40948-019-00112-5
Qayyum, F., Hanif, M., Mujtaba, M., Wahid, S., and Ali, F. (2016). Evaluation of source rocks using one dimensional maturity modeling in Lower Indus Basin, Pakistan. Arab. J. Geosci. 9 (4), 22. doi:10.1007/s12517-015-2244-2
Qiao, Y., and An, H. (2007). Study of petrophysical parameter sensitivity from well log data. Appl. Geophys. 4 (4), 282–287. doi:10.1007/s11770-007-0038-3
Raza, A., Bing, C. H., Nagarajan, R., and Hamid, M. A. (2015). Experimental investigation on sandstone rock permeability of Pakistan gas fields. IOP Conf. Ser. Mat. Sci. Eng. 78, 012007. doi:10.1088/1757-899X/78/1/012007
Rezaee, R. (2015). Fundamentals of gas shale reservoirs. New York, United Status: John Wiley & Sons.
Richards, M., Bowman, M., and Reading, H. (1998). Submarine-fan systems I: Characterization and stratigraphic prediction. Mar. Pet. Geol. 15 (7), 689–717. doi:10.1016/S0264-8172(98)00036-1
Rider, M. H. (1986). The geological interpretation of well logs. Houston, Texas, United States: Gulf Publishing Company.
Scotese, C. R., Gahagan, L. M., and Larson, R. L. (1988). Plate tectonic reconstructions of the Cretaceous and Cenozoic ocean basins. Tectonophysics 155 (1-4), 27–48. doi:10.1016/0040-1951(88)90259-4
Senosy, A. H., Ewida, H. F., Soliman, H. A., and Ebraheem, M. O. (2020). Petrophysical analysis of well logs data for identification and characterization of the main reservoir of Al Baraka Oil Field, Komombo Basin, Upper Egypt. SN Appl. Sci. 2 (7), 1293. doi:10.1007/s42452-020-3100-x
Shah, S. I. (1977). Stratigraphy of Pakistan. Quetta, Balochistan, Pakistan: Geological Survey of Stratigraphy of Pakistan.
Shah, S. M. I. (2009). Stratigraphy of Pakistan (memoirs of the geological survey of Pakistan). Geol. Surv. Pak. 24, 1–134.
Sheikh, N., and Giao, P. H. (2017). Evaluation of shale gas potential in the lower cretaceous Sembar Formation, the southern Indus basin, Pakistan. J. Nat. Gas. Sci. Eng. 44, 162–176. doi:10.1016/j.jngse.2017.04.014
Slatt, R. M. (2006). Stratigraphic reservoir characterization for petroleum geologists, geophysicists, and engineers. Amsterdam, Netherlands: Elsevier.
Stieber, S. (1970). “Pulsed neutron capture log evaluation - Louisiana gulf coast,” in Fall Meeting of the Society of Petroleum Engineers of AIME, Houston, Texas, October 04, 1970. doi:10.2118/2961-MS
Toosy, M., Khan, S., Shakir, U., Nisar, U. B., Ullah, K., Qadir, A., et al. (2021). Depositional architecture of eocene and cretaceous reservoirs (blending seismic and well data) in mubarik area, central Indus basin, Pakistan. Pure Appl. Geophys. 178 (4), 1297–1315. doi:10.1007/s00024-021-02715-0
Wandrey, C. J., Law, B., and Shah, H. A. (2004). Sembar Goru/Ghazij composite total petroleum system, Indus and Sulaiman-Kirthar geologic provinces, Pakistan and India. VA, USA: US Department of the Interior, US Geological Survey Reston.
Yilmaz, Ö. (2001). Seismic data analysis: Processing, inversion, and interpretation of seismic data. Houston, Texas, United States: Society of exploration geophysicists.
Yousaf, H. (2020). Depositional settings of cretaceous rocks in central Indus basin of Pakistan - a review. Calgary, Canada: Geoconvention.
Keywords: depositional modeling, Sembar Formation sands, Lower Indus Basin, reservoir characterization, Khewari and Gambat areas, Suleman-01 well, Indian shield
Citation: Aftab F, Zafar M, Hajana MI and Ahmad W (2022) A novel gas sands characterization and improved depositional modeling of the Cretaceous Sembar Formation, Lower Indus Basin, Pakistan. Front. Earth Sci. 10:1039605. doi: 10.3389/feart.2022.1039605
Received: 08 September 2022; Accepted: 04 November 2022;
Published: 02 December 2022.
Edited by:
Ali Abedini, Urmia University, IranReviewed by:
S. M. Talha Qadri, University of the Fraser Valley, CanadaAkram Alizadeh, Urmia University, Iran
Copyright © 2022 Aftab, Zafar, Hajana and Ahmad. This is an open-access article distributed under the terms of the Creative Commons Attribution License (CC BY). The use, distribution or reproduction in other forums is permitted, provided the original author(s) and the copyright owner(s) are credited and that the original publication in this journal is cited, in accordance with accepted academic practice. No use, distribution or reproduction is permitted which does not comply with these terms.
*Correspondence: Furqan Aftab, furqan900@yahoo.com