Characterization of true triaxial rock bursts in sandstones with different water contents
 Kezhu Chen
 Weijin Zhou
 Yuangui Pan
 Ying Zhuo3
  Guoqiang Zheng
- 1Sichuan Communication Surveying and Design Institute Co., Ltd., Chengdu, Sichuan, China
- 2Sichuan Huadi Construction Engineering Co., Ltd., Chengdu, Sichuan, China
- 3School of Emergency Management, Xihua University, Chengdu, Sichuan, China
The rockburst phenomenon occurs in dry red sandstone under high in situ stress, and the rockburst effect is weaker for a water-bearing rock. The rockburst effect on red sandstone with different water contents is analyzed in this paper. A true triaxial testing machine is used to conduct the loading, and acoustic emission recording equipment and a high-speed camera are used to monitor the acoustic signal inside the rock and the rock-caving situation throughout the entire process in order to analyze the characteristics of the acoustic emissions and the ejection form of the rockburst. The results show that rockburst occurs in dry red sandstone and 50% saturated red sandstone but not in saturated red sandstone. The phrase characteristics of the stress–strain curve of the dry rock vary more significantly than those of the water-bearing rock, and the elastic strain energy inside the rock decreases gradually as the water content increases. The double peak of the acoustic emissions curve occurs during the failure process of the dry rock and gradually transitions to a stepped pattern as the water content increases. The ejected fragments of dry red sandstone during the rockburst are abundant and large. The true triaxial test results illustrate the characteristic effect of the rockburst on red sandstone with different water contents, reveal the failure mode and ejection characteristics of red sandstone with different water contents, and demonstrate the influence of the water content on the rockburst characteristics of red sandstone. The results of this study provide a theoretical reference for the study of the rockburst mechanisms of similar hard rocks.
Introduction
Rockburst, a common geological disaster in the process of deep engineering construction, often occurs suddenly and destructively, threatening the safe construction and production in the engineering industry (Mazaira and Konicek, 2015). With the increase in construction depth, rockburst disasters are becoming more serious. Suorineni et al. (2014) even described rockburst as a cancer, indicating the danger of rockbursts in engineering projects. A railway tunnel (Liu et al., 2013) with a length of 16,449 m contained a rockburst section of up to 9,500 m (58% of the total) according to statistics. The Mount Longmen highway tunnel (design stage) in western China is approximately 25,000 m long, and more than 19,000 m of the tunnel located at depths of greater than 500 m, so the rockburst section of this tunnel is expected to be 15,000 m. Rockburst disasters have been reported worldwide and have caused significant losses of life and property. Rockburst is an inevitable problem in deep engineering construction. Mechanical mechanisms, monitoring and early warning, excavation optimization, and dynamic control have been the key research topics in the last decade (Feng et al., 2019). Among them, rockburst mechanics is the foundation of other research fields, and thus, this topic has notable theoretical significance and engineering value.
Even though there is currently no consensus on the formation of the rockburst mechanism, academics have explored and explained the mechanism of rockburst through methods such as field research, theoretical analysis, mechanical tests, numerical simulations, and similarity tests, yielding fruitful results (Afraei et al., 2018; Zhou et al., 2018). In the early days of this research, rockburst studies mainly focused on rockburst damage modes. Li et al. (2017) summarized six types of geomechanical models of rockburst based on geological analysis. Early uniaxial rock mechanics test (Zhao and Jiang, 2010) have evolved into a true triaxial excavation simulation, including the installation of various monitoring instruments to observe the rockburst process (He et al., 2012), analyze the shape and kinetic energy of rockburst blocks (Su et al., 2017a; Su et al., 2017b), and study the acoustic emission spectrum characteristics, energy release (Zhao and Cai, 2014; Zhao et al., 2014), and rockburst tendency (Gong et al., 2020). (Zhang et al., 2019a; 2019b; 2019c; Zhang et al., 2021) proposed a strain energy determination method for rocks under true triaxial compression (TTC), and investigated the energy evolution process and mechanism of different hard rocks under true triaxial compression (TTC) using strain energy analysis (Qu et al., 2022). In order to accurately and effectively predict the occurrence of rock bursts, a multi-indicator evaluation method for the occurrence of rock bursts at deep subsurface rock openings was established (Xu et al., 2022). explored the effects of temperature on energy storage and dissipation properties and rockburst susceptibility, revealing that high temperatures can damage the ESC of rocks, which is essential for reducing rockburst susceptibility. To accurately predict rockburst hazards among complex influencing factors, a rockburst hazard prediction model based on binary classification of Gaussian processes (GPC) was proposed after determining the intrinsic relationship between multiple factors and rockbursts in coal mines (Lan et al., 2022). (Du et al., 2022) established an analytical model to quantitatively describe the physical process of rockburst in mine tunnels, and investigated the calculation method of dynamic release of elastic properties during the physical process of rockburst (Chen et al., 2022). proposed a bagged ensemble of Gaussian process classifiers (GPCs) to evaluate the rockburst damage potential of unbalanced data sets. The macroscopic block characteristics of rockburst fragments reflect the degree of rock fragmentation, which increases with the loading rate (Sun et al., 2022). (Yan et al., 2022) found that the prediction results of the rockburst intensity classification prediction model and SVM discriminant method based on the analysis of a large number of sample data processing were in good agreement with the actual rockburst intensity (Xia et al., 2022). proposed a data-driven approach based on spectral clustering to predict rockburst intensity (Yang et al., 2020). investigated the degree of influence of red sandstone specimen shape and rock material on rockburst sensitivity, and it was found that cubic specimens exhibited stronger rockburst sensitivity than cylindrical specimens. The rockburst characteristics of red sandstone with different arrangements of prefabricated holes were investigated by uniaxial compression tests, and it was found that the rockburst effect of red sandstone containing prefabricated holes was weaker than that of intact specimens (He et al., 2021). It was found that water gushing is highly likely to occur within the broken enclosure section, and the permeability and porosity of the enclosure increases with time due to the granular structure of the broken enclosure that easily forms water-conducting channels (Ma et al., 2022a). Li investigated the pore structure and hydraulic properties of fractured rock masses and found that at lower compressive stress levels, fractured rock masses showed greater compressibility, while fractured gangue with more small particles showed greater stress sensitivity (Li et al., 2022). Studying the hydraulic characteristics of fault rocks during water-silt scouring, the higher the silt concentration, the higher the erosion effect is inhibited by silt flow (Ma et al., 2022b). Liu conducted rockburst tests on horizontally laminated surface sandstones under double-sided unloading and found that rockbursts occur asynchronously on two free surfaces (Liu et al., 2021). Rockbursts are very likely to occur after excavation and unloading of deep rock masses, and it was found that water injection into the rock mass before excavation can effectively reduce the rockburst effect (Cai et al., 2021). It can be seen that the water content of the rock and the rock burst effect, the study of rock burst effect of different water content of the rock, rock burst prevention and control has important significance.
Because the different mechanical properties of red sandstone with different water contents are different, we believe that the rockburst tendency of the rock is related not only to the stress state but also to the water content. According to the published literature, few studies have been carried out on the rockburst characteristics of rocks with different water contents under true triaxial conditions. Thus, based on laboratory true triaxial compression tests, in this study, the energy characteristics of red sandstone with different water contents were systematically investigated. In addition, a high-speed camera and Micro-II acoustic emission control acquisition system were used to reveal the failure modes and ejection characteristics of the specimens under true triaxial conditions and to determine the rockburst characteristics of red sandstone, providing a reference for similar rockburst mechanism research.
Laboratory experiments
Experimental equipment
The test system is mainly composed of test loading system, measurement and control system, and monitoring system. The loading system is a high-pressure servo dynamic true triaxial tester, which can perform uniaxial tensile, compression, shear test and conventional triaxial test as well as true triaxial test and other comprehensive rigidity testing machine, as shown in Figure 1. The maximum vertical loading pressure of the test host is 5,000 kN, and the maximum loading pressure in the horizontal direction is 3,000 kN. The tester can realize the special function of unloading the excavation under high ground stress conditions by quickly unloading the single-sided pressurizing device under the simultaneous loading of three directions and six sides. The measurement and control system is mainly composed of servo controller, computer and sensing elements, which can monitor the whole process of the test and has powerful data and graphic processing capability. The monitoring system is divided into an acoustic emission monitoring system and a high-speed camera to monitor the damage process of the specimen from the inside out in a comprehensive manner. The load compression rate of the true triaxial loading system is 10 N/s-10 kN/s, the displacement measurement range is 0–10 mm, and the deformation measurement range is 0–10 mm.
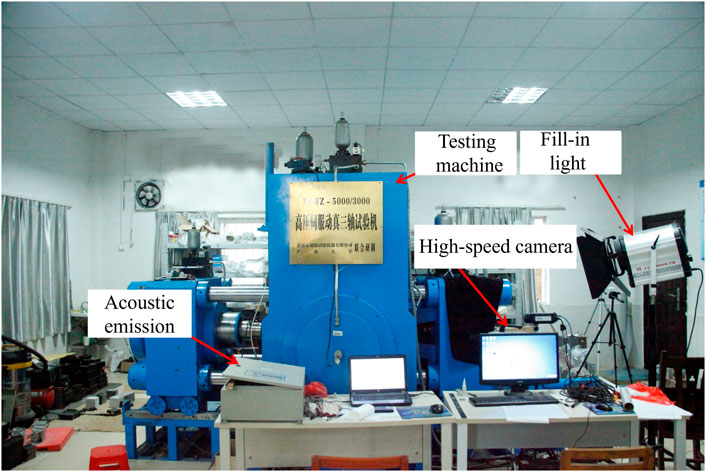
FIGURE 1. Test loading system.
Acoustic emission monitoring instrument is the Micro-II Digital AE System acoustic emission acquisition system developed by the U.S. PAC, the main core component of the system is an eight-channel acquisition analysis and waveform processing acoustic emission function card PCI-8 board, the acoustic emission system can simultaneously use four sensors for array data acquisition. The high-speed digital camera is developed by SVSI, the maximum resolution of the camera is 1,280×1,024 pixels, and the maximum frame rate is 532 fps.
Test program
In the tests, three-direction and five-side loading were adopted, that is, one horizontal direction remained free, and the other five sides were loaded to the set stress. The loading method of the test was as follows: 1) At a rate of 0.5 MPa/s, the stress was simultaneously loaded to the minimum principal stress in the three-directions. σ3 remained unchanged, and the sample was loaded to the intermediate principal stress at a rate of 0.5 MPa/s σ2 and σ3 remained unchanged, and the sample was loaded to the maximum principal stress at a rate of 1 MPa/s, until failure of the specimen occurred. The minimum principal stress σ3 was 5 MPa, and the intermediate principal stress σ2 was 10 MPa. 2) After installing the fixture for the specimen, the specimen was placed in the holder, carefully leveled, and fixed in place. The displacement sensors and acoustic emission probes were installed, the monitoring and observation equipment was debugged and prepared for the tests. 3) The load and strain data were recorded in real-time during the tests. An acoustic emission instrument was used to record the acoustic emission data throughout the entire process of the true triaxial sandstone rockburst tests. The high-speed camera recorded continuously to capture the failure process of the specimen. 4) After the test, the rockburst fragments that peeled off and were ejected from the free face were collected in order to analyze the scale and mass distribution characteristics of the rockburst fragments. After the fragments were collected, the specimen was removed from the testing machine, and the fixture was disassembled to preliminarily protect the parent rock and collect a morphological map of the parent rock at various angles after failure occurred. A schematic diagram of the loading and a physical diagram of the specimens are presented in Figure 2.
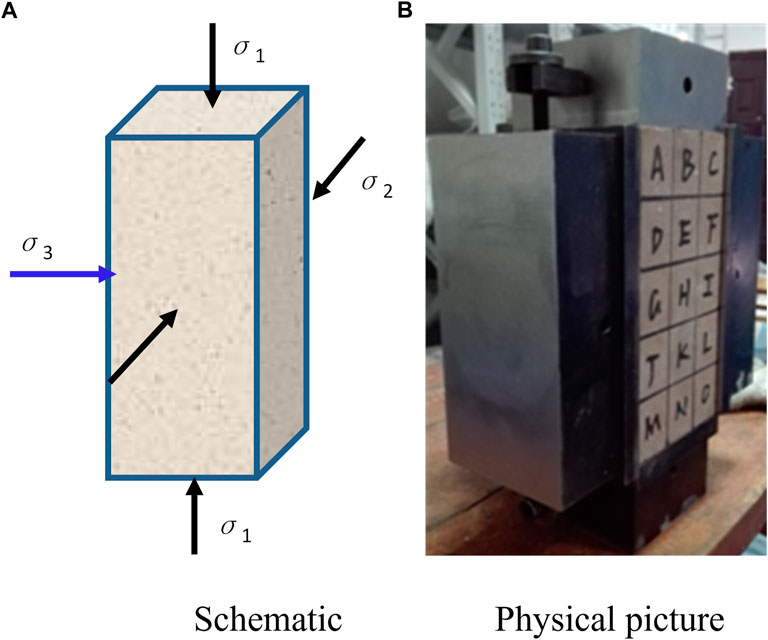
FIGURE 2. Schematatic diagram of the true triaxial loading test with a single face in the air. Panel (A) is the schematic picture of the rock sample, Panel (B) is the physical picture of the rock sample.
The specimens were standard 100 mm × 100 mm × 200 mm blocks. The specimens were divided into three different water contents: dry, 0.5 K (i.e., 50% saturated), and saturated (Ks is the saturation coefficient). The maximum water content was 2.2% after the rock water absorption test. The dry rock samples were numbered GZ-1–GZ-5. The 0.5-Ks rock samples were numbered HS-1–HS-5, and the saturated rock samples were numbered BH-1–BH-5, resulting in a total of 15 samples with five samples for each working condition.
Analysis of test results
Analysis of ejection process and fracture characteristics
Five rock samples were tested under each set of working conditions, and those with relatively good test phenomena were selected for analysis, namely, GZ-3 was selected for the dry rock samples, HS-2 was selected for the 0.5-Ks rock samples, and BH-4 was selected for the saturated rock samples. The ejection process during the failure of the red sandstone with different water contents is shown in Figure 3.
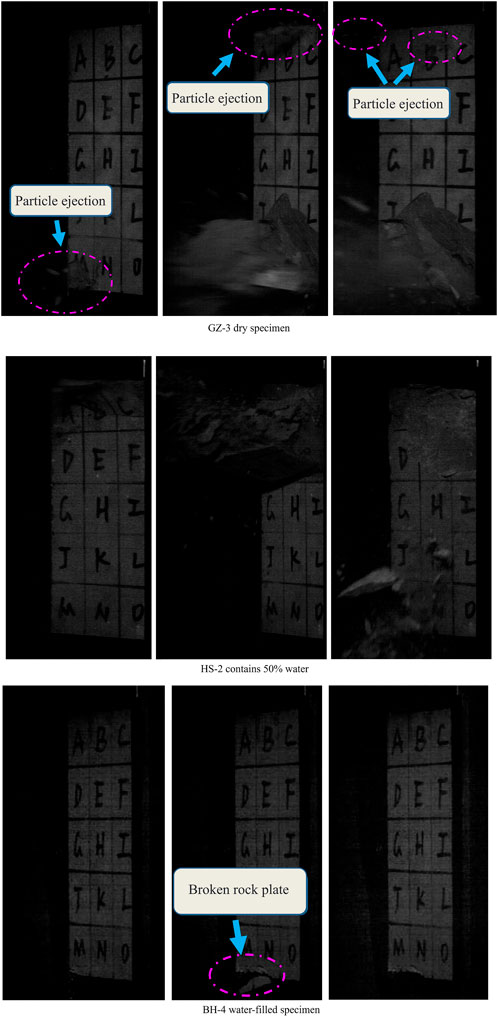
FIGURE 3. Ejection process of red sandstone destruction under different water content.
For GZ-3 sample, first, a small number of particles were ejected in the lower M region. As the axial pressure increased, particles were ejected in the AB area on the upper-end surface of the sample. At the same time, plate-like debris was ejected in the MNO area on the lower part of the rock sample, with a fast ejection speed, long distance, and severe destruction.
First, the upper end of HS-2 split into plates and collapsed. Then, the middle and upper part of the sample collapsed, with many fragments but no ejection, and sliding only occurred along the free face. During the entire failure process, there was no ejection of rock debris, but severe damage occurred.
Sample BH-4 did not undergo rockburst, and only a local rock plate fracture formed in the lower surface, with a small number of fragments slipping and mild damage.
According to the failure process of the red sandstone with three different water contents, the dry rock was damaged very violently, accompanied by a large number of ejection fragments. When the damage to the rock block involved a fast ejection speed and long ejection distance, the rockburst phenomenon was very violent. For the red sandstone with a water content of 50%, no debris ejection occurred, but the rock block collapsed and a small number of fragments formed in the upper part during the failure process, so the rockburst effect was significantly reduced. The saturated red sandstone did not undergo rockburst, and the failure mode was dominated by the formation of a fracture and sliding of the rock blocks.
Figure 4 shows the failure modes of the red sandstone with different water contents. As can be seen from Figure 4A, the failure modes of the dry red sandstone involved the cracking of small thin sections in area B at the free face, but no fragments were ejected. The deep ejection area was located in the lower part. The cracks were mainly concentrated in the rear of the specimen (opposite to the free surface). There were a vertical crack and shear crack in the upper part, and two shear cracks in the lower part, which extended through the middle of the specimen, forming an X shape. Finally, the specimen was damaged by splitting, shearing, and rockburst. Figure 4B shows the sample with 50% saturation. Plate-like fragments were ejected from the shallow surface of the free face, and multiple small vertical splitting cracks formed in the upper-end surface of the rock sample without obvious crack expansion. A shear oblique crack extended from the lower left corner of the specimen to the middle of the upper-end surface, leading to the final failure of the rock sample. Figure 4C shows the sample in the saturated state. As can be seen from Figure 4C, no rockburst or rock block ejection from the free face occurred, and the free face remained intact without pits. Two obvious shear cracks penetrated from the tips on both sides of the lower-end face and converged in the middle of the upper-end face, forming a staggered shear zone. There was no splitting crack, no plate crack bulging, and no rockburst during the failure of this specimen.
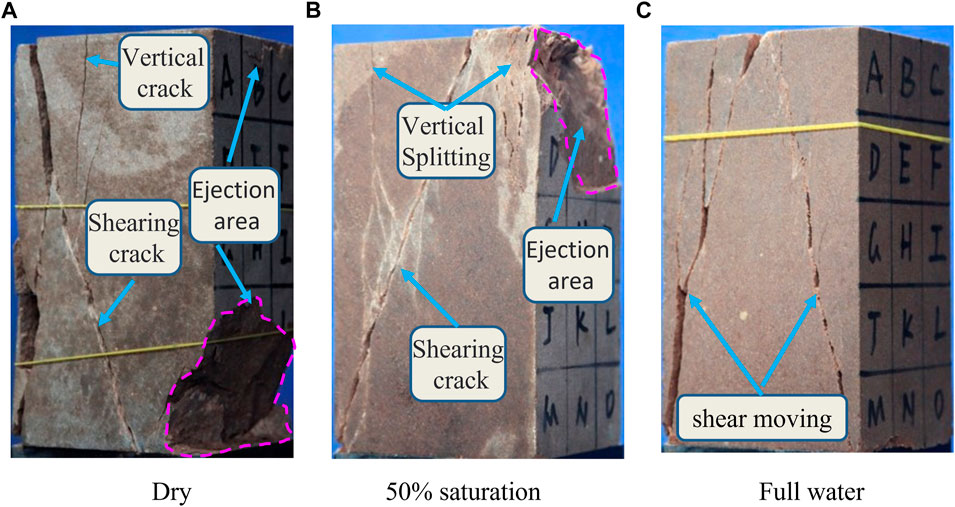
FIGURE 4. Destruction patterns of red sandstone at different water contents. Panel (A) shows the dry rock samples, Panel (B) shows the 50% saturation rock samples, Panel (C) shows the full water rock samples.
Analysis of stress–strain characteristics
Figure 5 shows the stress–strain curves of the red sandstone with different water contents. The changes in the characteristics were analyzed and compared. In terms of the peak stress, the peak stress of the dry red sandstone was the highest, reaching 155.8 MPa; the peak stress of the 50% saturated specimen was 148.5 MPa, and the peak stress of the saturated specimen was 117.2 MPa. It can be seen that as the water content increased, the stress required to cause failure of the red sandstone gradually decreased. The most obvious decrease occurred under the saturated condition.
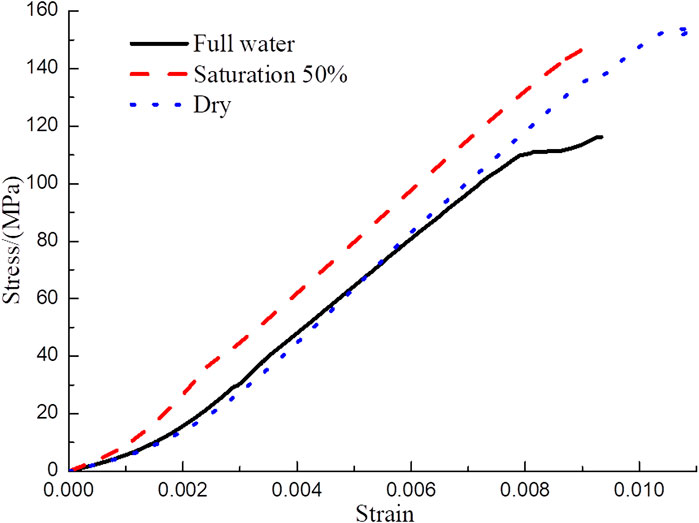
FIGURE 5. Stress-strain curves of red sandstone at different water contents.
According to the slope of the stress–strain curve, the overall change in the stress–strain curve in the dry state can be divided into three stages. The first stage is the gently increasing stage, in which the stress–strain curve gradually rises gently with a small overall slope. The second stage is the sharp increase stage, in which the stress–strain curve is steeper and has a large slope. The third stage is the gentle stage, in which the slope of the stress–strain curve changes from steep to slow. For 50% saturation, the stress–strain curve is generally an inclined straight line without any phrase change characteristics. For the saturated state, the stress–strain curve exhibits a gentle shape in the early stage, increases linearly in the middle stage, and becomes gentle before failure occurs. By analyzing the stress–strain curves of the red sandstone with three different water contents through comparison, it was found that the stress–strain curve of the dry red sandstone has a strong phrase characteristic and a large slope. As the water content increases, the phase characteristic of the stress–strain curve weakens and the slope decreases. Therefore, it can be concluded that if the dry rock is more brittle, the rockburst is more serious, and increasing the water content will reduce the brittleness of the rock and weaken the rockburst phenomenon.
Analysis of energy evolution characteristics
According to the first law of thermodynamics, if a volume unit of a rock mass is considered to deform under the action of external forces, it can be assumed that there is no heat exchange between the physical process and the outside world, that is, all of the work done by the external forces can be absorbed by the rock. According to the principle of the conservation of energy,
where U is the energy produced by the work done by the external force, Ue is the releasable elastic strain energy, and Ud is the dissipative energy.
Figure 6 shows the stress–stress–strain curve of the entire process of rock deformation and failure. The damage to the internal units of the rock and the resulting plastic deformation consume part of the energy absorbed by the rock, which is irreversible, i.e., the dissipative energy Ud in Figure 6. The elastic deformation generated by the rock is recoverable after the external force is unloaded. Another part of the energy absorbed by the rock is converted into elastic strain energy to form elastic deformation, which is the releasable elastic strain energy Ue in Figure 6 and is reversible under certain conditions. In Figure 6, E is the elastic modulus.
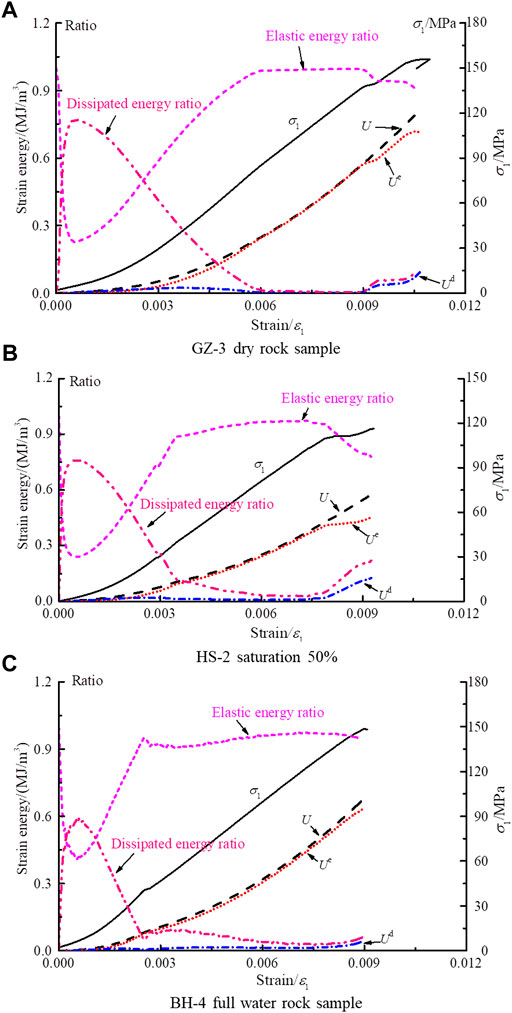
FIGURE 6. Stress-strain curve of the whole process of deformation and damage of red sandstone. Panel (A) shows the dry rock samples, Panel (B) shows the 50% saturation rock samples, Panel (C) shows the full water rock samples.
The total strain energy and elastic strain energy in the principal stress space are expressed as follows:
where
According to the generalized form of Hooke’s law, the elastic strain can be expressed as follows:
where
In the late elastic stage, two points a and b are taken, and
where
According to Eqs. 2–7, the equation for calculating the elastic strain energy in the true triaxial stress state is
Therefore, the total energy absorbed, the elastic strain energy, the dissipative energy, and their respective proportions in the process of the deformation and damage of the rock can be calculated using the above principles and equations to analyze the change.
It can be seen from Figure 6 that the elastic strain energy Ue of the rock in the dry state is consistent with the total energy U absorbed during the failure process, and the dissipative energy Ud approximates the horizontal change, with the peak value of the elastic strain energy reaching 0.71 MJ/m3 and the peak value of total energy absorbed reaching 0.73 MJ/m3. In the rock with 50% saturation, the peak value of the elastic strain energy is 0.68 MJ/m3, the peak value of the total absorbed energy is 0.70 MJ/m3, and the dissipated energy approximates the horizontal change where Ue is in good agreement with U. In the saturated state, the elastic strain energy and total absorbed energy of the rock decrease more significantly, with a peak elastic strain energy of 0.45 MJ/m3, a peak total absorbed energy of 0.57 MJ/m3, and an approximate horizontal change in the dissipative energy.
Based on the analysis of the total stress–strain curves for the three different water contents through comparison, it can be concluded that the elastic strain energy of the rock in the dry state is the highest, the total energy absorbed in the failure process is greater, the energy released during the failure is greater, and the rockburst phenomenon is more prominent. As the water content increases, the elastic strain energy of the rock decreases. The total energy absorbed during the failure decreases, and the energy released during the failure decreases, gradually weakening the rockburst phenomenon.
Analysis of acoustic emission characteristics
Figure 7 shows that the acoustic emission activity of the dry sample is quiet in the compaction stage and the elastic deformation stage, with almost no formation of cracks. However, due to the instantaneous release of a large amount of elastic energy before the failure of the specimen, the acoustic emission count rate increases suddenly and double peaks of the count rate appear. Between the two peaks, there is a very short quiet period with obvious brittle failure. The acoustic emission record of the sample with 50% saturation is more active than that of the dry sample in the compaction-density stage, and the count rate increases in a stepwise manner near the failure time. This indicates that when the rock is weakened by the presence of water, the microcrack expansion is more stable, and the brittle damage occurs with a sudden increase of about twice the count rate at the time the final damage occurs. The acoustic emission record of the saturated sample is also more pronounced than that of the dry sample in the compaction stage. The acoustic emission signal continues to be active and has a higher count rate value in the yielding stage, and the microcracks continue to accelerate, expand, and penetrate, resulting in shear failure.
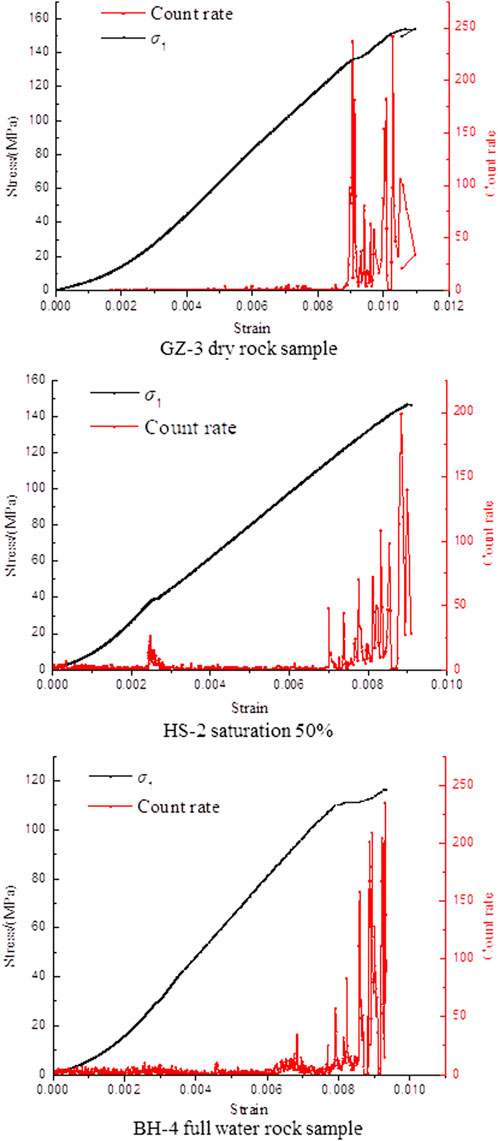
FIGURE 7. Characteristics of acoustic emission count rate changes during the destruction of red sandstone with different water content.
As can be seen from Figure 8, the cumulative energy of the dry sample in the compaction-density and elastic deformation stages does not fluctuate, and the curve rises in a stepwise manner before the damage occurs. According to the acoustic emission count rate, the rock sample is damaged once before the final failure occurs; however, at this time, the failure strength does not reach the point where the overall sample becomes unstable. Subsequently, the cumulative energy increases sharply and the acoustic emission activity increases substantially in an instant. The cumulative energy of the sample with 50% water saturation increases slightly in the elastic stage, then the curve rises steeply during the failure stage, suddenly releasing a large quantity of energy. Unlike the sample count rate, the damage count rate increases with the activity signal, indicating that after immersion, the microcracks continue to form before failure occurs due to the softening effect of the water on the sample. In addition, the final energy released is about 33% lower than that released in the dry state. In the saturated state, due to the continuous development of microcracks, the cumulative energy continues to increase after the compaction stage. The final cumulative energy of the failure is greater than those of the dry and 50% water-saturated samples because the static brittle failure is an overall failure mode. In addition, violent ejection only occurs on the surface of the free face during the failure of the sample through rockburst. It can be seen from Figure 4 that two shear cracks penetrate the water-saturated sample from top to bottom, while only one crack forms under the other two working conditions, indicating that the penetrating shear cracks need to release more and more energy.
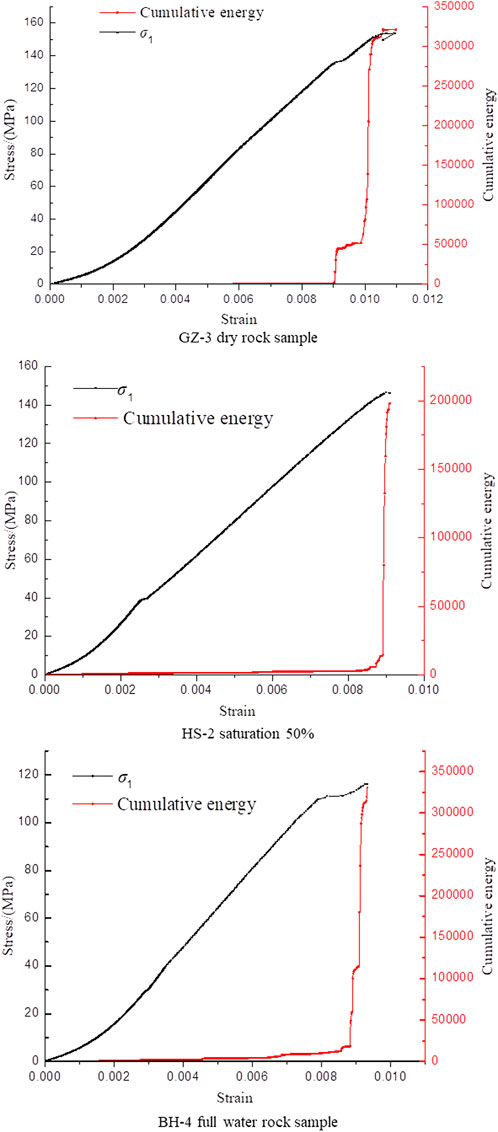
FIGURE 8. Cumulative energy variation characteristics of red sandstone with different water content.
Analysis of characteristics of rockburst fragments
The rockburst fragments can be used to visually analyze the amount of energy released during the damage. According to the results of the true triaxial rockburst tests on samples with different water contents, statistical analysis of the scale characteristics of the rockburst fragments and the mass distribution characteristics of the different particle groups of samples GZ-3 and HS-2 with rockburst characteristics was conducted and the fractal dimension of the rockburst fragments was calculated based on the statistical results of the mass distribution characteristics.
Scale and weight characteristics of rockburst fragments
Table 1 shows the statistical results of the scale of the rockburst fragments. The main statistical object used to obtain the scale distribution characteristics of the rockburst fragments of the samples with different water contents was the rockburst fragments with a maximum length of greater than 5 mm. The same standard was adopted to measure the maximum values of the three directions (i.e., the length, width, and thickness). A total of 167 rockburst fragments from the dry sample and 122 rockburst fragments from sample HS-2 (soaked in water for 8 h, water content of 1.18, 50% saturation) were analyzed. The longest rockburst fragments from samples GZ-3 and HS-2 were 63.88 mm and 75.16 mm, respectively; the widest rockburst fragments from samples GZ-3 and HS-2 were 58.74 mm and 66.46 mm, respectively; and the thickest rockburst fragments from samples GZ-3 and HS-2 were 11.10 mm and 8 mm, respectively.
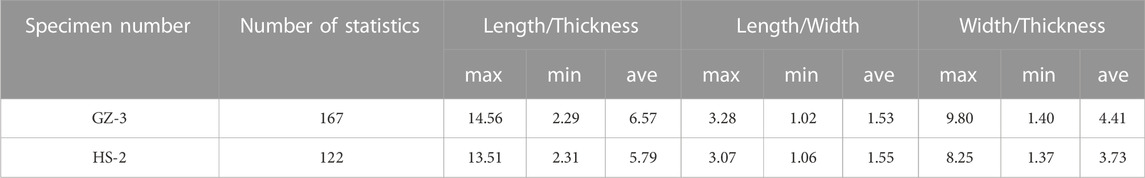
TABLE 1. Rockburst debris scale statistics results.
It can be seen from Figure 9 that as the length to thickness ratio increased, the oscillations of the width to thickness ratios of both specimens were small and the increasing trend was not obvious; while the oscillations of the length to width ratios were larger and both samples exhibited an increasing trend. The distributions of the three ratios were obvious, and each ratio exhibited significant variability, illustrating the characteristics of the two rock samples in the form of clastic plates.
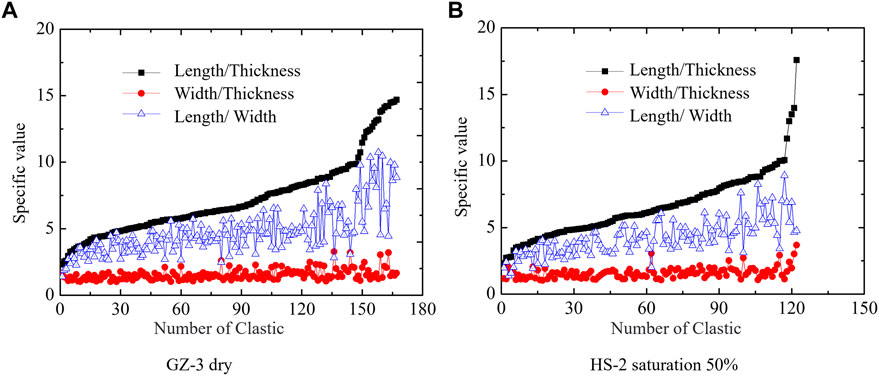
FIGURE 9. Rock explosion debris scale ratios of red sandstone with different water content. Panel (A) shows the dry rock samples, Panel (B) shows the 50% saturation rock samples.
Figure 10 shows the results after sieving and measuring the rockburst ejection fragments from the two samples according to four particle size ranges: particles (<0.075), fine (0.075–5), medium (5–30), and coarse (>30).
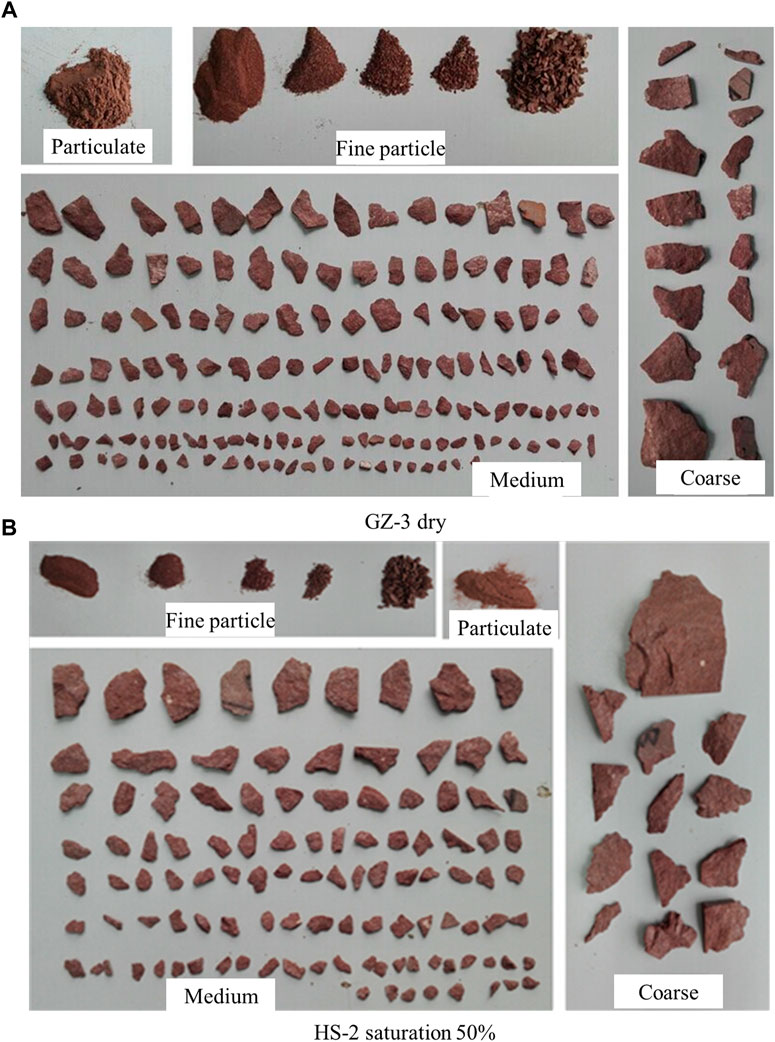
FIGURE 10. Sieving results of rock-burst ejected debris from red sandstone with different water content.
Figure 10A shows the rockburst ejection fragments from the dry sample, and it can be seen that most of the coarse fragments are flaky and irregular in shape, but there are a few blocky fragments, which are rectangular and small in scale. Most of the medium fragments are flakes, followed by blocks with irregular shapes. The rockburst ejection fragments from the 50% saturation sample are shown in Figure 10B. Most of the coarse and medium fragments are flakes, and there are fewer blocky fragments with irregular shapes. Based on the symmetrical weight, the total mass of the rockburst fragments from sample GZ-3 is significantly higher (nearly 40%) than that of the fragments from sample HS-2. The masses of the particles and fine particle fragments from sample GZ-3 account for 2.19% and 14.3% of the total mass of the fragments; while those from sample HS-2 account for 1.48% and 9.62%, respectively. Compared with sample HS-2, the particles and fine particles from sample GZ-3 not only have significantly higher masses, but they also account for significantly higher proportions.
Table 2 shows the masses of the rockburst ejection fragments with different particle sizes. As can be seen from Table 2, the mass of each fragment size category for the dry sample is higher than for the 50% saturation sample. In particular, the mass of the coarse particles is 37% higher. The rockburst effect on the dry rock is intense, and many fragments are ejected. Figure 11 shows the percentages of the rock fragments with different particle sizes. The coarse particles account for the largest percentage of the total mass (61.19–63.92%), while the particles account for the smallest percentage (1.48–2.19%). It can be seen that the proportion of the coarse particles formed by the rockburst process is the highest.
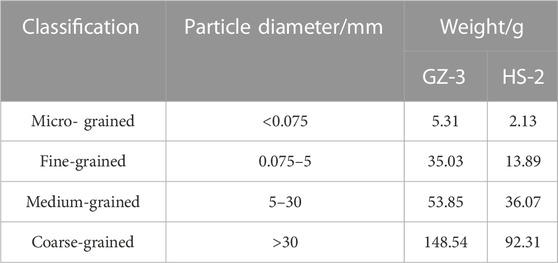
TABLE 2. Different particle size debris mass.
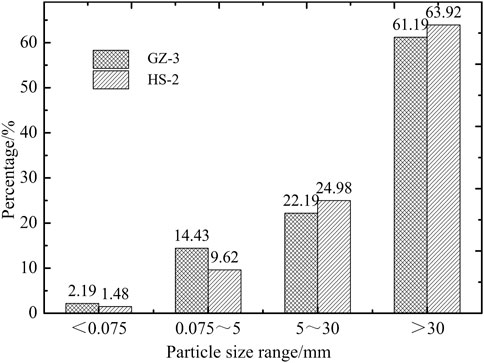
FIGURE 11. Percentage of different particle sizes.
The mass distribution characteristics of the rockburst fragments from the two samples with different water contents show that the formation of the rockburst fragments from the dry red sandstone sample consumed more energy than the formation of the fragments from the water-bearing sample, which indirectly demonstrates that as the soaking time and the water content increase, the energy provided by the sample during the rockburst decreases. This also reflects the degree by which the strength of the rockburst decreases.
Energy consumption characteristics of rockburst fragments
Rockburst, which is a non-linear dynamic phenomenon, consumes a large amount of energy in the production of the fragments formed by fracturing and fragmentation under compression. The larger the area of the fragment is, the greater the energy consumed is. The fractal dimension can be used to relate the fracture fragmentation to the energy dissipation.
The basic definition of the fractal dimension is as follows:
R is the feature scale, N is the number of objects with a feature scale of greater than or equal to R, C is the scale coefficient, and D is the fractal dimension.
According to the above definition, the most basic expression of the fractal dimension and the mass-frequency relationship are as follows:
where R is the characteristic size of the fragments, Rmax is the maximum characteristic size of the fragments, N is the number of fragments with a scale that is greater than or equal to the characteristic scale, N0 is the number of fragments with a scale that is greater than or equal to the characteristic scale, M is the mass of the debris, Mmax is the maximum mass of the debris, b is the mass-frequency distribution index, and D is the fractal dimension.
By comparing the equations, it can be concluded that the fractal dimension D and the mass-frequency distribution index b have the following relationship:
The b value can be obtained through fitting, and then, the fractal dimension D can be calculated. The calculation results are presented in Table 3.
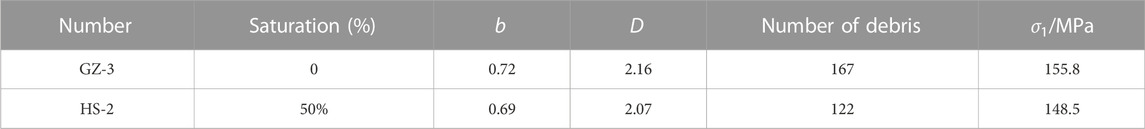
TABLE 3. b-value and D-value of different particle size debris.
It can be seen from Table 3 that the fractal dimension values of the rockburst of the red sandstone with two different water contents are both greater than 2, which are similar to the fractal dimension values of rockburst debris of different lithologies obtained by Miao, (2008) and Miao, (2009). The rockburst debris formed during the rockburst consumes a large amount of energy, and the fractal dimension decreases as the water immersion time and water content increase. From the perspective of the fractal results, the energy consumed by the formation of the rockburst debris from the water-bearing red sandstone specimen soaked for a long time is smaller than that of the dry rock sample. This is conducive to the accumulation and instantaneous release of energy, leading to the formation of a large amount of rockburst debris and thus consuming a large amount of energy.
Failure mechanism of red sandstone with different water contents and engineering construction understanding
The red sandstone used in this study was characterized by a high porosity, and its main components were clastic minerals, as well as clay minerals such as montmorillonite and kaolin. Montmorillonite disintegrates and softens when exposed to water, which compresses the internal voids. In addition, kaolin particles flow under the action of pore water pressure, resulting in the redistribution of the particles and filling of the pores and cracks. Therefore, the porosity of the saturated sample was lower than that of the dry sample. In fracture mechanics and damage mechanics, the rockburst mechanism not only refers to the energy release speed but also to the stress concentration caused by the uneven stress on the microcracks, voids, and defect areas in the rock mass on the molecular scale in the area where the energy is concentrated and released. For the saturated sample with a low porosity, the impact of the stress concentration inside the specimen was greatly reduced, which was not conducive to the occurrence of rockburst. The compressive capacity of montmorillonite decreased after expansion, increasing the deformation during compression. The water content also reduced the friction coefficient between the clastic minerals, leading to increased deformation. The plastic deformation ratio of the specimens increased substantially, while the elastic energy decreased, so the failure phenomenon of the samples changed from plate crack failure during rockburst to static brittle failure as the water content increased.
According to the conclusions drawn from the contents of this paper, the water content has a large influence on the rockburst incubation process of red sandstone. Project construction process, the choice of appropriate rockburst prevention measures can effectively reduce the risk and intensity level of rockburst. In the construction of projects with similar surrounding rock conditions, rock bursts are reduced by increasing the water content of the surrounding rock mass. In the excavation, immediately after the palm face and excavation hole wall spray high-pressure water, and at the same time can use the gunhole and anchor borehole to inject water into the deep part of the rock body, through this way to improve the physical and mechanical properties of the surrounding rock body, change the damage form of the surrounding rock, reduce the elastic strain energy reserve capacity, so as to effectively reduce the risk of rockburst.
Figure 12 reflects the rockburst effect in a dry tunnel and a water-bearing tunnel with similar burial depths in both tunnels. After the excavation of dry tunnels, the rock explosion effect is significant, mostly manifested as stone projectile avalanche, avalanche distance and stone volume is inversely proportional relationship. There is almost no rock explosion in water-bearing tunnels, and the fractured surrounding rocks are collapsing under hydraulic conditions in a falling block. There is a large area of water in the tunnel for a long time, the water content of the rock in the tunnel is high, it is difficult to occur rock explosion phenomenon. According to these two engineering examples can be seen, the actual project, the rock explosion phenomenon mainly exists in the burial depth and dry hard rock tunnel, high water content of the tunnel rock explosion effect is weak, rock explosion phenomenon is relatively small. According to the engineering examples, it can be seen that the relationship between the realistic tunnel rock burst effect and the water content coincides with the results of this experimental study.
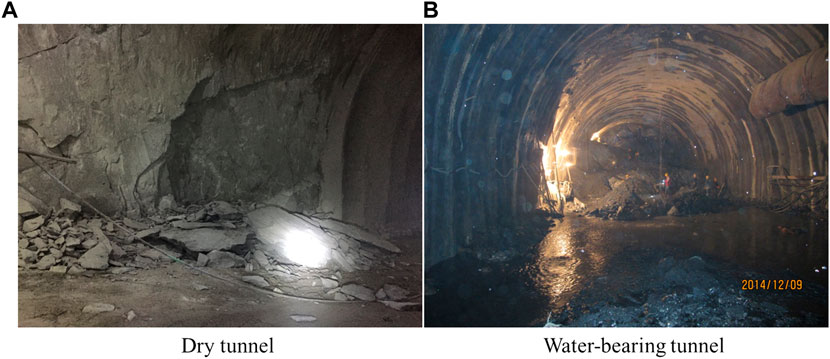
FIGURE 12. Rockburst characteristic effects in dry and water-bearing tunnel. Panel (A) is the dry tunnel, Panel (B) is the water-bearing tunnel.
Conclusion
(1) Rockbursts are evident in the destruction of dry red sandstone. When the water content as increased, rock fragments were not ejected when the rock was damaged, indicating that the rockburst phenomenon was weakened. The failure modes of the dry red sandstone were mainly splitting, shearing, and rockburst. As the water content increased, the failure mode tended toward shear failure.
(2) The stress–strain curve of the dry rock exhibited obvious phase characteristics and had a relatively large slope. As the moisture content increases, the phase characteristics of the overall stress-strain curve diminish and the overall slope becomes smaller. In addition, the peak stress decreased as the water content increased.
(3) The acoustic emission activity of the dry sample was quiet in the compaction stage and the elastic deformation stage. The acoustic emission count rate suddenly increased, accompanied by a double peak value of the count rate, when the rock sample was damaged. The acoustic emission record of the 50% saturation sample was more active in the compaction stage than that of the dry sample, and the count rate increased in a stepwise manner near the time of the failure.
(4) The dry rock produced abundant rockburst debris with larger particle sizes, while the 50% saturation sample produced less debris with smaller particle sizes. The fractal dimension values for the rockburst of the red sandstone with different water contents were all greater than 2, and the fractal dimensions of the rockburst of the samples with different water contents were similar.
Data availability statement
The original contributions presented in the study are included in the article/Supplementary Material, further inquiries can be directed to the corresponding authors.
Author contributions
KC, WZ, and YP were responsible for writing. YP and GZ were responsible for analysis of characteristics of rockburst fragments. YZ was responsible for analysis of test results. KC and YP were responsible for analyzing the destruction mechanism of red sandstone. WZ and GZ were responsible for review and proofreading.
Conflict of interest
The authors of KC, WZ, and GZ are employed by Sichuan Communication Surveying and Design Institute Co., Ltd. The authors of YP is employed by Sichuan Huadi Construction Engineering Co., Ltd.
The remaining author declares that the research was conducted in the absence of any commercial or financial relationships that could be construed as a potential conflict of interest.
Publisher’s note
All claims expressed in this article are solely those of the authors and do not necessarily represent those of their affiliated organizations, or those of the publisher, the editors and the reviewers. Any product that may be evaluated in this article, or claim that may be made by its manufacturer, is not guaranteed or endorsed by the publisher.
References
Afraei, S., Shahriar, K., and Madani, S. H. (2018). Statistical assessment of rockburst potential and contributions of considered predictor variables in the task. Tunn. Undergr. Space Technol. 72, 250–271. doi:10.1016/j.tust.2017.10.009
Cai, X., Cheng, C. Q., Zhou, Z. L., Konietzky, H., Song, Z. Y., and Wang, S. F. (2021). Rock mass watering for rock-burst prevention: Some thoughts on the mechanisms deduced from laboratory results. Bull. Eng. Geol. 80 (11), 8725–8743. doi:10.1007/S10064-021-02467-0
Chen, Y., Da, Q., Liang, W. Z., Xiao, P., Dai, B., and Zhao, G. (2022). Bagged ensemble of Gaussian process classifiers for assessing rockburst damage potential with an imbalanced dataset. Math. (Basel). 10 (18), 3382. doi:10.3390/MATH10183382
Du, F., Ma, J., Guo, X. F., Wang, T., Dong, X., Li, J., et al. (2022). Rockburst mechanism and the law of energy accumulation and release in mining roadway: A case study. Int. J. Coal Sci. Technol. 9 (1), 67. doi:10.1007/S40789-022-00521-0
Feng, X. T., Xiao, Y. X., Feng, G. L., Yao, Z. B., Chen, B. R., Yang, C. X., et al. (2019). Study on the development process of rockbursts. J. Chin. J. Rock Mech. Eng. 38 (04), 649–673. doi:10.13722/j.cnki.jrme.2019.0103
Gong, F. Q., Wang, Y. L., and Luo, S. (2020). Rockburst proneness criteria for rock materials: Review and new insights. J. Cent. South Univ. 27 (10), 2793–2821. doi:10.1007/s11771-020-4511-y
He, M. C., Jia, X. N., Coli, M., Livi, E., and Sousa, L. (2012). Experimental study of rockbursts in underground quarrying of Carrara marble. Int. J. Rock Mech. Min. Sci. (1997). 52, 1–8. doi:10.1016/j.ijrmms.2012.02.006
He, Z. C., Gong, F. Q., and Luo, S. (2021). Evaluation of the rockburst proneness of red sandstone with prefabricated boreholes: An experimental study from the energy storage perspective. Geomat. Nat. Hazards Risk 12 (1), 2117–2154. doi:10.1080/19475705.2021.1955754
Lan, T. W., Zhang, Z. J., Sun, J. W., Zhao, W., Zhang, M., Jia, W., et al. (2022). Regional prediction and prevention analysis of rockburst hazard based on the Gaussian process for binary classification. Front. Earth Sci. (Lausanne). 10. doi:10.3389/FEART.2022.959232
Li, Q., Ma, D., Zhang, Y. D., Liu, Y., and Ma, Y. (2022). Insights into controlling factors of pore structure and hydraulic properties of broken rock mass in a geothermal reservoir. J. Lithosphere. 5. doi:10.2113/2022/3887832
Li, T. B., Ma, C. C., Zhu, M. L., Meng, L., and Chen, G. (2017). Geomechanical types and mechanical analyses of rockbursts. Eng. Geol. 222, 72–83. doi:10.1016/j.enggeo.2017.03.011
Liu, D. Q., Ling, K., Li, D., He, M. C., Li, J. Y., Han, Z. J., et al. (2021). Evolution of anisotropy during sandstone rockburst process under double-faces unloading. J. Cent. South Univ. 28 (8), 2472–2484. doi:10.1007/S11771-021-4780-0
Liu, J. P., Feng, X. T., Yuan, H. L., Xu, S. d., and Sheng, Y. (2013). Studies on temporal and spatial variation of microseismic activities in a deep metal mine. Int. J. Rock Mech. Min. Sci. (1997). 60, 171–179. doi:10.1016/j.ijrmms.2012.12.022
Ma, Dan., Duan, H. Y., Zhang, J. X., Liu, X. W., and Li, Z. (2022b). Numerical simulation of water-silt inrush hazard of fault rock: A three-phase flow model. Rock Mech. Rock Eng. 55 (8), 5163–5182. doi:10.1007/s00603-022-02878-9
Ma, Dan., Duan, H. Y., and Zhang, J. X. (2022a). Solid grain migration on hydraulic properties of fault rocks in underground mining tunnel: Radial seepage experiments and verification of permeability prediction. Tunn. Undergr. Space Technol. 126, 104525. doi:10.1016/J.TUST.2022.104525
Mazaira, A., and Konicek, P. (2015). Intense rockburst impacts in deep underground construction and their prevention. Can. Geotech. J. 52 (10), 1426–1439. doi:10.1139/cgj-2014-0359
Miao, J. L. (2009). Experimental analysis of energy characteristics of rock burst. Beijing: D. China University of Mining and Technology.
Qu, H. L., Yang, L. H., Zhu, J. B., Chen, S., Li, B., and Li, B. (2022). A multi-index evaluation method for rockburst proneness of deep underground rock openings with attribute recognition model and its application. Int. J. Rock Mech. Min. Sci. (1997). 159, 105225. doi:10.1016/J.IJRMMS.2022.105225
Su, G. S., Feng, X. T., Wang, J. H., Jiang, J., and Hu, L. (2017a). Experimental study of remotely triggered rockburst induced by a tunnel axial dynamic disturbance under true-triaxial conditions. Rock Mech. Rock Eng. 50 (8), 2207–2226. doi:10.1007/s00603-017-1218-y
Su, G. S., Zhai, S. B., Jiang, J. Q., Zhang, G., and Yan, L. (2017b). Influence of radial stress gradient on strainbursts: An experimental study. Rock Mech. Rock Eng. 50 (10), 2659–2676. doi:10.1007/s00603-017-1266-3
Sun, F. Y., Guo, J. Q., Fan, J. Q., and Liu, X. (2022). Experimental study on rockburst fragment characteristic of granite under different loading rates in true triaxial condition. Front. Earth Sci. (Lausanne). 10. doi:10.3389/FEART.2022.995143
Suorineni, F. T., Hebblewhite, B., and Saydam, S. (2014). Geomechanics challenges of contemporary deep mining: A suggested model for increasing future mining safety and productivity. J. JS Afr. Inst. Min. Metall. 114 (12), 1023–1032.
Xia, Z. Z., Mao, J. Y., and He, Y. (2022). Rockburst intensity prediction in underground buildings based on improved spectral clustering algorithm. Front. Earth Sci. (Lausanne). 10. doi:10.3389/FEART.2022.948626
Xu, L., Gong, F. Q., and Liu, Z. X. (2022). Experiments on rockburst proneness of pre-heated granite at different temperatures: Insights from energy storage, dissipation and surplus. J. Rock Mech. Geotechnical Eng. 14 (5), 1343–1355. doi:10.1016/J.JRMGE.2021.08.004
Yan, S. H., Zhang, Y. B., Liu, X. X., and Liu, R. (2022). Rock burst intensity classification prediction model based on a bayesian hyperparameter optimization support vector machine. Math. (Basel). 10 (18), 3276. doi:10.3390/MATH10183276
Yang, J. J., Gong, F. Q., Liu, D. Q., and Liu, Z. X. (2020). Experimental study on the influence of specimen shape on rockburst proneness of red sandstone. Shock Vib. 2020 (9), 1–17. doi:10.1155/2020/4182861
Zhang, Y., Feng, X. T., Yang, C. X., Han, Q., Wang, Z., and Kong, R. (2021). Evaluation method of rock brittleness under true triaxial stress states based on pre-peak deformation characteristic and post-peak energy evolution. Rock Mech. Rock Eng. 54, 1277–1291. doi:10.1007/S00603-020-02330-W
Zhang, Y., Feng, X. T., Yang, C. X., Zhang, X., Sharifzadeh, M., and Wang, Z. (2019c). Fracturing evolution analysis of Beishan granite under true triaxial compression based on acoustic emission and strain energy. Int. J. Rock Mech. Min. Sci. (1997). 117, 150–161. doi:10.1016/j.ijrmms.2019.03.029
Zhang, Y., Feng, X. T., Zhang, X. W., Wang, Z., Sharifzadeh, M., and Yang, C. (2019a). A novel application of strain energy for fracturing process analysis of hard rock under true triaxial compression. Rock Mech. Rock Eng. 52, 4257–4272. doi:10.1007/s00603-019-01868-8
Zhang, Y., Feng, X. T., Zhang, X. W., Wang, Z., Sharifzadeh, M., Yang, C., et al. (2019b). Strain energy evolution characteristics and mechanisms of hard rocks under true triaxial compression. Eng. Geol. 228, 105222–105281. doi:10.1016/j.enggeo.2019.105222
Zhao, X. G., and Cai, M. (2014). Influence of specimen height-to-width ratio on the strainburst characteristics of Tianhu granite under true-triaxial unloading conditions. Can. Geotech. J. 52 (7), 890–902. doi:10.1139/cgj-2014-0355
Zhao, X. G., Wang, J., Cai, M., Cheng, C., Ma, L. K., Su, R., et al. (2014). Influence of unloading rate on the strainburst character-istics of Beishan granite under true-triaxial unloading conditions. Rock Mech. Rock Eng. 47 (2), 467–483. doi:10.1007/s00603-013-0443-2
Zhao, Y. X., and Jiang, Y. D. (2010). Acoustic emission and thermal infrared precursors associated with bump-prone coal failure. Int. J. Coal Geol. 83 (1), 11–20. doi:10.1016/j.coal.2010.04.001
Keywords: water content, rockburst, true triaxial, energy, acoustic emission
Citation: Chen K, Zhou W, Pan Y, Zhuo Y and Zheng G (2023) Characterization of true triaxial rock bursts in sandstones with different water contents. Front. Earth Sci. 10:1087849. doi: 10.3389/feart.2022.1087849
Received: 02 November 2022; Accepted: 05 December 2022;
Published: 27 January 2023.
Edited by:
Yunhui Zhang, Southwest Jiaotong University, ChinaReviewed by:
Junchao Cai, Henan University of Science and Technology, ChinaDan Ma, China University of Mining and Technology, China
Zhenzhen Wang, Hainan University, China
Copyright © 2023 Chen, Zhou, Pan, Zhuo and Zheng. This is an open-access article distributed under the terms of the Creative Commons Attribution License (CC BY). The use, distribution or reproduction in other forums is permitted, provided the original author(s) and the copyright owner(s) are credited and that the original publication in this journal is cited, in accordance with accepted academic practice. No use, distribution or reproduction is permitted which does not comply with these terms.
*Correspondence: Weijin Zhou, beyondzwj@126.com; Yuangui Pan, panyuangui@126.com