Prediction of hydrocarbon source rock distribution using logging curves: A case study of Es32 source rock in Nanpu Sag, Huanghua depression, Bohai Bay Basin
 Qianwen Guo
 Shan Jiang1*
  Quanzhen Zhou
- 1College of Earth Sciences, Yangtze University, Wuhan, Hubei, China
- 2Jidong Oilfield Exploration and Development Research Institute, China National Petroleum, Tangshan, Hebei, China
The Es3 is the main hydrocarbon source rock system in the Nanpu Sag. Finally, the TOC and hydrocarbon potential of each sub depression of Es3were predicted. The study shows that the hydrocarbon source rocks of Es32 and Es34 sections are mainly of type II2 and type II1 respectively, with good organic matter type and high maturity. Biomarker compound parameters indicate that the Es32 section hydrocarbon source rocks developed in a semi-saline, low to medium terrestrial source organic matter supplied reduction environment with a high algal contribution; the Es34 section hydrocarbon source rocks formed in a freshwater, low terrestrial source supplied reduction environment with a medium-high algal contribution. The multiple linear regression method is more effective than the ΔlgR method in predicting hydrocarbon source rocks in the Nanpu Sag, and the prediction accuracy is higher; the correlation between TOC and S1 + S2 is the best in the model for predicting hydrocarbon potential. The TOC and hydrocarbon potential of the hydrocarbon source rocks in Es31 are generally low; the high value area of TOC and hydrocarbon potential of the hydrocarbon source rocks in Es32 is partly between the No. 1 tectonic zone and No. 5 tectonic zone in Linque sub depression, and the TOC and hydrocarbon potential of the hydrocarbon source rocks in Liunan sub depression are larger; the high value area of TOC and hydrocarbon potential of the hydrocarbon source rocks in Es34 is mainly concentrated in Shichang sub depression.
1 Introduction
Under the guidance of the geological theory of complex oil and gas accumulation and hydrocarbon formation (Hu, 1982; Guo, 2006; Fu et al., 2021; Liang et al., 2021; Pan et al., 2022), with the in-depth research of fine 3D seismic and comprehensive geology (Zhao and Chi, 2000; Zhou et al., 2005; Guo et al., 2021), the concepts of oil and gas-rich depressions with full-concave oil-bearing theory, oil and gas-bearing system and complex hydrocarbon generation system have been put forward successively (Magoon and Dow, 1994; Chen et al., 2000; Zhao et al., 2002; Zhao et al., 2004; Meng et al., 2008; Lin et al., 2022), which have great guiding significance for oil and gas exploration in Bohai Bay Basin. The Nanpu Sag is an important fault-type oil and gas-rich depression in the Bohai Bay Basin, mainly located in the low part of the depression and in the lithologic stratigraphic traps in the slope area (Zhao et al., 2008; Sun et al., 2015; Dang et al., 2016). Hydrocarbon source rocks are the material basis for hydrocarbon formation and determine the hydrocarbon production capacity (Cheng et al., 2021; Han et al., 2016; Kang, 2021; Meng et al., 2022). A correct understanding of hydrocarbon source rock characteristics and spreading pattern is the basis and key to hydrocarbon exploration (Huang et al., 2017).
A large number of scholars have studied hydrocarbon source rocks in major basins in China, Among them, Zou et al. (2010)simulated the maturity evolution and hydrocarbon production and discharge processes of hydrocarbon source rocks in the Bohai Bay Basin based on the sedimentary and tectonic development history of hydrocarbon source rocks combined with geochemical and thermal parameters; Lu et al. (2017) used the material balance method to quantitatively analyze hydrocarbon expulsion from source rocks in the Songliao Basin, and used the “over-pressure” module of PetroMod software to evaluate the over-pressure history of source rocks; Zhang et al. (2017) used constant water pressure and high water pressure experiments to simulate the pyrolysis of carbonaceous mudstones drilled in the Liaohe Basin, and the results showed that the number of hydrocarbon discharges had a significant contribution to the production of liquid hydrocarbons from hydrocarbon source rocks; Liu et al. (2017) established the evaluation method for hydrocarbon generating substances of marine carbonate source rocks by studying the matching relationship between the hydrocarbon source rocks in Tarim Basin and the oil and gas reservoirs in Tahe Oilfield; Pang et al. (2020) used the pyrolytic hydrocarbon generation potential index method and single-factor regression analysis to characterize the hydrocarbon generation and discharge of hydrocarbon source rocks in the Sichuan Basin and a quantitative model for the probability of reservoir formation under controlled systems; Tang et al. (2021)established evaluation criteria and hydrocarbon generation models for alkaline lacustrine hydrocarbon source rocks in the Mahu Depression of the Dzungar Basin. (Song et al., 2021).quantified the potential of different resource types in the Tsaidam Basin based on the geochemical and petrological characteristics of hydrocarbon source rocks combined with the buoyancy-driven hydrocarbon formation depth (BHAD) and the lower limit of movable resource abundance.
In recent years, some scholars have evaluated hydrocarbon source rocks in the Nanpu Sag, mainly including hydrocarbon source rock development sections, geochemistry and hydrocarbon production and discharge characteristics. (Guo et al., 2013). used a basin and hydrocarbon-bearing system modelling approach to study the hydrocarbon transport history of the Nanpu Sag, suggesting that hydrocarbon source rocks are mainly developed in Ed3 of the Dongying Formation, Es1 and Es3 of the Shahejie Formation; Gang et al. (2021) conducted rock pyrolysis, gas chromatography-mass spectrometry, elemental geochemistry organic and inorganic analyses on several samples showing that the Es3 section has higher organic carbon content than the Ed3 and Es1 sections, and the hydrocarbon source rocks have the highest hydrocarbon generation potential, with the Ed3 and Es1 section hydrocarbon source rocks being of type II1-II2, and the Es3 section hydrocarbon source rocks being dominated by type II2-III chevrons. (Pei et al., 2016). studied the genesis of oil reservoirs in four tectonic zones in the Nanpu Sag, pointing out that the hydrocarbon source rocks in the Ed3 and Es1 sections were deposited in a freshwater anoxic environment, and the hydrocarbon source rocks in the Es3 section were deposited in a high salinity, anoxic interval, with a large contribution from terrestrial organic matter (TOM); Wei and Sun. (2017) concluded that the thickest effective hydrocarbon source rocks in the Ed3 section are located in the Linque and Liunan sub depressions based on hydrocarbon source rock evaluation characteristic parameters and the oil source comparison method, and that the Caofeidian sub depression has greater exploration potential. (Wang et al., 2021). and (Zhu et al., 2013) considered the initial hydrogen index and conversion ratio during hydrocarbon source rock evolution based on the measured rock-eval pyrolysis data, which more realistically reflected the hydrocarbon generation and discharge history of hydrocarbon source rocks. For the study of the hydrocarbon source rocks in the Es3sub-section of the Nanpu Sag, (Zuo et al., 2010), concluded that two hydrocarbon source foci developed early in the Es32 of the Bohai Bay Basin, and that the Nanpu Sag was one of the main hydrocarbon source foci that evolved with geological evolution; Zhu et al. (2013) concluded that Es34 is a high quality hydrocarbon source rock with an effective hydrocarbon source rock thickness of approximately 250 m through detailed comparative analysis of oil shale and crude oil biomarkers and isotopic signatures.
Although the evaluation of the key hydrocarbon source rock formations in the Nanpu Sag is based on certain research, the sub-sections of Es3 with hydrocarbon generation potential are not studied in detail enough, resulting in a lack of clarity on the genesis type and resource potential of the tight oil system, which limits the further exploration of tight oil, therefore, the comprehensive evaluation system of hydrocarbon source rocks in each sub-section Es3 of needs to be improved. In this paper, the hydrocarbon source rocks in the Es3 section of the Nanpu Sag were evaluated and studied through a large number of sample analysis and testing experiments; a quantitative TOC prediction model for the Es3 section was established based on the logging curves using the improved ΔlgR method and multiple linear regression method, and the key wells were selected to compare the predicted and measured TOC values. It also establishes a model for predicting the hydrocarbon generation potential of the Es3 section hydrocarbon source rocks; finally, the organic carbon and hydrocarbon generation potential of each sub-section of Es3 in the study area are predicted. It has important theoretical and application values for the evaluation of hydrocarbon resources and the next exploration direction in the Nanpu Sag.
2 Geological overview
The Nanpu Sag is located in the northeastern part of the Huanghua depression in the Bohai Bay basin. It has a tectonic pattern of northern fault and southern superstructure developed through the application of block faulting in the Middle and Cenozoic eras on the base of the North China Platform, covering an area of about 1930 km2 (Li et al., 2010; Xu et al., 2010). The depression is mainly developed on the Southwest Zhuang, Baige Zhuang and Shabei boundary faults (Wang et al., 2020), and can be divided into four hydrocarbon bearing depressions, namely the Caofeidian sub depression, the Linque sub depression, the Liunan sub depression and the Shichang sub depression, and eight major tectonic zones, namely the Nanpu1-5, Laoyemiao, Gaoshangpu and Liuzan. The Caofeidian sub depression is located in the southern part of the Nanpu3 structure, the Linque sub depression is located in the southern part of the Laoyemiao structure, the Liunan sub depression is in the central part of the Nanpu4 and Liuzan structures, and the Shichang sub depression is located in the northern part of the Gaoshangpu structure (Cheng et al., 2022). The Nanpu Sag is characterized by a complex fracture system consisting of fractures of different levels and different time periods, and the fractures and their subdivisions form a complex fracture system (Figure 1A). The sedimentary rocks of the Nanpu Sag are up to 8000 m thick and consist of the Shahejie Formation (Es) and Dongying Formation (Ed) of the Palaeocene and the Minghuazhen Formation (Nm) and Tantao Formation (Ng) of the Neoproterozoic (Chen et al., 2020). The Shahejie Formation stratigraphy can be divided into Es1, Es2, and Es3. Among them, the Es3 section is a shallow lake-deep lake, fan delta and alluvial fan deposition, which shows a complete secondary cycle of coarse lower, medium and fine upper, with a total thickness of 600–2000 m and an overall upward thinning. It is divided into five sub-sections (Es35, Es34, Es33, Es32, and Es31) based on lithology from the bottom up (Figure 1B).
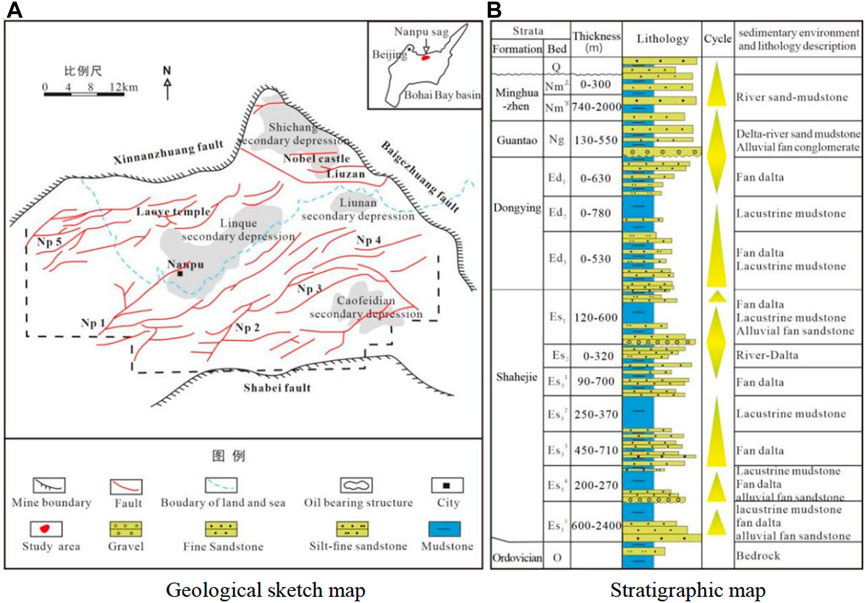
FIGURE 1. Structural and comprehensive geological histogram of the study area. (A) Geological sketch map (B) Stratigraphic map.
3 Hydrocarbon source rock evaluation
Three sets of hydrocarbon source rocks, Es31, Es32, and Es34, are developed in the Es3 section of the Nanpu Sag, of which Es32 and Es34 are the main hydrocarbon source rocks. This study focuses on the evaluation of the effective hydrocarbon source rocks in the Es32 and Es34 sections of the Shichang, Linque and Caofeidian sub depressions.
3.1 Organic matter abundance
Organic matter abundance refers to the enrichment of organic matter per unit mass of rock. Indicators that effectively reflect the organic matter abundance of hydrocarbon source rocks include organic carbon (TOC), hydrocarbon generating potential (S1+S2), chloroform bitumen “A” and total hydrocarbon (HC), etc. (Bojang and Xiongqi, 2014). According to the organic matter abundance distribution map, the organic carbon content of Es32 is 0.12%–2.82%, with an average value of 0.41%; the hydrocarbon potential value is 0.10–9.21 mg/g, with an average value of 0.67 mg/g; the hydrocarbon source rock abundance of Es32 is a poor hydrocarbon source rock, not the main hydrocarbon source rock section in Shichang sub depression. The organic carbon content of Es34 is 0.21%–35.18%, with an average value of 4.13%. The organic carbon content of Es34 ranges from 0.21% to 35.18%, with an average value of 4.13%; the hydrocarbon potential values are distributed from 0.20 to 105.1 mg/g, with an average value of 15.81 mg/g; Es34 is the main hydrocarbon source rock section in Shichang sub depression (Figure 2A). The organic carbon content of section Es32 in Linque Sub-pavement ranges from 0.25% to 2.71%, with a mean value of 1.16%; the hydrocarbon potential values are distributed from 0.18 to 4.97 mg/g, with a mean value of 1.46 mg/g. The organic carbon content of section Es32 in Caofeidian sub depression ranges from 0.47% to 2.99%, with a mean value of 1.43%; the hydrocarbon potential values range from 0.56 to 9.92 mg/g, with a mean value of 3.46 mg/g; Es32 section hydrocarbon source rocks are the main hydrocarbon source rock section of Linque and Caofeidian sub depression (Figures 2B,C).
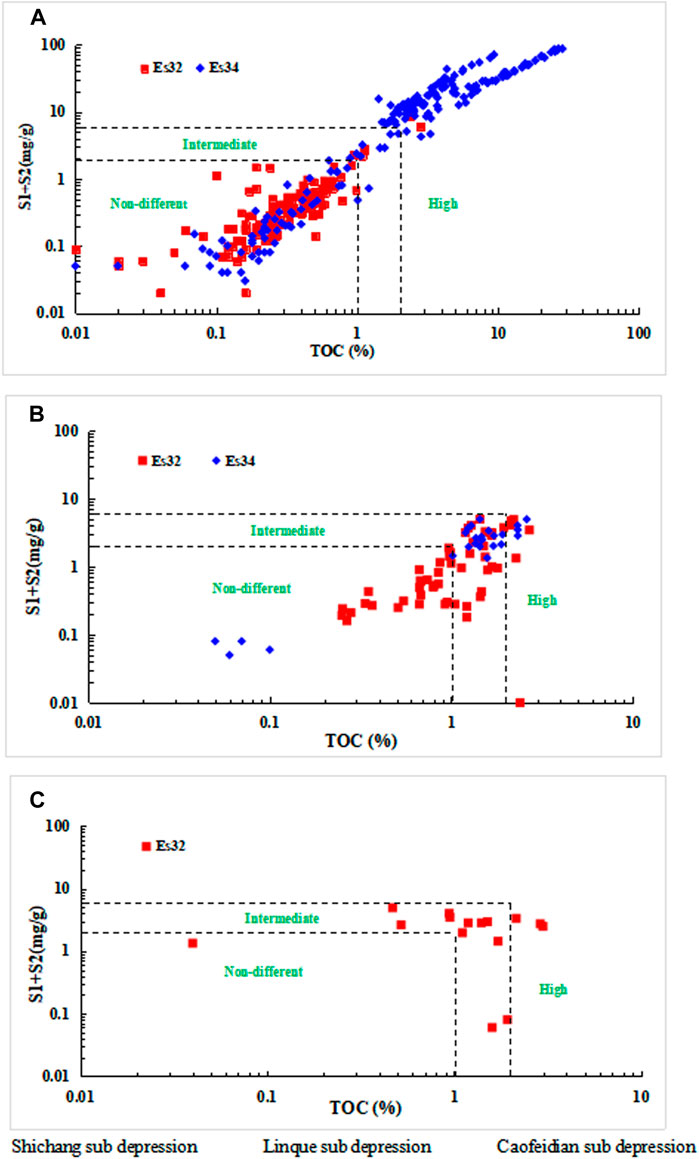
FIGURE 2. Statistical distribution map of organic matter abundance of Es3 source rocks in different sub depressions of Nanpu Sag. (A) Shichang sub depression. (B) Linque sub depression. (C) Caofeidian sub depression.
3.2 Organic matter types
The organic matter type is one of the main indicators for classifying organic phases and evaluating the hydrocarbon generation potential of organic matter (Lu et al.,2012). The data collected show the following characteristics of the organic microfraction: the specular group is generally low in content, grey in oil-immersion reflected light, and the specular bodies do not fluoresce; the inert group is slight in content, with grey-white filamentous bodies predominating in oil-immersion reflected light; the crustacean group has mainly laminar algal bodies, microsporidia yellow (Figure 3A), fluorescent microsporidia, mostly occurring as flat rings and worms, a few greenish-yellow fluorescent, striped thin-walled keratophores; mineral asphalt matrixmostly disperse, crustacean; very few fluorescent bodies with strong green fluorescence (Figure 3B). In this study, the main method of pyrolysis analysis was used to classify the organic matter types of hydrocarbon source rocks in the Nanpu Sag. The hydrogen index HI of hydrocarbon source rock pyrolysis can classify the type of organic matter. The temperature Tmax corresponding to the appearance of the P2 peak during pyrolysis can determine the maturity of organic matter, and the organic matter type of hydrocarbon source rock can be judged by making an intersection diagram between the hydrogen index and Tmax. The rock pyrolysis analysis shows that the best organic matter type is found in the Es34 section of the Shichang sub depression (Figures 4A,B), dominated by type I∼II2, with the least terrestrial supply; the hydrocarbon source rocks in the Linque and Caofeidian sub depression Es32 sections have more contribution from higher plants (Figure 4C), and the organic matter type is dominated by type II2∼III mixed cheese roots.
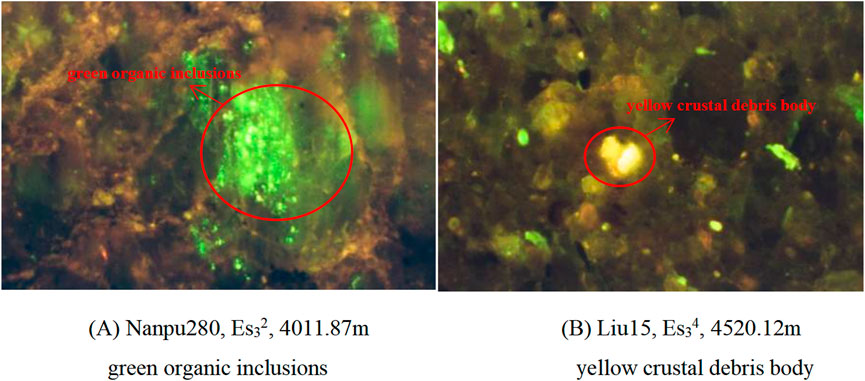
FIGURE 3. Group of maceral photographs of Es3 source rocks in Nanpu Sag. (A) Nanpu280, Es32, 4011.87 m green organic inclusions. (B) Liu15, Es34, 4520.12 m yellow crustal debris body.
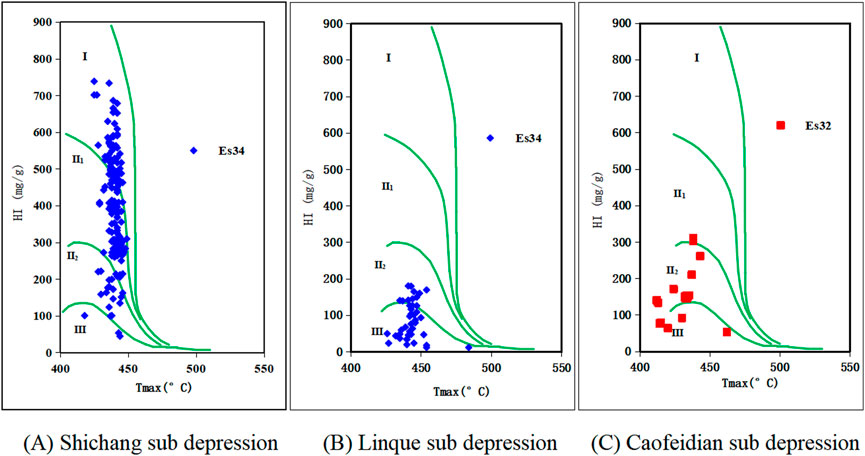
FIGURE 4. Classification of organic matter types of Es3 source rocks in different sub depressions of Nanpu Sag. (A) Shichang sub depression. (B) Linque sub depression. (C) Caofeidian sub depression.
3.3 Organic matter maturity
The abundance of organic matter determines the amount of hydrocarbon producing material base of the hydrocarbon source rock, the type of organic matter determines the hydrocarbon producing potential of the hydrocarbon source rock, and the ability to produce oil or gas is closely related to the degree of thermal evolution of the organic matter (Xia et al., 2019). The Specular body reflectance (Ro) is currently the most common method for determining the maturity of organic matter. According to the measured data (Figure 5), the Specular body reflectance (Ro) of hydrocarbon source rocks in the Nanpu Sag is mainly distributed in the range of 0.25%–1.75%. Ro is distributed in the depth range of 2000–5500 m, and the relationship with depth is not very clear, even the shallow part is higher than the deep part of Ro. This is mainly due to the influence of the igneous rocks prevalent in the Nanpu Sag. Leaving aside the anomalies influenced by igneous rocks, the conventional peak oil generation should correspond to a depth of roughly 4200 m, with the angry phase being deeper. According to the trend of Ro, the immature stage is not indicated, and the boundary between the low and mature stages is roughly around 3100 m depth.
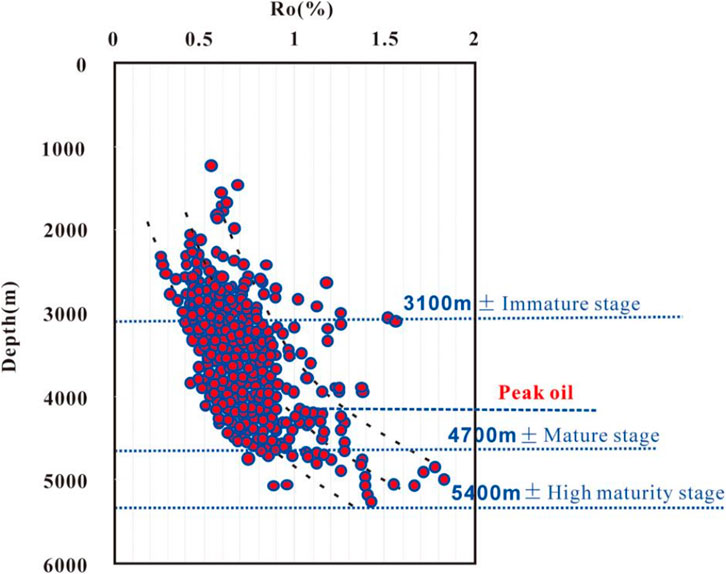
FIGURE 5. Relationship between Ro and depth of source rocks in Nanpu Sag.
The reflectance data of the specular bodies were analyzed by different sub depression sub-tectonic zones, in different tectonic zones of the Nanpu Sag, there are some differences in the rate of increase of Ro with increasing depth of the strata. The hydrocarbon source rocks in the Es34 section of the Shichang sub depression are all in the mature stage, with a hydrocarbon generation limit of about 2700 m and a peak oil generation at about 4200 m (Figure 6A). The hydrocarbon source rocks in the Es32 section of the Linque sub depression are in the mature stage, with a hydrocarbon generation limit of about 3000 m and a peak oil generation at about 4700 m (Figure 6B). The hydrocarbon source rocks of section Es32 in Caofeidian sub depression have entered the mature stage, with hydrocarbon generation threshold less than 3500 m and oil generation peak at 4200 m (Figure 6C).
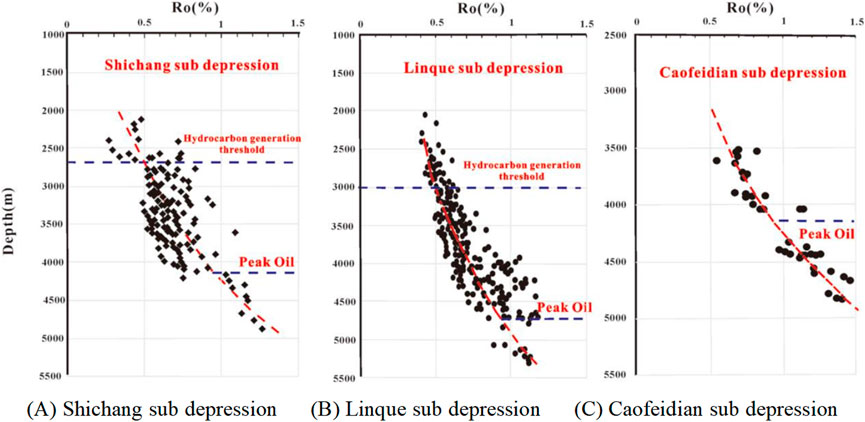
FIGURE 6. Relationship between Ro and depth of Es3 source rocks in different sub-depressions of Nanpu Sag. (A) Shichang sub depression. (B) Linque sub depression. (C) Caofeidian sub depression.
3.4 Biomarker characteristics
Biomarker compounds are derived from organisms that have lived (especially lipid-like compounds) and are complex molecular fossils. The parameters basilane/phytane (Pr/Ph), sterane/hoxane (S/H), C19 tricyclic terpene/C23 tricyclic terpene (C19/C23TT), C20 tricyclic terpene/C23 tricyclic terpene (C20/C23TT), C27/C29 rule sterane parameters, gammacerane index (gammacerane/αβ-C30holo) and 4-methyl sterane (4MSI) were selected as the seven parameters are used to distinguish the organic geochemical characteristics of the hydrocarbon source rocks in each sub-section of theEs3. The study shows (Figure 7) that there are significant differences between the Es32 and Es34 sections mainly in terms of water properties and biogenic composition. The mean Pr/Ph value of the hydrocarbon source rocks in the Es32 section is 1.8, the weakly reduced water environment, the mean Gam/H index is 0.22, the mean C27/C29 sterane value is 0.85, the mean C19/C23 and C20/C23 tricyclic terpene parameters are 0.39 and 0.93 respectively; the mean S/H value is 0.31. The developmental environment is generally a reduced environment with semi-saline, low to medium terrestrial organic matter supply and a large contribution from algae. Es34 section hydrocarbon rock Pr/Ph mean 1.2, weak reduction-reduction water environment, Gam/H index mean 0.05, C27/C29 sterane mean 0.43, C19/C23 and C20/C23 tricyclic terpene parameter means 0.23 and 0.56 respectively; S/H mean 0.13. Although organic matter productivity was not prominent, the contribution of methanogens was evident and generally formed in a freshwater, low terrestrial supply reduction environment with a medium-high algal contribution.
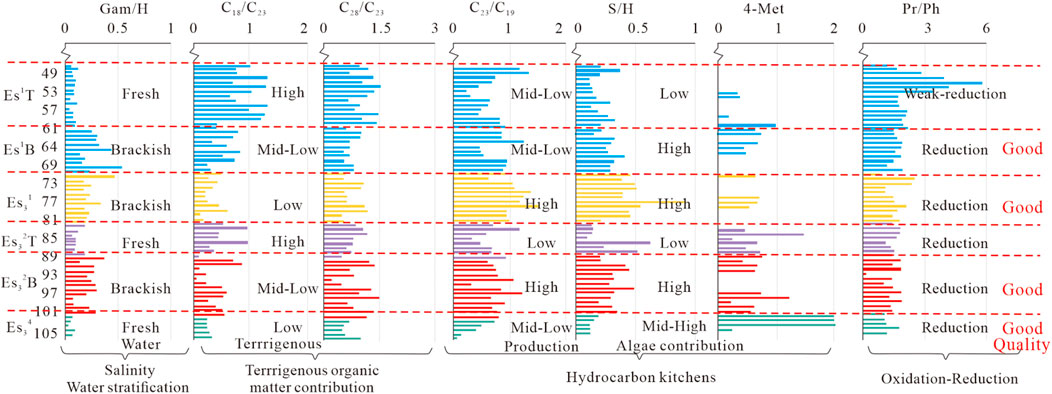
FIGURE 7. Characteristics of organic geochemical parameters of Es3 source rocks of Nanpu Sag.
4 Hydrocarbon generation potential prediction model
4.1 Effective hydrocarbon source rock identification
The identification of effective hydrocarbon source rocks is mainly evaluated in terms of organic matter abundance, organic matter type and maturity of hydrocarbon source rocks, which require the three conditions of being rich in organic matter, having reached maturity stage and being able to discharge hydrocarbons effectively at the same time (Hou et al.,2015). The inflection point where the hydrocarbon production potential (S1 + S2) changes with the abundance of hydrocarbon source rocks will produce obvious inflection points (Figure 8). The inflection point where the hydrocarbon production potential increases significantly is usually taken as the discriminatory limit for effective hydrocarbon source rocks, while the inflection point where the hydrocarbon production potential no longer increases significantly is taken as the discriminatory limit for high-quality hydrocarbon source rocks. The parameters for identifying hydrocarbon source rocks in the Es3 section were determined by subdividing the Nanpu Sag, and the criteria for identifying hydrocarbon source rocks in the study area were established (Table 1). The lower limit of hydrocarbon source rock abundance in the Es3 section is TOC >0.8%, and the lower limit of high quality hydrocarbon source rock abundance is TOC >2.0%.
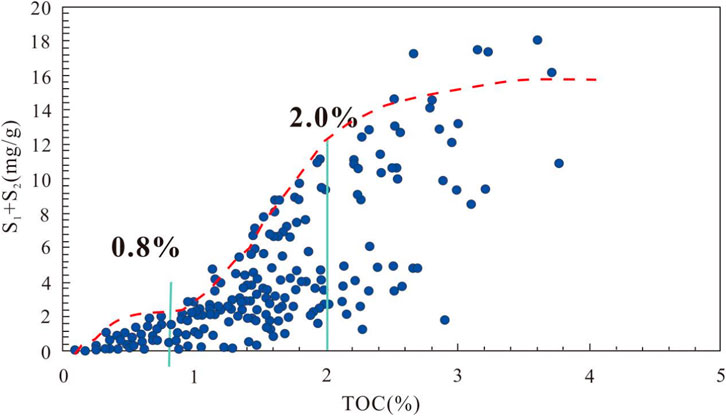
FIGURE 8. Relationship between S1 + S2 and TOC of Es3 source rocks in Nanpu Sag.
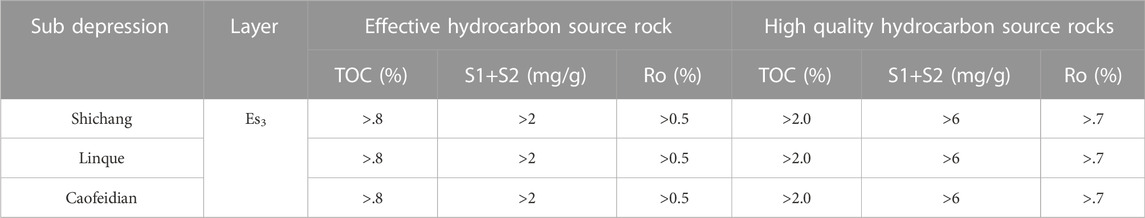
TABLE 1. Identification criteria of Es3 source rocks in Nanpu Sag.
4.2 TOC prediction model
The main methods for quantitative evaluation of hydrocarbon source rocks based on logging data are ΔlgR method, multiple linear regression method and CNN neural network method, etc. Although the CNN neural network method has greater advantages in solving non-linear complex problems, it is difficult to express them in expressions. Currently, multiple linear regression and ΔlgR methods are widely used in the quantitative prediction and evaluation of hydrocarbon source rocks.
1) ΔlgR
The ΔlgR method was originally proposed by Passey et al. Based on the theory of qualitative identification of hydrocarbon source rocks by natural gamma curves, two curves of sonic time difference and resistivity are applied, and when the rocks are fine-grained and non-hydrocarbon source rocks, these two logging curves overlap together to show the baseline, and the difference in magnitude between the two curves is the ΔlgR value. The model can effectively eliminate the porosity on the logging response value of organic carbon content The effect of Eq:
The ΔlgR method was used to predict the TOC content of hydrocarbon source rocks using the equation.
To avoid the uncertainty that arises when manually superimposing the acoustic and resistivity curves, the ΔlgR equation is deformed as follows.
where R is the resistivity, R baseline is the resistivity of the non-hydrocarbon source rock section, Δt is the acoustic time difference, Δt baseline is the acoustic time difference of the non-hydrocarbon source rock section, x is the coefficient, Ro is the organic matter maturity index, and the values of a, b and c can be obtained by analysis of samples from the study area and fitting with least squares.
Considering that the lithological combination and maturity of hydrocarbon source rocks under different sedimentary phase zones in different areas of the Nanpu Sag may cause differences in logging response, in order to improve the TOC logging prediction model in the study area, the actual hydrocarbon source rock sample points and logging parameters were counted in the Linque sub depression, Caofeidian sub depression and Shichang sub depression respectively, and regression analysis was carried out according to the above equation to obtain the TOC prediction models for different sub depressions Es3 sections in turn, although there are some differences in the prediction models in different areas, the correlation coefficient of the ΔlgR method TOC prediction model for the Nanpu Sag is generally around 0.65.
2) Multiple linear regression
Multiple linear regression is to take hydrocarbon source rock TOC as the dependent variable and multiple logging parameters that correlate well with TOC as independent variables to establish multiple regression equations, and determine the best TOC quantitative prediction model through multiple regression analysis. The hydrocarbon source rocks in the Es3 section of the Nanpu Sag are characterized by high natural gamma, high acoustic time difference, high resistivity and low density in the logging curve response. The high gamma of hydrocarbon source rocks is due to the small particle size and large specific surface area of hydrocarbon source rocks, which adsorb more radioactive element uranium; the high resistivity is due to the presence of organic matter with poor electrical conductivity in high quality hydrocarbon source rocks, resulting in a large resistivity; the high acoustic time difference value between organic matter and oil and gas in hydrocarbon source rocks is larger than the rock skeleton will cause the increase of acoustic time difference (AC) in the formation; the density of organic matter in hydrocarbon source rocks (1.1–1.4 g/cm 3) is much lower than that of quartz and clay, so the density logging values (DEN) show low values. Based on the measured TOC of hydrocarbon source rocks in the Nanpu Sag and the five logging parameters, GR, AC, RT, DEN, and SP, using data analysis tools, a multiple regression model was constructed.
Where: a, b, c, d and e are constants; f is the random error.
To improve the accuracy of the prediction formulae, the measured TOC data and corresponding logging parameters in the study area were statistically grouped separately according to different blocks.
To verify the accuracy of the two methods, a single well with more geochemical analysis data was selected to compare the predicted TOC values with the measured TOC values. The Nanpu1 well is located near the SW1 tectonic zone in the Linque sub depression. The well has more organic carbon analysis data in the Es3 section and the logging data is of good quality. The organic carbon logging response model (Figure 9A) shows that the measured organic carbon distribution in the Es31 and Es32 sections of the Nanpu1 well ranges from 0.35% to 1.68%, with an average value of 0.97%. The interpretation of the logs showed that the correlation coefficient between TOC and measured TOC calculated by the ΔlgR model was 0.23, while the correlation coefficient between TOC and measured TOC calculated by the multiple linear regression model was 0.801. It can be seen visually (Figure 9B) that the comparison between the predicted TOC and measured TOC by the multiple linear regression method also revealed a better agreement between the two, indicating that the multiple linear regression The comparison between the TOC predicted by the multiple linear regression method and the measured TOC also reveals a better agreement between the two, indicating that the multiple linear regression method is better than the ΔlgR method in predicting the hydrocarbon source rocks in the Es3 section of the Nangpu1 well in the Linque sub depression, with a higher prediction accuracy.
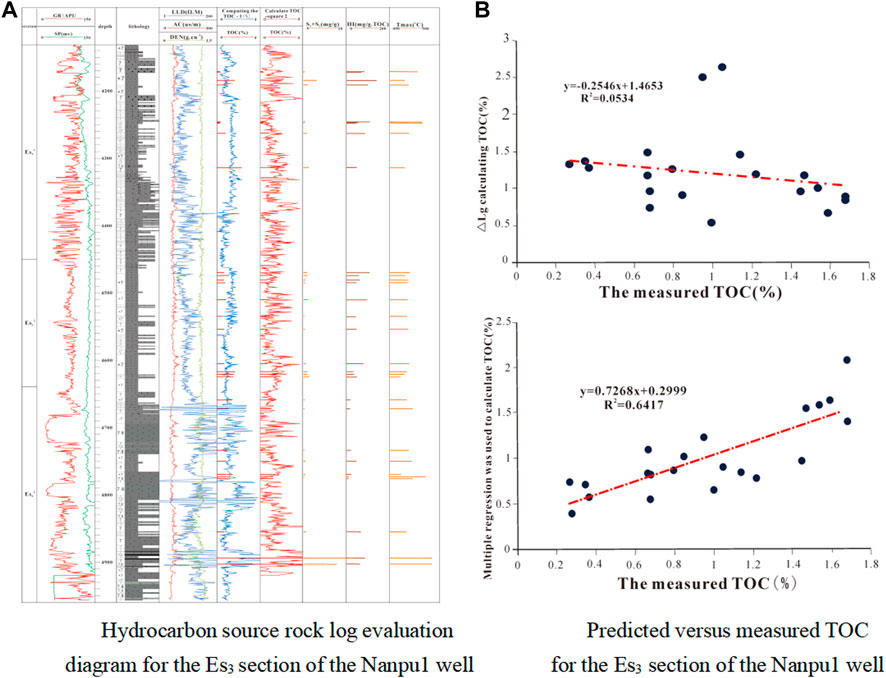
FIGURE 9. The diagram of logging evaluation and relationship between prediction and measured of Es3 source rock in well Nanpu1. (A) Hydrocarbon source rock log evaluation diagram for the Es3 section of the Nanpu1 well. (B) Predicted versus measured TOC for the Es3 section of the Nanpu1 well.
4.3 Hydrocarbon generation potential prediction model
In this study, the total organic carbon content (TOC) and rock pyrolysis hydrocarbon potential (S1+S2) of the measured hydrocarbon source rock samples from the Es3 section of Shichang, Linque and Caofeidian sub depression were calculated and correlation analysis was performed to predict the hydrocarbon potential of the Es3 hydrocarbon source rock.
As can be seen from the rendezvous plot (Figure 10), the measured geochemical parameters TOC of Es3 hydrocarbon source rock samples in the study area show a good positive correlation with S1 + S2, with the best correlation between TOC and S1 + S2 in the Shichang sub depression and the next best correlation in the Linque sub depression. The correlation coefficients are 0.912, 0.705, and 0.681 for Shichang.
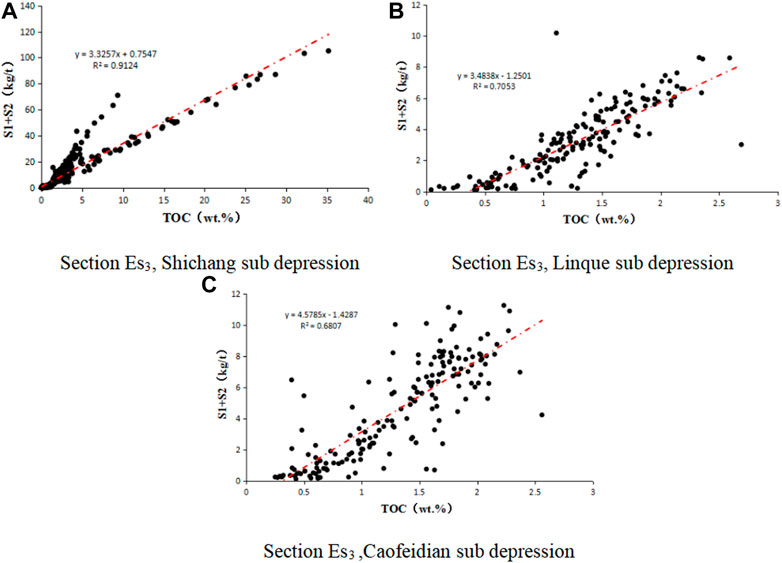
FIGURE 10. Cross plot of measured TOC and S1+S2 of Es3 source rocks in different sub depressions of Nanpu Sag. (A) Section Es3, Shichang sub depression. (B) Section Es3, Linque sub depression. (C) Section Es3 , Caofeidian sub depression.
Linque and Caofeidian respectively. The multiple regression method of logging parameters can predict the TOC of hydrocarbon source rocks in the study area more accurately, so the predicted TOC can be used to predict the hydrocarbon generation potential again, and the model for predicting the hydrocarbon generation potential is as follows.
Where: a is a constant; b is a random error. a and b values can be obtained by analysing samples from the study area with a linear fit, and the final model for predicting the hydrocarbon generating potential of the Es3 section of the Nanpu Sag is obtained (Table 2).
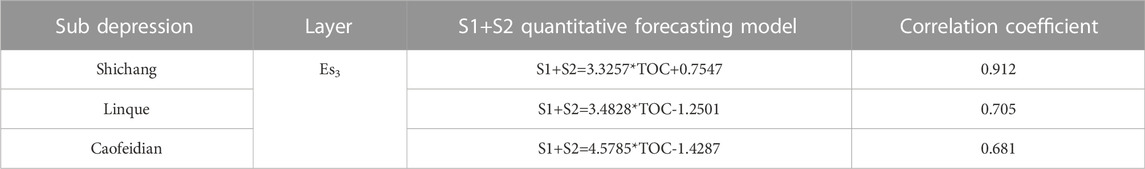
TABLE 2. Prediction model of hydrocarbon generation potential of Es3 source rocks of Nanpu Sag.
5 Predicted planar distribution of hydrocarbon source rocks
5.1 Predicted organic carbon planes
The prediction of total organic carbon in hydrocarbon source rocks in the study area is mainly based on the method of point-controlled pits and pits-controlled surface. Firstly, the predicted wells controlling each sub depression were selected and the median of the predicted TOC curve of a single well was calculated as the TOC value of that well. The trend of TOC between wells is combined with the trend of TOC between wells to control the internal spreading of each tectonic zone and sub depression. Finally, the TOC of each tectonic zone and sub depression is linked with the sedimentary phase spread to produce a TOC contour map for that section of the formation.
TOC values for hydrocarbon source rocks in the Es31 section are generally not high, with predicted TOC greater than 2.0% area, and only relatively high areas exist in the Linque sub depression and Caofeidian sub depressions, with overall TOC between 1.4% and 1.6% (Figure 11A). The TOC in the No. 5 tectonic zone ranges from 0.8% to 1.0%; in the slope area between No. 1 and No. 3 tectonic zone, the TOC ranges from 0.8% to 1.2%, gradually decreasing from the Linque sub depression to the slope; the TOC in the Liunan sub depression is around 1.0%; and the TOC in the Shichang sub depression is generally low, basically not reaching the lower limit of 0.8% effective hydrocarbon source rock.
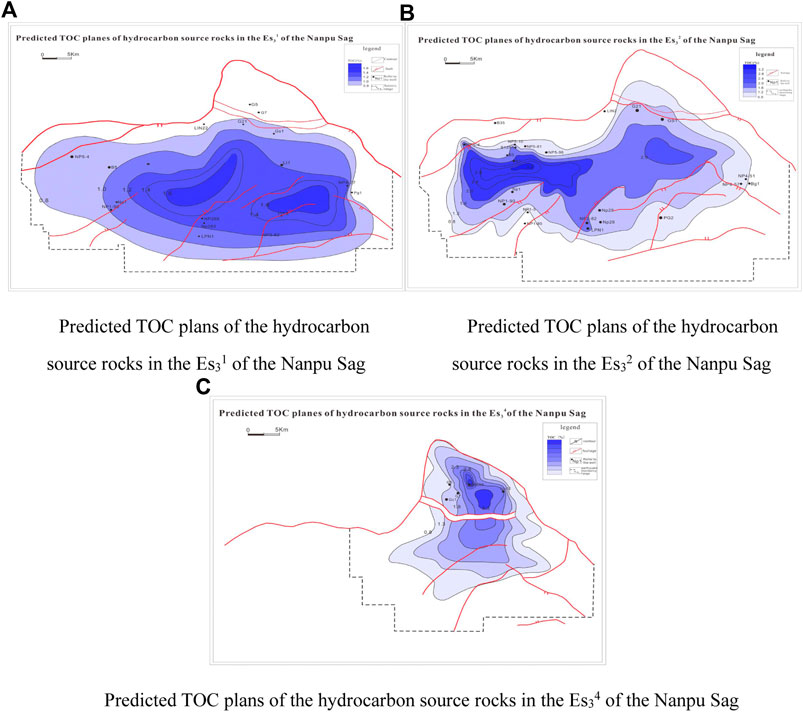
FIGURE 11. TOC planimetry of Es3 source rocks in different sub depressions of Nanpu Sag. (A) TOC planimetry of the hydrocarbon source rocks in the Es31 sub depression. (B) TOC planimetry of the hydrocarbon source rocks in the Es32 sub depression. (C) TOC planimetry of the hydrocarbon source rocks in the Es34 sub depression.
The high value hydrocarbon source rocks of Es32 section are mainly concentrated between the No. 5 and No. 1 tectonic zones in the Linque sub depression and the Liunan sub depression (Figure 11B). The high TOC values in the Linque sub depression trend nearly east-west, with TOC ranging from 2.0% to 3.2%; the Linque sub depression TOC ranging from 1.6% to 2.0%; the Shichang sub depression TOC values ranging from 0.8% to 1.2%; and the Caofeidian sub depression TOC values ranging from 0.8% to 1.2%.
The area of high TOC values for hydrocarbon source rocks in the Es34 section is mainly concentrated in the Shichang sub depression (Figure 11C), with average values ranging from 1.3% to 4.3%, with the highest TOC of 35% in well G66x9; the overall TOC is slightly lower in the Linque sub depression area, ranging from 1.3% to 2.0%.
5.2 Hydrocarbon potential plane projection
The regression of the single well measured and predicted TOC against the single well S1 +S2 was used to establish the hydrocarbon source rock relationship for the Es3 section (Figure 12). The linear relationship was combined with the TOC prediction results to predict the hydrocarbon potential of each layer and then combined with the single well control to obtain a hydrocarbon potential plan.
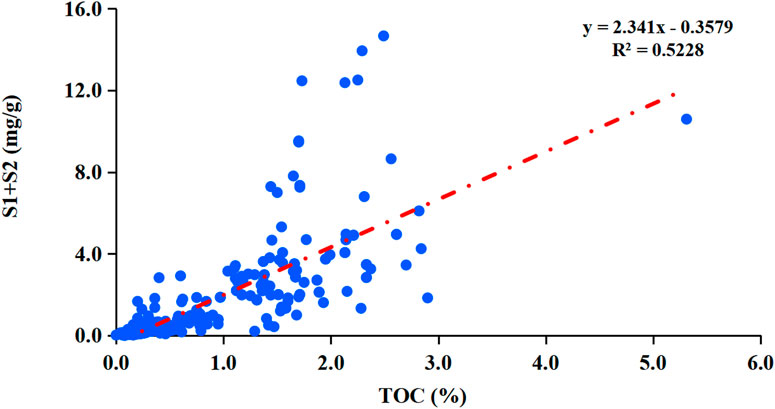
FIGURE 12. Linear diagram of TOC and S1 + S2 of Es3 source rocks of Nanpu Sag.
The hydrocarbon source rocks in the Es31 section have relatively low hydrocarbon generation potential, with S1 + S2 at a maximum of 4.0 mg/g, mainly concentrated in the Linque sub depression and Caofeidian sub depression (Figure 13A). The north-west oriented hydrocarbon source rocks are relatively high between the No. 2 and No. 3 structures in the Linque sub depression, with S1 + S2 at 3.0–4.0 mg/g; the S1 + S2 in the Caofeidian sub depression is 3.0–4.0 mg/g, and the high value area is obviously controlled by faults and spreads in an east-west direction; the S1 + S2 in the No. 5 tectonic zone is between 0.5 and 2.5 mg/g, and the hydrocarbon generation potential has a trend of low in the west and high in the east; the S1 + S2 in the Liunan sub depression is 0.5–2.5 mg/g, and the S1 + S2 in the Liunan sub depression is 0.5–2.5 mg/g. S1 + S2 is between 0.5 and 2.5 mg/g, and the hydrocarbon potential gradually decreases from southwest to northeast.
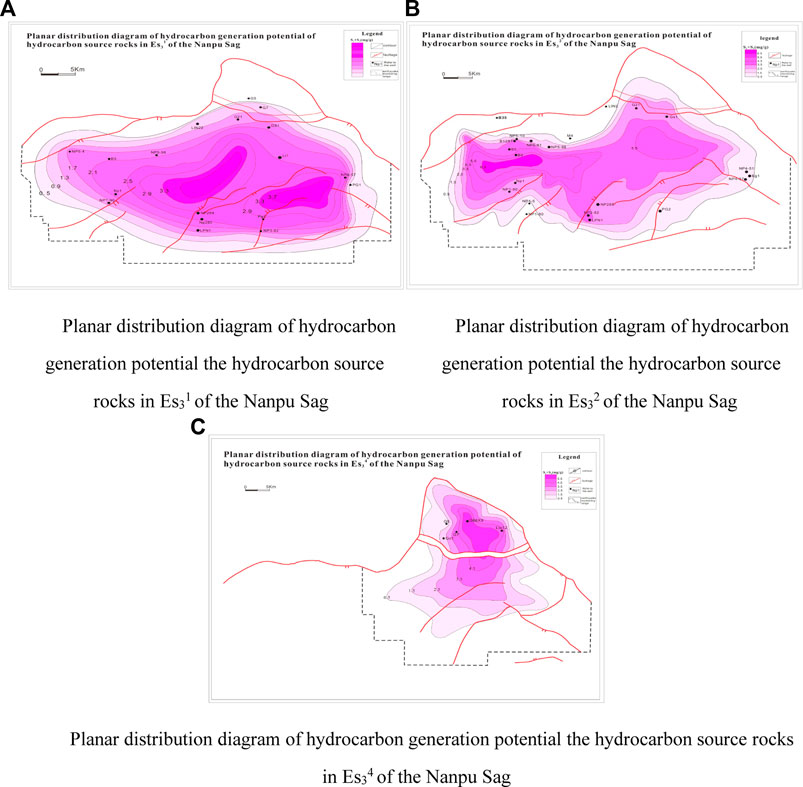
FIGURE 13. Plane prediction map hydrocarbon generation potential of Es3 source rocks of Nanpu Sag. (A) Plan view of the hydrocarbon potential of the Es31 sub-section. (B) Plan view of the hydrocarbon potential of the Es32 sub-section. (C) Plan view of the hydrocarbon potential of the Es34 sub-section.
Es32 section hydrocarbon source rocks S1 + S2 reach 3.5 mg/g in the vicinity of Linque sub depression, Liunan sub depression and No. 2 tectonic zone (Figure 13B). Among them, the east-west trending high hydrocarbon potential zone is developed between the No. 5 tectonic zone and No. 1 tectonic zone in Linque sub depression, with S1 + S2 between 5.5 and 6.5 mg/g; S1 + S2 in Liunan sub depression is between 5.5 and 6.0 mg/g; Caofeidian sub depression has low hydrocarbon potential, with S1+S2 between 1.5 and 3.5 mg/g.
The high hydrocarbon potential of the Es34 section is mainly concentrated in the Shichang sub depression, with S1 + S2 ranging from 5.5 to 6.0 mg/g in the central sub depression area, including up to 36.0 mg/g in well G66x9 S1 + S2. The hydrocarbon potential decreases to the south, with S1 +S2 ranging from 2.5 to 4.5 mg/g in the Liunan sub depression area (Figure 13C).
6 Conclusion
1) The lower limit of hydrocarbon source rock abundance in the Es3 section is TOC >0.8%; the lower limit of high quality hydrocarbon source rock abundance is TOC >2.0%; by establishing a quantitative TOC prediction model and selecting a single well with more geochemical analysis data to compare the predicted TOC with the measured TOC values, it is found that the multiple linear regression method is more effective than the ΔlgR method in predicting hydrocarbon source rocks in the Nanpu Sag. The results show that the multiple linear regression method is more effective and more accurate than the ΔlgR method in predicting hydrocarbon source rocks in the Nanpu Depression.
2) Total organic carbon content (TOC) and rock pyrolysis hydrocarbon potential (S1 + S2) were calculated for the core samples from Shichang, Linque and Caofeidian sub depressions, respectively, and correlation analysis was performed to establish a hydrocarbon potential prediction model. The best correlation between TOC and S1 + S2 was found in Shichang sub depression, and the second best correlation was found in Linque sub depression.
3) The TOC values and hydrocarbon potential of the hydrocarbon source rocks in section Es31 are generally low, mainly concentrated in the Linque and Caofeidian sub depressions; the high TOC values and hydrocarbon potential of the hydrocarbon source rocks in section Es32 are partly between the No. 5 and No. 1 tectonic zones in the Linque sub depression, and the TOC values and hydrocarbon potential of the Liunan sub depression as a whole are high; the high TOC values and hydrocarbon potential of the hydrocarbon source rocks in section Es34 are mainly concentrated in the Shichang sub depression. The Es3 section hydrocarbon source rocks have high TOC values and hydrocarbon potential mainly in the Shichang sub depression.
Data availability statement
The original contributions presented in the study are included in the article/Supplementary Material, further inquiries can be directed to the corresponding author.
Author contributions
QG: Methodology and validation; SJ: Supervision, review and editing; QZ: Methodology and software; YG: Sample collection and experimentation; JW: Sample analysis and validation; LY: Graphical collation and software; JY: Experimentation.
Acknowledgments
Thank you to the reviewers HC and WD for their constructive comments on this paper.
Conflict of interest
The authors declare that the research was conducted in the absence of any commercial or financial relationships that could be construed as a potential conflict of interest.
Publisher’s note
All claims expressed in this article are solely those of the authors and do not necessarily represent those of their affiliated organizations, or those of the publisher, the editors and the reviewers. Any product that may be evaluated in this article, or claim that may be made by its manufacturer, is not guaranteed or endorsed by the publisher.
References
Bojang, F., and Xiongqi, P. (2014). Hydrocarbon expulsion quantity of source rock, Nanpu sag, Bohai Bay Basin, China. Petroleum Sci. Technol. 32, 1690–1696. doi:10.1080/10916466.2011.572109
Chen, J. Y., Xiong, S. Q., and Bi, Y. P. (2000). Characteristics of hydrocarbon-bearing systems in fractured basins. J. Petroleum 2, 36–41+3.
Chen, X., Jiang, F. J., and Zhao, Z. X. (2020). Hydrocarbon discharge characteristics of hydrocarbon source rocks in the east third section of the Dongying Formation, Nanpu Sag, Bohai Bay Basin. Sci. Technol. Eng. 20, 5566–5574.
Cheng, D. H., Jiao, X. R., and Wang, J. W. (2022). Huang Hua was trapped in the southern castle, the ancient near the sand section of the shale oil reservoir characteristics and oil and gas significance. Rocky Reserv. 34, 70–81.
Cheng, D. S., Dou, L. R., and Wang, J. C. (2021). Evaluation of hydrocarbon source rocks and oil source analysis in the Doseo Basin, Chad. J. Geol. 95, 413–3425.
Dang, W., Zhang, J. C., Tang, X., Chen, Q., Han, S., Li, Z., et al. (2016). Shale gas potential of Lower Permian marine-continental transitional black shales in the Southern North China Basin, central China: Characterization of organic geochemistry. J. Nat. Gas Sci. Eng. 28, 639–650. doi:10.1016/j.jngse.2015.12.035
Fu, X. D., Zhang, T. F., and Wu, J. P. (2021). Characteristics and main controlling factors of tight oil reservoirs in Cretaceous Tengger Formation, A'nan Sag. Erlian Basin Petroleum Geol. Exp. 43 (1), 64–76. doi:10.11781/sysydz202101064
Gang, W. Z., Guo, Y., Gao, G., Yang, S., Jiang, C., Chen, G., et al. (2021). An integrated organic-inorganic geochemical characterization of Paleogene sediments in No.1 Structural Belt of the Nanpu Sag, Bohai Bay Basin, eastern China:implications for the origin of organic matter. Geochem. Explor. Environ. Anal. 21. doi:10.1144/geochem2019-060
Guo, S. B. (2006). Stratigraphic model of stratigraphic sequence in terrestrial fault basins. Petroleum Explor. Dev. 5, 548–552.
Guo, Y. C., Pang, X. Q., Dong, Y. X., Jiang, Z., Chen, D., and Jiang, F. (2013). Hydrocarbon generation and migration in the Nanpu Sag, Bohai Bay Basin, eastern China: Insight from basin and petroleum system modeling. J. Asian Earth Sci. 77, 140–150. doi:10.1016/j.jseaes.2013.08.033
Guo, Y. L., Liu, C. R., and Li, H. M. (2021). Effective techniques for seismic description of reservoirs in jiyang depression, Bohai Bay Basin. Petroleum Geol. Exp. 43, 121–127.
Han, S. B. A., Zhang, J. C., Yang, C., Bai, S., Huang, L., Dang, W., et al. (2016). Well log evaluation of shale gas reservoirs and preservation conditions of Lower Cambrian shale succession inCengong Block of southeast Sichuan basin, south China. J. Nat. Gas Sci. Eng. 33, 337–346. doi:10.1016/j.jngse.2016.05.019
Hou, Z. P., Pang, X. Q., Ouyang, X. C., Zhang, B., Shen, W., Guo, F., et al. (2015). Upper limit of maturity for hydrocarbon generation in carbonate source rocks in the Tarim Basin Platform, China. Arab. J. Geosci. 8, 2497–2514. doi:10.1007/s12517-014-1408-9
Hu, C. Y. (1982). Oil-bearing zones control the distribution of oil and gas fields-an effective theory for regional exploration in the terrestrial basins of eastern China. J. Petroleum 2, 9–13.
Huang, W. B., Hersi, O. S., Lu, S. F., and Deng, S. (2017). Quantitative modelling of hydrocarbon expulsion and quality grading of tight oil lacustrine source rocks:Case study of Qingshankou 1 member, central depression, Southern Songliao Basin, China. Mar. Petroleum Geol. 84, 34–48. doi:10.1016/j.marpetgeo.2017.03.021
Kang, H. Q. (2021). Controlling factors of hydrocarbon source rock development in the Madingo Formation of the Lower Congo Basin and its control on hydrocarbon formation. China Offshore Oil Gas 33, 11–24.
Li, H. Y., Jiang, Z. X., and Dong, Y. X. (2010). Formation conditions and model of ancient submerged mountains in the Nanpu No.2 formation, Jidong Oilfield. Fract. block oil gas field 17, 678–681.
Liang, X., Wu, L. L., and Li, Y. D. (2021). Oil source correlation and its relationship with deeply buried hydrocarbon accumulation in Tianjingshan Paleo-uplift area, northern segment of Western Sichuan Depression. Petroleum Geol. Exp. 43, 96–111.
Lin, T., Tan, C., and Wang, T. S. (2022). Differential hydrocarbon accumulation and its influence on the formation of gas reservoirs in the Longwangmiao Formation, central Sichuan Basin. Petroleum Explor. Dev. 44, 655–665.
Liu, W. H., Borjigin, T., Wang, X. F., Li, M., Hu, G., Wang, J., et al. (2017). New knowledge of hydrocarbon generating theory of organic matter in Chinese marine carbonates. Petroleum Explor. Dev. 44, 159–169. doi:10.1016/s1876-3804(17)30020-4
Lu, S. F., Chen, F. W., Li, J. J., Wang, W., Li, H., Cao, R., et al. (2012). Identification of the lower limit of high-quality source rocks and its relation to hydrocarbon accumulation-Taking the Beier Sag in the Hailaer Basin as an example. Pet. Sci. 9, 10–17. doi:10.1007/s12182-012-0176-y
Lu, S. F., Huang, W. B., Li, W. H., Xue, H., Xiao, D., Li, J., et al. (2017). Lower limits and grading evaluation criteria of tight oil source rocks of southern Songliao Basin, NE China. Petroleum Explor. Dev. 44, 505–512. doi:10.1016/s1876-3804(17)30058-7
Magoon, L. B., and Dow, W. G. (1994). The petroleum system-from source to trap. Oklahoma, United States: AAPG, 1–30.
Meng, Q. Q., Li, J. Z., and Liu, W. H. (2022). Simulation experiments on the effect of anthophyllite content on hydrocarbon production in mature stage shales. Spec. Reserv. 29, 113–118.
Meng, Q. Q., Qin, J. Z., and Liu, W. B. (2008). Experimental study on the hydrocarbon production characteristics of multicellular macrobenthic algae. J. Petroleum 6, 822–826.
Pan, W. L., Peng, J. N., and Zhai, C. B. (2022). Residual strata and hydrocarbon accumulation model of marine sediments in Subei Basin. Petroleum Geol. Exp. 44, 231–240.
Pang, X. Q., Zhang, T. Y., Ma, X. H., Zheng, D., Wang, W., Wang, X., et al. (2020). Hydrocarbon generation and expulsion features of the Upper Triassic Xujiahe Formation source rocks and their controlling effects on hydrocarbon accumulation in the Sichuan Basin, Central China. Geol. J. 55, 4977–4996. doi:10.1002/gj.3653
Pei, L. X., Gang, W. Z., Gao, G., Dong, Y., and Huang, Z. (2016). Petroleum origin and accumulation in the rift basin: A case study from the Nanpu sag, Bohai Bay Basin, China. Arab. J. Geosci. 9, 185. doi:10.1007/s12517-015-2248-y
Song, Y. C., Wang, E. Z., Peng, Y. T., Xing, H., Wu, K., Zheng, Y., et al. (2021). Conventional and unconventional hydrocar-bon resource potential evaluation of source rocks and reservoirs: A case study of the upper xiaganchaigou formation, western qaidam basin, northwest China. Nat. Resour. Res. 30, 4355–4377. doi:10.1007/s11053-021-09953-y
Sun, B., Tang, D., and Li, X. M. (2015). Hydrocarbon generation evolution and hydrocarbon origin of hydrocarbon source rocks in the Nanbu Depression, Bohai Bay Basin. Sci. Technol. Eng. 15, 67–73+126.
Tang, Y., He, W. H., Bai, Y. B., Zhang, X., Zhao, J., Yang, S., et al. (2021). Source rock evaluation and hydrocarbon generation model of a permian alkaline lakes-A case study of the fengcheng formation in the Mahu sag, junggar basin. MINERALS 11, 644. doi:10.3390/min11060644
Wang, E. Z., Feng, Y., Liu, G. Y., Chen, S., Wu, Z., and Li, C. (2021). Hydrocarbon source potential evaluation insight into source rocks-A case study of the first member of the Paleogene Shahejie Formati-on, Nanpu Sag, NE China. Energy Rep. 7, 32–42. doi:10.1016/j.egyr.2020.11.099
Wang, E. Z., Liu, G. Y., Pang, X. Q., Zhao, Z., Feng, Y., Wu, Z., et al. (2020). An improved hydrocarbon generation potential method for quantifying hydrocarbon generation and expulsion characteristics with application example of Paleogene Shahejie Formation, Nanpu Sag, Bohai Bay Basin. Mar. Petroleum Geol. 112, 104106. doi:10.1016/j.marpetgeo.2019.104106
Wei, X., and Sun, Y. S. (2017). Evaluation of hydrocarbon source rocks in the Dongying Formation of the Nanbu Depression and contribution of oil sources. Daqing Petroleum Geol. Dev. 36, 25–32.
Xia, L. W., Cao, J., Wang, M., Mi, J. L., and Wang, T. T. (2019). A review of carbonates as hydrocarbon source rocks:basic geochemistry and oil-gas generation. Pet. Sci. 16, 713–728. doi:10.1007/s12182-019-0343-5
Xu, D. Y., Zhou, J. Y., and Wang, H. (2010). Significance of reservoir formation indication of the hydrochemical characteristics of the Dongying Formation in the Nanpu sag, Bohai Bay Basin. Pet. Exp. Geol. 32, 285–289.
Zhang, Z. N., Wu, Y. D., Sun, L. N., Li, Y., Fu, D., Su, L., et al. (2017). The changes of hydrocarbon generation and potential in source rocks under semi-closed conditions with 50–840 bar water pressure. Petroleum Sci. Technol. 35, 1487–1494. doi:10.1080/10916466.2017.1347678
Zhao, W. Z., and Chi, Y. L. (2000). Regional distribution of hydrocarbon-bearing formations in the Bohai Bay Basin and the main controlling factors. J. Petroleum 01, 10–15+3.
Zhao, W. Z., Zou, C., and Wang, Z. C. (2004). The theory of full oil content in oil-rich depressions-implications and significance. Petroleum Explor. Dev. 2, 5–13.
Zhao, Y. D., Liu, L. F., and Zhang, Z. H. (2008). Distribution and hydrocarbon generation characteristics of hydrocarbon source rocks in the Paleozoic stratigraphic framework of the Nanbu Depression. J. Sedimentology 26, 1077–1085.
Zhou, H. M., Dong, Y. X., and Liu, Y. H. (2005). Theory and practice of oil and gas exploration in fractured basins: The case of nanbu depression in Bohai Bay Basin. Beijing: China University of Petroleum Press.
Zhu, G. Y., Wang, Z. J., and Su, J. (2013). Geochemical characteristics of high-quality hydrocarbon source rocks in the Nanpu sag of the Bohai Bay Basin, China. Oil Shale 30, 117–135. doi:10.3176/oil.2013.2.03
Keywords: TOC, hydrocarbon source rock evaluation, hydrocarbon generation potential, Nanpu Sag, Es3
Citation: Guo Q, Jiang S, Wang J, Zhou Q, Gao Y, Ye L and Yin J (2023) Prediction of hydrocarbon source rock distribution using logging curves: A case study of Es32 source rock in Nanpu Sag, Huanghua depression, Bohai Bay Basin. Front. Earth Sci. 10:1097806. doi: 10.3389/feart.2022.1097806
Received: 14 November 2022; Accepted: 02 December 2022;
Published: 25 January 2023.
Edited by:
Qingqiang Meng, SINOPEC Petroleum Exploration and Production Research Institute, ChinaReviewed by:
Han Chao, Shandong University of Science and Technology, ChinaWei Dang, Xi’an Shiyou University, China
Copyright © 2023 Guo, Jiang, Wang, Zhou, Gao, Ye and Yin. This is an open-access article distributed under the terms of the Creative Commons Attribution License (CC BY). The use, distribution or reproduction in other forums is permitted, provided the original author(s) and the copyright owner(s) are credited and that the original publication in this journal is cited, in accordance with accepted academic practice. No use, distribution or reproduction is permitted which does not comply with these terms.
*Correspondence: Shan Jiang, 18389360@qq.com