Tropical cyclone wind hazard assessment for Donghaitang wind farm (Zhejiang Province, China): Case study
 Yuhui Li
 Shengming Tang
 Yongping Li1
  Hui Yu
- 1Shanghai Typhoon Institute of China Meteorological Administration, Shanghai, China
- 2State Key Laboratory of Mountain Bridge and Tunnel Engineering, Chongqing Jiaotong University, Chongqing, China
- 3National Climate Center, China Meteorological Administration, Beijing, China
Currently, offshore and coastal wind power resources are growing rapidly around the world, especially in China. However, systematic research on the hazard assessment of wind farms under tropical cyclone conditions remains lacking. This study simulated the wind field of tropical cyclones based on a parameterized tropical cyclone wind field model, and analyzed the characteristics of historical tropical cyclones in Donghaitang wind farm (Zhejiang, China). Four extreme tropical cyclone hazard factors including the maximum wind speed (Vmax), maximum duration of wind direction change (Tmax), maximum cumulative wind direction change (Δθmax) and maximum rate of change in wind direction (ΔDmax) were proposed and examined. Then a comprehensive hazard assessment model for wind farms based on the analytic hierarchy process was established, and the risk to the Donghaitang wind farm represented by tropical cyclones during 1949–2021 was evaluated. Results showed that the number and intensity of tropical cyclones made landfall near the coast of Donghaitang wind farm gradually increased with time, which results in a gradual increase in the composite tropical cyclone risk level of the Donghaitang wind farm with time. The numbers and risk levels of tropical cyclones traveling northwestward were much larger than those traveling northward or northeastward. Moreover, the average composite risk index for tropical cyclones passing to the left of the wind farm was 14.3% higher than that for tropical cyclones passing to the right. The large values of Vmax and ΔDmax are main reasons for the high risk of the wind farm, while the other two hazard factors (Tmax, Δθmax) proposed to account for the wind turbine backup power are also of great importance in the design, selection and operation stages of offshore wind turbines. The findings of this study could provide support for hazard assessment of offshore and coastal wind farms exposed to tropical cyclones, including macro site selection of wind farms and type selection of wind turbines.
1 Introduction
As global demand for low-cost clean energy continues to grow, wind power has the potential to become one of the major energy technologies supporting global economic development in the future, owing to its wide range of resources, zero-cost fuel, and minimal environmental impact (Veers et al., 2019). Currently, the total global wind power capacity has reached 837 GW, and 21.1 GW of offshore wind power capacity was installed in 2021, making it the best year for offshore wind power development. In 2021, the offshore wind capacity in China accounted for 80% of new offshore wind power capacity worldwide and increased its cumulative offshore wind power installations to 27.7 GW (GWEC, 2022a). In the 14th Five-Year Plan, China’s government stated: “We will vigorously expand the scale of wind power and develop offshore wind power in an orderly manner, and focus on building offshore wind power bases along the southeast coast of China” (NEA, 2022). However, the southeast coast of China is one of the areas of the world affected most frequently by tropical cyclones. According to an analysis by the China Meteorological Administration, 658 tropical cyclones made landfall in China during 1949–2021, with an average of 9 tropical cyclones making landfall each year (Lu et al., 2021). The extreme wind speeds, violent changes in wind direction, and excessive intensity of turbulence during the passage of tropical cyclones can have a substantial impact on the structural safety of wind turbine units in offshore wind farms, and represent the main causes of damage to wind turbine units (Chen et al., 2015; Li et al., 2022). Therefore, the risk posed to wind turbine units by tropical cyclones should be assessed with regard to the future development of offshore wind power resources.
Many studies have performed hazard assessments for wind farms in regions prone to the influence of tropical cyclones. Rose et al. (2013) simulated the wind field of wind farms off the US coast using the Coupled Hurricane Intensity Prediction System developed by Emanuel et al. (2004) and quantified the risk from hurricanes to offshore wind farms through damage to the functionality of wind turbines. They highlighted that 10% of offshore wind turbines could be shut down simultaneously owing to hurricane damage and that 6% of offshore wind turbines might be destroyed within 10 years Kim and Manuel (2016) developed a model of tropical cyclone intensity evolution and simulated the wind field of wind farms. They performed hazard assessment for wind turbines by analyzing the load distribution and the wind speed exceedance probability distribution for individual turbines. Sheng and Hong (2021) developed a comprehensive database and a database-driven simulation program to assess the vulnerability and reliability of offshore wind farms to tropical cyclone hazards. They found that the failure probability of the OC4 DeepCwind turbine was greater than the design-code-recommended value, which indicates a very high tropical cyclone risk for that model of turbine. Mattu et al. (2022) proposed a method for studying the impact of tropical cyclones on four offshore wind farms in the Gulf of Mexico using high-resolution reanalysis meteorological data. They identified that all four wind farms have reasonable wind energy potential, but that the Gulf of Mexico has a high probability of wind speeds >50 m s−1 under tropical cyclone conditions, representing a high tropical-cyclone-related risk for wind farm constructions. In addition, many scholars have conducted hazard assessment of wind turbines using decision making methods such as failure modes and effect analysis (FMEA), support vector machine (SVM), and fault tree analysis (FTA) with certain results (Pantelis et al., 2012; Sinha and Steel, 2015; Zhang et al., 2016; Kang et al., 2017, 2020). However, among these methods, the FMEA method focuses on individual turbine equipment and requires that all failure modes of the turbine must be known before the evaluation, otherwise the evaluation results will be wrong, but the damage caused by tropical cyclones to the turbine structure is not deterministic. SVM requires high data integrity and usually only supports binary classification. FTA is usually used to analyze the cause of the accident after the accident, which is not suitable for the analysis of the risk source, and the steps of FTA compiling fault tree are numerous and the calculation process is complicated. In contrast, a systematic assessment method can more intuitively reflect the hierarchical relationship between tropical cyclone hazard factors.
The analytic hierarchy process (AHP) is a systematic multicriteria decision-making method for quantitative analysis of qualitative problems, which has been used widely in the field of wind power. Many earlier related studies have used a geographical information system to select areas suitable for a wind farm and then used AHP to undertake a comprehensive assessment of the proposed areas to finally select the optimal wind farm location (Tahri et al., 2015; Sánchez-Lozano et al., 2016; Chaouachi et al., 2017; Vasileiou et al., 2017; Vagiona and Kamilakis, 2018; Díaz and Soares, 2021; Kim et al., 2021; Gkeka-Serpetsidaki and Tsoutsos, 2022). In terms of hazard assessment, Jiao et al. (2020) adopted the AHP method to identify and assess the meteorological risks for offshore wind farms by considering hazard factors such as maximum wind speed of tropical cyclones, lightning, temperature extremes, salt fog, and marine hazards. Notably, only one hazard factor (i.e., the maximum wind speed of tropical cyclones) related to tropical cyclones was considered in their assessment process. Liu et al. (2021) used AHP and a fuzzy comprehensive evaluation method to establish a comprehensive risk evaluation system for an offshore wind farm in the South China Sea, which considered hazard factors such as the wind power equipment, meteorological environment, and hydrodynamic environment of the surrounding sea. However, consideration of the extreme hazard factor of tropical cyclones was not included as part of the meteorological environment in their risk evaluation system. Bepary and Kabir (2022) used the fuzzy AHP (FAHP) to assess various human-induced risks and surrounding environmental risks during the transportation, construction, operation, and maintenance phases of wind turbines, but the hazard factor of tropical cyclones was still not taken into account in any of the phases. The above studies demonstrated the applicability of AHP in wind power projects and provided a clear and intuitive picture of the risks posed by different extreme hazard factors for wind farm hazard assessment. For wind turbines, there are a number of hazard factors that can affect their structural safety during the passage of a tropical cyclone, and different hazard factors have different degrees of influence on the safety of the turbine and therefore different weightings in terms of hazard assessment. However, generally, none or only one tropical cyclone hazard factor—the maximum wind speed of a tropical cyclone—has been considered in historical studies, indicating lack of research on tropical cyclone hazard assessment for wind farms.
By reviewing Chinese and international wind turbine design standards, and through comparison of historical studies on tropical cyclone hazard assessment for offshore wind farms (Table 1), it was found that the tropical cyclone hazard factors in the current tropical cyclone hazard assessment for coastal and offshore wind turbines are not comprehensive enough and do not consider multiple tropical cyclone hazard factors and their ranking relationships, nor do they consider the impact of tropical cyclones on wind farms on different tracks. In this study, the tropical-cyclone-affected wind field in the area of a Chinese coastal wind farm during the past 72 years was numerically simulated using a parameterized tropical cyclone wind field model. Four extreme hazard factors of tropical cyclones were proposed, and three tracks of historical tropical cyclones in the wind farm were divided. Then, a comprehensive tropical cyclone hazard assessment model based on the AHP method for wind farms was proposed, and the risk levels represented by different extreme hazard factors associated with historical tropical cyclones with different tracks were analyzed.
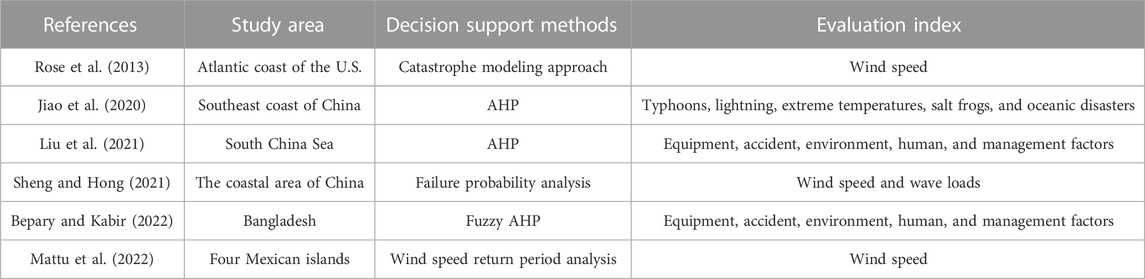
TABLE 1. Comparison of historical researches on different tropical cyclone disaster assessment methods for offshore wind farms.
The remainder of this paper is structured as follows. Section 2 introduces the study area, the data used, and the research methodology adopted. Section 3 analyzes the characteristics of historical typhoons that have affected the selected study area. Section 4 examines four tropical-cyclone-related extreme hazard factors used to build the tropical cyclone hazard assessment framework for wind farms. Section 5 first presents the calculation of the weights for all indicators in the hazard assessment model, and then analyzes the hazard assessment results of historical typhoons for the selected Donghaitang wind farm. Finally, the derived conclusions are presented in Section 6.
2 Study area, data, and methodology
2.1 Study area
Donghaitang, located in the eastern part of Wenling City in the southern corner of Taizhou Bay (Zhejiang Province, China), is situated in the southeast coastal wind energy zone, which is a temperate and subtropical humid climatic zone (Figure 1). The wind farm is mainly distributed along the coastline from northwest to southeast with length of about 5 km, width of about 2 km, and elevation of less than 3.8 m. Donghaitang wind farm is located in an area with an obvious monsoon climate, large temperature and pressure gradients between the sea and the land, obvious sea and land winds, and rich wind energy resources. Its wind energy development and utilization potential are vast, and it is the richest area of wind energy resources in Zhejiang Province. Phase I of the Donghaitang wind farm, built in 2009, comprises 20 wind turbines in a row with hub height of 80 m and blade length of over 39 m. The individual power of each turbine is 2 MW. According to the wind turbine generator system under typhoon conditions (GB/T 31519-2015, 2015), when conducting hazard assessment of coastal and offshore wind farms in typhoon-affected areas, the hazard assessment area should be determined according to the statistical characteristics of the radius of the maximum wind speed (or eyewall area) of tropical cyclones in the area where the coastal or offshore wind farms are located. According to probability statistics of multiple tropical cyclones, the radius of the eye wall area of a tropical cyclone is generally between 50 and 100 km, while the radius of the outer wind area of a tropical cyclone that meets the operating conditions of wind turbines is generally between 130 and 500 km (GB/T 38957-2020, 2020). To increase the sample of tropical cyclone data to improve the accuracy of the calculation of the extreme hazard factors, and to ensure the accuracy of the hazard assessment results, this study extended the statistical radius to 150 km from the wind farm.
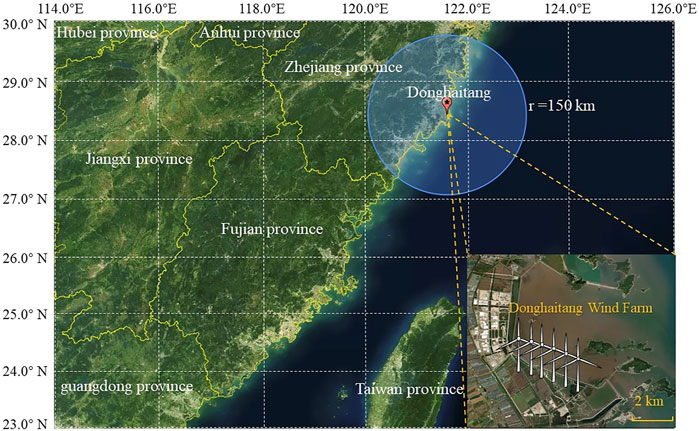
FIGURE 1. Study area of the Donghaitang wind farm.
2.2 Data information
The tropical cyclone data information used in this study comprised two main parts. The first part of the data consisted of historical tropical cyclone best-track information from 1949 to 2021 obtained from the Tropical Cyclone Information Center of the China Meteorological Administration (http://typhoon.org.cn). Because of the greater number of observations available for analysis, the tropical cyclone database of China Meteorological Administration is believed to be more accurate and complete over the offshore and land areas of China than the datasets from other agencies (Ying et al., 2014). The second part of the data comprised simulated wind field data of historical tropical cyclones from 1949 to 2021 at the Donghaitang wind farm, obtained from simulations using a parametric typhoon wind field model. The wind field model used in this study was the improved parametric wind field model based on the CE (U.S. Army Corps of Engineers) wind field model proposed by the Shanghai Typhoon Research Institute of the China Meteorological Administration (Fang et al., 2020) (see Appendix A for details). As it directly solves the non-linear momentum equation and makes no simplification to each term, the CE wind field model has higher calculation accuracy compared with the Shapiro, Yan Meng, and Vickery models (Shapiro, 1983; Meng et al., 1995; Thompson and Cardone, 1996; Vickery et al., 2000). Besides, the CE wind field model can better describe the wind field structure of asymmetric typhoons. The hourly tropical cyclone wind field data with a horizontal resolution of 2 km, including horizontal wind speed, wind direction, and latitude/longitude of the tropical cyclone center were obtained from the simulation results. As reported by Fang et al. (2020), the simulated wind fields are comparable with those observed within a range of 250 km from the typhoon center. In particular, they are highly reliable within 150 km from the typhoon center of a strong typhoon.
2.3 Analytic hierarchy process
The analytic hierarchy process (AHP) methodology was proposed by Saaty and Kearns (1985) in 1985. The AHP stratifies the indicators involved in an assessment by structuring a multilevel analytical structural model of the assessment factors and the interrelationships between them to organize the system of indicators in an orderly manner for assessment purposes. Owing to its simplicity and generality, as well as its higher level of accuracy, the AHP is one of the most widely used multicriteria decision-making techniques globally (Khaira and Dwivedi, 2018). The method consists of steps such as constructing a judgment matrix, hierarchical single ranking, and consistency testing.
The first step is to stratify the target problem, and then to analyze the weighting of importance of the constituent elements in each level to the previous level. The weight values are mainly obtained through data quantification, using the scale values of relative importance of each indicator given in Table 2, and then scored by experts by comparing the importance between pairs of indicators, thereby constructing a comparative judgment matrix, as shown in Eq. 1, where aij is the relative importance according to criteria ai relative to criteria aj (Saaty and Kearns, 1985; Saaty, 1990):
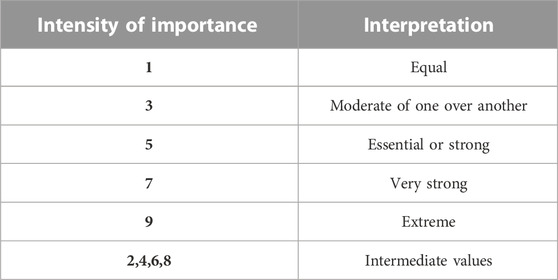
TABLE 2. Relative importance values in AHP (from Tables 3-4 of Saaty and Kearns (1985))
After construction of the comparative matrix, the weights of each indicator can be calculated by computing the eigenvectors associated with the maximum eigenvalues of the matrix:
where CI is the consistency index, n is the matrix size, λmax is the maximum eigenvalue of the judgment matrix, and RI is the random consistency index, the value of which is related to the order of the judgment matrix, as shown in Table 3. When CR < 0.10, the results of the comparison judgment matrix are considered to have satisfactory consistency; otherwise, the judgment matrix should be reconstructed until CR < 0.10 (Saaty and Kearns, 1985).

TABLE 3. Saaty’s random index values (RI) (Saaty and Kearns, 1985).
After calculating the weights for each level of the hierarchy (primary and secondary indicators), the final weight value of each indicator can be calculated by multiplying the sequence of relative weight matrices for each level of the hierarchy. The final weight value (wjg) of secondary indicator j is its weight value multiplied by the corresponding primary indicator weight value:
where wjg is the final weight of the jth secondary indicator under primary indicator gth, wg is the primary weight value of indicator gth, and wj(g) is the jth secondary weight value of the gth indicator.
Finally, the sum of the final weights of each indicator of the ith tropical cyclone and the product of the corresponding physical indicator is defined as the composite risk index Ri for the ith tropical cyclone:
where Xij denotes the normalized value of the ith sample of the jth indicator.
2.4 Workflow of this study
Figure 2 shows the workflow of this study. As shown in Figure 2, this paper firstly extracted the historical tropical cyclone best-track data within 150 km of the Donghaitang wind farm. Then the historical tropical cyclone wind field was simulated by the improved CE wind field model. Based on the simulated wind fields, three tracks of historical tropical cyclones were classified, and the characteristic distributions of historical tropical cyclones on different tracks were analyzed. Meanwhile, four hazard factors were proposed and analyzed by combining the working conditions of wind turbines under the influence of tropical cyclones. Finally, a comprehensive hazard assessment model for wind farms under tropical cyclone conditions was established using AHP, and the risk levels of wind farms represented by historical tropical cyclones with different tracks were evaluated based on this model. In addition, this paper also counted the annual maximum wind speed of wind farms, calculated the 50-year maximum wind speed of wind farms, and suggested the selection of wind turbines.
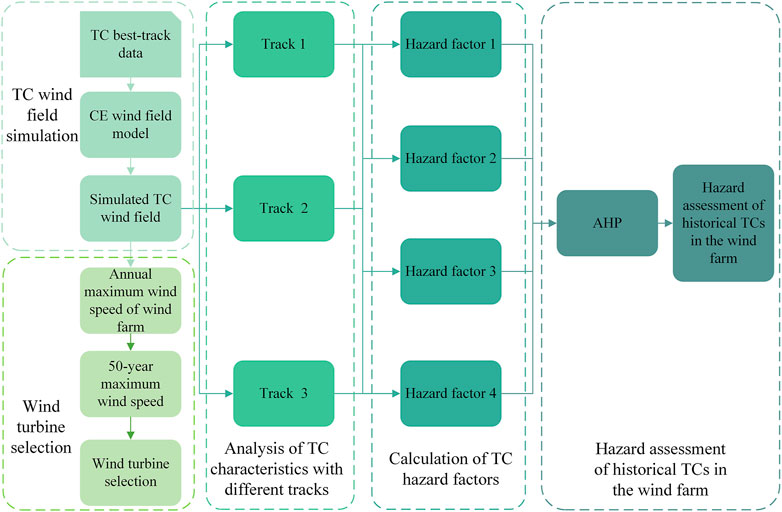
FIGURE 2. Workflow of this study.
3 Analysis of characteristics of historical tropical cyclones in the region of the wind farm
3.1 Track
In this study, we took tropical cyclones with the highest intensity above tropical storm level (maximum wind speed near the center of >17.2 m s−1) during their entire lifetime as the study sample (GB/T 19201-2006, 2006). Using the tropical cyclone best-track information provided by the Tropical Cyclone Information Centre of the China Meteorological Administration, 64 tropical cyclones classified as tropical storms or above were recorded within 150 km of the Donghaitang wind farm area during 1949–2021. To investigate the effects of tropical cyclones with different tracks of movement, a circle with a radius of 150 km is drawn around the wind farm. The intersection point of the track and the circle is the starting point when the tropical cyclone enters the circle and the end point when it leaves the circle. The influence of the tropical cyclone track outside the circle on the wind farm is not considered. The wind farm is the origin of the coordinate axis, and the north direction is the y-axis. When the starting point of the tropical cyclone track is located at 165°–195° and the ending point is located at 345°–15°, the tropical cyclone is considered to be moving from south to north; When the starting point of the tropical cyclone track is 105°–165° and the ending point is 285°–345°, the tropical cyclone is considered to be from southeast to northwest; When the starting point of the tropical cyclone track is 195°–255° and the ending point is 15°–75°, the tropical cyclone is considered to be from southwest to northeast; when the starting point of the tropical cyclone track is 75°–105° and the ending point is 255°–285°, the tropical cyclone is considered to be moving from east to west. Based on this, the historical tropical cyclones of Donghaitang wind farm can be divided into three moving tracks from south to north, from southeast to northwest, and from southwest to northeast. The tropical cyclones were then further classified into leftward and rightward tropical cyclones with respect to the location of the wind farm to investigate the risk level of wind farms located in different quadrants relative to the forward direction of the tropical cyclones.
The best-track positions and intensities for all tropical cyclones and those moving northward, northwestward, and northeastward passing within 150 km of the location of the Donghaitang wind farm during 1949–2021 are shown in Figure 3. The number of tropical cyclones traveling from southeast to northwest was highest, i.e., approximately twice as many as those moving in the other two directions of travel, and their intensity was relatively strong, with 74.2% of tropical cyclones reaching a maximum intensity of typhoon or higher throughout their lifetime. Additionally, tropical cyclones traveling from south to north and from southeast to northwest broadly remained above strong tropical storm intensity as they passed through the area of the Donghaitang wind farm (Figure 3C, Figure 3B), with some tropical cyclones traveling from southeast to northwest reaching super typhoon intensity. The intensity of most of the tropical cyclones moving from southwest to northeast diminished to tropical depression level by the time they passed the wind farm area (Figure 3D).
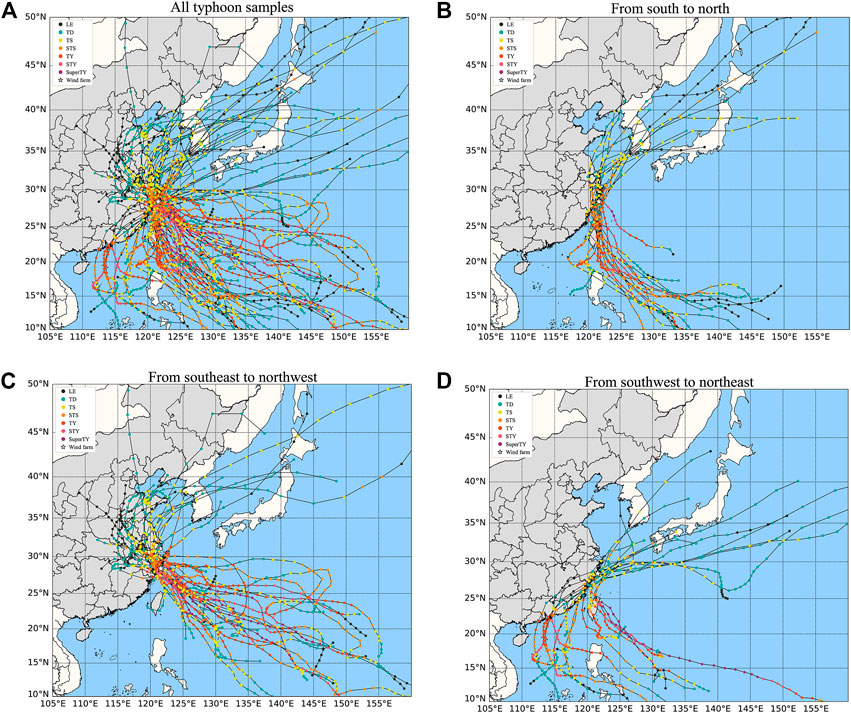
FIGURE 3. Best-track positions and intensities for (A) all tropical cyclones and those moving (B) northward, (C) northwestward, and (D) northeastward within 150 km of the area of the Donghaitang wind farm during 1949–2021. The numbers of tropical cyclones in panels (A)–(B) are 64, 17, 31, and 16, respectively. Different colors represent different intensity levels: black for low eddy (LE: ≤10.7 m s−1), green for tropical depression (TD: 10.8–17.1 m s−1), yellow for tropical storm (TS: 17.2–24.4 m s−1), orange for severe tropical storm (STS: 24.5–32.6 m s−1), red for typhoon (TY: 32.7–41.4 m s−1), pink for severe typhoon (STY: 41.5–50.9 m s−1), and purple for super typhoon (Super TY: ≥51 m s−1). The time interval between two adjacent points is 6 h, and the white star marks the location of the Donghaitang wind farm.
3.2 Distribution of tropical cyclone features
The annual and monthly frequency distributions of historical tropical cyclones that affected the Donghaitang wind farm area during 1949–2021 are shown in Figure 4. The annual frequency of tropical cyclones that affected the Donghaitang wind farm area has increased slowly during 1949–2021 (Figure 4A), with the annual average number of tropical cyclones increasing from approximately 0.7 in 1949 to 1 in 2021, consistent with the findings reported by Liu and Wang (2020). As shown in Figure 4B, the monthly variation is unimodal with tropical cyclones mainly occurring during May–November, with July–September being the most active period reaching a monthly peak in August.
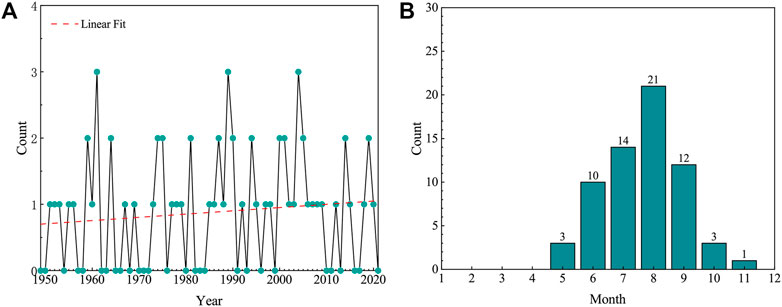
FIGURE 4. (A) Annual and (B) monthly frequency distributions of historical tropical cyclones affecting the Donghaitang wind farm area. The red dashed line in (A) denotes the linear fit of the annual frequency.
The locations and wind speed distributions for all tropical cyclones and those moving northward, northwestward, and northeastward and affecting the Donghaitang wind farm area during 1949–2021 are shown in Figure 5, the results of which were calculated based on interpolation of the parametric wind field model. Of the 64 tropical cyclones that passed within 150 km of the wind farm area, 79.68% of them caused maximum wind speeds of <25 m s−1 during the time of their impact on the wind farm, while the remaining 20.32% had wind speeds of >25 m s−1, of which 13.8% of those had wind speeds of >37.2 m s−1 (Figure 5A). Among the three directions of travel, tropical cyclones traveling from southeast to northwest had the highest intensity of maximum wind speeds, with 38.71% of tropical cyclones causing maximum wind speeds of >25 m s−1, of which 33.3% had maximum winds of >37.2 m s−1. Followed were traveling from south to north, nearly half of the tropical cyclones with maximum wind speeds of >17.2 m s−1. Tropical cyclones traveling from southwest to northeast created the lowest maximum wind speeds in the wind farm area, i.e., all <25 m s−1, with 93% of them causing maximum wind speeds of <17.2 m s−1 in the wind farm area (Figures 5B–D). In addition, the maximum wind speeds in the area of the wind farm caused by tropical cyclones with a center passing to the left side of the Donghaitang wind farm area were significantly greater than those of tropical cyclones with a center passing to the right (Figure 5B and Figure 4C). This is mainly because when the center of a tropical cyclone passes to the left of the wind farm area, the wind farm is exposed to an inshore wind that is less affected by topography; when the center of a tropical cyclone passes to the right of the wind farm area, the wind farm is exposed to offshore wind, which is more influenced by terrain that reduces the wind speed.
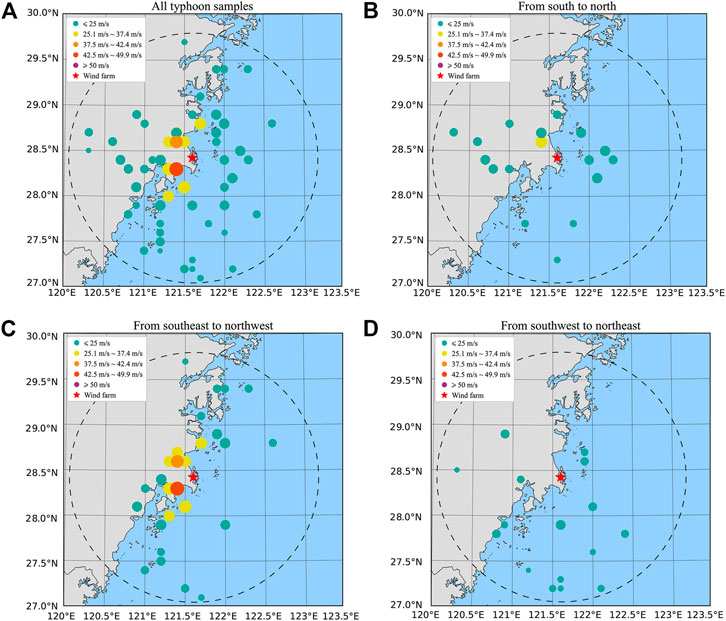
FIGURE 5. Locations and wind speed distributions for (A) all tropical cyclones and those moving (B) northward, (C) northwestward, and (D) northeastward and affecting the Donghaitang wind farm area during 1949–2021. Black dotted circle indicates the 150 km research area around the wind farm. The bubble distribution shows the center location of each tropical cyclone when it caused the maximum wind speed in the area of the Donghaitang wind farm; different colors represent different wind speeds caused by the tropical cyclones in the wind farm area, and larger bubble diameters indicate a greater maximum wind speed of the tropical cyclone. The red star marks the location of the Donghaitang wind farm.
We define the time that a tropical cyclone (above tropical storm level, i.e., maximum wind speed near the center of >17.2 m s−1 during its entire lifetime) (GB/T 19201-2006, 2006) is within the 150 km range of the Donghaitang wind farm as the duration of impact of the tropical cyclone on the wind farm. The time at which the tropical cyclone center moves within 150 km of the wind farm is defined as the starting point, and the time at which the tropical cyclone center moves beyond 150 km of the wind farm is defined as the endpoint. Calculating the time from the starting point to the endpoint provides the duration of the impact of the tropical cyclone on the wind farm. The time duration frequency distributions for all tropical cyclones and those moving northward, northwestward, and northeastward and affecting the Donghaitang wind farm area are shown in Figure 6. The duration of the impact of the tropical cyclones on the Donghaitang wind farm was mainly 0–24 h (Figure 6A). The duration over which the largest number of tropical cyclones affected the Donghaitang wind farm was 0–2 h, accounting for 35.9% of the total. In terms of cumulative frequency, nearly 80% of tropical cyclones had impact that persisted for <10 h, and 90.6% had impact that persisted for <14 h. Of the tropical cyclones traveling from south to north, 88.2% had a duration of the impact of <10 h (Figure 6B). The number of tropical cyclones whose center passed to the left of the wind farm was five more than the number of tropical cyclones whose center passed to the right, and the duration of the impact of the tropical cyclones traveling to the left was approximately twice that of those traveling to the right. Of the tropical cyclones traveling from southeast to northwest, the duration of the impact of 87.1% was within 14 h (Figure 6C). The number of tropical cyclones whose center passed to the left of the wind farm was three more than the number of tropical cyclones whose center passed to the right, and the duration of the impact of the tropical cyclones traveling to the left was approximately 1.1 times longer than that of the tropical cyclones traveling to the right. Of the tropical cyclones traveling from southwest to northeast, 81.3% had duration of the impact of 0–2 h (Figure 6D). The number of tropical cyclones whose center passed to the right of the wind farm was eight more than the number of tropical cyclones whose center passed to the left, and the duration of the impact of the tropical cyclones traveling to the right was approximately 2.3 times longer than that of the tropical cyclones traveling to the left.
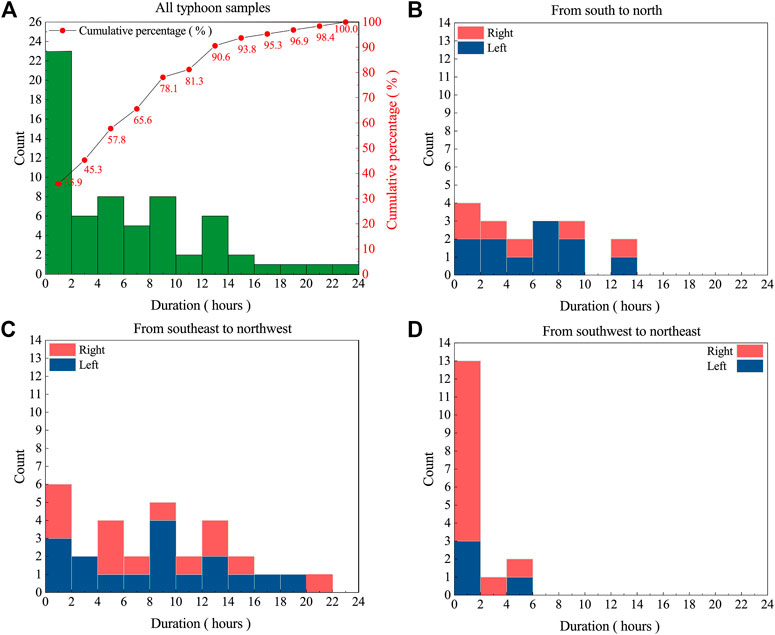
FIGURE 6. Duration frequency distribution for (A) all tropical cyclones and those moving (B) northward, (C) northwestward, and (D) northeastward and affecting the area of the Donghaitang wind farm. The orange (blue) color represents the frequency of tropical cyclones whose center passed to the right (left) of the wind farm.
The above shows that the duration of the impact of historical tropical cyclones that affected the area of the Donghaitang wind farm was mainly within 14 h and that the overall duration of the impact of the tropical cyclones whose center passed to the left of the wind farm was greater than that of the tropical cyclones whose center passed to the right, i.e., approximately 1.2 times longer.
4 Hazard factors of tropical cyclones
4.1 Selection of extreme hazard factors
Extreme wind speeds and violent changes in wind direction during tropical cyclones are the main causative factors of damage to wind farms. The strong vibrations and heavy wind loadings caused by extreme wind speeds can cause severe damage to wind turbines and have an impact on wind power grids, while violent changes in wind direction can have a strong impact on the aerodynamic forces caused by the wake interaction between blades and towers (Wang et al., 2015; Tang et al., 2020). In previous studies, the impact of the reserve power supply on the yaw system was usually neglected, especially when the power supply system broke down during the impact of tropical cyclones (Li et al., 2013; Kim and Manuel, 2014; Qian et al., 2021). If the power supply is insufficient, the yaw system will not work properly, which poses a major threat to the structural safety of wind turbines. In this study, by summarizing Chinese and international wind turbine design standards, and following review of previous studies on tropical cyclone hazard assessment in relation to wind farms, four extreme tropical cyclone hazard factors were adopted as primary indicators for tropical cyclone risk: maximum wind speed (Vmax), maximum duration of wind direction change (Tmax), maximum cumulative wind direction change (Δθmax), and maximum rate of change in wind direction (ΔDmax).
4.2 Maximum wind speed (Vmax)
External wind conditions are an important factor in determining wind turbine loads. The transit of tropical cyclones is often accompanied by extreme wind speeds, which can pose a considerable threat to the structural integrity of wind turbines and the safety of wind power grids. We defined the maximum wind speed at hub height in the wind farm area, caused by a tropical cyclone during its movement within the range of 150 km of the Donghaitang wind farm, as the maximum wind speed of that tropical cyclone. According to the “Typhoon type wind turbine” standards (GB/T 31519-2015, 2015), wind speed thresholds of 25, 37.5, 42.5, and 50 m s−1 are recommended to be adopted, and the maximum wind speed should be divided into five wind speed intervals as secondary indicators under the maximum wind speed index. The frequency distribution of maximum wind speed at hub height (Vmax), and the time series of annual maximum wind speed for the Donghaitang wind farm under tropical cyclone conditions during 1949–2021, obtained from the parametric wind field model, are shown in Figures 7A, B, respectively. A year with zero annual maximum wind speed means that no tropical cyclones passed within 150 km of the wind farm area in that year. During the study period, 64 tropical cyclones affected the Donghaitang wind farm area, of which 60.94% had maximum wind speeds of 5–25 m s−1 at hub height, and 39.07% had wind speeds that exceeded the wind turbine cutout speed (25 m s−1) at hub height, with a maximum wind speed of 56.42 m s−1 (Figure 7A). The annual maximum wind speed at the Donghaitang wind farm shows a clear upward trend during 1949–2021, with the annual average wind speed value increasing from 7.5 m s−1 in 1949 to 16 m s−1 in 2021 (Figure 7B). The Donghaitang wind farm is clearly located in an area rich in wind resources but one that also has high risk of tropical cyclones. Selection of a suitable wind turbine rating is therefore essential for the further development of the Donghaitang wind farm.
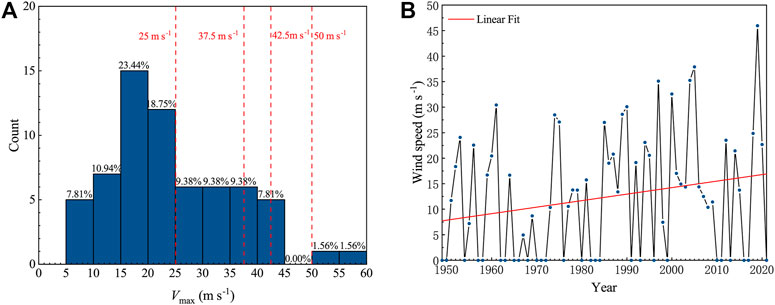
FIGURE 7. (A) Frequency distribution of maximum wind speed at hub height (Vmax) and (B) time series of annual maximum wind speed at the Donghaitang wind farm under tropical cyclone conditions during 1949–2021. Orange dashed lines in (A) represent threshold cutoffs of 25, 37.5, 42.5, and 50 m s−1; red line in (B) represents the linear fit of the annual maximum wind speed.
The International Electrical Commission (IEC) 61400-1: Wind turbines part 1: Design requirements (IEC 61400-1, 2019) clearly states that the extreme wind speed value with 50-year recurrence is one of the key indicators for the ultimate loading of a wind turbine, and should form the basis for the selection and economic evaluation of wind turbine models in the development of wind power projects. There are various methods for calculating the extreme wind speed value with 50-year recurrence, but the methods used most commonly internationally are the Gumbel distribution, Weibull distribution, Poisson–Gumbel distribution, and Generalized Pareto Distribution. In comparison with other extreme value distributions, the Gumbel distribution has higher accuracy, better reliability, and greater applicability, and it has been used more widely both in China and in other areas of the world (Lee et al., 2012; Yao et al., 2018; Sarkar et al., 2019; Yan et al., 2020). Therefore, the Gumbel distribution was used in this study to calculate the extreme wind speed value with 50-year recurrence for the Donghaitang wind farm. The expression of the Gumbel distribution function is as follows:
where a is the scale parameter and b is the position parameter. The parameter estimates are calculated using the method of moments used in the specification.
The maximum wind speed for a Gumbel distribution with a return period of T is calculated as shown in Eq. 7:
The maximum value of the annual wind speed was taken as the annual maximum wind speed for that year (Figure 7B), and for years when the annual maximum wind speed was lower than the minimum wind speed of 17.2 m s−1 for tropical storms and in years when there were no tropical cyclones, the minimum wind speed of 17.2 m s−1 for tropical storms was taken as the annual maximum wind speed for that year. Thus, we obtained the annual maximum wind speed series for the Donghaitang wind farm during 1949–2021. Equations (6) and (7) were used to calculate the extreme wind speed value with 50-year recurrence at the Donghaitang wind farm as 43.6 m s−1 and, according to IEC 61400-1 (IEC 61400-1, 2019), it is recommended that wind turbines of Type Ⅰ should be used at the Donghaitang wind farm. The wind turbine currently used at the Donghaitang wind farm is the Vestas V80-2000, which has a 10-min average reference wind speed at hub height (Vref) of 42.5 m s−1, i.e., slightly less than 43.6 m s−1; therefore, this turbine type does not meet the specification requirements. This is probably because the Donghaitang wind farm was built in 2009 and because the annual maximum wind speeds in the area of the Donghaitang wind farm are generally increasing over time.
4.3 Maximum duration of wind direction change (Tmax)
The yaw system of a wind turbine, which is an important tool for coping with extreme wind changes during the impact of a tropical cyclone, is an important safeguard for the structural integrity of the wind turbine when the wind speed of a tropical cyclone exceeds the turbine cutout wind speed (25 m s−1). The extreme wind speeds of tropical cyclones can cause severe damage to turbines and affect the wind farm grid. If the wind farm grid becomes disconnected, the yaw system of the wind turbine will need to rely on the backup power supply to operate. A long duration of wind direction change might cause the diesel generator of the backup power supply to run out of fuel and battery power, resulting in failure of the yaw system. The yaw system of a large wind turbine is designed to operate under the following conditions: average angle of change between the free stream and the nacelle (yaw error) of >8° within 30 s, and average wind speed of >2.5 m s−1 within 5 min. When the average yaw error is less than the specified value, the yaw control system of the wind turbine will not start working (Zhao et al., 2022). In this study, the maximum duration of wind direction change (Tmax) was defined as a cumulative duration of the 10-min average wind direction change when the 10-min average wind speed at hub height was >25 m s−1. Because the yaw system of a large wind turbine only starts working when the wind direction change is >8°, it is noteworthy that the calculation of Tmax is started only when the cumulative change of 10-min average wind direction exceeds this threshold. Of the 64 tropical cyclones that passed within 150 km of the Donghaitang wind farm, 25 met these requirements. According to IEC 61400-1 and GB/T 31519, it is important to ensure that the yaw system has uninterrupted yaw regulation capability for at least 6 h after loss of power to the wind farm grid (GB/T 31519-2015, 2015; IEC 61400-1, 2019). Therefore, we divided all the samples into four categories with a step length of 3 h, and thresholds of 360, 540, and 720 min, which represent secondary indicators under this index.
The frequency distribution of the maximum duration of wind direction changes at hub height under the influence of tropical cyclones (Tmax), and the best-track positions/intensities and temporal variations of wind speed and wind direction for tropical cyclones Mary (1974), Hope (1974), and Matsa (2005) are shown in Figure 8. This figure shows that 52% of the Tmax values are concentrated between 200 and 400 min, and that eight of the tropical cyclones had a Tmax value of between 200 and 300 min (Figure 8A). The largest Tmax value occurred during tropical cyclone Mary in 1974, which affected the Donghaitang wind farm area for 770 min tropical cyclone Mary reached its maximum intensity rating of typhoon level when it passed over the wind farm area (Figures 8B, C). During this period of influence, the overall trend of the wind speed was one of increase and then decrease, and the overall change in wind direction was moderate. For example, the wind speed increased to >25 m s−1 at 11:30 on August 19, and the cumulative 10-min mean wind direction change was >8° at 13:10. Therefore, 13:10 on August 19 was the start of Tmax for tropical cyclone Mary, which peaked at 38.73 m s−1 at 19:00 on August 19, and then dropped to <25 m s−1 at 02:00 on August 20, marking the end of Tmax. The maximum duration of wind changes at 80 m height in the Donghaitang wind farm area during the impact of tropical cyclone Mary was calculated as 770 min. Similarly, the best-track and wind speed/direction profiles for tropical cyclones Hope and Matsa are shown in Figures 8D–G. Both tropical cyclones reached their maximum intensity of above typhoon strength as they passed through the area of the Donghaitang wind farm. The overall wind speed trend of both tropical cyclones was one of increase and then decrease, with the wind speed of tropical cyclone Hope peaking at 38.89 m s−1 at 17:00 on July 20, and that of tropical cyclone Matsa peaking at 36.15 m s−1 at 22:40 on August 5. Both tropical cyclones had the same Tmax of 560 min. The Tmax of the Donghaitang wind farm is mainly concentrated within 600 min. Historically, seven tropical cyclones had a Tmax of 6 h or more, including three with a Tmax of 9 h or more and one with a Tmax of >12 h.
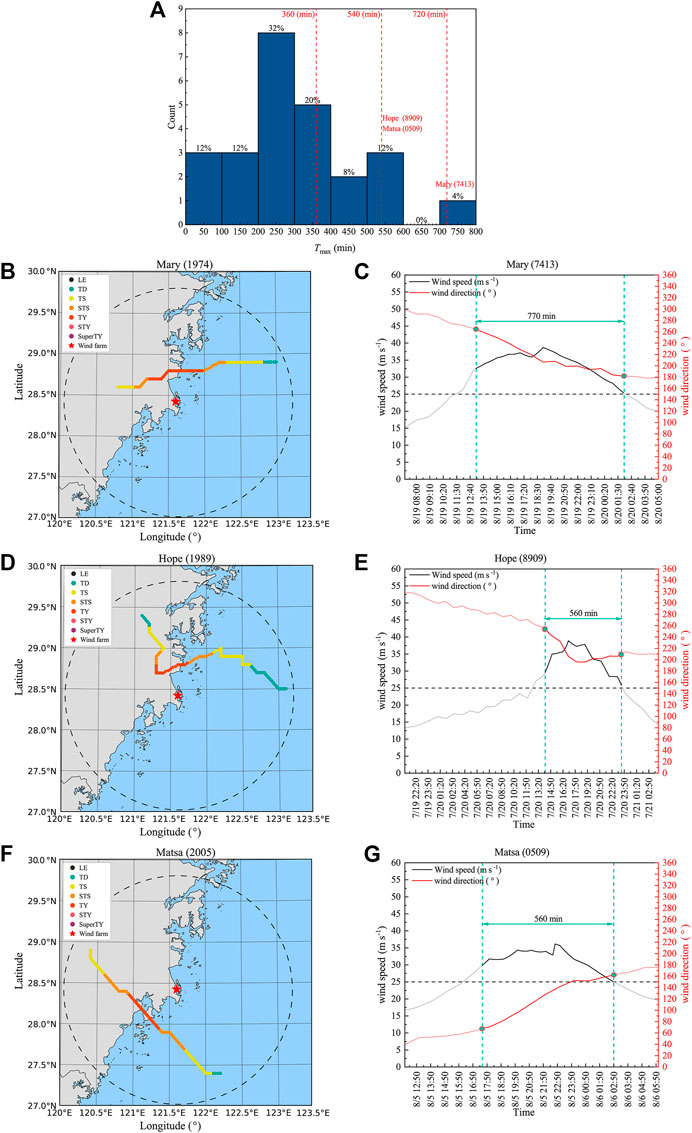
FIGURE 8. (A) Frequency distribution of the maximum duration of wind direction changes at hub height under the influence of tropical cyclones (Tmax), and (B,D and F) the best-track positions and intensities and (C,E and G) temporal variations of wind speed and wind direction for tropical cyclones (B and C) Mary (1974), (D and E) Hope (1974), and (G and H) Matsa (2005). Orange dashed lines in (A) are the threshold cutoffs of 360, 540, and 720 min, black dashed circle represents the study area with radius of 150 km centered on the wind farm, and green dashed lines in (C,E and G) denote the starting and ending time points of Tmax.
4.4 Maximum cumulative wind direction change (Δθmax)
Similar to the definition of Tmax, the maximum cumulative wind direction change (Δθmax) is defined as the cumulative change of 10-min average wind direction when the 10-min average wind speed at hub height exceeds 25 m s−1. Notably, Δθmax is calculated only when the cumulative change of 10-min average wind direction is >8°. Of the 64 tropical cyclones that passed within 150 km of the Donghaitang wind farm area, 25 met these requirements. This study used the natural breakpoint classification method (Jenks, 1967) to determine three thresholds (i.e., 67°, 152°, and 248°) and divided all samples into four categories as secondary indicators under this index.
The frequency distribution of the maximum cumulative wind direction change at hub height under the influence of tropical cyclones (Δθmax), and the best-track positions/intensities and temporal variations of wind speed and wind direction for tropical cyclones Abe (1990) and Vera (1989) are shown in Figure 9. Figure 9A shows that Δθmax is mainly concentrated between 100° and 250°, accounting for 76% of the total. Overall, 12 tropical cyclones had a Δθmax value of between 100° and 200°; the largest Δθmax was that of tropical cyclone Abe in 1990 (380.66°), followed by tropical cyclone Vera (337.76°). The intensity levels of tropical cyclones Abe and Vera were lowest at the closest point of approach to the wind farm area (Figures 9B–E). This is because the centers of these two tropical cyclones passed right over the Donghaitang wind farm area, and therefore their wind speeds showed an M-shaped trend. The wind speed of tropical cyclone Abe rose above 25 m s−1 at 21:10 on August 30 and reached its first peak of 32.8 m s−1 at 23:00. Subsequently, the wind speed decreased and reached a cumulative 10-min average wind direction change of >8° at 23:40. The wind speed then reached a second peak of 40.75 m s−1 at 03:00 on August 31, before dropping back below 25 m s−1 at 05:30. The wind speed of tropical cyclone Vera rose above 25 m s−1 at 09:50 on September 15 and reached a first peak of 26.54 m s−1 at 10:00. Subsequently, the wind speed decreased and reached a cumulative 10-min mean wind direction change of >8° at 10:30. The wind speed then increased to a second peak of 36.84 m s−1 at 13:00, before falling to below 25 m s−1 at 14:30. In terms of wind direction, the trend of both tropical cyclones was relatively smooth before the arrival of the center of the tropical cyclone and after the center of the tropical cyclone left, with substantial abrupt changes occurring in both cases as the center of the tropical cyclone passed over the wind farm area. The most abrupt change associated with tropical cyclone Abe was between 00:50 and 01:10, with an abrupt angle change of approximately 178°; the cumulative angle change curve shows that the main increase in wind direction change for Abe was between 00:30 and 03:10. For tropical cyclone Vera, the wind direction change angle exceeded 120° between 11:40 and 11:50, and its main increase in wind direction change was between 11:30 and 12:10. The Δθmax of the Donghaitang wind farm area is mainly concentrated within 250°, and there were only two tropical cyclones with Δθmax above 250°, of which the largest Δθmax was 380.66°.
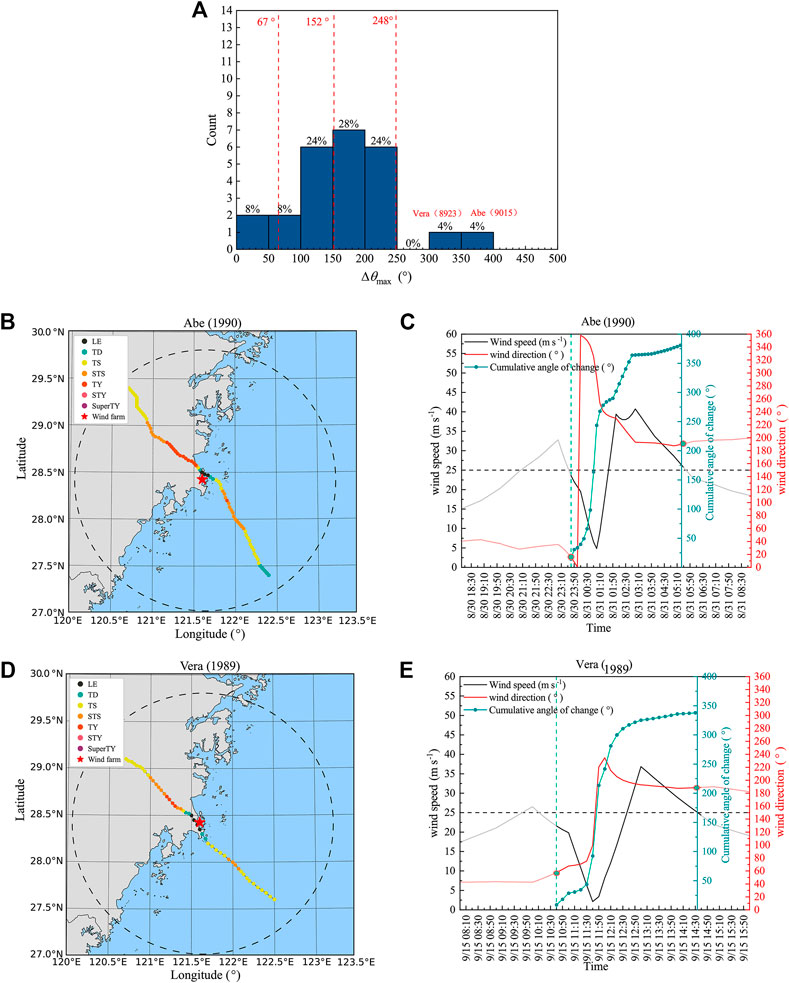
FIGURE 9. (A) Frequency distribution of the maximum cumulative wind direction change at hub height under the influence of tropical cyclones (Δθmax), (B and D) the best-track positions and intensities, and (C and E) temporal variations of wind speed and wind direction for tropical cyclones (B,C) Abe (1990) and (D,E) Vera (1989). Orange dashed lines in (A) are the threshold cutoffs of 67°, 152°, and 248°, black dashed circle represents the study area with radius of 150 km centered on the wind farm, green dashed line and green curve in (C and E) denote the start time of Δθmax and the cumulative change angle curve, respectively.
4.5 Maximum rate of change in wind direction (ΔDmax)
Wind direction is a parameter that changes in real-time. To cope with real-time changes in wind direction such that wind turbines can produce greater benefits, turbines are generally equipped with a yaw system that automatically tracks changes in wind direction and adjusts the wind turbine blades to the direction at which wind speed resources are optimal. However, when a tropical cyclone approaches, the wind direction can change by a large margin, especially near the center of the tropical cyclone, and the wind direction might change at a rate higher than expected. In this case, the wind turbine yaw system might not respond in a timely manner, which could lead to the wind turbine bearing a side wind. The windward area of a blade exposed to a side wind is the largest, and the resultant unfavorable forces could easily cause damage to the wind turbine blade. In this study, the rate of change in the 10-min average wind direction at hub height (ΔDmax) during the duration of the impact of tropical cyclones on the Donghaitang wind farm area was taken as the value of this indicator. The natural breakpoint classification method (Jenks, 1967) was used to determine three thresholds (0.023°, 0.044°, and 0.166°s−1), and all samples were divided into four categories as the secondary level under this indicator.
The frequency distribution of the maximum rate of change in wind direction at hub height under the influence of tropical cyclones (ΔDmax), and the best-track positions/intensities and temporal variations in wind speed and wind direction for tropical cyclones Vera (1989), Khanum (2005), and Jean (1974) are shown in Figure 10. The ΔDmax values were mainly concentrated between 0° and 0.04°s−1, accounting for 78.13% of the total (Figure 10A). The largest ΔDmax occurred in association with tropical cyclone Vera in 1989, with a maximum rate of change in wind direction of 0.202°s−1, followed by that of tropical cyclone Khanun in 2005 and tropical cyclone Jean in 1974, for which the maximum rate of change in wind direction was 0.166° and 0.16°s−1 respectively. The maximum rate of change in wind direction for all three tropical cyclones occurred at the moment when the center of the tropical cyclone passed closest to the wind farm (Figure 10B–G). The abrupt change in the wind direction angle of tropical cyclone Vera exceeded 120°, that of tropical cyclone Khanun was approximately 100°, while of tropical cyclone Jean was approximately 96°. It can be seen that 78.13% of the ΔDmax values of historical tropical cyclones affecting the Donghaitang wind farm area were concentrated within 0.04°s−1. Three tropical cyclones had a ΔDmax value of >0.166°s−1, mainly because the center of each of those tropical cyclones passed directly over the wind farm area.
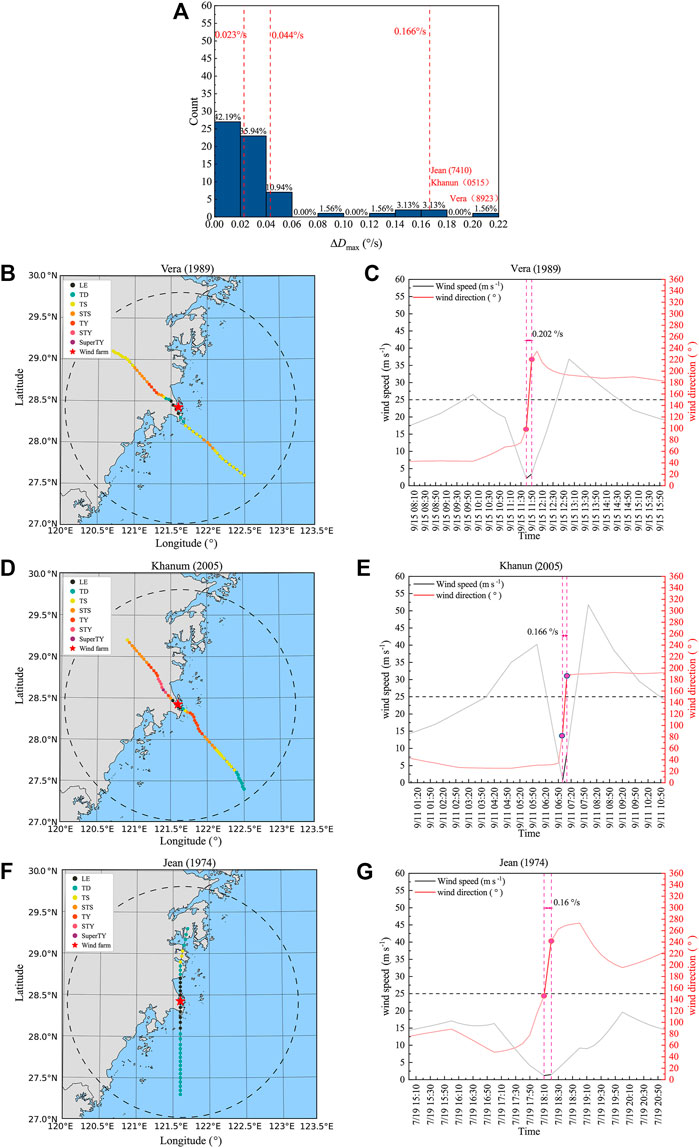
FIGURE 10. (A) Frequency distribution of the maximum rate of change in wind direction at hub height under the influence of tropical cyclones (ΔDmax), (B,D and F) the best-track positions/intensities, and (C,E and G) temporal variations in wind speed and wind direction for tropical cyclones (D and C) Vera (1989), (D and E) Khanum (2005), and (F and G) Jean (1974). Orange dashed lines are the threshold cutoffs of 0.023°, 0.044°, and 0.166°s−1, black dashed circle represents the study area with radius of 150 km centered on the wind farm, and pink dashed lines in (C,E and G) denote the period of maximum rate of change in wind direction angle associated with the tropical cyclones.
5 Tropical cyclone wind hazard assessment for the wind farm
5.1 Calculation of indicator weights
In this study, the four extreme hazard factors of maximum wind speed (Vmax), maximum duration of wind direction change (Tmax), maximum cumulative wind direction change (Δθmax), and maximum rate of change in wind direction (ΔDmax) were analyzed and used as tropical cyclone hazard factors for wind farms. A comparative judgment matrix of the four first-order indicators was derived through expert scoring (Saaty, 1990), as shown in Table 4, where the maximum wind speed of a tropical cyclone plays a decisive role in wind farm safety and is therefore considered the most important hazard factor (Chen et al., 2021). The second most important factor is the maximum rate of change in wind direction, where extreme wind direction changes can lead to an untimely response by the yaw system of the wind turbines, thereby posing a substantial threat to the blades of the wind turbines (Ebrahimi and Sekandari, 2018). Finally, the maximum duration of wind direction change and maximum cumulative wind direction change were considered of equal importance because the long-term combined effect of these two factors can lead to depletion of the backup power supply of the wind turbine, thus rendering the yaw system inoperative and posing a threat to the structural safety of the wind turbine. Using the comparative judgment matrix of the four indicators, their corresponding weight values and eigenvector values were calculated, and a consistency test was conducted on their weight results. The results showed that the CI value of the primary indicators was 0.052 and that the CR value was 0.046, i.e., both <0.1, indicating that the degree of consistency was good. Table 5 presents the comparative judgment matrix of the secondary indicators corresponding to all the primary indicators, and using the comparative judgement matrix corresponding to each indicator, the weight values and eigenvector values corresponding to each indicator were further calculated and their results tested for consistency. The results showed that the CI and CR values of the secondary indicators corresponding to the four primary indicators were <0.1, indicating good agreement. After obtaining the weight values of all the primary and secondary indicators, the final weight values of the indicators were calculated, as shown in Table 6.
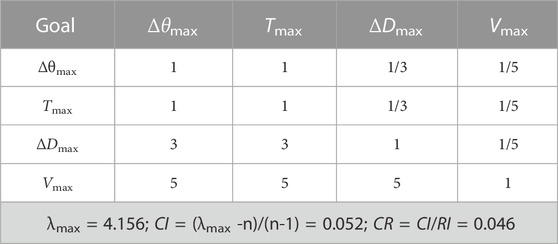
TABLE 4. Level 1 indicator judgement matrix.
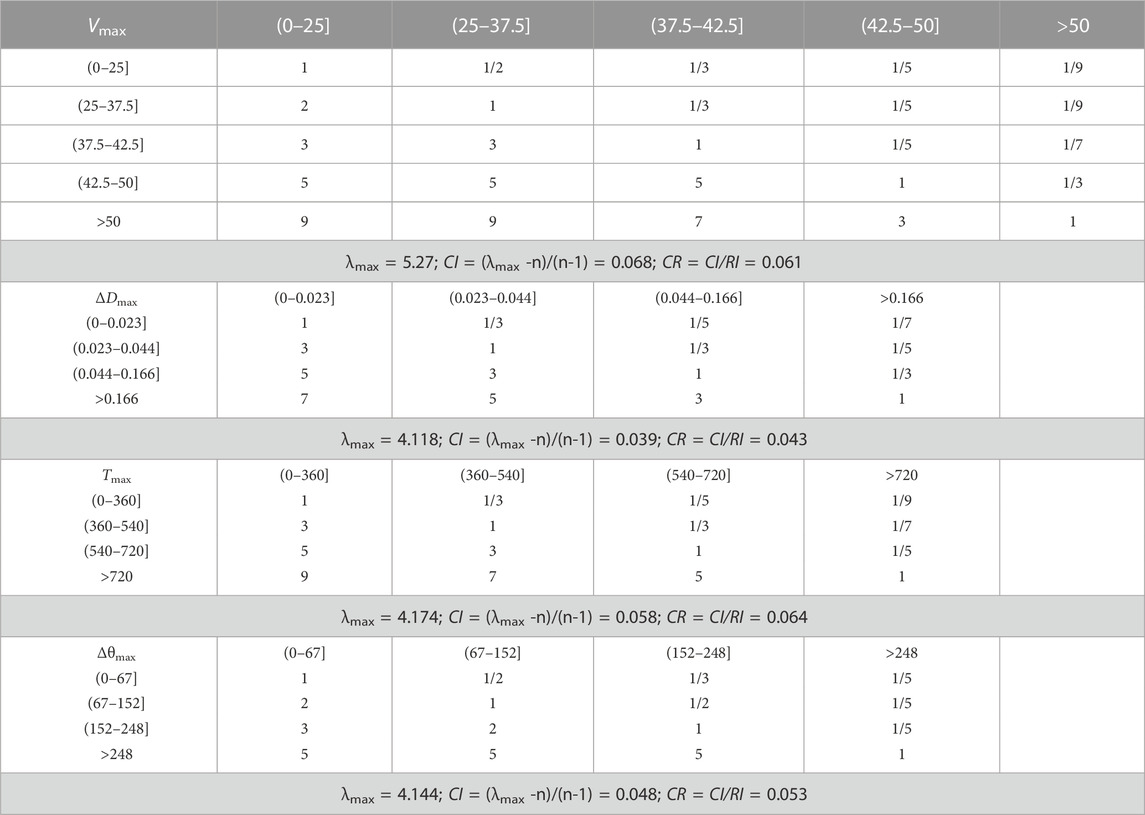
TABLE 5. Level 2 indicator judgement matrix.
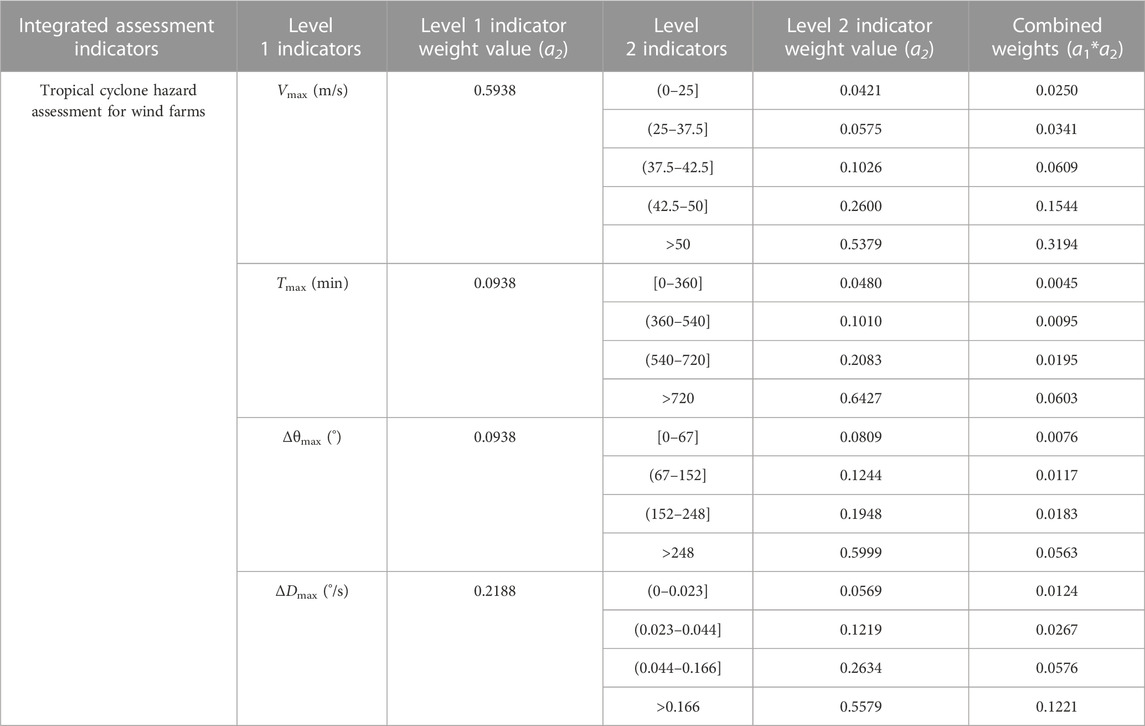
TABLE 6. Tropical cyclone hazard assessment indicators and their weighting values for the wind farm.
5.2 Integrated hazard assessment for each tropical cyclone
The composite risk index for all tropical cyclones traveling from south to north within 150 km of the Donghaitang wind farm is presented in Table 7. The average composite risk index for tropical cyclones traveling from south to north was 0.0285, with the largest value of 0.1388 and the smallest value of 0.0079. Among the tropical cyclones traveling from south to north, those whose center passed to the left of the wind farm area caused substantially greater values of maximum wind speed at the wind farm than those whose center passed to the right; thus, the average composite risk index of tropical cyclones that passed to the left (0.0307) was slightly greater than the average composite risk index of tropical cyclones that passed to the right (0.0253).

TABLE 7. Composite risk index (from south to north).
Among the three tracks of the tropical cyclones, the cyclones that moved from southeast to northwest were most numerous and strongest on average, i.e., their highest wind speed reached the level of a severe typhoon, and therefore their corresponding composite risk index was also the largest. As evident in Table 8, the average composite risk index for tropical cyclones traveling from southeast to northwest was 0.0614 (the maximum among the three directions of travel), with the largest value of 0.3496 and the smallest value of 0.0048. Among the tropical cyclones traveling from southeast to northwest, the average composite risk index of all tropical cyclones whose center passed to the left of the area of the Donghaitang wind farm was 0.0631, i.e., slightly greater than the average composite risk index of all tropical cyclones whose center passed to the right of the Donghaitang wind farm (0.0593), consistent with the results of the tropical cyclone maximum wind speed distribution map in this direction.
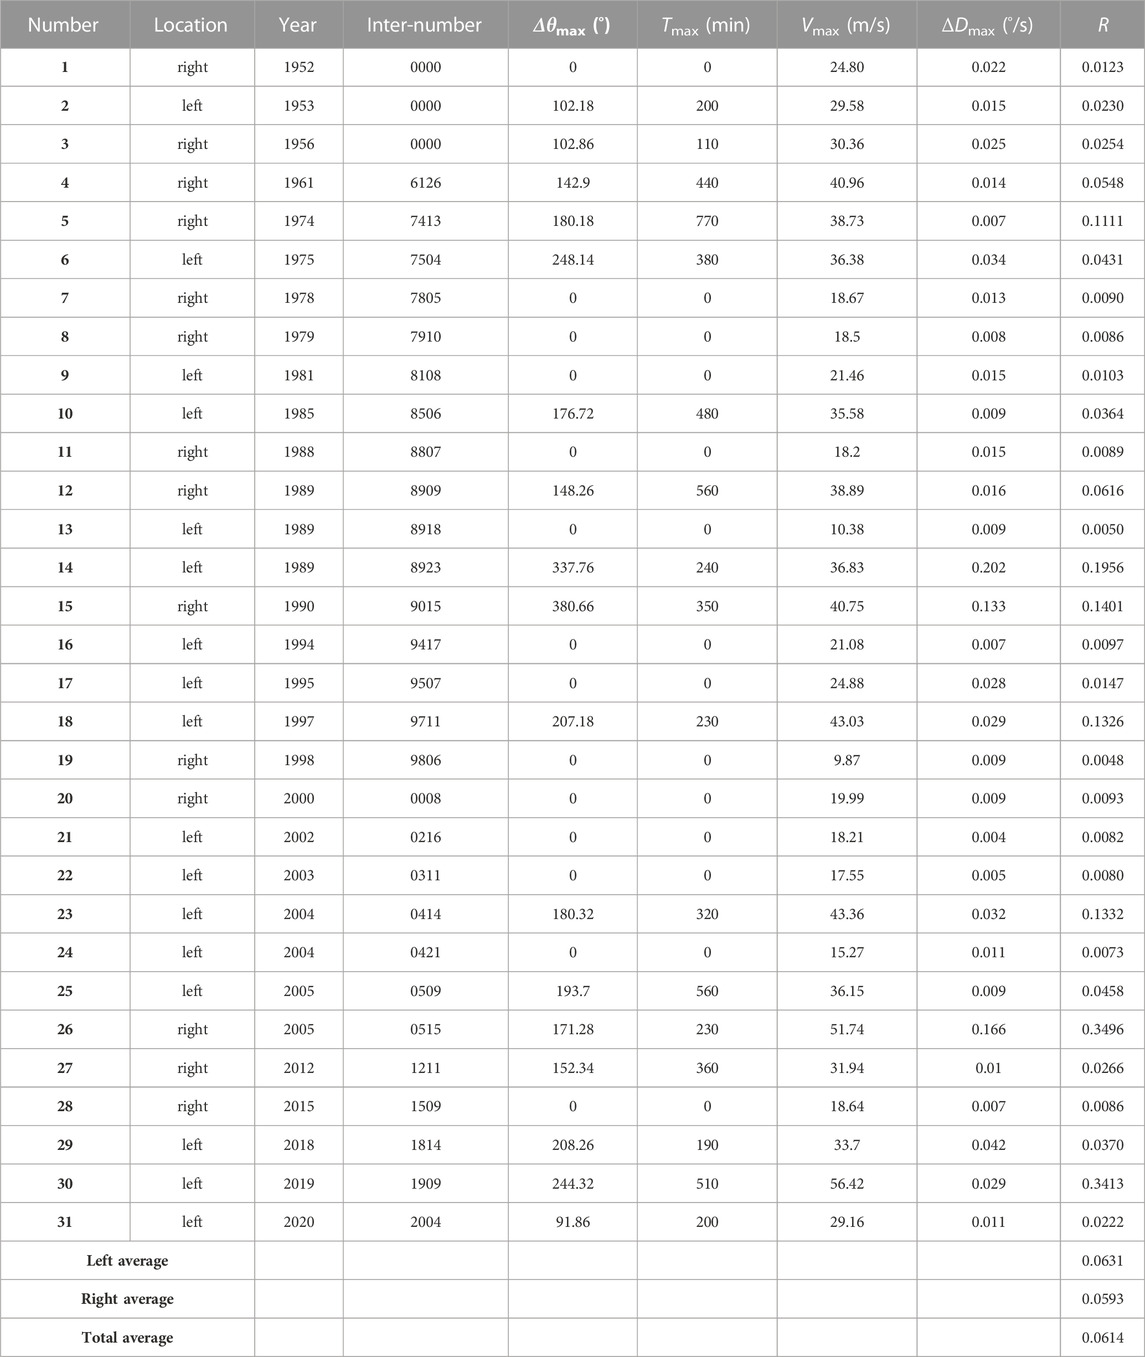
TABLE 8. Composite risk index (from southeast to northwest).
The composite risk index of tropical cyclones traveling from southwest to northeast that passed within 150 km of the Donghaitang wind farm area is presented in Table 9. The average composite risk index for tropical cyclones traveling southwest to northeast was 0.0160 (the lowest of the three directions of travel), with a maximum value of only 0.0531 and a minimum value of 0.0044. This is because most of the tropical cyclones traveling southwest to northeast dropped in intensity to the level of a tropical depression by the time they passed through the area of the wind farm, the highest wind speed was only at the level of a tropical storm. Additionally, among the tropical cyclones traveling from southwest to northeast, although the number of tropical cyclones whose center passed to the left of the wind farm area was smaller than the number of those that passed to the right, the average intensity of the former was slightly greater than that of the latter. The average composite risk index of tropical cyclones that passed to the left (0.0197) was therefore also slightly greater than the average composite risk index of those that passed to the right (0.0147).
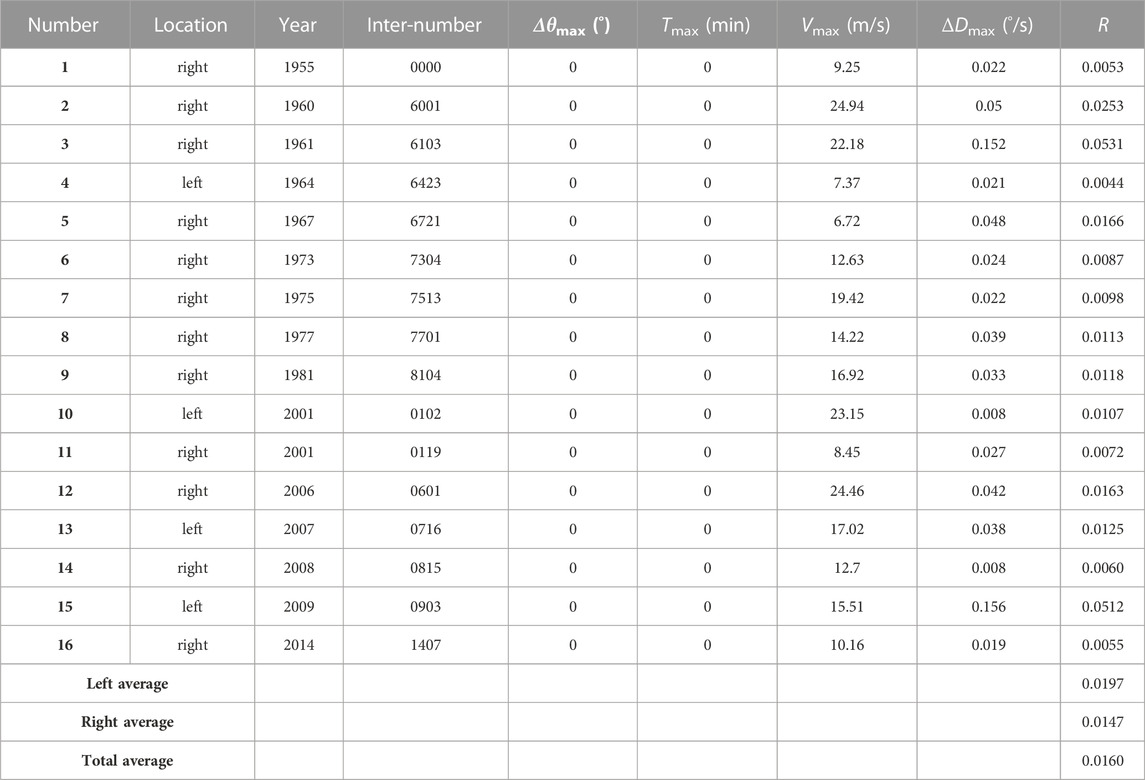
TABLE 9. Composite risk index (from southwest to northeast).
After obtaining the composite risk index of all historical tropical cyclones that passed within 150 km of the Donghaitang wind farm area during 1949–2021, the natural breakpoint classification method (Jenks, 1967) was adopted to further classify the composite risk index of the 64 tropical cyclones to express the risk level of each historical tropical cyclone more intuitively, as shown in Table 10. The essence of the natural breakpoint classification method is that there are some natural turning points and feature points through the statistical sequence. Through these points, the research objects are divided into groups with similar properties. Therefore, the natural breakpoint itself is a good boundary for classification. This paper counts all tropical cyclones in the assessment area from 1949 to 2021 so that the hazard assessment results are representative of the area. Therefore, the natural breakpoint classification method for risk classification also has a certain reliability.

TABLE 10. Tropical cyclone hazard classification for Donghaitang wind farm.
The distribution of the composite risk index for tropical cyclones traveling from south to north, southeast to northwest, and southwest to northeast within 150 km of the Donghaitang wind farm area under the four extreme hazard factors is shown in Figure 11. Of all the tropical cyclones that affected the Donghaitang wind farm area during 1949–2021, more than 76.56% represented a relatively low level of risk to safety, while more than 23% represented a level of risk of above medium. The largest number of tropical cyclones that traveled from southeast to northwest accounted for 73.33% of the total medium risk; the number of tropical cyclones that traveled from south to north and from southwest to northeast each accounted for 13.33%. There were eight tropical cyclones that represented a relatively high (or above) level of risk to safety, which accounted for 12.5% of the total number of all tropical cyclones, of which three were at a high level of risk. These three were all in the category of tropical cyclones that traveled from southeast to northwest, i.e., tropical cyclone Vera (1990), tropical cyclone Khanun (2005), and tropical cyclone Lekima (2019). The R magnitude of tropical cyclone Vera was dominated by ΔDmax, whereas the R magnitude of both tropical cyclone Khanun and tropical cyclone Lekima was dominated by Vmax. Those tropical cyclones that traveled from southwest to northeast had the lowest combined risk, with only two tropical cyclones reaching the medium level of risk; the remainder were below the relatively low level of risk. The composite risk index for tropical cyclones that traveled from south to north and that for tropical cyclones that traveled from southeast to northwest show that the composite risk rating of tropical cyclones had gradually increased over time.
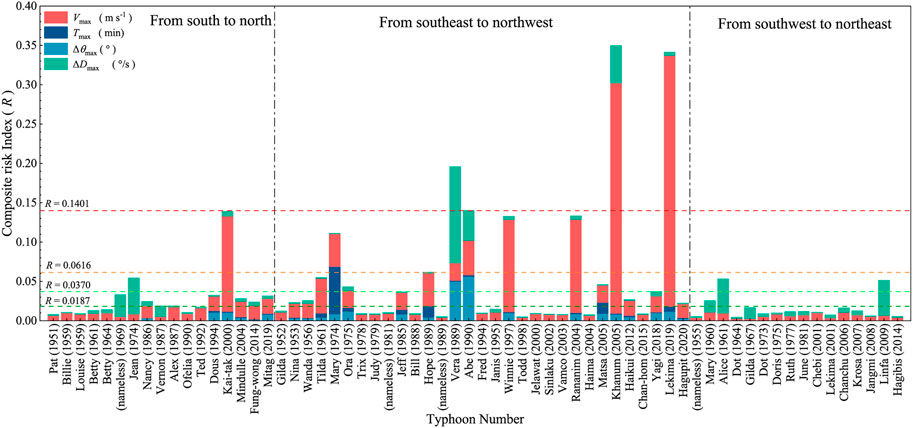
FIGURE 11. Distribution of historical tropical cyclone composite risk index for the Donghaitang wind farm area. Red, dark blue, blue, and green bars represent the proportion of Vmax, Tmax, Δθmax, and ΔDmax in the composite risk index for tropical cyclones. Dark green, green, orange and red horizontal dashed lines are the threshold cutoffs when R equals 0.0187, 0.0370, 0.0616, and 0.1401, respectively, and the vertical black dot-dashed lines are the tropical cyclone track cutoffs: (left to right) south to north, southeast to northwest, and southwest to northeast.
The time series of risk for the eight historical tropical cyclones that had a composite risk index above the relatively high level of risk is shown in Figure 12. The composite risk index of most tropical cyclones was positively correlated with the corresponding wind speed values, and only five of the moments of the impact of all tropical cyclones had a V/Vref value of >1. The time series of risk for tropical cyclone Lekima during its period of impact on the Donghaitang wind farm in 2019, is shown in Figure 12A, reveals that the wind farm was at a relatively high level of risk for 210 min, with the magnitude of R being dominated by V. At around 17:00, the risk rose to a high level owing to the continuous increase in wind speed. At 17:50, the value of V/Vref exceeded 1, indicating that the actual wind speed value at this point exceeded 50 m s−1. Subsequently, the wind speed peaked at 18:00 and then began to fall. The time over which the value of V/Vref was >1 accounted for 3.9% of the total impact hours during the entire period of impact of tropical cyclone Lekima. The time series of risk of the three tropical cyclones whose center passed right over the area of the wind farm are shown in Figures 12B–D. In addition to the high level of risk at the time of higher wind speed values, the risk level at the center of the tropical cyclones was also relatively high owing to the increase in ΔD. tropical cyclone Vera (1989) was above the medium level of risk throughout the impact period, whereas tropical cyclone Abe (1990) was above the relatively high level of risk throughout the impact period; the R magnitude of these two typhoons was dominated by Δθmax during the impact period. The R magnitude of tropical cyclone Khanun (2005) was mainly dominated by V, and although it was above the medium level of risk for only 140 min, its 10-min average wind speed value at 07:50 exceeded 50 m s−1 and the associated risk level rose to high. The period over which the V/Vref value was >1 for the entire period of impact of tropical cyclone Khanun represents 1.7% of the total period of impact. The time series of risk for tropical cyclones Kai-tak (2000), Rananim (2004), Winnie (1997), and Mary (1974) during the period over which they each affected the wind farm area are shown in Figures 12E–H, respectively. Tropical cyclones Kai-tak, Rananim, and Winnie had a relatively low overall level of risk, with only five moments above the relatively high level in total. Conversely, tropical cyclone Mary was above the relatively high level of risk for the entire duration of its period of impact, but with no periods of high risk, and its R magnitude was dominated by Tmax. Among these eight tropical cyclones, all had a V/Vref value of <1 for the entire period, except for tropical cyclone Lekima in 2019 and tropical cyclone Khanun in 2005.
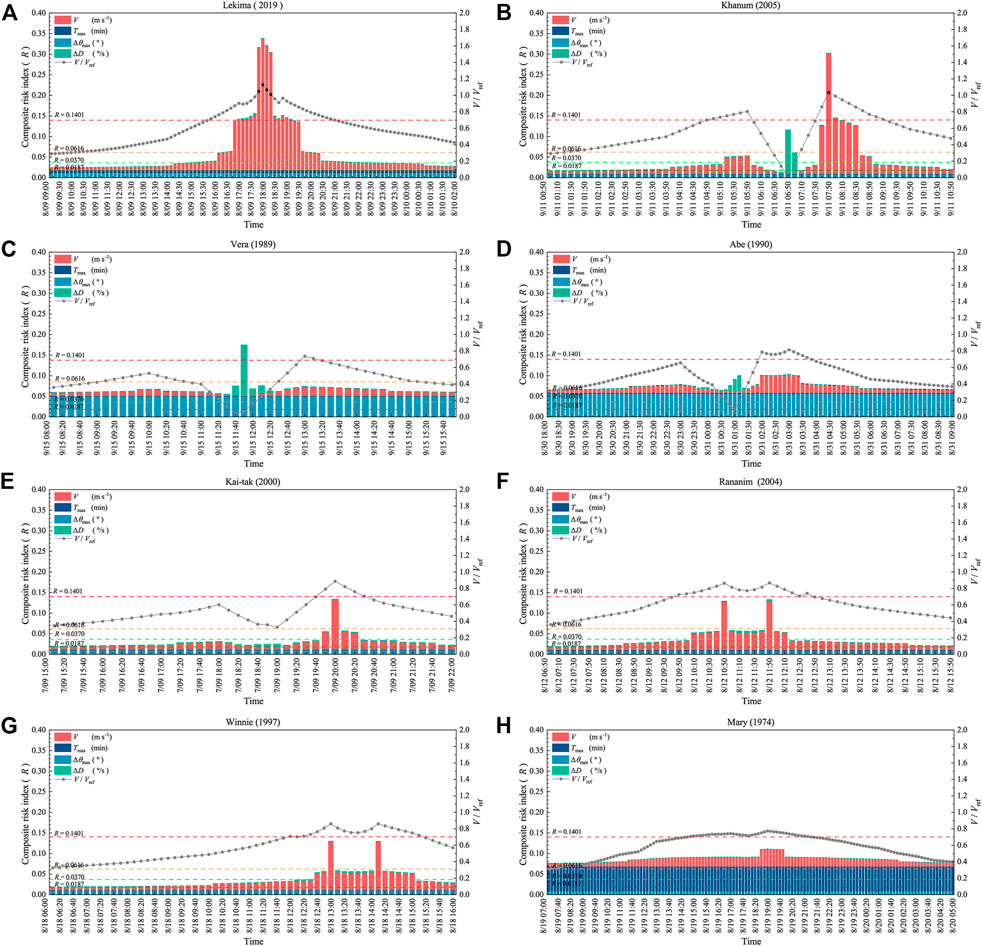
FIGURE 12. Time series of tropical cyclone risk above the relatively high level (bars) and the V/Vref time series (dotted line). The name of tropical cyclones in panels (A,B,C,D,E,F,G and H) are Lekima, Khanum, Vera, Abe, Kai-tak, Rananim, Winnie, and Mary, respectively. The time step is 10 min, V is the actual 10-min mean wind speed of tropical cyclones, Vref is reference 10-min mean wind speed of Type I wind turbines (taken as 50 m s−1). Gray points indicate V/Vref ≤ 1, black points indicate V/Vref > 1.
The tropical cyclones that represented a high level of risk to the Donghaitang wind farm area were mainly those that traveled from southeast to northwest, with the lowest risk rating for those tropical cyclones that traveled from southwest to northeast. The magnitude of R for high-risk tropical cyclones was dominated by Vmax and ΔDmax, whereas for tropical cyclones below the high-risk rating, the magnitude of R was dominated by Vmax, Tmax, and Δθmax. The overall trend is that the level of risk associated with tropical cyclones in the Donghaitang wind farm area has increased over time. There are two main reasons for this phenomenon. First of all, it can be seen from the tropical cyclone frequency distribution map of Donghaitang wind farm in Figure 4 that the number of tropical cyclones affecting the wind farm is gradually increasing with the increase of time, which undoubtedly makes the hazard of tropical cyclones faced by the wind farm gradually increase. In addition, the time-history curve of maximum wind speed of tropical cyclone in Figure 7 shows that the annual maximum wind speed of Donghaitang wind farm increases obviously with time, and the risk level of the tropical cyclone is mostly determined by the maximum wind speed of the tropical cyclone.
6 Discussion and conclusion
This study developed a comprehensive hazard assessment model for wind farms under tropical cyclone conditions based on the AHP method and evaluated the level of risk to the Donghaitang wind farm area associated with historical tropical cyclones during 1949–2021. A parameterized tropical cyclone wind field model was used to simulate the wind field data of the historical tropical cyclones that affected the wind farm area. The characteristics of the historical tropical cyclones with different tracks were analyzed, and four extreme tropical cyclone hazard factors with high impact on the wind farm were proposed and examined.
The tropical cyclones that affected the Donghaitang wind farm area during 1949–2021 broadly followed three tracks: south to north, southeast to northwest, and southwest to northeast. Those tropical cyclones that traveled moving from southeast to northwest accounted for the largest proportion (48.44%) of the total and caused relatively high wind speeds in the wind farm area. Specifically, 38.71% of tropical cyclones that moved northwestward resulted in a 10-min average wind speed exceeding 25 m s−1 at hub height. Additionally, those tropical cyclones that passed to the left side of the wind farm area caused higher wind speeds than those tropical cyclones that passed to the right. This was mainly because the wind in the wind farm area was mostly onshore when the tropical cyclones were located to the left side of the wind farm, and onshore winds are generally stronger than offshore winds. Moreover, the overall impact time of the tropical cyclones that passed to the left of the wind farm was approximately 20% longer than that of the tropical cyclones that passed to the right.
The annual maximum wind speed at hub height in the Donghaitang wind farm showed a trend of increase during 1949–2021. The extreme wind speed with 50-year recurrence at the Donghaitang wind farm is 43.6 m s−1, which is slightly larger than the reference average wind speed of the wind turbines currently installed in the wind farm (42.5 m s−1). In terms of the other three hazard factors, the maximum duration of wind direction change (Tmax) was <360 min for approximately 90% of the tropical cyclones that affected the Donghaitang wind farm, which indicates that the Tmax of 10% of tropical cyclones was above the time duration required to be guaranteed (6 h) by the code for backup power (GB/T 31519-2015, 2015; IEC 61400-1, 2019). A large proportion of the maximum cumulative wind direction change (Δθmax) at the Donghaitang wind farm was <250° and the largest value of Δθmax was only 380.66°, i.e., far below the maximum direction that wind turbines can yaw. The overall values of the maximum rate of change in wind direction (ΔDmax) were relatively small, i.e., nearly 80% of ΔDmax values were <0.04°s−1. It can be seen that with the increase of time, the number and intensity of tropical cyclones landing in the Donghaitang area are gradually increasing, which makes the tropical cyclone risk of wind farms in the region gradually increase. In addition, for the duration of the impact of tropical cyclones, although more than 90% of the impact time is within the controllable range of backup power, still some of the duration of the impact of tropical cyclones will cause damage to the wind turbine. Therefore, the Vmax and Tmax are the hazard factors that wind farms should focus on.
As indicated by the tropical cyclone risk index, the composite risk level of the Donghaitang wind farm associated with tropical cyclones has gradually increased over time, and the average composite risk index for tropical cyclones that passed to the left of the wind farm was 14.3% greater than that for tropical cyclones that passed to the right. Moreover, the average composite risk index for tropical cyclones traveling northwestward was 0.0614, i.e., much larger than that for tropical cyclones traveling northward (0.0285) and northeastward (0.0160). It can be seen that wind farms should take different countermeasures when dealing with tropical cyclones with different tracks, e.g., the Donghaitang wind farm should strengthen the prevention of tropical cyclones from southeast to northwest, and should pay more attention to tropical cyclones passing the left of the wind farm. Among the 64 historical tropical cyclones studied, there were five with a relatively high level of risk and three with a high level of risk (i.e., tropical cyclones Vera (1990), Khanun (2005), and Lekima (2019)). Specifically, the magnitude of the composite risk index was dominated by ΔDmax for tropical cyclone Vera and by Vmax for tropical cyclones Khanun and Lekima. Therefore, the two tropical cyclone hazard factors proposed in this paper for the backup power supply of wind turbines are important factors that cannot be ignored in the design of wind turbines, the selection of wind turbines, or the prevention of tropical cyclone risks in the later period. In addition, when the Type I wind turbines were selected for installation in the Donghaitang wind farm, the 10-min average wind speed at hub height exceeded the reference wind speed during only two tropical cyclones from 1949 to 2021, i.e., Typhoon Khanun (2005) with the duration of the impact of 10 min and Typhoon Lekima (2019) with the duration of the impact of 40 min.
The findings of this study could provide support for hazard assessment of offshore and coastal wind farms exposed to tropical cyclones, including macro site selection of wind farms and type selection of wind turbines. Owing to the limitation in the simulation capability of the tropical cyclone parametric wind field model, the impacts of some important hazard factors such as turbulence intensity and gust factor were not considered in the present hazard assessment model. It is planned that the impacts of additional tropical cyclone hazard factors on wind farms, especially in relation to complex terrain, will be addressed in our future studies.
Data availability statement
The raw data supporting the conclusions of this article will be made available by the authors, without undue reservation.
Author contributions
YL: Methodology, Software, Formal analysis, Visualization, Writing-Original draft preparation, Writing—Review and Editing. ST: Conceptualization, Methodology, Formal analysis, Writing-Original draft preparation, Writing—Review and Editing, Supervision. YL: Project administration, Funding acquisition. RZ: Resources, Project administration, Funding acquisition. HY: Resources, Supervision.
Funding
This work was supported by the National Key R&D Program of China (No. 2018YFB1501104); National Natural Science Foundation of China (No. U2142206, 41805088); and Basic Research Fund of Shanghai Typhoon Institute (No. 2022JB01).
Conflict of interest
The authors declare that the research was conducted in the absence of any commercial or financial relationships that could be construed as a potential conflict of interest.
Publisher’s note
All claims expressed in this article are solely those of the authors and do not necessarily represent those of their affiliated organizations, or those of the publisher, the editors and the reviewers. Any product that may be evaluated in this article, or claim that may be made by its manufacturer, is not guaranteed or endorsed by the publisher.
References
Bepary, B., and Kabir, G. (2022). Occupational risk assessment of wind turbines in Bangladesh. Appl. Syst. Innov. 5, 34. doi:10.3390/asi5020034
Chaouachi, A., Covrig, C. F., and Ardelean, M. (2017). Multi-criteria selection of offshore wind farms: Case study for the Baltic States. Energy Policy 103, 179–192. doi:10.1016/j.enpol.2017.01.018
Chen, X., Li, C., and Xu, J. (2015). Failure investigation on a coastal wind farm damaged by super typhoon: A forensic engineering study. J. Wind Eng. Industrial Aerodynamics 147, 132–142. doi:10.1016/j.jweia.2015.10.007
Chen, Y., Wu, D., Yu, Y., and Gao, W. (2021). Do cyclone impacts really matter for the long-term performance of an offshore wind turbine? Renew. Energy 178, 184–201. doi:10.1016/j.renene.2021.06.044
Díaz, H., and Soares, C. G. (2021). A multi-criteria approach to evaluate floating offshore wind farms siting in the canary islands (Spain). Energies 14, 865. doi:10.3390/en14040865
Ebrahimi, A., and Sekandari, M. (2018). Transient response of the flexible blade of horizontal-axis wind turbines in wind gusts and rapid yaw changes. Energy 145, 261–275. doi:10.1016/j.energy.2017.12.115
Emanuel, K., DesAutels, C., Holloway, C., and Korty, R. (2004). Environmental control of tropical cyclone intensity. J. Atmos. Sci. 61, 843–858. doi:10.1175/1520-0469(2004)061<0843:ECOTCI>2.0.CO;2
Fang, P., Ye, G., and Yu, H. (2020). A parametric wind field model and its application in simulating historical typhoons in the Western North Pacific Ocean. J. Wind Eng. Industrial Aerodynamics 199, 104131. doi:10.1016/j.jweia.2020.104131
GB/T 19201-2006 (2006). General administration of quality supervision, inspection and quarantine of the people's Republic of China. Beijing: China Standards Press. https://std.samr.gov.cn/gb/gbQuery.Grade of tropical cyclones
GB/T 31519-2015 (2015). Wind turbine generator system under typhoon conditionGeneral administration of quality supervision, inspection and quarantine of the people's republic of China. https://std.samr.gov.cn/gb/gbQuery.
GB/T 38957-2020 (2020). Technical specification for effect evaluation of tropical cyclone on offshore wind power project. General Administration of Quality Supervision, Inspection and Quarantine of the People's Republic of China. https://std.samr.gov.cn/gb/gbQuery.
Gkeka-Serpetsidaki, P., and Tsoutsos, T. (2022). A methodological framework for optimal siting of offshore wind farms: A case study on the island of crete. Energy 239, 122296. doi:10.1016/j.energy.2021.122296
Global Wind Energy Council (Gwec), (2022a). Global wind report 2022. Available at: https://gwec.net/green-recovery-data-analysis/(Accessed October 10, 2022).
IEC 61400-1 (2019). Wind energy generation systems - part 1: Design requirements. Geneva, Switzerland: International Electrotechnical Commission. -1 https://webstore.iec.ch/publication/64648.
Jenks, G. F. (1967). The data model concept in statistical mapping. Int. Yearb. Cartogr. 7, 186–190.
Jiao, X., Xing, H., Zhang, Q., and Zhou, J. (2020). Meteorological risk identification and assessment of offshore wind farms. IOP Conf. Ser. Earth Environ. Sci. 514, 032016. doi:10.1088/1755-1315/514/3/032016
Kang, J., Sun, L., Sun, H., and Wu, C. (2017). Risk assessment of floating offshore wind turbine based on correlation-FMEA. Ocean. Eng. 129, 382–388. doi:10.1016/j.oceaneng.2016.11.048
Kang, J., Wang, Z., and Guedes Soares, C. (2020). Condition-based maintenance for offshore wind turbines based on support vector machine. Energies 13, 3518. doi:10.3390/en13143518
Khaira, A., and Dwivedi, R. K. (2018). A state of the art review of analytical hierarchy process. Mater. Today Proc. 5, 4029–4035. doi:10.1016/j.matpr.2017.11.663
Kim, E., and Manuel, L. (2016). Hurricane risk assessment for offshore wind plants. Wind Eng. 40, 261–269. doi:10.1177/0309524X16645482
Kim, E., and Manuel, L. (2014). Hurricane-induced loads on offshore wind turbines with considerations for nacelle yaw and blade pitch control. Wind Eng. 38, 413–423. doi:10.1260/0309-524X.38.4.413
Kim, G., Jeong, M.-H., Jeon, S.-B., Lee, T.-Y., Oh, H.-Y., and Park, C.-S. (2021). Determination of optimal locations for offshore wind farms using the analytical hierarchy process. J. Coast. Res. 114. doi:10.2112/JCR-SI114-089.1
Lee, B.-H., Ahn, D.-J., Kim, H.-G., and Ha, Y.-C. (2012). An estimation of the extreme wind speed using the Korea wind map. Renew. Energy 42, 4–10. doi:10.1016/j.renene.2011.09.033
Li, J., Li, Z., Jiang, Y., and Tang, Y. (2022). Typhoon resistance analysis of offshore wind turbines: A review. Atmosphere 13, 451. doi:10.3390/atmos13030451
Li, Z., Chen, S., Ma, H., and Feng, T. (2013). Design defect of wind turbine operating in typhoon activity zone. Eng. Fail. Anal. 27, 165–172. doi:10.1016/j.engfailanal.2012.08.013
Liu, B., Jin, W., Zhao, J., Zhang, Q., and An, W. (2021). Research on risk assessment techniques of offshore wind power projects during operation period. IOP Conf. Ser. Earth Environ. Sci. 766, 012023. doi:10.1088/1755-1315/766/1/012023
Liu, L., and Wang, Y. (2020). Trends in landfalling tropical cyclone–induced precipitation over China. J. Clim. 33, 2223–2235. doi:10.1175/JCLI-D-19-0693.1
Lu, X., Yu, H., Ying, M., Zhao, B., Zhang, S., Lin, L., et al. (2021). Western North pacific tropical cyclone database created by the China meteorological administration. Adv. Atmos. Sci. 38, 690–699. doi:10.1007/s00376-020-0211-7
Mattu, K. L., Bloomfield, H. C., Thomas, S., Martínez-Alvarado, O., and Rodríguez-Hernández, O. (2022). The impact of tropical cyclones on potential offshore wind farms. Energy Sustain. Dev. 68, 29–39. doi:10.1016/j.esd.2022.02.005
Meng, Y., Matsui, M., and Hibi, K. (1995). An analytical model for simulation of the wind field in a typhoon boundary layer. J. Wind Eng. Industrial Aerodynamics 56, 291–310. doi:10.1016/0167-6105(94)00014-5
National Development and Reform Commission (NDRC) People’s Republic of China (2022). The 14th Five-Year plan and long-range objectives through 2035. Available at: https://en.ndrc.gov.cn/policies/index_1.html (Accessed October 10, 2022).
National Energy Administration (2022). 14th Five-Year plan and long-range objectives through 2035. National Development and Reform Commision of China. Available at: https://en.ndrc.gov.cn/policies/index_1.html (Accessed October 10, 2022).
Pantelis, B., Konstantinidis, E. I., and Pitsa, D. (2012). Systemic assessment and analysis of factors affect the reliability of a wind turbine. Istra?ivanja i Proj. za privredu 10, 85–92. doi:10.5937/jaes10-2130
Qian, Z., Guo, Q., Zhang, Q., Zhou, D., Zhao, S., and Xie, L. (2021). Capacity configuration and selection of emergency power supply for wind farms under typhoon conditions. E3S Web Conf. 252, 02040. doi:10.1051/e3sconf/202125202040
Rose, S., Jaramillo, P., Small, M. J., and Apt, J. (2013). Quantifying the hurricane catastrophe risk to offshore wind power: Hurricane catastrophe risk to offshore wind power. Risk Anal. 33, 2126–2141. doi:10.1111/risa.12085
Saaty, T. L. (1990). How to make a decision: The analytic hierarchy process. Eur. J. Operational Res. 48, 9–26. doi:10.1016/0377-2217(90)90057-i
Saaty, T. L., and Kearns, K. P. (1985). “Chapter 3 - the analytic hierarchy process,” in Analytical planning (Elsevier), 19–62. doi:10.1016/B978-0-08-032599-6.50008-8
Sánchez-Lozano, J. M., García-Cascales, M. S., and Lamata, M. T. (2016). GIS-based onshore wind farm site selection using Fuzzy Multi-Criteria Decision Making methods. Evaluating the case of Southeastern Spain. Appl. Energy 171, 86–102. doi:10.1016/j.apenergy.2016.03.030
Sarkar, A., Deep, S., Datta, D., Vijaywargiya, A., Roy, R., and Phanikanth, V. S. (2019). Weibull and generalized extreme value distributions for wind speed data analysis of some locations in India. KSCE J. Civ. Eng. 23, 3476–3492. doi:10.1007/s12205-019-1538-4
Shapiro, L. J. (1983). The asymmetric boundary layer flow under a translating hurricane. J. Atmos. Sci. 40, 1984–1998. doi:10.1175/1520-0469(1983)040<1984:TABLFU>2.0.CO;2
Sheng, C., and Hong, H. P. (2021). Reliability and fragility assessment of offshore floating wind turbine subjected to tropical cyclone hazard. Struct. Saf. 93, 102138. doi:10.1016/j.strusafe.2021.102138
Sinha, Y., and Steel, J. A. (2015). A progressive study into offshore wind farm maintenance optimisation using risk based failure analysis. Renew. Sustain. Energy Rev. 42, 735–742. doi:10.1016/j.rser.2014.10.087
Tahri, M., Hakdaoui, M., and Maanan, M. (2015). The evaluation of solar farm locations applying Geographic Information System and Multi-Criteria Decision-Making methods: Case study in southern Morocco. Renew. Sustain. Energy Rev. 51, 1354–1362. doi:10.1016/j.rser.2015.07.054
Tang, D., Xu, M., Mao, J., and Zhu, H. (2020). Unsteady performances of a parked large-scale wind turbine in the typhoon activity zones. Renew. Energy 149, 617–630. doi:10.1016/j.renene.2019.12.042
Thompson, E. F., and Cardone, V. J. (1996). Practical modeling of hurricane surface wind fields. J. Waterw. Port. Coast. Ocean. Eng. 122, 195–205. doi:10.1061/(asce)0733-950x(1996)122:4(195)
Vagiona, D., and Kamilakis, M. (2018). Sustainable site selection for offshore wind farms in the South aegean—Greece. Sustainability 10, 749. doi:10.3390/su10030749
Vasileiou, M., Loukogeorgaki, E., and Vagiona, D. G. (2017). GIS-based multi-criteria decision analysis for site selection of hybrid offshore wind and wave energy systems in Greece. Renew. Sustain. Energy Rev. 73, 745–757. doi:10.1016/j.rser.2017.01.161
Veers, P., Dykes, K., Lantz, E., Barth, S., Bottasso, C. L., Carlson, O., et al. (2019). Grand challenges in the science of wind energy. Science 366, eaau2027. doi:10.1126/science.aau2027
Vickery, P. J., Skerlj, P. F., Steckley, A. C., and Twisdale, L. A. (2000). Hurricane wind field model for use in hurricane simulations. J. Struct. Eng. 126126, 120310–121221. doi:10.1061/(asce)0733-9445(2000)126:10(1203)
Wang, J., Qin, S., Jin, S., and Wu, J. (2015). Estimation methods review and analysis of offshore extreme wind speeds and wind energy resources. Renew. Sustain. Energy Rev. 42, 26–42. doi:10.1016/j.rser.2014.09.042
Yan, Z., Pang, L., and Dong, S. (2020). Analysis of extreme wind speed estimates in the northern south China sea. J. Appl. Meteorology Climatol. 59, 1625–1635. doi:10.1175/JAMC-D-20-0046.1
Yao, Z., Li, X., and Xiao, J. (2018). Characteristics of daily extreme wind gusts on the Qinghai-Tibet Plateau, China. J. Arid Land 10, 673–685. doi:10.1007/s40333-018-0094-y
Ying, M., Zhang, W., Yu, H., Lu, X., Feng, J., Fan, Y., et al. (2014). An overview of the China meteorological administration tropical cyclone database. J. Atmos. Ocean. Technol. 31, 287–301. doi:10.1175/JTECH-D-12-00119.1
Zhang, X., Sun, L., Sun, H., Guo, Q., and Bai, X. (2016). Floating offshore wind turbine reliability analysis based on system grading and dynamic FTA. J. Wind Eng. Industrial Aerodynamics 154, 21–33. doi:10.1016/j.jweia.2016.04.005
Appendix A: Parametric wind field model
The CE (U.S. Army Corps of Engineers) wind field model is based on the Navier–Stokes fluid equations. These are horizontal equations of motion that consider the combined effects of the Coriolis force, pressure gradient force, vortex viscous force, and drag force, under the assumptions that the vertical convective flow is small in comparison with the horizontal convective term and can be neglected, and that the shear force at the top of the atmospheric boundary layer vanishes. The vector expression of the atmospheric mean equation of motion, i.e., the momentum equation, with Earth as the reference system is expressed as follows:
where
In a coordinate system moving with the typhoon center, the equation can be expressed as follows:
where
Assuming
where the moving speed
where p0 is the pressure at the typhoon center, Δp = p∞-p0 is the pressure difference between the center of the typhoon vortex and the periphery with p∞ = 1010hPa, Rmax is the radius of maximum wind, r is the radial distance to the typhoon center, and B is the Holland-B parameter. Rmax and B are as follows:
where the ϕ is the typhoon position.
Restricted by the length of the article, the detailed values of more parameters are referred to Section 2 of Fang et al. (2020).
Keywords: tropical cyclone, wind hazard, wind farm, typhoon, hazard assessment, analytic hierarchy process
Citation: Li Y, Tang S, Li Y, Zhu R and Yu H (2023) Tropical cyclone wind hazard assessment for Donghaitang wind farm (Zhejiang Province, China): Case study. Front. Earth Sci. 10:1109026. doi: 10.3389/feart.2022.1109026
Received: 27 November 2022; Accepted: 30 December 2022;
Published: 16 February 2023.
Edited by:
Kevin Cheung, E3-Complexity Consultant, AustraliaReviewed by:
Keping Chen, Macquarie University, AustraliaYubin Li, Nanjing University of Information Science and Technology, China
Copyright © 2023 Li, Tang, Li, Zhu and Yu. This is an open-access article distributed under the terms of the Creative Commons Attribution License (CC BY). The use, distribution or reproduction in other forums is permitted, provided the original author(s) and the copyright owner(s) are credited and that the original publication in this journal is cited, in accordance with accepted academic practice. No use, distribution or reproduction is permitted which does not comply with these terms.
*Correspondence: Shengming Tang, tangsm@typhoon.org.cn