Stability analysis of rock slopes using the interface contact model and strength reduction method
 Rui Yang
 JiaCheng Li1
  Cheng Zeng
- 1Key Laboratory of Urban Underground Engineering of Ministry of Education, Beijing Jiaotong University, Beijing, China
- 2Discipline of Civil, Surveying and Environmental Engineering, Priority Research Centre for Geotechnical Science and Engineering, The University of Newcastle, Callaghan, NSW, Australia
The assessment of rock slope stability is usually controlled by the presence of discontinuities. The block theory is an established method in practical engineering to predict the stability of rock slopes. A maximum of two discontinuity planes are considered in the application of the block theory. It would lead to inaccurate prediction of slopes with multiple discontinuity planes. A novel method for estimating the safety margin of rock slopes is proposed, which is capable of considering the contribution of all discontinuities to the stability problem. The discontinuity planes are simulated by an interface contact model within the theoretical framework of the finite difference method. The factor of safety is obtained by the strength reduction method. The failure criteria of rock slopes are also discussed. The proposed model can simulate discontinuous planes in a more realistic manner and thus is more effective in engineering practice. To demonstrate the effectiveness of the proposed model, several numerical examples are presented, which showcase its superiority for predicting the stability of blocks composed of multiple discontinuities. Several numerical examples are analyzed to confirm the effectiveness of the proposed model and its superiority in stability prediction of blocks formed by multiple discontinuities.
1 Introduction
Rock slope stability is generally governed by the presence of discontinuities which developed in rocks. The combination of these discontinuities may result in a set of removable key blocks that significantly decrease the overall stability of slopes. It is vital to develop an effective method for evaluating the stability of key blocks for safe rock slope excavation and construction.
Extensive research studies have been conducted to investigate the stability of rock slopes. Goodman and Shi (1985) proposed the block theory to analyze the stability of the rock wedge, and it has been widely adopted in engineering because of its simplicity of concept. Chen (2004) developed a theoretical method for assessing the stability of the rock wedge based on limit equilibrium analysis. Ma et al. (2019) explored the applicability of the block theory to the wedge probability analysis by considering the variabilities of the geometric and rock properties of blocks. Deng (2021) established a spatial model of rock slopes based on the characteristics of discontinuities and slope surfaces. However, these block theory-based methods have some limitations for a general rock block formed by multiple discontinuities. The factor of safety and failure modes can be inaccurately estimated when these methods are adopted for the stability of rock blocks formed by multiple structural planes. Jiang and Zhou (2017) proposed a rigorous solution based on the limit equilibrium method (LEM) and kinematic analysis for the stability of polyhedral rock blocks formed by multiple discontinuities. Nevertheless, when analyzing the stability of a rock block, LEM does not completely take into account the shear forces acting on the sliding surfaces of either side of the rock block.
Zienkiewicz et al. (1975) first applied the strength reduction method (SRM) to evaluate the slope stability. Since then, some researchers have employed the SRM with finite element methods (FEMs) and finite difference methods (FDMs) to analyze the stability of slopes. The factor of safety (FS) is comparable with the result from LEM as found by Ugai and Leshchinsky (1995), Griffiths and Lane (1999), Zheng et al. (2007), and Griffiths and Marquez (2007). In comparison to the LEM, the SRM has a number of advantages including the abilities to model complex geometric and boundary conditions, the nonlinear behavior of rocks and soils, and the progressive collapse of slopes (Wei et al., 2009; Xi et al., 2014; Zhao et al., 2019). It is noted, however, most of the applications are for soil slopes. The applications of SRM to rock slopes are rare with a few exceptions including Jiang et al. (2015) and Lu et al. (2020). The existing rock slope applications of SRM involve modeling the discontinuities based on solid elements neglecting the significant disparity in the physical and mechanical characteristics of intact rocks and discontinuities. In addition, the failure criterion of the soil slope is directly applied to the rock slope despite the distinction failure mode of soil slopes and rock slopes.
In this paper, an FDM interface contact model developed for rock slopes is first introduced. The proposed model is capable of modelling discontinuities by interface contact elements, and it is reasonable considering the contribution of multiple discontinuities. The shear reduction approach is adopted to assess the stability of rock slopes. Then, the failure criterion of rock slopes is discussed. To validate the reliability of the proposed method, four typical examples are analyzed by FlAC3D. The effects of the stiffness of interfaces, mesh size, and failure criteria on the FS and computation time are also investigated. Moreover, the proposed method is applied in the stability analysis of the right dam abutment of the Yinpan Hydropower Station in Wulong County, Chongqing Province, China. The results show that the proposed method is effective in assessing multiple structural planes.
2 Methodology
2.1 Constitutive relation of the interface contact model
Advanced numerical models provide two approaches for modelling rock discontinuities: zero-thickness interface contact elements to facilitate the transmission of both shear and normal stress from the rock to the discontinuity structure planes and solid elements with finite depth. The interface contact elements in FlAC3D with zero thickness are used to model the discontinuities in rock slopes.
Figure 1 illustrates the constitutive model of the interface elements. The Coulomb sliding law (Itasca 2000) is used to characterize the shear strength of the interface, which is represented by a linear Coulomb shear-strength criterion, normal and shear stiffnesses, tensile and shear bond strengths, and a dilation angle. The dilation angle is assumed to be zero in this paper, and a non-associate flow rule is used, which limits the shear force acting at an interface node and causes an increase in effective normal force on the target face after the shear-strength limit is reached.
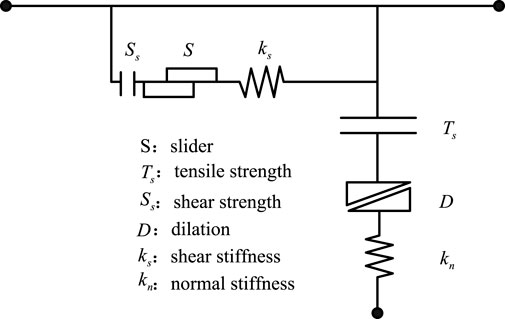
FIGURE 1. Components of the bonded interface constitutive model.
The absolute normal penetration and the relative shear velocity of every interface node and its corresponding target face are determined at every time step. The interface constitutive model utilizes these values to generate a normal force and a shear-force vector. They are calculated at time
where
The Coulomb shear-strength criterion restricts the magnitude of the shear force according to a specific equation.
where
If either the shear stress is greater than the shear strength or the tensile effective normal stress is more than the normal strength, the bond will be broken. Then the normal force and shear force turn to be zero. The interface elements can well simulate the deformation and stress characteristics of the discontinuous plane.
The intercalation capacity of two contact surfaces is determined by normal stiffness
where
2.2 Strength reduction method
The strength reduction finite difference method is proposed to predict the stability of a rock slope. The SRM is intended to reduce the cohesion
where SRF is the strength reduction factor. When the critical state is determined, the factor of the safety of the rock slope is the same as SRF and
2.3 Failure criteria in strength reduction for rock slopes
The failure criteria for evaluating if a soil slope has reached its critical state have been widely discussed. The most widely used failure criteria for soil slopes are presented as follows.
1) Strain and displacement mutation of specific points.
2) The non-convergence of a numeral model computation.
3) Plastic shear strain runs through the slope.
Using the displacement mutation of specific points as failure criteria is not objective enough due to specific points’ selection and the determination of whether the displacement mutation of these points depends on subjective judgment. The convergence speed of a numeral model is influenced by grid partitioning. The occurrence of a plastic zone stretching from the bottom to the top of a slope does not necessarily signify slope failure.
Research studies on the failure criteria of rock slopes are rare. Most of the researchers adopted failure criteria for soil slopes to obtain the
3 Examples
The stability assessment of a rock slope that includes either a wedge formed by two discontinuities or a pentahedron formed by three discontinuities is of great interest in rock slope engineering. To verify the effectiveness of the proposed method, four rock slope examples are analyzed by the traditional method and proposed method. The analysis is carried out using the high-performance laptop with Intel(R) Core(TM) i7-10875H CPU @ 2.30 GHz. The movable block in examples 1 and 2 is formed by two discontinuities, while that in examples 3 and 4 is formed by three discontinuities.
1) Example 1: Symmetrical wedge
The first problem deals with a symmetrical wedge with two discontinuities, as illustrated in Figure 2. The rock slope surface of this wedge has an inclination of 45° with a dip direction of 185°, while the upper surface of slope dips has an inclination of 10° with a dip direction of 180°. The wedge has a height of 64.89 m and is intersected by two discontinuities (i.e., ADC and ABC). Details of discontinuities for geometry and geotechnical properties are given in Table 1. The unit weight is
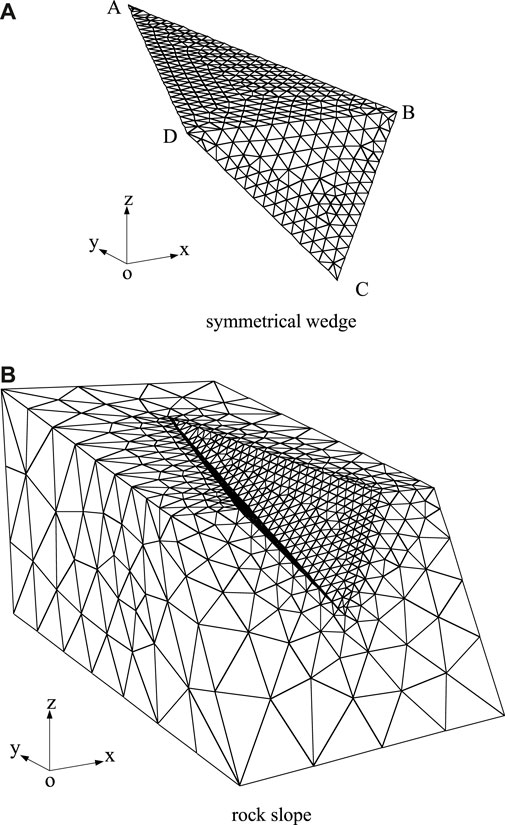
FIGURE 2. Three-dimensional mesh discretization for rock slopes with a symmetrical wedge. (A) Symmetrical wedge (B) Rock slope.
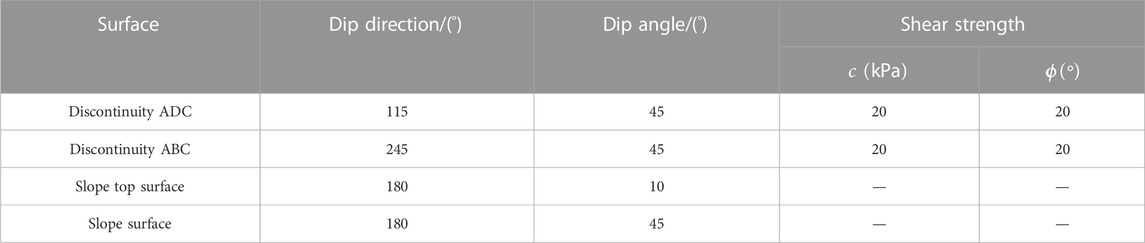
TABLE 1. Geometrical and material parameters of example 1.
Through the procedure of shear strength reduction on the discontinuities ADC and ABC, the FS can be determined. When SRF attains 1.316, all the nodes of interface contact elements are either sliding or opening and the limit failure state is reached. For this example, the FS is 1.316. For comparison, the block theory is also undertaken to evaluate the stability of this example. According to the principles of the block theory, the movable block is determined to be sliding along the juncture where two sliding surfaces intersect. The block theory derived closed-form equations for this failure mode to calculate the FS. The FS has an exact value of 1.293. It was found that FS estimated by the proposed method is consistent with the block theory, which is proved to be an accurate method for evaluating stability of symmetrical wedges. Thus, the rationality and effectiveness of the proposed method have been demonstrated.
2) Example 2: Asymmetrical wedge
Example 2 consists of an asymmetrical wedge with two discontinuities ADC and ABC. The shear strength and geometric features of the example are provided in Table 2. In this case, the rock unit weight is
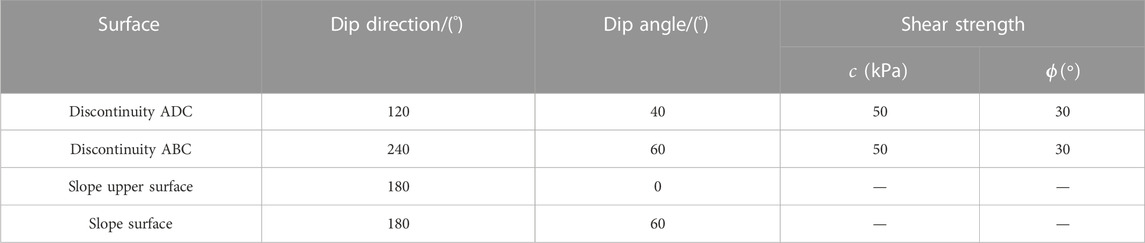
TABLE 2. Geometrical and material parameters of example 2.
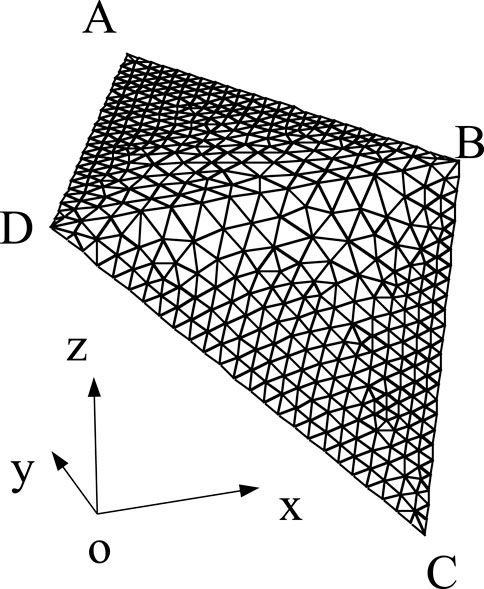
FIGURE 3. Three-dimensional mesh discretization for the asymmetrical wedge.
Example 3 is a rock slope with a movable block formed by three discontinuity surfaces (ABED, ACFD, and ABC) as shown in Figure 3A. In this case, the volume of the block is 6076 m3. The area of structural surfaces ABED, ACFD, and ABC is 573 m2, 878 m2, and 81 m2, respectively. The strengths and orientations of the three discontinuities are given in Table 3. The rock unit weight is
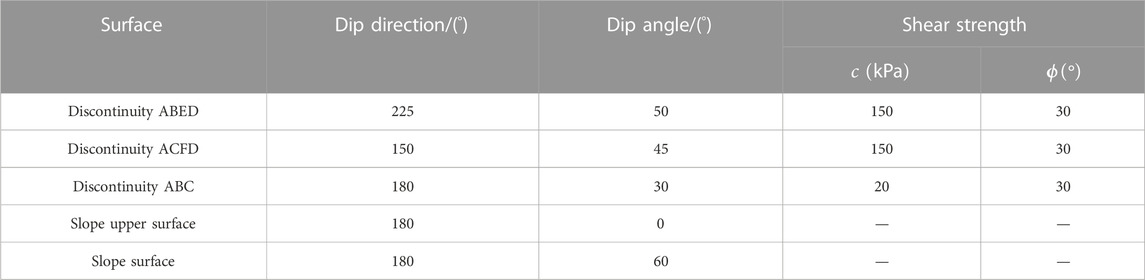
TABLE 3. Geometrical and material parameters of example 3.
The FS for this example is obtained by the proposed method and block theory. When SRM is equal to 2.875, as shown in Figure 4, all the nodes of interface contact elements are either sliding or opening and the limit failure state is reached. For this problem, the FS is 2.875. The sliding mode of this example determined by the block theory is the single plane sliding (along ABC). In the estimation, the block theory only considers the normal and shear stresses of the sliding surface, ignoring the influence of other discontinuities. The FS estimated by the block theory is 1.156. It is shown that the block theory method seriously underestimates the rock slope’s stability.
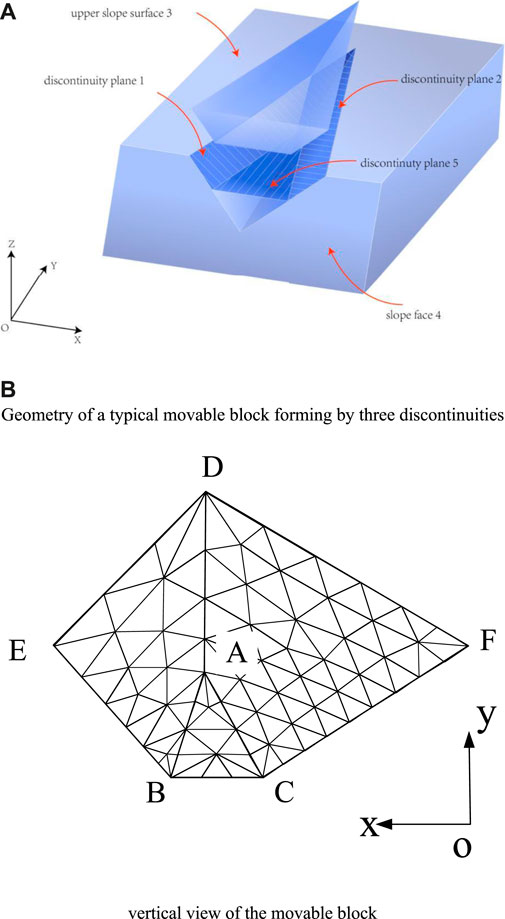
FIGURE 4. Three-dimensional model for example 3 (A) Geometry of a typical moveable block forming by three discontinuities. (B) Vertical view of the movable block.
To investigate the influence of discontinuities ABED and ACFD on the slope stability assessment, the
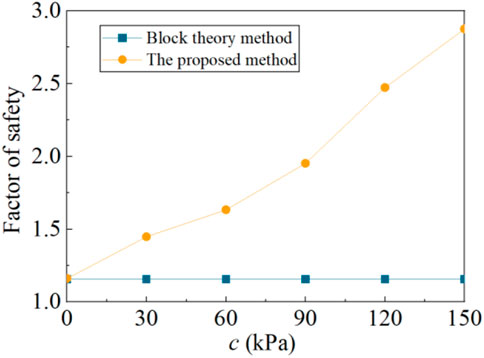
FIGURE 5. Effect of the cohesion of discontinuities ABED and ACFD on slope stability analysis.
Figure 6 shows an example of a rock slope with three discontinuities developed in the rock mass. Figure 6A exhibits a tetrahedron mesh of the pentahedron. The mesh of the interface comprised 116 nodes and 172 elements. The shear strength characteristics and geometry of discontinuities are listed in Table 4. In this case, the potentially unstable block formed by the spatial intersection of discontinuities ABED, ACFD, and ABC has a volume of 10,870 m3. The area of structural surfaces ABED, ACFD, and ABC is 683 m2, 580 m2, and 764 m2, respectively.
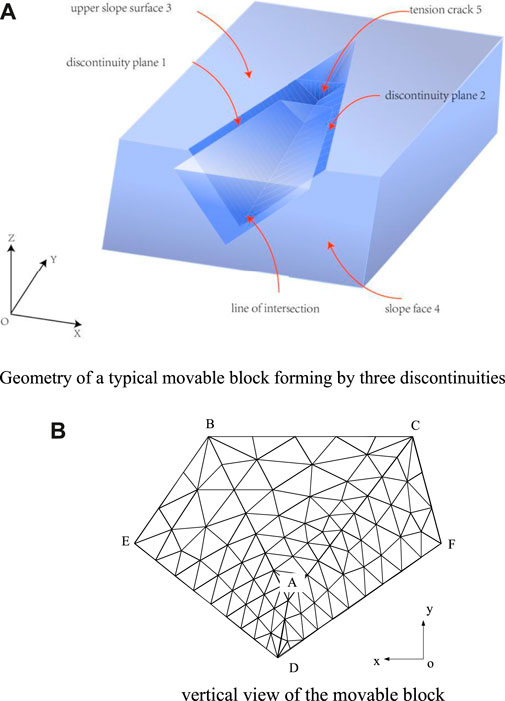
FIGURE 6. Three-dimensional model for example 4. (A) Geometry of a typical movable block forming by three discontinuities. (B) Vertical view of the movable block.
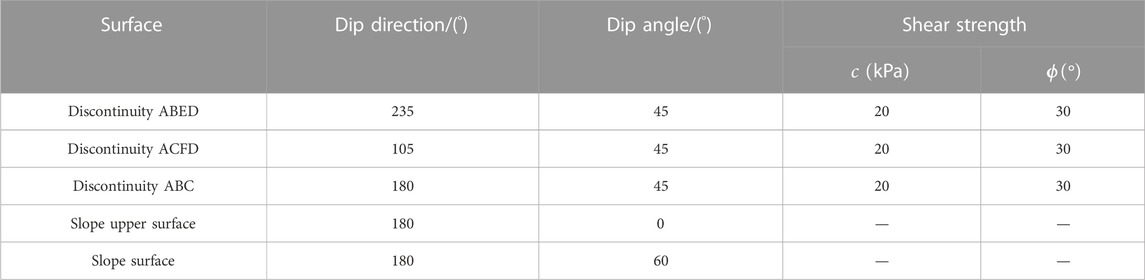
TABLE 4. Geometrical and material parameters of example 4.
For comparison and validation, the block theory, the three-dimensional LEM implemented using 3D slope software, and the proposed method are adopted to analyze the stability of the example rock slope. The FS of 1.28 obtained by the proposed method shows good agreement with that predicted by LEM (FS=1.26). Within the framework of the block theory, it is essential to first evaluate the failure mode. The example slope sliding direction is congruent with the junction of the two failure planes (ABED and ACFD) on the horizontal projection. The FS obtained from the block theory only considers normal and shear stresses of the two sliding surfaces, ignoring the influence of the tension crack. The FS is found to be 2.01, which overestimated the stability of the slope.
The effect of the tension crack (i.e., discontinuity ABC) on the stability of the example slope has been discussed by varying the dip angle. As depicted in Figure 7, when the tension crack dip angle is 90°, the difference in the FS obtained by the proposed method, block theory, and LEM is negligible. This indicates that the tension crack barely influences the analysis of slope when the dip angle is equal to 90°. It can also be found from Figure 7 that the FS calculated by the block theory increases slightly with the increasing tension crack dip angle. The varied volume of movable blocks and areas of sliding surfaces leads to minor difference in FS for different dip angles. The difference between the proposed method and block theory is increased with the decreasing tension crack dip angle. When the dip angle is equal to 45°, the relative difference in FS between the proposed method and block theory is 36.5%. The block theory can lead to inaccurate outcomes due to ignoring the tension crack of unstable slopes, thus overestimating the stability of slopes. The proposed method and LEM can consider the roles of all the structural planes in the stability problem, which provides a new and effective way of solving the stability problem of movable blocks. The FS calculated by these two methods is very close. To accurately assess the stability of rock slopes, the shear strength of all discontinuities should be considered, and their unfavorable effects on the rock stability assessment should also be reflected for calculating the FS.
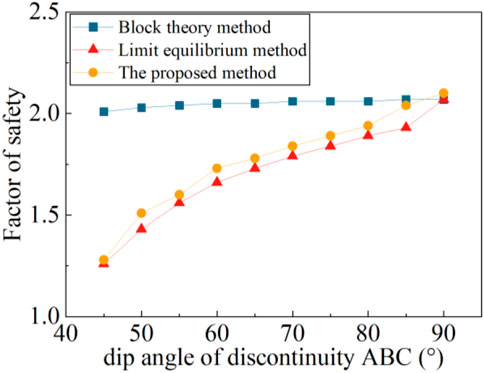
FIGURE 7. Effect of the dip angle of discontinuity ABC on slope stability analysis.
4 Discussion
4.1 Effects of shear and normal stiffnesses on slope stability analysis
The discontinuities developed in rocks are simulated by interface contact elements. To analyze the impact of normal and shear stiffnesses on the stability of a slope, the symmetrical wedge and asymmetrical wedge are adopted and analyzed. The bulk and shear moduli of the rock mass were set at
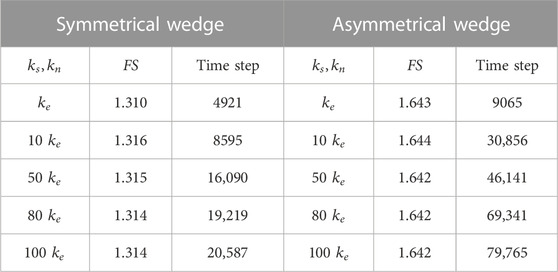
TABLE 5. Effects of
For the illustrative examples, although the values of stiffnesses are different, the values of FS are very similar. If normal stiffness
4.2 Effects of element size on slope stability analysis
To discuss the effects of size of the interface contact element on the estimation of rock slope stability, various element sizes are utilized in the analysis. To discretize symmetrical and asymmetrical wedges, four different element sizes are employed.
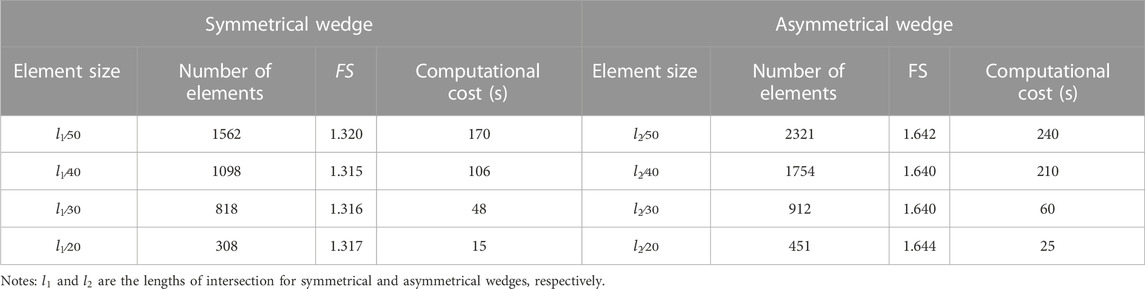
TABLE 6. Effects of element size of interface contact elements on the FS.
4.3 Effects of failure criteria on slope stability analysis
To investigate the effects of different criteria on the rock slope stability, both displacement mutation criterion and the proposed failure criterion (all the nodes of interface contact elements are either sliding or opening) are used to obtain the FS of the rock slope for examples 1 and 2. The displacements of four points (A, B, C, and D) are recorded with the rise in SRF as illustrated in Figure 8. The displacements of all selected points increased with the rise in SRF. The analytical FS (estimated by the block theory) of example 1 is 1.293. The displacement mutation phenomenon has not been easily observed with the increasing strength reduction. When the shear strength reduction method is applied with the displacement mutation as the slope failure criteria, the estimation of FS involved subjectivity. As shown in Figure 9, the number of failed nodes is increased with the increasing SRF. The turning points are found when SRF=1.316 of example 1. All the nodes of interface contact elements are either sliding or opening when SRF=1.316. Thus, FS is 1.316 according to the failure criteria. The turning points of example 2 can also be obtained when SRF=1.644. The results show that the FS estimated in the strength reduction method by the new failure criteria has good agreement with the block theory. The interface element node failure criteria are recommended for examining the stability of rock slopes because of its objectivity and clear concept.
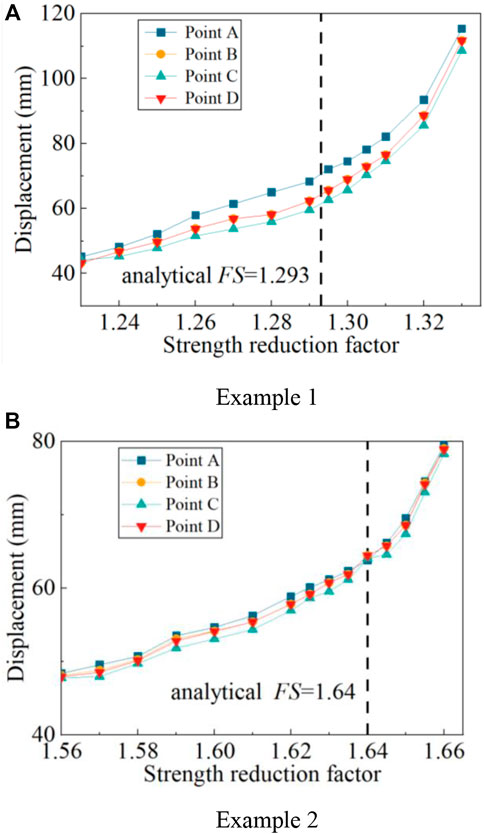
FIGURE 8. Displacement of specific points with the rise in the strength reduction factor. (A) Example 1 (B) Example 2.
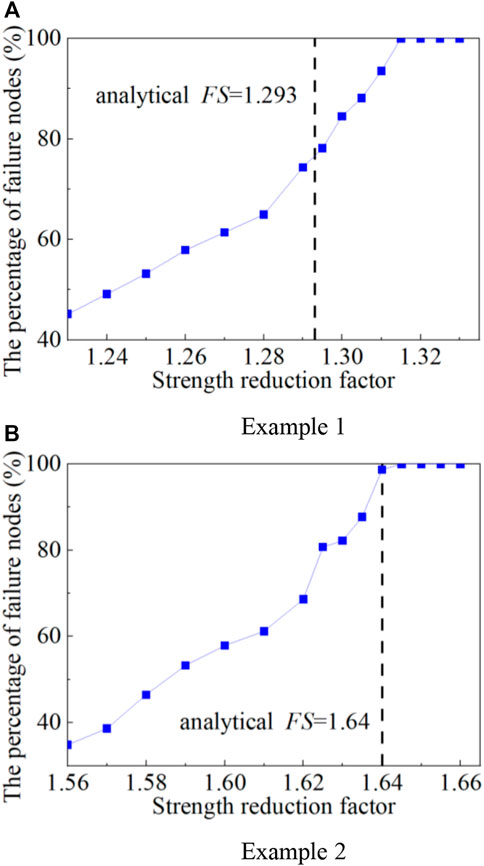
FIGURE 9. Percentage of failure nodes with the increase in the strength reduction factor. (A) Example 1 (B) Example 2.
5 Engineering application
The Yinpan Hydropower Station is situated in Wulong County, Chongqing Province, China, which is 4 km downstream from Jiangkou Town. The Yinpan Hydropower Station, as the 11th cascade development on the main stream of the Wujiang River, is a comprehensive hydro-project designed for electric power generation in combination with navigation. The hydropower station includes the construction of a 653.8-m-long and 80-m-high concrete gravity dam.
The gradient of natural rock slopes on the right bank is about 35°. The rock of the slope is composed of

FIGURE 10. Plan layout of excavation on the right dam slope.
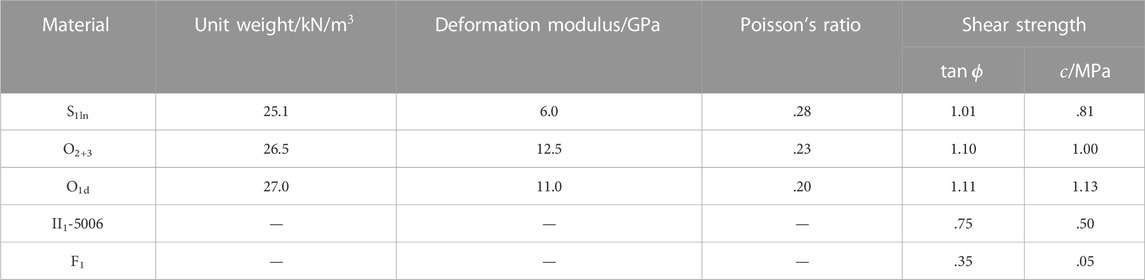
TABLE 7. Physical and mechanical parameters of the rock mass for the right dam abutment slope.
A model is built to analyze the FS after excavation based on the geological reveals in the right slope. The numerical model for the right dam abutment slope is presented in Figure 11. The numerical model is composed of 1161 nodes and 4508 elements. The volume of the potential failure block is 21,445 m3. Fault F1 and bedding fissure II15006 are simulated by interface contact elements within the theoretical framework of the finite difference method. The mesh of the interface comprised 402 nodes. For the right dam abutment slope, the SRF is 1.04 when all the nodes of interface contact elements are either sliding or opening. Therefore, the FS is 1.04. Figure 12 shows the states of interface nodes with different reduction factors of shear strength. Circles at nodes represent that the interface has slipped in the shear or normal direction. Red circles represent opening contact nodes, and black circles represent sliding contact nodes. Figure 13 represents the plane sliding direction vectors of the right dam abutment slope at a critical state.
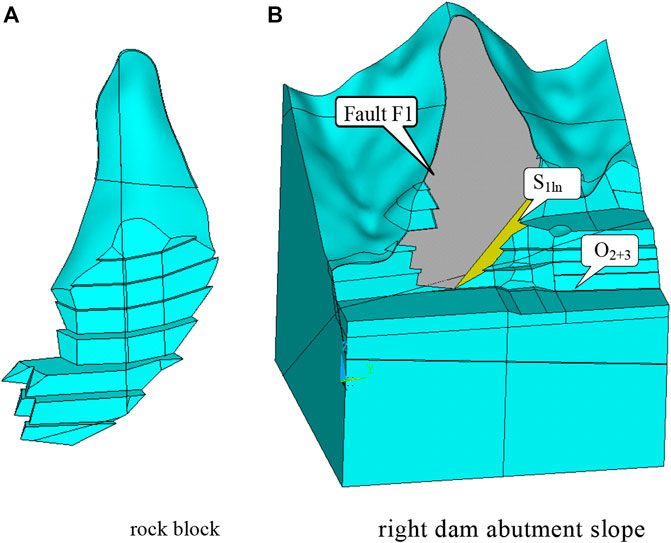
FIGURE 11. Three-dimensional model for the right dam abutment slope after excavation. (A) Rock block (B) Right dam abutment slope.
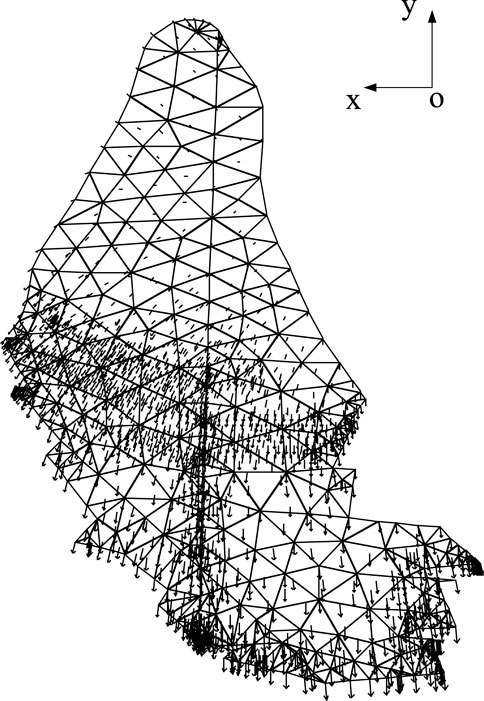
FIGURE 12. States of interface nodes for the rock block of the right dam slope.
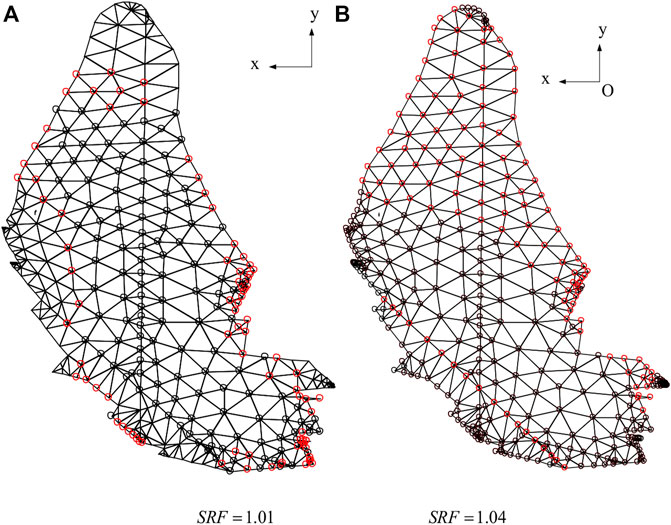
FIGURE 13. Sliding direction vectors of the dam slope at the critical state (A) SRF=1.01 (B) SRF=1.04.
The failure mode of right slopes obtained by the block theory is single plane sliding with fault F1. When considering a potential sliding of the right dam slope along fault F1, a unique decomposition of forces on the sliding body is induced into a component along the sliding direction and a component perpendicular to the sliding direction. Thus, the FS obtained from the block theory is .72. However, when the block fails, II15006 would resist sliding of the movable block and change the sliding direction. Since the block theory method ignores the role of bedding fissure II15006, the block theory underestimated the stability of the right dam abutment slope. The proposal method can consider roles of all the structural planes in the stability problem and obtain credible results Figure 13.
6 Conclusion
In order to analyze rock slopes with multiple discontinuities, which can induce ill-advised results by the conventional block theory, this paper proposes a method for estimating the FS of complex blocks, in which the discontinuities are simulated by interface contact elements within the theoretical framework of the finite difference method based on the strength reduction method. The effects of shear and normal stiffnesses, element size of wedges, and failure criteria on the stability analysis were further investigated by the proposal method. The following conclusions can be drawn from the results and discussion of this paper:
1) The validity of the proposed model is demonstrated by some typical examples of wedges. For wedge examples, the FS values calculated by the proposed method are consistent with the traditional method. For the stability analysis of blocks formed by multiple structural planes, the proposed method can consider roles of all the structural planes in the stability problem. Thus, the proposed method provides engineers with a practical method for 3D jointed rock slope stability analysis.
2) The stiffnesses of the interface contact element and element size have no influence on the estimation of FS. However, large values of stiffnesses and small element size will result in low computational efficiency. Therefore, it is of great importance for adopting the suitable stiffnesses of the interface element and element size to improve solution efficiency. The failure criteria of the interface contact node provide a more accurate way to indicate the failure behavior of a rock slope.
3) The proposed method is utilized to assess the stability of the Yinpan Hydropower Station right abutment slope. The traditional block theory method fails to accurately assess the stability of the slope due to its inability to consider the contributions of all the structural planes. However, the proposed method takes into account all the structural planes and produces more reliable results.
Data availability statement
The original contributions presented in the study are included in the article/Supplementary Material; further inquiries can be directed to the corresponding author.
Author contributions
RY: methodology, software, validation, investigation, formal analysis, data curation, writing—original draft, writing—review and editing, and visualization. CZ: conceptualization, methodology, software, validation, formal analysis, writing—original draft, writing—review and editing, visualization, supervision, and project administration. JL: software, validation, and writing—review and editing. XB: software, validation, and writing—review and editing.
Funding
This study was supported by the Fundamental Research Funds for the Central Universities (2021JBM037) and the China Postdoctoral Science Foundation project (2022M710341).
Conflict of interest
The authors declare that the research was conducted in the absence of any commercial or financial relationships that could be construed as a potential conflict of interest.
Publisher’s note
All claims expressed in this article are solely those of the authors and do not necessarily represent those of their affiliated organizations, or those of the publisher, the editors, and the reviewers. Any product that may be evaluated in this article, or claim that may be made by its manufacturer, is not guaranteed or endorsed by the publisher.
References
Bandis, S. C., Lumsden, A. C., and Barton, N. R. (1983). Fundamentals of rock joint deformation. Int. J. Rock Mech. Min. 20 (6), 249–268. doi:10.1016/0148-9062(83)90595-8
Chen, Z. (2004). A generalized solution for tetrahedral rock wedge stability analysis. Int. J. Rock Mech. Min. Sci. 41 (4), 613–628. doi:10.1016/j.ijrmms.2003.12.150
Deng, D. (2021). Limit equilibrium analysis on the stability of rock wedges with linear and nonlinear strength criteria. Int. J. Rock Mech. Min. Sci. 148, 104967. doi:10.1016/j.ijrmms.2021.104967
Fossum, A. F. (1985). Effective elastic properties for a randomly jointed rock mass. Int. J. Rock Mech. Min. Sci. Geomechanics Abstr. 22 (6), 467–470. doi:10.1016/0148-9062(85)90011-7
Goodman, R. E., and Shi, G. H. (1985). Block theory and its application to rock engineering. USA: Prentice-Hall.
Griffiths, D. V., and Lane, P. A. (1999). Slope stability analysis by finite elements. Geotechnique 49, 387–403. doi:10.1680/geot.1999.49.3.387
Griffiths, D. V., and Marquez, R. M. (2007). Three-dimensional slope stability analysis by elasto-plastic finite elements. Geotechnique 57 (6), 537–546. doi:10.1680/geot.2007.57.6.537
Itasca, F. (2000). Fast Lagrangian analysis of continua. Minneapolis, Minn: Itasca Consulting Group Inc.
Jiang, Q., Qi, Z., Wei, W., and Zhou, C. (2015). Stability assessment of a high rock slope by strength reduction finite element method. Bull. Eng. Geol. Environ. 74 (4), 1153–1162. doi:10.1007/s10064-014-0698-1
Jiang, Q., and Zhou, C. (2017). A rigorous solution for the stability of polyhedral rock blocks. Comput. Geotechnics 90, 190–201. doi:10.1016/j.compgeo.2017.06.012
Lu, R., Wei, W., Shang, K., and Jing, X. (2020). Stability analysis of jointed rock slope by strength reduction technique considering ubiquitous joint model. Adv. Civil Eng., 1–13. doi:10.1155/2020/8862243
Ma, Z., Qin, S., Chen, J., Lv, J., Chen, J., and Zhao, X. (2019). A probabilistic method for evaluating wedge stability based on blind data theory. Bull. Eng. Geol. Environ. 78 (3), 1927–1936. doi:10.1007/s10064-017-1204-3
Rosso, R. S. (1976). A comparison of joint stiffness measurements in direct shear, triaxial compression, and in Situ. Int. J. Rock Mech. Min. Sci. Geomechanics Abstr. 13 (6), 167–172. doi:10.1016/0148-9062(76)91282-1
Ugai, K., and Leshchinsky, D. (1995). Three-dimensional limit equilibrium and finite element analyses: A comparison of results. Soils Found. 35 (4), 1–7. doi:10.3208/sandf.35.4_1
Wei, W. B., Cheng, Y. M., and Li, L. (2009). Three-dimensional slope failure analysis by the strength reduction and limit equilibrium methods. Comput. Geotechnics 36 (1–2), 70–80. doi:10.1016/j.compgeo.2008.03.003
Xi, C., Wu, Y., Yu, Y., Liu, J., Xi, F. X., and Ren, J. (2014). A two-grid search scheme for large-scale 3-D finite element analyses of slope stability. Comput. Geotechnics 62, 203–215. doi:10.1016/j.compgeo.2014.07.010
Zhao, M., Guo, W., Chen, L. Y., and Wang, S. Y. (2019). Experiment on the frost resistance of modified phospho gypsum: A case used to improve baozhong railway subgrade loess. J. Mt. Sci. 16 (12), 2920–2930. doi:10.1007/s11629-018-5014-2
Zheng, Y., Deng, C., Zhao, S., and Tang, X. (2007). Development of finite element limiting analysis method and its applications in geotechnical engineering. Sciences 2007 (3), 10–36.
Keywords: interface contact element, strength reduction method, stability analysis, rock slope, discontinuous deformation
Citation: Yang R, Li J, Bai X and Zeng C (2023) Stability analysis of rock slopes using the interface contact model and strength reduction method. Front. Earth Sci. 10:1118935. doi: 10.3389/feart.2022.1118935
Received: 08 December 2022; Accepted: 30 December 2022;
Published: 02 February 2023.
Edited by:
Yunhui Zhang, Southwest Jiaotong University, ChinaCopyright © 2023 Yang, Li, Bai and Zeng. This is an open-access article distributed under the terms of the Creative Commons Attribution License (CC BY). The use, distribution or reproduction in other forums is permitted, provided the original author(s) and the copyright owner(s) are credited and that the original publication in this journal is cited, in accordance with accepted academic practice. No use, distribution or reproduction is permitted which does not comply with these terms.
*Correspondence: Cheng Zeng, Cheng.Zeng@uon.edu.au