Permafrost Base Degradation: Characteristics and Unknown Thread With Specific Example From Hornsund, Svalbard
 Wojciech Dobiński
 Marek Kasprzak
- 1Institute of Earth Sciences, University of Silesia, Sosnowiec, Poland
- 2Institute of Geography and Regional Development, University of Wroclaw, Wroclaw, Poland
Permafrost degradation is one of the most pressing issues in the modern cryosphere related to climate change. Most attention is paid to the degradation of the top of the active permafrost associated with contemporary climate. This is the most popular issue because in the subsurface part of it there is usually the greatest accumulation of ground ice in direct relation to the changes taking place. The melting of ground ice is the cause of the greatest changes related to subsidence and other mass-wasting processes. The degradation of the subsurface permafrost layer is also responsible for the increased emission of CO2 and methane. However, this is not a fully comprehensive look at the issue of permafrost degradation, because depending on its thickness, changes in its thermal properties may occur more or less intensively throughout its entire profile, also reaching the base of permafrost. These changes can degrade permafrost throughout its profile. The article presents the basic principles of permafrost degradation in its overall approach. Both the melting of the ground ice and the thermal degradation of permafrost, as manifested in an increase in its temperature in part or all of the permafrost profile, are discussed. However, special attention is paid to the degradation characteristics from the permafrost base. In the case of moderately thick and warm permafrost in the zone of its sporadic and discontinuous occurrence, this type of degradation may particularly contribute to its disappearance, and surficial consequences of such degradation may be more serious than we expect on the basis of available research and data now. A special case of such degradation is the permafrost located in the coastal zone in the vicinity of the Hornsund Spitsbergen, where a multidirectional thermal impact is noted, also causing similar degradation of permafrost: from the top, side and bottom. Especially the degradation of permafrost from the permafrost base upwards is an entirely new issue in considering the evolution of permafrost due to climate change. Due to the difficulties in its detection, this process may contribute to the threats that are difficult to estimate in the areas of discontinuous and sporadic permafrost.
1 Introduction
Climate warming causes the degradation of all components of the cryosphere that are more or less persistent at the Earth’s surface. The permafrost is undoubtedly one of the most stable and the most influencing component of the range of the earth’s cryosphere (Lunardini 1995). Its degradation is the subject of attention of many authors in terms of the entire Arctic (e.g., Liljedahl et al., 2016; Shi et al., 2019), within its regional aspects: Alaska (Jorgenson et al., 2001), as a part of the Russian Arctic (Vasiliev et al., 2020), or Tibet (Yang et al., 2010; Yin et al., 2021) and many diverse environments. Predominantly permafrost degradation is described most commonly as process operating from the ground surface downwards (Lawrence and Slater 2005; Delisle 2007; Frey and McClelland 2009; Streletskiy et al., 2015; Oliva et al., 2018; Luo et al., 2018; Luo et al., 2020). It includes the impact on infrastructure (Hjort et al., 2018), where the climatic influence is the most spectacular and often directly visible because the time lag between initial degradation and its further effects is not long. Hence, at the interface between the active layer (AL) and permafrost, the reaction to climate and surface warming will be the strongest and fastest, the most spectacular and at the same time the easiest to identify and measure.
The heat flux into the ground does not stop, however, at the interface between permafrost and the AL, but with a certain delay, penetrating further down. This process depends on various factors, especially heat capacity, heat permeability and amount of ice in the medium. The more complex the geological medium is, the more complicated process related to heat flux in accompany with it and the more difficult it is to describe or model. Stable and much more homogeneous geothermal heat flux is directed opposite to the highly seasonal heat penetrating the AL from the surface. The balance of these opposite heat streams is visible at the semi-stable point of zero annual amplitude (ZAA) in the ground, as the average soil temperature resulting from the influence of heat from these two opposite directions (Lunardini 1995; Lunardini 1996). In the coastal area, there is also the transmission of heat due to the lateral thermal effect of sea water. This is the third important factor in the degradation of permafrost.
In this paper, we want to draw the attention of the reader to that part of the degradation process which is of much less scientific interest and which may play a very important role in this process, especially in the areas of discontinuous and sporadic permafrost. It is about degradation proceeding from the permafrost base. The aim of the study is to present a hypothesis regarding the general properties of permafrost degradation from below, its general relationship with the climate and degradation of upper part of permafrost in contact with the AL, and in particular to determine the probable extent and speed of degradation from bottom up in comparison the downward degradation from surface. We want to pay attention in particular to the scale and likely consequences of the bottom-up degradation of permafrost. This seems to be an even more serious threat than those occurring due to the downward degradation of permafrost from above. We will also pay attention to the role of sea influence on land permafrost and possible dangers related to this process, which are not well understood so far. To this end, we will show an example of geophysical imaging conducted on the coast of the Wedel Jarlsberg Land in southwestern Spitsbergen. This is linked to the possibility of sea water intrusions on Arctic coasts (Kasprzak et al., 2017; Guimond et al., 2021).
2 Models of Permafrost Degradation
Overall, 81% of the permafrost regions in the Northern Hemisphere are influenced by ecosystems, indicating the dominant role of ecosystems in permafrost stability here. Permafrost driven solely by climate, such as that on the Qinghai-Tibet Plateau, occupies 19% of permafrost regions (Ran et al., 2021). Northeast China also experienced substantial climate warming over the past 60 years and can be used as an indicator of change. The rises in mean annual air and mean annual ground-surface temperatures were higher in permafrost zones than in the seasonal frost zone (Li et al., 2021). Permafrost degradation leads to deterioration of the ecological environment in this cold region. As a result, the belt of larch forests has shifted northwards and wetland areas with symbiotic relationships with permafrost have decreased significantly. Limits of all latitudinal permafrost zones moved northward significantly (Chen et al., 2020).
Downward permafrost degradation develops always when the maximum depth of seasonal thawing exceeds the maximum depth of seasonal freezing, and it generally results in the formation of a talik disconnecting the permafrost from the seasonal frost layer. This type of degradation is divided into four stages: 1) initial degradation, 2) accelerated degradation, 3) layered talik, and 4) finally the conversion of permafrost to seasonal frost (Jin et al., 2006). Three types of permafrost temperature curves may be attributed to these models: 1) Stable permafrost temperature profiles in the continuous permafrost zone with mean annual ground temperatures (MAGT) colder than −1.5°C and thicker permafrost, 2) The degrading permafrost temperature curves along the margins of the discontinuous permafrost zone and in the island permafrost zones, with MAGTs of −0.5 to −1.5°C This type of permafrost is generally thin and thermally unstable, and 3) Phase-changing transitory permafrost temperature curves on the margins of permafrost islands and around taliks with MAGTs generally higher than −0.5°C. Generally, permafrost in these areas is very thin and unstable (Jin et al., 2006). It is important to know also that on the margins of permafrost islands, because of the higher temperatures of unfrozen soils and zero vertical thermal gradients, heat is more easily transferred laterally to permafrost. Therefore, lateral permafrost degradation is predominant in this case (Jin et al., 2006).
According to Wu et al. (2010), the process of permafrost degradation can be divided into five subsequent stages: 1) starting stage, 2) temperature rising stage, 3) zero geothermal gradient stage, 4) talik layers stage, and 5) disappearing stage. There are two modes of perennially frozen ground thawing: from top to bottom and opposite. During the temperature rising stage, when the heat flux in the perennially frozen soil layer is less than that in the unfrozen soil underlying frozen soil layer, the geothermal flux is partly used to thaw the base of permafrost, and permafrost thaws from bottom to top. With the decrease of thermal gradient in the perennially frozen ground, the heat that is used to thaw permafrost base increases, and geothermal heat will be entirely consumed to thaw the base of permafrost until the temperature gradient reaches zero thermal gradient state (Wu et al., 2010). More detailed description of subsurface thermal and hydrogeological processes in permafrost regions and subsurface effects of climate change in cold regions is presented in Kurylyk et al. (2014).
The modes of permafrost degradation are related to the types of permafrost. In the periglacial environment, we can deal with a permafrost medium 1) without ice—frozen rock, or cryotic permafrost, which is not frozen due to increased pressure or mineralization, and 2) with one that contains ice of various origins and in varying amounts. It can be ice-cemented loose sedimentary rock, or massive ice, e.g., of glacial origin.
In the case of ice-free permafrost, its degradation is based on a rise in temperature in the sub-zero temperature range and in decrease in its thickness, followed by a complete disappearance by combining the permafrost base and the permafrost table. In the case of ice-containing permafrost, the degradation process is more complicated and consists not only in the rise in temperature, but also in the melting of the ice it contains, which also causes a variety of mechanical processes involving the material medium which permafrost encompassing, such as thermokarst, landslides, mud flows, and others. These processes are visible on the surface of the ground and they usually cause large changes in the geographical environment, or various threats to human activity. This bipartite process of permafrost degradation has resulted in confusion about assigning them the correct name: melting vs thawing (Grosse et al., 2010). Generally speaking, the term thawing is of course correct, but at the same time it is clear that the ice present in the permafrost eventually melts as it degrades.
In general, it can be assumed that the degradation of permafrost occurs simultaneously from the top—by increasing the AL, from the bottom by raising the permafrost base, and in terms of its internal temperature, which rises in the permafrost layer in the range of negative temperatures (Jin et al., 2006; Wu et al., 2010) (Figure 1). The entire process is initiated from the top—climatically. The downward degradation occurs with the delay associated with the penetration of the medium by the heat wave that reaches the permafrost boundary, the later the thicker it is. In the case of a small difference in temperature, however, it may extinguish before reaching the permafrost base. Then, the degradation does not encompass the entire permafrost layer.
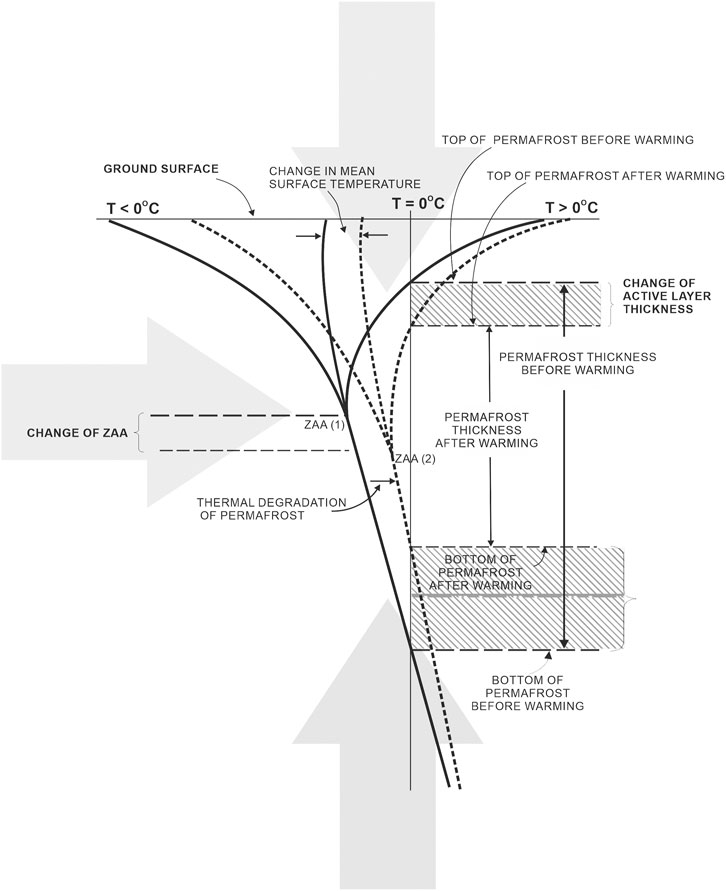
FIGURE 1. General characteristics of permafrost degradation. When a heat wave passes through the entire permafrost layer, it warms the permafrost layer up throughout the entire profile, causing the permafrost table to lower, the ZAA temperature to rise, and the permafrost base to rise.
3 Climatic and Geological Dependencies
Since permafrost is a geological phenomenon resulting from climatic influences, defined as the thermal state of the ground (Lunardini 1995; Everdingen van 2005), its temperature characteristics are therefore the only property that fully and completely describes it. Its thermal state will therefore be a derivative of the climatic components that affect the Earth’s surface. The most direct is the effect of temperature influence. This impact can be very diverse, leading to the formation of various temperature profiles in the permafrost ranging from almost 0 to 1,600 m in depth. In fact, wherever the mean annual air temperature (MAAT) is negative, permafrost can form. Its temperature profile will, however, vary depending on the specificity of the climate - on the one hand, and the geothermal impact—on the other. Other permafrost types, such as those ecosystem-driven, modified, or protected permafrost, will also depend on geo-environmental conditions, such as interrelations with organic soils and surface canopies. Nevertheless, these relationships do not contradict the general principle that is of key importance to the topic under discussion. Some characteristic theoretical profiles relevant to the content of this article are shown in Figure 2.
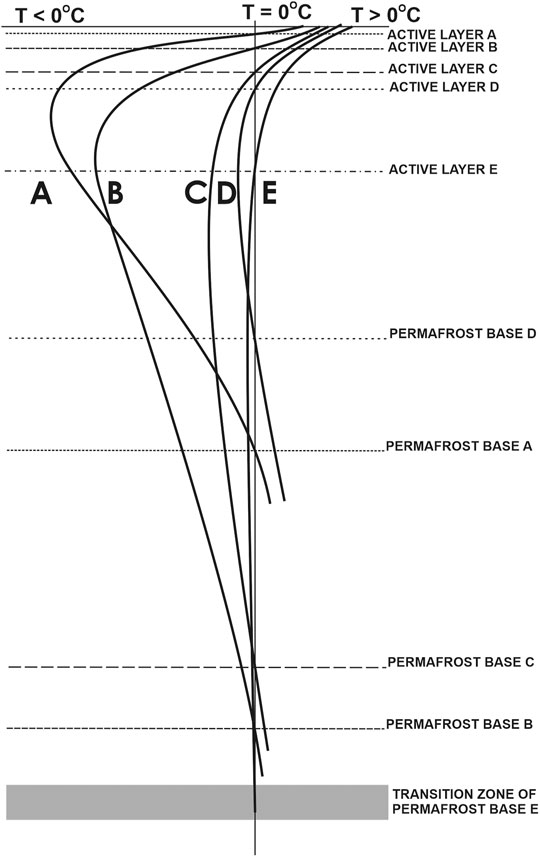
FIGURE 2. Five selected theoretical permafrost thermal profiles. Notes: (A)—cold and thin permafrost layer, high thermal gradients from both directions, (B)—cold and thick permafrost layer, low thermal gradient from below, (C)—warm and thick permafrost layer with low thermal gradient from both sides, (D)—warm and thin permafrost with low thermal gradient from above, and (E)—The zero-gradient profile, mean annual ground temperature is basically at 0°C or at the freezing temperature of soil.
In a very cold climate but high geothermal gradient, permafrost may be “cold”—its temperature at the depth of ZAA point will be low but the thickness will not be great because both: the “cold” gradient coming from above and the “warm” gradient coming from below will be high. This will result in a profile of permafrost having a “boomerang shape” and a relatively large angle between the permafrost temperature line and the 0°C line as shown in Figure 2 (line A). Both the determination of the top and the bottom of the permafrost layer in such a system will be the easiest, because the point at the intersection of the 0°C line with the temperature profile is clear and unambiguous.
In the case of permafrost with a large “cold” gradient flowing from the surface and small heat flux from the depths of the Earth, the permafrost temperature at the ZAA point may also be low and slowly increases with depth, permafrost thickness will be the greatest (Figure 2, line B). Both the top and bottom of the permafrost can be clearly marked.
Another situation arises when the “cold gradient” in the upper part is not great, as is the case in cold maritime climates (Figure 2, line D). Here, the temperature amplitude between winter and summer is much smaller than that in a continental climate. Then, the influence of the cold climate does not produce such a thick layer of permafrost as in the case of B (Figure 2B) because the “cold” wave is extinguished at a shallower depth. However, it also depends on the geothermal degree. In general, this type of permafrost is not very cold, the temperature of ZAA is higher than that of A and B above (Figure 2). The permafrost temperature line and the 0°C line will intersect at a more acute angle than in the above cases, and the determination of the upper and especially the base of permafrost will be much more difficult than in cases A and B. It is also worth noting that due to the different temperature on the surface, as well as the different degree of geothermal heat flux in the ground and the capacity and thermal permeability of the medium, the thickness of the AL does not correlate with the depth of permafrost base location.
The most interesting case from the point of view of this paper is the one where the MAAT is not particularly low and the thermal gradient is also not high. This situation creates the conditions for the formation of a relatively thick permafrost, but with relatively “warm” characteristics (Figure 2C). Its temperature both at the ZAA point and along the entire temperature line will be quite similar an has “shape of bow.” Also, the intersection of the permafrost temperature line with 0°C will have the acute angle. The asymptotic nature of temperature line will make it impossible in practice to unambiguously determine the lower border, i.e., the range of the bottom of permafrost. Such warm permafrost is found especially in the zone of discontinuous and sporadic permafrost occurrence (Smith, 1988).
A particular example of a susceptible permafrost is isothermal permafrost in which there is no temperature gradient (Figure 2E). Permafrost has such thermal characteristics in an advanced state of degradation and its complete disappearance is the fastest. It is caused by a sharp decrease in the permafrost table and an elevation of the permafrost base, the determination of which is difficult due to the temperature close to 0°C
4 Permafrost Degradation From the Surface
As mentioned above, the degradation of permafrost from the surface is the process of particular interest in contemporary research. This process is often limited to the characteristics of the increasing thickness of the AL. Its thickness may increase faster when it includes, for example, coarse rock sediments and the ice content in the permafrost is small. This is because enormous energy is absorbed in the process of permafrost degradation into a phase change—melting of ground ice. The largest amount of such ice is usually near the ground surface. This phase transformation (ice melting) slows down the process of permafrost degradation from the top, i.e., mainly the increase in the thickness of the AL. However, heat penetration into the permafrost is not completely stopped. The released latent heat raises the permafrost temperature also within the negative temperature range, causing the ZAA position to shift towards the positive temperature (Figure 1). In this way, first the upper part of the permafrost temperature line, and then the lower part “moves” towards 0°C line, showing the temperature increase in the permafrost in all its thickness. This process may take shorter or longer time depending on the temperature difference, the thickness of the permafrost, or the thermophysical properties of the heat-conducting rocks. The process of permafrost degradation from the surface is the easiest to observe and measure, because such permafrost is basically available just below the seasonally thawing AL, i.e., at a depth of several dozen centimeters to several meters.
5 Permafrost Degradation From Below
Determining the extent of permafrost degradation from bottom is much more difficult and becomes more complicated as increases in permafrost thickness, also increasing difficulties in measuring temperature or observing phase transformation at great depth. So far there are few publications presenting the results of permafrost bottom studies with the use of indirect geophysical methods. Seismic and electrical resistivity methods are used in the study of thin permafrost (You et al., 2013; Sjöberg et al., 2015), and in the study of the AL and subsurface permafrost in high mountain and Arctic environments (Hauck and Kneisel 2008). Recognition of the process of degradation of permafrost from the bottom, however, may in some cases be crucial for determining the correct extent of permafrost degradation not only in the surface area, but above all in its thickness.
Based on the existing knowledge, it is first necessary to characterize this process theoretically. After a shorter or longer period of time, which is required for the heat to flow into the soil, the temperature rise is either quenched at a certain depth in the permafrost or reaches its floor. As already mentioned, it depends on the magnitude of the thermal gradient in both directions, the thickness of the permafrost and the thermal properties of the medium.
In the case of thin permafrost and in a situation of high thermal gradients, it is relatively easy to define its base, which may be very similar to the upper limit that exists between the AL and the permafrost. In the sediment material, this will be in the immediate vicinity of the overlying, ice-cemented permafrost layer with a water-saturated, unconsolidated sediment layer underneath.
In a thick layer of permafrost and in the case of small thermal gradients, the degradation of permafrost will be slower. The first phase of degradation will be the increasing the temperature of the entire permafrost layer as a result of the slow penetration of the heat wave into the soil. As a result, due to the warming, the temperature profile will change its shape from a “boomerang” (Figure 3A) to an “bow” shape (Figure 3B). The permafrost profile will increasingly approximate the isothermal profile with a very slow, asymptotic approach to the intersection with the 0°C line. The intersection of the permafrost profile with the 0°C temperature line will be at a very sharp angle, which in practice manifests itself in the fact that in a relatively wide depth range there will be a temperature close to 0°C on both the positive and negative sides (Figure 4E). This situation favors the presence of both ice and liquid water. Determining the permafrost base in such an environment is very difficult and the permafrost base (Figure 2E) takes the form of a transition zone rather than a sharp borderline (Elvebakk 2010; Szewczyk and Nawrocki 2011) (Figure 4). In solid rock, apart from temperature variations, the phase changes of water will be basically unnoticeable, but it depends on the porosity of the rock.
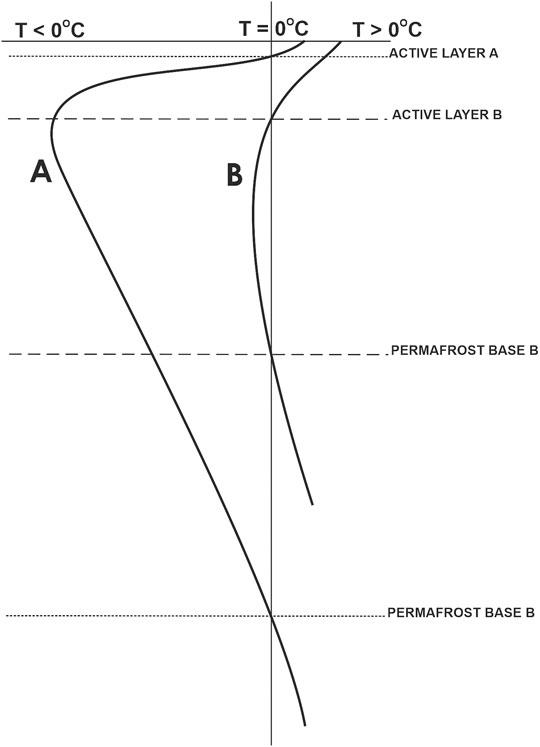
FIGURE 3. General shape of degrading permafrost profile thermal curve. Notes: (A)—initial stage, cold permafrost (boomerang-like shape), (B)—degrading permafrost (bow-like shape). Compare the difference between the amount of degradation of the top (AL) and the bottom of permafrost.
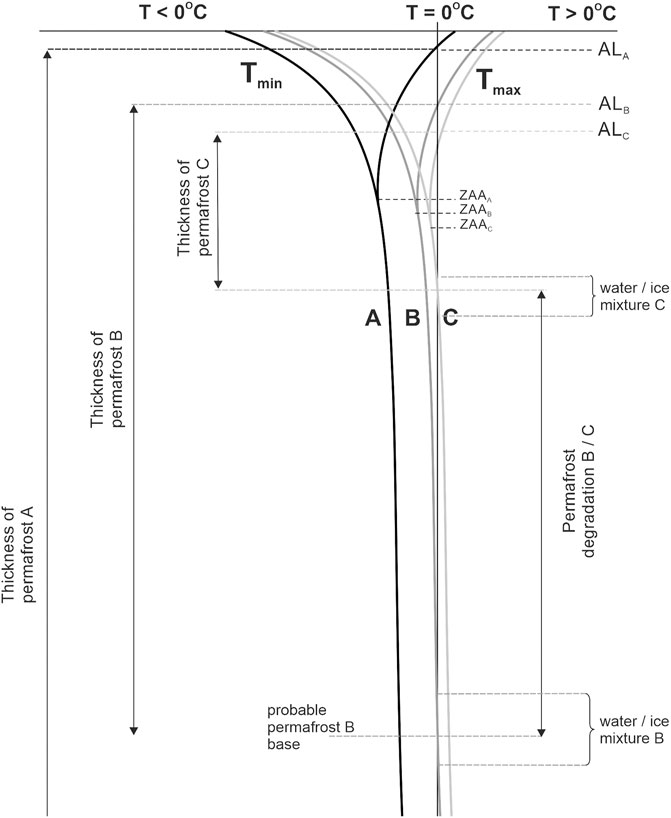
FIGURE 4. Mode of degradation of thick isothermal warm permafrost, general view. Thermal degradation dominates between permafrost profiles (A,B), physical degradation (thawing, and melting of ice) occurs between permafrost profiles (B,C). Compare difference between amount of degradation between AL and permafrost base.
In an empirical sense, the process of permafrost degradation from the bottom-up of thick permafrost is virtually unknown. Therefore, it is particularly important to understand the degradation of such permafrost, especially occurring in the sedimentary material, as it is likely to occur unexpectedly and violently, with serious risks.
The above-mentioned “asymptotic” intersection of the permafrost profile with the 0°C line shows primarily the uncertainty and zonal character of the permafrost base. It should be noted, however, that such property of this border is caused by its enormous potential for “vertical mobility.” When the permafrost profile line is sufficiently close to 0°C line, another heat wave reaching the permafrost base, can move it up greatly, even when the temperature jump is small. Such a rapid degradation process can occur even when the temperature jump is less than 1°C. This move upward of the permafrost base can probably lead to very rapid thawing of the ice included in sedimentary material which may be at phase equilibrium. This process is faster if less ice is used in the earlier cementation of sedimentary material. The latent heat delays the process of the degradation, but depends on amount of water in the ground. We know, however, that in permafrosted ground water/ice is concentrated mainly in its upper subsurface layer rather than its lower part. This is why the disintegration of the sedimentary material on greater depth can take place faster. Figure 4 shows the theoretical course of this process. As a result, in a relatively short period of time, it is difficult to identify threats may arise, especially in the regions of the fastest degradation of permafrost in thick sedimentary material. The difficulty in detecting them lies in the fact that this process takes place underground, often at considerable depth, and may, in principle, go unnoticed until serious mass processes, such as subsidence or sliding, occur. This process is extremely difficult to estimate and, as far as we know, has never been the subject of research, analysis or modeling in a quantitative sense.
The correctness of the hypothetical model presented here is evidenced by all known thermal profiles of permafrost, in which it is clearly visible that their intersection with the 0°C axis always has a sharp angle and a more asymptotic character at the permafrost base than at the permafrost table (Dobiński 2020a). It is also documented by empirical research (Elvebakk 2010; Szewczyk and Nawrocki 2011). It is also shown by the few results of studies on the variability of the entire permafrost layer (Harris 2001; You et al., 2013; Sjöberg et al., 2015; Kasprzak et al., 2017; Czekirda et al., 2019).
6 Permafrost Degradation From the Sea
A large part of the research on permafrost on Arctic coasts is carried out in areas with subsea permafrost, such as in Siberia or Alaska (e.g., Hunter et al., 1988; Rekant et al., 2005; Overduin et al., 2016; Angelopoulos et al., 2020). The presence and conditions of underwater permafrost determines a number of geomorphological processes in this zone. However, the situation is different on those sections of the High Arctic coast where subsea/offshore permafrost is not found. There is a special case of degradation of the terrestrial permafrost both laterally and partially from below, as sea water can directly affect the deeper parts of the substrate. Under favorable conditions, it creates an intrusion of salty and periodically warm water cutting into the land, similarly as it is common in regions of lower latitudes (Cooper et al., 1964; Werner et al., 2012).
This situation was visualized using electrical resistivity tomography (ERT) in 2012 on the west coast of Spitsbergen (Kasprzak et al., 2017) and similarly confirmed by geophysical methods also in other locations (Strzelecki et al., 2017; Kasprzak 2020; Kasprzak et al., 2020; Pedrazas et al., 2020). The presence of sea intrusion leads to the formation of a horizontal “permafrost wedge” subjected to changes under influence of air temperature from above and sea water temperature from below, as shown in Figure 5. A cryo-hydrogeological model of seawater intrusion affecting permafrost was recently proposed by Guimond et al. (2021).
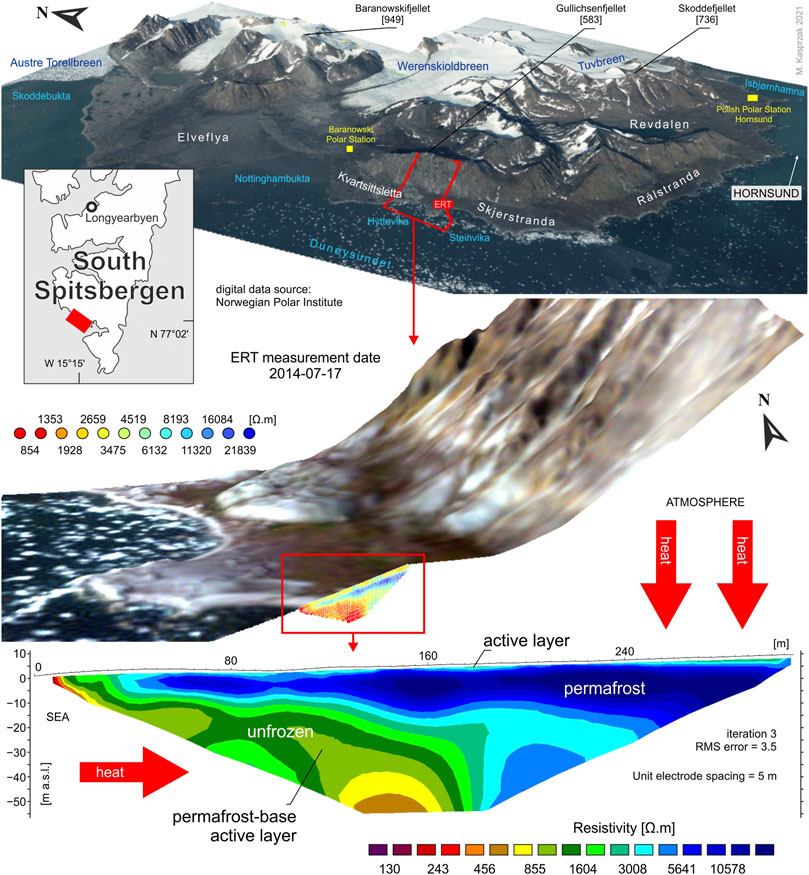
FIGURE 5. Multidirectional permafrost degradation; dominant change in the electrical resistivity of the ground is caused by the intrusion of seawater. Example from the Gulf of Hytte, Svalbard, August 2014. The geoelectric properties in this case refer directly to the temperature of the ground. Frozen rocks lose their ability to conduct electricity. Deep blue colors shows “permafrost wedge” directing towards the sea-shore.
Heat transfer from the sea to the inland is favored not only by the strong summer heating of sea water in the bays of the Greenland Sea near Hornsund, but also the observed changes in the extent and frequency of sea ice. The progressive thawing of permafrost and melting of ground ice of this zone and the retraction of the “permafrost wedge” will result in a lower resistance of the sediment material to erosion and the potential dangers of infrastructure located on the seashore.
7 Permafrost Degradation in Hornsund Area, Spitsbergen
The glacier-free part of the land near the Hornsund Fjord in the southwestern part of Spitsbergen is an area that is particularly exposed to climatic warming. A continuous series of measurements started in 1979 at the Polish Polar Station operating here shows that over 40 years the MAAT increased by over 4°C (Figure 6), increasing on average by 1.14°C per decade (Marsz and Styszyńska 2013; Wawrzyniak and Osuch 2020). It is also worth noting that in 2016 the MAAT was positive in Hornsund (Figure 6). The data clearly suggest that the warming of the air at the surface has been penetrating the ground for several decades, modifying ground temperature and influencing the shape of the permafrost present here. This is not an isolated situation, but rather an example representative of the entire west coast of Spitsbergen (Nordli et al., 2014).
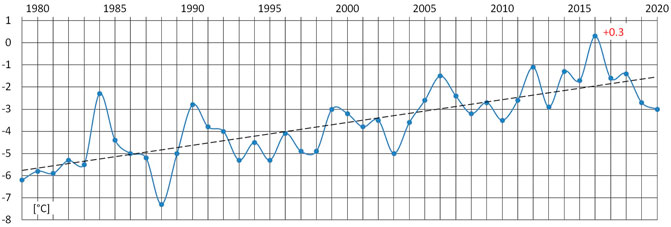
FIGURE 6. Mean annual air temperature measured at the Polish Polar Station in Hornsund. Data based on: Marsz and Styszyńska (2013), Meteorological Bulletin (2009–2020). The graph also shows the trend line (black dashed line).
Permafrost occurring in Svalbard can be divided into two characteristic types (Szafraniec and Dobiński 2020). The first occurs in a very frosty and dry periglacial environment, covering the highest peaks and mountain ridges of Svalbard, which most often appears in the form of nunattacks protruding above the glacial area. The temperature in this area is almost perennially negative, maintaining the occurrence of permafrost, which in this environment reaches 450–500 m deep (Humlum et al., 2003). The second type is permafrost, which includes low-elevation areas of Svalbard, which include coastal areas and the forefields of retreating glaciers. There is a much milder climate here. MAAT is still negative, which allows permafrost to survive and even aggrade in the proglacial forefields. The permafrost thickness in this region is approx. 100 m (Humlum et al., 2003; Wawrzyniak et al., 2016). The latter, however, does not apply to land in the immediate vicinity of the sea. Geophysical surveys conducted in the Hornsund region indicate the thermal impact of the sea reaching inland (Kasprzak et al., 2017). As a result, in the summer period, at an average distance of 50–60 m from the shoreline, permafrost ranging from only a few to approx. 20–30 m. This situation depends on the local shape of the shore and is particularly visible on the protruding parts of land, as it was found on the example of the Wilczek Peninsula (Strzelecki et al., 2017).
8 Discussion
Permafrost degradation is one of the most important warming processes in the cryosphere. Due to the extent of permafrost, which covers more than 25% of the land surface (Dobinski, 2011), this process should receive special attention. So far, however, the research has focused on the upper subsurface layer of freezing soil: the AL and shallow permafrost. Indeed, emissions of CO2 and methane, i.e., gases that can enhance the warming effect, are related to the shallowest (ca. 3 m) layer of soils (Knoblauch et al., 2018). Studies and modeling based on satellite data are particularly popular (e.g., Beck et al., 2015; Jorgenson and Grosse 2016; Trofaier et al., 2017; Hu et al., 2020; Kalinicheva and Shestakova 2021). Unfortunately, this approach is limited and does not include deeper processes. Permafrost degradation, however, in the areas of sporadic and discontinuous permafrost, with favorable climatic conditions may encompass the entire permafrost layer. In the unstable zone permafrost is warming and thinning rapidly. At Xidatan permafrost base has been rising up since 1975, about 20 m in the past 20 years (Jin et al., 1999). The MAGTs at depths of 12–20 m have risen .2–.3°C (Jin et al., 2000). This last publication presents however much more synthetic view on permafrost evolution in China since Quaternary. Therefore, it is worth to remember that permafrost on the Qinghai-Tibet Plateau is largely relict and has been degrading since the Last Glaciation (Wang et al., 2000).
Studies on permafrost degradation in the Russian Arctic by Vasiliev et al. (2020) indicate that since 1970, the average ground temperature at depths of 10–12 m in the zone of continuous permafrost occurrence, has been increasing at an annual average rate of .03–.06°C yr−1. These authors divided permafrost degradation into three main phases. The initial stage of degradation is a gradual increase in AL thickness (ALT) while permafrost temperature remains relatively low. This is due to the protective role of the transition layer, although extremely hot summers can partially thaw it. The second stage, termed “climate-driven, ecosystem-protected permafrost,” is where increased permafrost degradation is initiated after the ground ice in the transition layer has completely thawed. The third and final stage of degradation occurs when the progressive lowering of permafrost table converts the permafrost to a seasonally frozen layer, followed by rising temperatures at the ZAA depth to above 0°C.
The use of deep boreholes in Russian Arctic research also provides direct data on the depth of the permafrost base (Duchkov et al., 1994). Its greatest thickness, exceeding 400–500 m, is found in Yakutia. For this area, the thermal evolution of permafrost in the entire profile was forecasted until 2,200 (Balobaev et al., 2009). The observed and progressive increase in MAAT (from 1960 by 2–2.5°C) will cause changes in permafrost temperature reaching 200–250 m. The currently observed trend causes that in the latitude between 60 and 70° N by 2030–2040 the seasonal thawing of the ground from above may reach 10–15 m and the rate of deepening of the AL may be .2–.3 m yr−1. Degradation of Siberian permafrost may lead to its complete disappearance south of the 62°N especially in areas subjected to strong anthropogenic influence (Balobaev 1991).
The quantitative method of reconstruction of palaeocryogenic conditions, proposed by Balobaev (1991), also allowed the determination of the trend of permafrost changes over a longer period of time, reaching from the Last Glaciation Maximum. Since the period 18–20 thousand years ago, when permafrost covered the vast lowland territory of Western Siberia down to 51–52°N latitude its thickness has decreased by 120–170 m as a result of thawing from below.
Monitoring of permafrost degradation along the Bei’an-Heihe Expressway in the eastern part of Northeast China show a lowered permafrost table and an elevated permafrost base whereas the base of permafrost degraded faster than its table. The results shows also that the rising rate of the permafrost base is higher than the lowering rate of the permafrost table, which has remained at the same depth since 2012, whereas the permafrost base has continued its rising. Rising rate of the permafrost base (0.38 m/yr) is larger than the lowering rate of the permafrost table (0.12 m/yr). During summer months, the groundwater heat can be transmitted also to the permafrost base and causes it to rise faster than the lowering of the permafrost table (Guo et al., 2021). Sun et al. (2020) indicated also, that in Xidatan along the Qinghai-Tibet Highway on the interior Qinghai-Tibetan Plateau, the main degradation mode of the site in the discontinuous zone appeared to be upward thawing from the permafrost base. They argued that when heat from the surface transferred to the permafrost base, because the reduced temperature gradient was less than the geothermal gradient from the geothermal heat flux of the deep stratum, it led to the bottom of the permafrost absorbing heat from the underlying unfrozen soil. Therefore, the permafrost base began to thaw and move upward, which resulted in thinning of the permafrost (Sun et al., 2020).
Studies on Canadian permafrost show that the ALT has increased by an average of 0.39 m. since the end of the Little Ice Age (ca. 1850), while the permafrost base has increased by an average of 3 m (Zhang et al., 2006). The simulation results indicate that in the areas of sporadic permafrost the permafrost base increased by an average of 17 m, and in some places by 50 m, in the last ca. 150 years (Zhang et al., 2006). These data and calculations show that the rate of permafrost degradation from the bottom is on average 10 times greater than that from the ground surface in a large territory of southern Canada which is subject to occurrence of discontinuous and sporadic permafrost. The rise in the permafrost base by this size (50 m) corresponds to an increase in mean annual ground temperature by about .9°C (Zhang et al., 2006). This simulation shows that the thermal response of the permafrost base takes much longer than that of the AL. However, while the AL freezes seasonally and the degradation process is thus stopped, thawing from bottom up can be a continuous process with greater inertia. ALT is determined primarily by summer temperature, while the depth of permafrost base is determined mostly by annual ground temperature as a result; the permafrost base will continue to rise with some lag even if the surface temperature ceases to increase (Zhang et al., 2006).
Thus, it can be seen that while the delay associated with the time needed to penetrate the entire permafrost layer stops the onset of degradation from below, once it has started, the process may be much faster and much more difficult to stop due to the same delay in the surface heat transmission in the permafrost base.
In this respect, the situation is specific on the southern coast of Spitsbergen. As shown in Figure 6, this is an area of particularly strong climate warming, which also translates into changes in the thermal state of the permafrost occurring here. Currently, MAAT no longer indicates that climatic conditions for continuous permafrost may persist, because MAAT is too high and this area may be moved into the category of discontinuous permafrost in next years. This probability is additionally justified by the strong influence of sea water from the fjord. The first show that permafrost in the Hornsund region is already isothermal, with a zero geothermal gradient (Wawrzyniak et al., 2016), which means that the first stage of degradation, i.e., increasing the temperature within the entire permafrost layer, has ended. In the next stage, when the climate does not change, ground temperature may quickly rise to above 0°C and permafrost may disappear first in particularly vulnerable places in southern Spitsbergen.
The disappearance of permafrost on the coast of the Hornsund region does not necessarily have to be associated with the violent mass processes of the melting of ground ice. The thickness of marine and glacial sediments on the Hornsund coast is not great, and most of the solid rock of the substrate is subject to freezing. On the other hand, it is worth noting that in solid rock, where the water content is usually minimal, the ground freezes and thaws much faster, because little energy is used for the ice/water phase change and the amount of latent heat used is low. For this reason, the degradation of permafrost and its complete disappearance may be very fast under these conditions. In particular, therefore, under these conditions, the process shown in Figure 4 may be realized, where, with a slight final rise in soil temperature, the complete disappearance of permafrost may be rapid.
9 Conclusion
Permafrost degradation is a process in which two basic changes can be distinguished: 1) the increasing of permafrost temperature in part or all of its thermal profile, within the negative temperature, and 2) the disappearance of permafrost by increasing soil temperature to a positive value i.e., melting ground ice, which significantly delays the degradation process.
The permafrost decay process starts usually at the surface (in volcanic locations it may change) as a result of the warming. Its first result is an increase in the ALT. It differs primarily depending on the thermal conductivity and heat capacity of the medium, accompanied by soil ice/water content. The heat wave that penetrates the AL raises the temperature gradually, delaying ground warming. However, the progress of degradation and disappearance of permafrost at its base may be usually many times greater and faster than that in contact with the AL.
In the particular case when the permafrost on the coast is sufficiently thin and the seasonal temperature changes encompass the entire permafrost layer, its thickness (the distance between the depths of permafrost table and base) may change seasonally. Such seasonal change at the bottom may be called the bottom AL (Kasprzak et al., 2017; Dobiński 2020b). This process is possible when a relatively thin permafrost is thermally active in its entire volume.
The most likely process that can cause the disappearance of permafrost is the multidirectional degradation of warm isothermal permafrost remaining at a temperature just below 0°C, through the climatic impact, and also indirectly due to the thermal properties of sea water. When the heat wave covers the entire permafrost layer crosses the 0°C border, degradation is the fastest from its lower limit (the base of permafrost), and the disappearance of permafrost from the bottom can be rapid.
The land part of the coast, subjected to the thermal influence of sea water from below, is particularly vulnerable to permafrost thawing. The heat wave from the sea, or the physical intrusion of saline water into the land, determine the thermal conditions of the deeper subsoil. Water temperature changing throughout the year, similarly to the air temperature, drives the intensity and direction of heat transfer.
The described processes may lead to dangerous threats of an unknown scale when they involve not a solid rock, but a layer of sediments cemented with ice. The thicker the layer of ice-poorer loose sediment, and the greater the warming, the greater the risk of the disappearance of permafrost.
The authors are convinced of the necessity of wider involvement in the full recognition of the degradation process and the disappearance of permafrost in the world, with particular emphasis on this process proceeding from below (Burn and Nelson, 2006; Dobiński and Leszkiewicz, 2010).
Data Availability Statement
The original contributions presented in the study are included in the article/supplementary material, further inquiries can be directed to the corresponding author.
Author Contributions
WD developed the concept of the article, wrote chapters 1–5 and 7 made figures 1–4. Both authors MK compiled sections on coastal permafrost degradation—chapter 6 and provided empirical data. He designed and produced Figures 5, 6. Both authors contributed to conclusions, manuscript revision, read, and approved the submitted version.
Funding
MK’s participation in this research was funded by the research project no. 2015/19/D/ST10/02869 of the National Science Center, Poland. Used aerial photographs of the Norwegian Polar Institute were purchased as part of the order ZP. 2420.1.IGRR.ZG.2013 (2013-01-9) financed from statutory funds of the Institute of Geography and Regional Development, University of Wroclaw. Publication partly funded by ‘Excellence Initiative - Research University’ policy of the University of Wrocław, Poland.
Conflict of Interest
The authors declare that the research was conducted in the absence of any commercial or financial relationships that could be construed as a potential conflict of interest.
Publisher’s Note
All claims expressed in this article are solely those of the authors and do not necessarily represent those of their affiliated organizations, or those of the publisher, the editors and the reviewers. Any product that may be evaluated in this article, or claim that may be made by its manufacturer, is not guaranteed or endorsed by the publisher.
Acknowledgments
The authors are grateful to the reviewers for the numerous and valuable comments that helped to shape the manuscript better. We are also especially grateful to the editors: Dongliang Luo and Huijun Jin for the valuable discussion of the work, a series of editorial comments and suggestions for further studies of permafrost degradation.
References
A. A. Marsz, and A. Styszyńska (Editors) (2013). Climate and Climate Change at Hornsund (Svalbard. Gdynia: Gdynia Maritime University), 402.
Angelopoulos, M., Overduin, P. P., Miesner, F., Grigoriev, M. N., and Vasiliev, A. A. (2020). Recent Advances in the Study of Arctic Submarine Permafrost. Permafrost and Periglac Process 31 (1), 442–453. doi:10.1002/ppp.2061
Balobaev, V. T. (1991). Geothermy of the Frozen Zone of the Lithosphere of the Asia North. Novosibirsk: USSR Acad Sci. (in Russian).
Balobaev, V. T., Skachkov, Y. B., and Shender, N. I. (2009). Climate Change and Permafrost Thickness Forecast for Central Yakutia till 2200. Sci. J. Geogr. Nat. Resour. 2, 50–56. (in Russian with Eng. abstract).
Beck, I., Ludwig, R., Bernier, M., Lévesque, E., and Boike, J. (2015). Assessing Permafrost Degradation and Land Cover Changes (1986-2009) Using Remote Sensing Data over Umiujaq, Sub-arctic Québec. Permafrost Periglac. Process. 26 (2), 129–141. doi:10.1002/ppp.1839
Burn, C. R., and Nelson, F. E. (2006). Comment on "A Projection of Severe Near-Surface Permafrost Degradation during the 21st century" by David M. Lawrence and Andrew G. Slater. Geophys. Res. Lett. 33, L21503. doi:10.1029/2006GL027077
Chen, S. S., Zang, S. Y., and Sun, L. (2020). Characteristics of Permafrost Degradation in Northeast China and its Ecological Effects: A Review. Sci. Cold Arid Reg. 12 (1), 1–11. doi:10.3724/SP.J.1226.2020.00001
Cooper, H. H., Kohout, F. A., Henry, H. R., and Glover, R. E. (1964). Sea Water in Coastal Aquifers. Washington DC: US Government Printing Office.
Czekirda, J., Westermann, S., Etzelmüller, B., and Jóhannesson, T. (2019). Transient Modelling of Permafrost Distribution in Iceland. Front. Earth Sci. 7 (130), 1–23. doi:10.3389/feart.2019.00130
Delisle, G. (2007). Near-surface Permafrost Degradation: How Severe during the 21st century. Geophys. Res. Lett. 34, L09503. doi:10.1029/2007GL029323
Dobiński, W., and Leszkiewicz, J. (2010). Active Layer and Permafrost Occurrence in the Vicinity of the Polish Polar Station, Hornsund, Spitsbergen in the Light of Geophysical Research. Probl. Klimat. Pol. 20, 129–142. (in Polish with English summary).
Dobinski, W. (2011). Permafrost. Earth-Science Rev. 108, 158–169. doi:10.1016/j.earscirev.2011.06.007
Dobiński, W. (2020a). Permafrost Active Layer. Earth-Science Rev. 208, 103301. doi:10.1016/j.earscirev.2020.103301
Dobiński, W. (2020b). Northern Hemisphere permafrost extent: Drylands, glaciers and sea floor. Comment to the paper: Obu, J., et al. 2019. Northern Hemisphere permafrost map based on TTOP modeling for 2000-2016 at 1 km2 scale, Earth Science Reviews, 193, 299-316. Earth-sci. Rev. 203, 103037. doi:10.1016/j.earscirev.2019.103037
Duchkov, A. D., Balobaev, V. T., and Volodko, B. V. (1994). Temperature, Permafrost and Radiogenic Heat Production in the Earth's Crust of Northern Asia. RAS, Novosibirsk: Rus. with Eng. summary..
Elvebakk, H. (2010). Results of Borehole Logging in Well LYB CO2, Dh4 of 2009, Longyearbyen, Svalbard. NGU Rep. 2010.018. Trondheim: Geological Survey of Norway, 35.
Everdingen van, R. O. (2005). Multi-language Glossary of Permafrost and Related Ground-Ice Terms. Definitions. Calgary, Alberta: U. Calgary, IPA.
Frey, K. E., and McClelland, J. W. (2009). Impacts of Permafrost Degradation on Arctic River Biogeochemistry. Hydrol. Process. 23, 169–182. doi:10.1002/hyp.7196
Grosse, G., Romanovsky, V., Nelson, F. E., Brown, J., and Lewkowicz, A. G. (2010). Why Permafrost Is Thawing, Not Melting. Eos Trans. Am. Geophys. Union 91 (9), 87. doi:10.1029/2010eo090003
Guimond, J. A., Mohammed, A. A., Walvoord, M. A., Bense, V. F., and Kurylyk, B. L. (2021). Saltwater Intrusion Intensifies Coastal Permafrost Thaw. Geophys. Res. Lett. 48, e2021GL09477. doi:10.1029/2021GL094776
Guo, Y., Shan, W., Zhang, C., Hu, Z., Wang, S., and Gao, J. (2021). Monitoring of Permafrost Degradation along the Bei'an-Heihe Expressway in China. Bull. Eng. Geol. Environ. 80, 1–10. doi:10.1007/s10064-020-01919-3
Harris, S. A. (2001). Twenty Years of Data on Climate – Permafrost – Active Layer Variations at Lower Limit of alpine Permafrost, Marmot Basin, Jasper National Park, Canada. Geogr. Ann. Ser. A-phys. Geogr. 83 A (1–2), 1–13. doi:10.1111/j.0435-3676.2001.00140.x
Hauck, C., and Kneisel, C. (2008). Applied Geophysics in Periglacial Environment. Cambridge University Press.
Hjort, J., Karjalainen, O., Aalto, J., Westermann, S., Romanovsky, V. E., Nelson, F. E., et al. (2018). Degrading Permafrost Puts Arctic Infrastructure at Risk by Mid-century. Nat. Commun. 9, 5147. doi:10.1038/s41467-018-07557-4
Hu, J., Zhao, S., Nan, Z., Wu, X., Sun, X., and Cheng, G. (2020). An Effective Approach for Mapping Permafrost in a Large Area Using Subregion Maps and Satellite Data. Permafrost and Periglac Process 31 (4), 548–560. doi:10.1002/ppp.2068
Humlum, O., Instanes, A., and Sollid, J. L. (2003). Permafrost in Svalbard: a Review of Research History, Climatic Background and Engineering Challenges. Polar Res. 22, 191–215. doi:10.3402/polar.v22i2.6455
Hunter, J. A., Mac Aulay, H. A., Pullan, S. E., Gagné, R. M., Burns, R. A., and Good, R. L. (1988). “Thermal Evidence for an Active Layer on the Seabottom of the Canadian Beaufort Sea Shelf,” in Proceeding of the Permafrost. Fifth International Conference, Trondheim, August 2–5 1988 (Tapir Pub.), Vol. 2 949–954.
Jin, H., Cheng, G., Li, X., Li, S. X., et al. (1999). Permafrost on the Qinghai-Tibet Plateau under a Warming Climate. Chin. Sci Bull 44 (S1), 152–158. doi:10.1007/bf02885940
Jin, H., Li, S., Cheng, G., Shaoling, W., and Li, X. (2000). Permafrost and Climatic Change in China. Glob. Planet. Change 26, 387–404. doi:10.1016/s0921-8181(00)00051-5
Jin, H., Zhao, L., Wang, S., and Jin, R. (2006). Thermal Regimes and Degradation Modes of Permafrost along the Qinghai-Tibet Highway. Sci. China Ser. D 49 (11), 1170–1183. doi:10.1007/s11430-006-2003-z
Jorgenson, M. T., and Grosse, G. (2016). Remote Sensing of Landscape Change in Permafrost Regions. Permafrost Periglac. Process. 27 (4), 324–338. doi:10.1002/ppp.1914
Jorgenson, M. T., Racine, C. H., Walters, J. C., and Osterkamp, T. E. (2001). Permafrost Degradation and Ecological Changes Associated with a Warming Climate in Central Alaska. Clim. Chang. 48, 551–579. doi:10.1023/A:1005667424292
Kalinicheva, S. V., and Shestakova, A. A. (2021). Using thermal Remote Sensing in the Classification of Mountain Permafrost Landscapes. J. Mountain Sci. 18 (3), 635–645. doi:10.1007/s11629-020-6475-7
Kasprzak, M., Łopuch, M., Głowacki, T., and Milczarek, W. (2020). Evolution of Near-Shore Outwash Fans and Permafrost Spreading under Their Surface: A Case Study from Svalbard. Remote Sensing 12 (3), 482. doi:10.3390/rs120304810.3390/rs12030482
Kasprzak, M. (2020). Seawater Intrusion on the Arctic Coast (Svalbard): The Concept of Onshore-Permafrost Wedge. Geosciences 10 (349), 349–411. doi:10.3390/geosciences10090349
Kasprzak, M., Strzelecki, M. C., Traczyk, A., Kondracka, M., Lim, M., and Migała, K. (2017). On the Potential for a Bottom Active Layer below Coastal Permafrost: the Impact of Seawater on Permafrost Degradation Imaged by Electrical Resistivity Tomography (Hornsund, SW Spitsbergen). Geomorphology 293, 347–359. doi:10.1016/j.geomorph.2016.06.013
Knoblauch, C., Beer, C., Liebner, S., Grigoriev, M. N., and Pfeiffer, E.-M. (2018). Methane Production as Key to the Greenhouse Gas Budget of Thawing Permafrost. Nat. Clim Change 8, 309–312. doi:10.1038/s41558-018-0095-z
Kurylyk, B. L., MacQuarrie, K. T. B., and McKenzie, J. M. (2014). Climate Change Impacts on Groundwater and Soil Temperatures in Cold and Temperate Regions: Implications, Mathematical Theory, and Emerging Simulation Tools. Earth-Science Rev. 138, 313–334. doi:10.1016/j.earscirev.2014.06.006
Lawrence, D. M., and Slater, A. G. (2005). A Projection of Severe Near-Surface Permafrost Degradation during the 21st century. Geophys. Res. Lett. 32, L24401. doi:10.1029/2005GL025080
Li, X., Jin, H., Sun, L., Wang, H., He, R., Huang, Y., et al. (2021). Climate Warming over 1961-2019 and Impacts on Permafrost Zonation in Northeast China. J. For. Res. doi:10.1007/s11676-021-01403-y
Liljedahl, A. K., Boike, J., Daanen, R. P., Fedorov, A. N., Frost, G. V., Grosse, G., et al. (2016). Pan-Arctic Ice-Wedge Degradation in Warming Permafrost and its Influence on Tundra Hydrology. Nat. Geosci 9, 312–318. doi:10.1038/ngeo2674
Lunardini, V. J. (1996). Climatic Warming and the Degradation of Warm Permafrost. Permafrost Periglac. Process. 7, 311–320. doi:10.1002/(sici)1099-1530(199610)7:4<311:aid-ppp234>3.0.co;2-h
Lunardini, V. J. (1995). Permafrost Formation Time. CRREL Report 95-8. US Army Corps of Engineers, Cold Regions Research and Engineering Laboratory.
Luo, D., Jin, H., Bense, V. F., Jin, X., and Li, X. (2020). Hydrothermal Processes of Near-Surface Warm Permafrost in Response to strong Precipitation Events in the Headwater Area of the Yellow River, Tibetan Plateau. Geoderma 376, 114531. doi:10.1016/j.geoderma.2020.114531
Luo, D., Jin, H., Jin, X., He, R., Li, X., Muskett, R. R., et al. (2018). Elevation-dependent thermal Regime and Dynamics of Frozen Ground in the Bayan Har Mountains, Northeastern Qinghai-Tibet Plateau, Southwest China. Permafrost and Periglac Process 29 (4), 257–270. doi:10.1002/ppp.1988
Meteorological Bulletin (2009–2020). Spitsbergen – Hornusnd, Summary of the Years 2009–2020. Polish Polar Station. Warszawa: Institute of Geophysics, Polish Academy of Sciences. Available from: https://hornsund.igf.edu.pl/Biuletyny/(Accessed September 1, 2021).
Nordli, Ø., Przybylak, R., Ogilvie, A. E. J., and Isaksen, K. (2014). Long-term Temperature Trends and Variability on Spitsbergen: the Extended Svalbard Airport Temperature Series, 1898-2012. Polar Res. 33 (1), 21349. doi:10.3402/polar.v33.21349
Oliva, M., Pereira, P., and Antoniades, D. (2018). The Environmental Consequences of Permafrost Degradation in a Changing Climate. Sci. Total Environ. 616-617, 435–437. doi:10.1016/j.scitotenv.2017.10.285
Overduin, P. P., Wetterich, S., Günther, F., Grigoriev, M. N., Grosse, G., Schirrmeister, L., et al. (2016). Coastal Dynamics and Submarine Permafrost in Shallow Water of the central Laptev Sea, East Siberia. The Cryosphere 10, 1449–1462. doi:10.5194/tc-10-1449-2016
Pedrazas, M. N., Cardenas, M. B., Demir, C., Watson, J. A., Connolly, C. T., and McClelland, J. W. (2020). Absence of Ice-Bonded Permafrost beneath an Arctic Lagoon Revealed by Electrical Geophysics. Sci. Adv. 6 (43), eabb5083. doi:10.1126/sciadv.abb5083
Ran, Y., Jorgenson, M. T., Li, X., Jin, H., Wu, T., Li, R., et al. (2021). Biophysical Permafrost Map Indicates Ecosystem Processes Dominate Permafrost Stability in the Northern Hemisphere. Environ. Res. Lett. 16 (9), 095010. doi:10.1088/1748-9326/ac20f3
Rekant, P., Cherkashev, G., Vanstein, B., and Krinitsky, P. (2005). Submarine Permafrost in the Nearshore Zone of the Southwestern Kara Sea. Geo-mar. Lett. 25 (2–3), 183–189. doi:10.1007/s00367-004-0199-5
Shi, Y., Niu, F., Lin, Z., and Luo, J. (2019). Freezing/thawing index Variations over the Circum-Arctic from 1901 to 2015 and the Permafrost Extent. Sci. Total Environ. 660, 1294–1305. doi:10.1016/j.scitotenv.2019.01.121
Sjöberg, Y., Marklund, P., Pettersson, R., and Lyon, S. W. (2015). Geophysical Mapping of Palsa Peatland Permafrost. The Cryosphere 9, 465–478. doi:10.5194/tc-9-465-2015
Smith, M. W. (1988). The Significance of Climatic Change for the Permafrost Environment Permafrost. Fifth International Conference, 3. Trondheim: Tapir Pub., 18–23.
Streletskiy, D., Anisimov, O., and Vasiliev, A. (2015). “Permafrost Degradation,” in Snow And Ice-Related Hazards, Risks, and Disasters. Editors W. Haeberli, and C. Whiteman (Elsevier), 303–344. doi:10.1016/B978-0-12-394849-6.00010-X
Strzelecki, M. C., Kasprzak, M., Lim, M., Swirad, Z. M., Jaskólski, M., Pawłowski, Ł., et al. (2017). Cryo-conditioned Rocky Coast Systems: A Case Study from Wilczekodden, Svalbard. Sci. Total Environ. 607-608, 443–453. doi:10.1016/j.scitotenv.2017.07.009
Sun, Z., Zhao, L., Hu, G., Qiao, Y., Du, E., Zou, D., et al. (2020). Modeling Permafrost Changes on the Qinghai-Tibetan Plateau from 1966 to 2100: A Case Study from Two Boreholes along the Qinghai-Tibet Engineering Corridor. Permafrost and Periglac Process 31, 156–171. doi:10.1002/ppp.2022
Szafraniec, J. E., and Dobiński, W. (2020). Deglaciation Rate of Selected Nunataks in Spitsbergen, Svalbard-Potential for Permafrost Expansion above the Glacial Environment. Geosciences 10 (5), 202. doi:10.3390/geosciences10050202
Szewczyk, J., and Nawrocki, J. (2011). Deep-seated Relict Permafrost in Northeastern Poland. Boreas 40, 385–388. doi:10.1111/j.1502-3885.2011.00218.x
Trofaier, A. M., Westermann, S., and Bartsch, A. (2017). Progress in Space-Borne Studies of Permafrost for Climate Science: Towards a Multi-ECV Approach. Remote Sensing Environ. 203, 55–70. doi:10.1016/j.rse.2017.05.021
Vasiliev, A. A., Drozdov, D. S., Gravis, A. G., Malkova, G. V., Nyland, K. E., and Streletskiy, D. A. (2020). Permafrost Degradation in the Western Russian Arctic. Environ. Res. Lett. 15, 045001. doi:10.1088/1748-9326/ab6f12
Wang, S., Jin, H., Li, S., and Lin, Z. (2000). Permafrost Degradation on the Qinghai-Tibet Plateau and its Environmental Impacts. Permafr Periglac Process 11 (1), 43–53. doi:10.1002/(sici)1099-1530(200001/03)11:1<43:aid-ppp332>3.0.co;2-h
Wawrzyniak, T., and Osuch, M. (2020). A 40-year High Arctic Climatological Dataset of the Polish Polar Station Hornsund (SW Spitsbergen, Svalbard). Earth Syst. Sci. Data 12, 805–815. doi:10.5194/essd-12-805-2020
Wawrzyniak, T., Osuch, M., Napiórkowski, J., and Westermann, S. (2016). Modelling of the thermal Regime of Permafrost during 1990-2014 in Hornsund, Svalbard. Polish Pol. Res. 37 (2), 219–242. doi:10.1515/popore-2016-0013
Werner, A. D., Ward, J. D., Morgan, L. K., Simmons, C. T., Robinson, N. I., and Teubner, M. D. (2012). Vulnerability Indicators of Sea Water Intrusion. Groundwater 50 (1), 48–58. doi:10.1111/j.1745-6584.2011.00817.x
Wu, J., Sheng, Y., Wu, Q., and Wen, Z. (2010). Processes and Modes of Permafrost Degradation on the Qinghai-Tibet Plateau. Sci. China Ser. D-earth Sci. 53 (1), 150–158. doi:10.1007/s11430-009-0198-5
Yang, M., Nelson, F. E., Shiklomanov, N. I., Guo, D., and Wan, G. (2010). Permafrost Degradation and its Environmental Effects on the Tibetan Plateau: A Review of Recent Research. Earth-Science Rev. 103 (1–2), 31–44. doi:10.1016/j.earscirev.2010.07.002
Yin, G., Luo, J., Niu, F., Lin, Z., and Liu, M. (2021). Thermal Regime and Variations in the Island Permafrost Near the Northern Permafrost Boundary in Xidatan, Qinghai-Tibet Plateau. Front. Earth Sci. 9, 708630. doi:10.3389/feart.2021.708630
You, Y., Yu, Q., Pan, X., Wang, X., and Guo, L. (2013). Application of Electrical Resistivity Tomography in Investigating Depth of Permafrost Base and Permafrost Structure in Tibetan Plateau. Cold Regions Sci. Tech. 87, 19–26. doi:10.1016/j.coldregions.2012.11.004
Keywords: permafrost, permafrost base, active layer, permafrost degradation, hornsund, svalbard
Citation: Dobiński W and Kasprzak M (2022) Permafrost Base Degradation: Characteristics and Unknown Thread With Specific Example From Hornsund, Svalbard. Front. Earth Sci. 10:802157. doi: 10.3389/feart.2022.802157
Received: 26 October 2021; Accepted: 12 January 2022;
Published: 16 February 2022.
Edited by:
Dongliang Luo, Northwest Institute of Eco-Environment and Resources (CAS), ChinaReviewed by:
Huijun Jin, Northeast Forestry University, ChinaAlexander N. Fedorov, Melnikov Permafrost Institute (RAS), Russia
Copyright © 2022 Dobiński and Kasprzak. This is an open-access article distributed under the terms of the Creative Commons Attribution License (CC BY). The use, distribution or reproduction in other forums is permitted, provided the original author(s) and the copyright owner(s) are credited and that the original publication in this journal is cited, in accordance with accepted academic practice. No use, distribution or reproduction is permitted which does not comply with these terms.
*Correspondence: Wojciech Dobiński, wojciech.dobinski@us.edu.pl