Origin and Periodic Behavior of Short Duration Signals Recorded by Seismometers at Vestnesa Ridge, an Active Seepage Site on the West-Svalbard Continental Margin
 P. Domel
 S. Singhroha
 A. Plaza-Faverola
 V. Schlindwein
 H. Ramachandran
 S. Bünz1
- 1CAGE—Centre for Arctic Gas Hydrate, Environment and Climate, Department of Geosciences, UiT The Arctic University of Norway, Tromsø, Norway
- 2Alfred Wegener Institute, Helmholtz Centre for Polar and Marine Research, Bremerhaven, Germany
- 3University of Bremen, Faculty of Geosciences, Bremen, Germany
Short duration events (SDEs) are reported worldwide from ocean-bottom seismometers (OBSs). Due to their high frequency (4–30 Hz) and short duration, they are commonly attributed to aseismic sources, such as fluid migration related processes from cold seeps, biological signals, or noise. We present the results of a passive seismic experiment that deployed an OBS network for 10-month (October 2015–July 2016) at an active seepage site on Vestnesa Ridge, West Svalbard continental margin. We characterize SDEs and their temporal occurrence using the conventional short-time-average over long-time-average approach. Signal periodograms show that SDEs have periodic patterns related to solar and lunar cycles. A monthly correlation between SDE occurrences and modelled tides for the area indicates that tides have a partial control on SDEs recorded over 10 months. The numbers of SDEs increase close to the tidal minima and maxima, although a correlation with tidal highs appears more robust. Large bursts of SDEs are separated by interim quiet cycles. In contrast, the periodicity analysis of tremors shows a different pattern, likely caused by the effect of tidally controlled underwater currents on the instrumentation. We suggest that SDEs at Vestnesa Ridge may be related to the dynamics of the methane seepage system which is characterized by a complex interaction between migration of deep sourced fluids, gas hydrate formation and seafloor gas advection through cracks. Our observation from this investigated area offshore west-Svalbard, is in line with the documentation of SDEs from other continental margins, where micro-seismicity and gas release into the water column are seemingly connected.
1 Introduction
Ocean-bottom seismometers (OBSs) are usually deployed in marine settings to investigate local seismicity of an area by monitoring earthquakes (e.g., Grevemeyer et al., 2015; Meier et al., 2021) or long-duration tremors (e.g., Monigle et al., 2009; Hsu et al., 2013; Franek et al., 2014).
In addition to earthquakes and tremors, OBSs often record signals commonly referred to as short duration events (SDEs) (e.g., Díaz et al., 2007; Tary et al., 2012; Franek et al., 2017). SDEs are characterized by a single pulse of a short (usually <1 s) duration with no discernible P and S phases, a relatively high (at least 4–30 Hz) frequency content, and a strong signal/noise ratio (Batsi et al., 2019). Although the general frequency range lies between 4–30 Hz, higher upper limits (reaching Nyquist frequency of the specific record—50 Hz), has been reported (Sgroi et al., 2014). Recorded SDEs also have variations in their signal characteristics, duration, periodicity and directionality, but similar types of signals have been recorded in different geological settings (Tary et al., 2012). The underlying mechanisms for variations in SDEs are not yet completely understood (e.g., Ugalde et al., 2019).
Recent experiments show the potential of using OBS recordings as a tool to study the long-term variability of the gas seepage and fluid movements through the analysis of SDEs (e.g., Franek et al., 2017; Batsi et al., 2019; Tsang-Hin-Sun et al., 2019). It is believed that there is a strong link between SDEs and fracture-controlled fluid migration. Laboratory experiments (Batsi et al., 2019), as well as several field studies (Sultan et al., 2011; Tary et al., 2012; Hsu et al., 2013; Embriaco et al., 2014; Franek et al., 2014; Liu et al., 2018; Ugalde et al., 2019), link SDEs in recorded signals to fluid movements in the subsurface.
Other existing and proposed origins of SDEs in marine environments include hydraulic fracturing and pressure transients in hydrothermal systems (Sohn et al., 1995; Bowman and Wilcock, 2013), pressure fluctuations in fluid pathways (Díaz et al., 2007), underwater currents (Chang et al., 2016; Ugalde et al., 2019), and fracture opening due to strong local earthquakes (Tsang-Hin-Sun et al., 2019). Some studies also hypothesize about biological sources of SDEs (e.g., fish and marine mammals) (Buskirk et al., 1981; Bowman and Wilcock, 2013; Batsi et al., 2019). In few cases, when SDE occurrences coincide with the initial stage of long-term experiments, mechanical coupling of the OBS at the sea bottom has been proposed as the source of SDEs (Ostrovsky, 1989).
The natural release of hydrocarbon gases from the seafloor at continental margins is widespread (e.g., Judd and Hovland, 2007; Römer et al., 2014; Mau et al., 2017). Factors such as changes in ice sheet thickness (Cremiere et al., 2016; Wallmann et al., 2018; Himmler et al., 2019), geological processes in the subsurface and local tectonic activity (Himmler et al., 2019; Plaza-Faverola and Keiding, 2019; Ciotoli et al., 2020), variations in the gas hydrate stability zone (Taylor et al., 2000; Crutchley et al., 2014; Mishra et al., 2020), changes in sea water temperature over geological times (Thomsen et al., 2012; Berndt et al., 2014; Cremiere et al., 2016) and sedimentation (Horozal et al., 2017; Karstens et al., 2018) create changes in seepage intensity and distribution over geological timescales (Etiope, 2015). Some studies attribute fluctuations in the seepage intensity to seasonal changes in the seawater temperature (Berndt et al., 2014; Embriaco et al., 2014; Ferré et al., 2020). Other studies link small diurnal-scale variations in gas seepage to tides (Boles et al., 2001; Hsu et al., 2013; Römer et al., 2016; Riedel et al., 2018; Sultan et al., 2020).
Seasonal and diurnal variations in the seepage activity have been primarily studied using backscattering from gas bubbles observed in sonar data (e.g., Veloso et al., 2015), direct in-situ observations using underwater cameras (e.g., Beccari et al., 2020; Di et al., 2020), and with sensors mounted at ocean-bottom observatories (e.g., Boles et al., 2001; Kvenvolden et al., 2001). Observations of the seepage periodicity using ship-mounted sonar data are dependent on the cruise time availability and therefore short-term and infrequent. Remotely operated vehicles (ROVs) for direct imaging are costly and not suitable for monitoring seepage activity for several hours. In contrast, long term OBS experiments can last more than a year and provide a continuous record of seismicity, allowing the investigation of the periodicity of SDE occurrences and their potential correlation to seepage activity.
In this study, we report on SDE occurrences in 10-month-long OBS recordings from an actively seeping pockmark on Vestnesa Ridge, a sedimentary ridge located offshore west-Svalbard. We study patterns of occurrence and intensity of SDEs in a deep marine Arctic geological setting and discuss their potential link with gas seepage dynamics.
1.1 Geological Setting
Vestnesa Ridge is a ca. 60 km long contourite drift located on west-Svalbard continental margin between North Atlantic mid-ocean ridge and Svalbard Archipelago (Eiken and Hinz, 1993; Howe et al., 2007; Hustoft et al., 2009) (Figure 1A). Molloy and Spitsbergen transform faults bound the ridge to the south and the north, respectively. The ridge consists of turbidites, hemipelagic and glaciomarine sediments (Eiken and Hinz, 1993; Ottesen et al., 2005) distributed along a northwest-southeast orientated eastern segment and an east-west orientated western segment (Vogt and Crane, 1994; Ritzmann et al., 2004; Plaza-Faverola et al., 2014).

FIGURE 1. (A) Regional map showing the study area. VR-Vestnesa Ridge, MR-Molloy Ridge, MTF—Molloy Transform Fault, STF—Spitsbergen Transform Fault and KR—Knipovich Ridge; (B) OBS deployment locations around Lunde pockmark, projected over the seafloor bathymetry from depth converted 3D seismic data (e.g., Singhroha et al., 2019), with the micro-bathymetry at the pockmark (Himmler et al., 2019; Hong et al., 2021); approximate seepage locations marked by yellow outlines; (C) Seismic transect highlighting the seepage structure beneath Lunde; (D–F) Sub-bottom profiles illustrating the location of the OBSs with respect to near-surface fluid migration features.
Vestnesa Ridge hosts a broadly investigated gas hydrate system (Hustoft et al., 2009; Panieri et al., 2017; Pape et al., 2020; Plaza-Faverola et al., 2017). The presence of a bottom simulating reflection, a seismic boundary created by acoustic impedance contrast at the base of the gas hydrate stability zone (Shipley et al., 1979), establishes and constrains the gas hydrate system along the entire ridge (Bünz et al., 2012; Plaza-Faverola et al., 2017). Hydrocarbon gases seep through selected pockmarks in the eastern segment of the ridge (Bünz et al., 2012; Plaza-Faverola et al., 2015; Singhroha et al., 2019; Smith et al., 2014). Gas hydrate is not the main controller of the seepage at the site, however. Systems of faults and fractures control the underlying fluid migration pathways and chimneys, and thus, the distribution of pockmarks (Figure 1C) (Plaza-Faverola et al., 2015; Singhroha et al., 2019, 2020). The spatial and temporal distribution of seepage features along the sedimentary ridge has been linked to dynamic forcing from mid-ocean ridge spreading and from glacial isostatic rebound (Schneider et al., 2018; Himmler et al., 2019; Plaza-Faverola and Keiding, 2019). Studies based on sediment proxies suggest that there is a link between seepage episodes and glacial cycles during the latest glaciations (Schneider et al., 2018; Himmler et al., 2019).
Annual multi-beam and single-beam sonar surveys show that acoustic flares in the water column (i.e., reaching heights of up to ∼800 m) are restricted to the eastern Vestnesa Ridge segment (Bünz et al., 2012; Smith et al., 2014). The presence of seemingly dormant pockmarks on the ridge crest, especially towards the western segment, where there is no evidence of present-day advective seepage, suggests paleo-seepage at many locations along the ridge (Vogt and Crane, 1994; Petersen et al., 2010; Consolaro et al., 2015). Radio isotopic dating of authigenic carbonates extracted from shallow sediments shows three methane seepage episodes around ∼160 to 133 ka, ∼50 to 40 ka, and ∼20 to 5 ka, that directly correspond to the episodes of glaciation and de-glaciation in the area (Himmler et al., 2019). Based on this information, it is suggested that glacial tectonics is one of the dominant forces driving the seepage on geological time scales.
Sonar data collected during numerous expeditions to the area show the presence of gas flares only from six pockmarks on the eastern side of the ridge (Smith et al., 2014). Pockmark Lunde is the one with the largest acoustic flare observed and it is in the near vicinity (<1 km) of another active pockmark (i.e., Lomvi (Panieri et al., 2017)). These pockmarks are ∼300–400 m wide complex structures, containing both small-scale (<1 m) features and depressions up to 50 m in diameter (Figure 1B) that focus most of the seepage (Panieri et al., 2017). Diffusive gas release is likely to take place as well within the pockmarks, outside the pits. The presence of acoustic flares in the water column has been documented from three such pits at each pockmark (Panieri et al., 2017). Biological markers obtained from gravity cores indicate periodic variations in seepage on a scale of 1 ka years, possibly due to fault reactivation (Ambrose et al., 2015). Sampling of authigenic carbonate (Himmler et al., 2019) inside Lunde provided ground truth data for the widespread inference of past methane seepage events based on high resolution 3D seismic data (Plaza-Faverola et al., 2015).
2 Data and Methods
2.1 Data
We deployed five LOBSTER type OBSs (Stähler et al., 2018) around the Lunde pockmark (Figure 1) to study the potential link between seismicity and seepage. Upon recovery of the OBSs we have lost one data unit to the sea and discovered that another unit has not recorded any data, leaving only 3 instruments for further study (OBSs 1, 4 and 5; Figure 1). The entire experiment lasted from October 2015 to July 2016. All OBSs were equipped with a three-component short-period seismometer (with 4.5 Hz corner frequency), and a hydrophone attached to the OBS frame at a ∼0.5-m height from the sea bottom. Each seismometer was attached to a metal rod extending from the OBS frame, mechanically uncoupled and dropped directly onto the seafloor after approximately 1 h. By using this approach, we achieved direct contact with sediments and improved coupling of the seismometers.
The OBSs were deployed in with the free-fall approach at a water depth of ca. 1,200 m. Seismic lines were shot over the OBSs with the intention to precisely relocate the OBSs at the seafloor using times of direct wave arrivals (e.g., Plaza-Faverola et al., 2010). However, problems with the time records for the shots hampered improved relocation efforts. Thus, in this study, we used OBS positions registered during deployment. Since we did not attempt event location, the OBS position accuracy was not critical.
The instruments recorded with 20 ms (OBS-1) and 5 ms (OBS-4 and OBS-5) sampling intervals. This corresponds to the Nyquist frequency of 25 Hz for OBS-1 and 100 Hz for OBS-4 and OBS-5. All these data cover roughly the duration of the deployment (10.2015–07.2016), excluding the first two weeks of October 2015, when OBSs were settling on the sediment. Data quality of OBS-1 and OBS-4 is better than OBS-5. OBS-1 shows a consistent recorded signal throughout the entire deployment period. OBS-4 and OBS-5 have some periods (∼up to week-long at times), where the recorded signal quality is unsatisfactory for analysis. During the first month of operation, OBS-5 recorded almost no signals of any kind, possibly due to poor coupling between the seismometer and the seafloor.
2.2 Preprocessing
We converted the whole dataset into day-long mseed-format files and visually inspected the overall quality of the data. Subsequently we verified that known earthquakes (i.e., recorded by the nearby land stations at Svalbard) are present in the recording, that the signal quality is satisfactory and that most of the strong earthquakes have been recorded on all three stations.
2.3 Visual Recognition of Recorded Signals
By manual inspection of the datasets, we identify four dominant types of signals: SDEs, earthquakes, harmonic tremors and whale calls.
2.3.1 SDEs
From visual inspection of the data set, we noticed prominent signals (Figure 2A) that usually have amplitudes similar, if not stronger, than local earthquakes (Figure 2B). Their spectra cover almost the entire frequency range (up to 20 Hz in OBS-1 and 60–80 Hz in OBS-4 and OBS-5). Whereas the amplitude of these signals is highly variable, the frequency content between events remains more stable. Their average duration is between 1–2 s. On corresponding spectrograms, these signals appear as narrow “stripes” covering a large frequency band from 3–4 Hz to 20–25 Hz (OBS-1) or 60–65 Hz (OBS-4 and OBS-5), with similar energy levels for all frequencies they contain. We classify these signals as SDEs (Figure 2A). SDEs are usually observed on all channels of a seismometer, and sporadically, on a hydrophone record. One common characteristic they share is a lack of separate P and S wave arrivals, which clearly distinguishes them from local earthquakes (Figures 2A,B). The SDEs we document here follow the characteristics of SDEs described at Western Svalbard Shelf by Franek et al. (2017), and Sea of Marmara by Batsi et al. (2019).
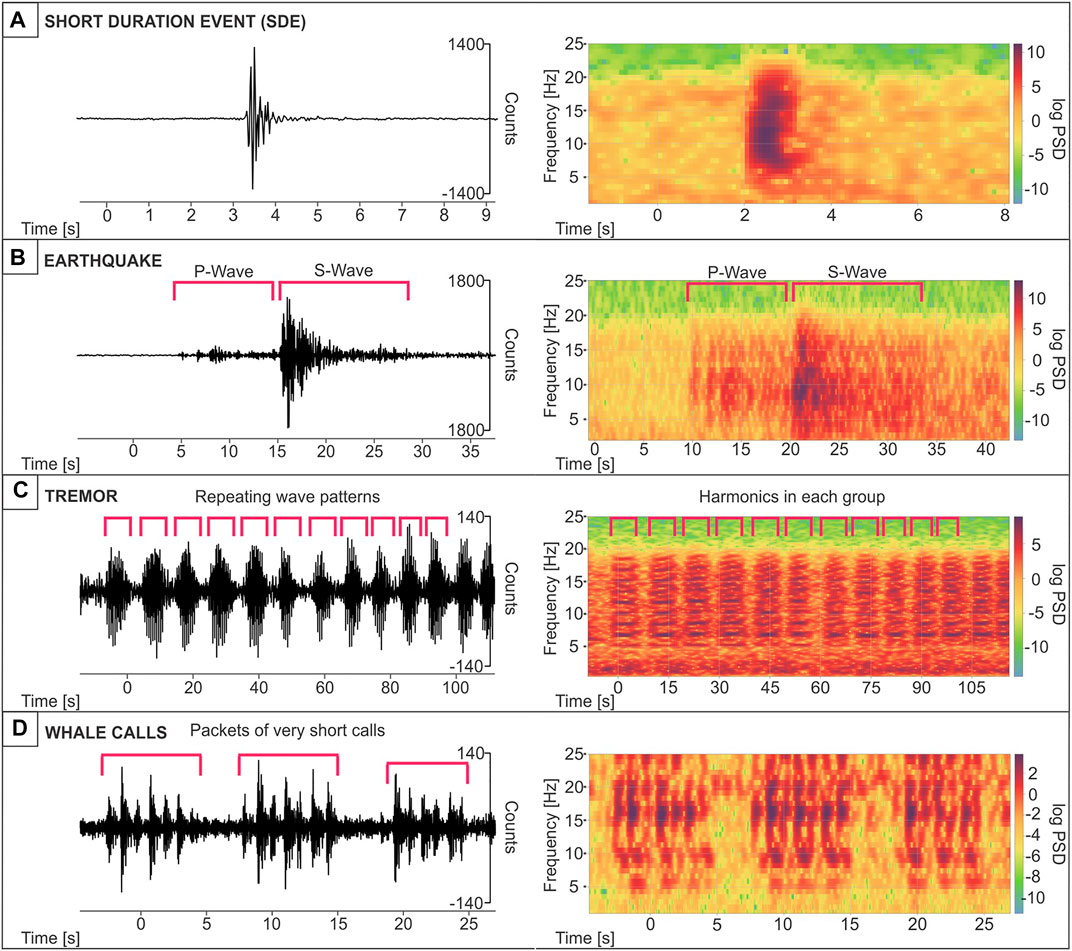
FIGURE 2. Individual examples of types of events observed on the vertical channel of the seismometer, with spectrograms showing how each type of observed signals can be differentiated by their spectra. Events presented: SDEs (A), earthquakes (B), harmonic tremors (C), and whale calls (D). Spectrograms calculated using Fast Fourier Transform (window length 1 s, except tremors—5 s used there instead; overlap—90%; Hanning taper).
2.3.2 Earthquakes
The dominant sources of earthquakes in this dataset are ultra-slow spreading oceanic ridges (e.g., Molloy Ridge and Knipovich Ridge), that have been successfully studied by OBS deployments (e.g., Meier et al., 2021; Schlindwein et al., 2013). Earthquakes can be clearly distinguished from other signals by independent P and S waves arrivals and their overall length (Figure 2B). Usually, an individual earthquake is recorded on all three OBSs and on all channels of the seismometer. After an earthquake, a seismic wavefield propagating from the hypocenter reaches the seafloor and undergoes conversion at the water-sediment boundary. This process leads to the generation of acoustic waves in the water column that we have observed in our hydrophone data, for particularly large earthquakes in the region with known, independently determined magnitudes. In this study, we observe events with the total duration of 8–10 s or more, for the most part, since our short-period seismometers (with a useful frequency range of 1 Hz upwards) are mainly suitable for studies of local and regional seismicity (Sutton et al., 1965; Webb, 1998).
2.3.3 Harmonic Tremors
A tremor is defined as a continuous signal of sustained amplitude recorded at frequencies within limited bandwidth (Chouet, 1992). By harmonic tremor, we refer to signals which beside the fundamental frequency contain one or more harmonics of this frequency, as defined e.g., in Essing et al. (2021). This can be clearly seen on their spectra, with an energy pick for the fundamental frequency and subsequent energy levels for integer multiples of this frequency. We observe tremor on all seismometer channels, but not on the hydrophones. Tremors have ∼1–5 Hz dominant frequency with at least one or more harmonics present (Figure 2C), and harmonic frequencies going up to 15–20 Hz in the case of strong tremors. Tremor events usually start with only the dominant frequency and one, sometimes two harmonics visible, but they increase in intensity quickly and the number of harmonics visible becomes larger. The opposite process is occurring towards the end of the tremor “window,” with number of harmonics decreasing, until only energy of the dominant frequency can be visible before tremor disappears completely. The usual duration of continuous presence of a tremor is counted in hours, but throughout these longer intervals, shorter (from few minutes upwards), “patchy” breaks can be randomly seen during the tremor events. They are observed on nearby instrumentation simultaneously, but there are small time differences between the start and the disappearance of tremor bursts between OBSs, with the variation between the onset and the disappearance time.
Approximately half of the dataset from each OBS is contaminated with the tremor noise of uniform characteristics (Figure 2C). Instead of short, strong impulses, it consists of repeating patterns of a longer duration (few seconds and upwards) signal. Its amplitude is also much weaker in comparison to SDEs and most of the recorded earthquakes, which means that the signal to noise ratio is generally much lower. Unlike many whale calls, sporadic SDEs and stronger earthquakes, tremors are not present in the data of the hydrophone channel. These differences in signal’s strength over noise and individual packet duration allow for a distinction of tremor from other observed phenomena. However, due to its prevalence, tremors often coincide with SDEs and earthquakes. Owing to their frequency content up to 60 Hz and high amplitudes, SDEs are still recognizable during times of tremor (cf. Figure 4A).
Harmonic tremors are often interpreted as an effect of OBS instrumentation interacting with the deployment environment. Radio antenna used in OBS recovery has been suggested as a vibrating source of tremor controlled by underwater currents (Duennebier et al., 1981). Underwater currents can excite the rope holding the head buoy used for post-deployment retrieval in LOBSTER design OBS instruments (Stähler et al., 2018). This excitation can give rise to a tremor-like signal with a fundamental frequency close to 1 Hz, in a process known as Karman vortex shedding. Tremor characteristics, similar to the ones discussed here, were also observed near Canary Islands and were attributed to underwater currents exciting the seismometers (Ugalde et al., 2019). This type of a harmonic noise exhibits strong correlation with tidal cycles (Ramakrushana Reddy et al., 2020; Essing et al., 2021). We therefore suggest that the observed harmonic tremor signals are likely caused by seafloor currents acting on the OBSs.
2.3.4 Whale Calls
We found numerous examples of fin whale calls in the sensitive frequency range of seismometers and hydrophones. They produce a repeating sequence of short (∼1 s), down-sweeping pulses within the range of 5–40 Hz, with highest energy around 18 Hz (Figure 2D). The overall duration of an individual animal call lasts usually for more than 200 s (Gaspa Rebull et al., 2006). The duration of recorded calls is highly dependent on whether we observe a group of animals or just a single whale. Since the source of the signal is in the water column, it is predominantly recorded by the hydrophones, and depending on the distance, may also be seen on seismometer channels.
Many different marine mammal species produce vocalizations that can be recorded with a high frequency hydrophone, but numerous studies have shown it is possible to record fin and blue whale calls also on seismometers due to the low frequency of their calls (e.g., McDonald et al., 1995; Morano et al., 2012; Soule and Wilcock, 2013). Both species are seasonally present west of Svalbard (Edwards et al., 2015; Storrie et al., 2018; Løviknes et al., 2021). Blue whales’ songs have frequencies that also overlap with the bandwidth of OBS recordings, however their sounds are longer in duration (∼8 s) and narrower in frequency (∼20 Hz) for groups observed in North Atlantic (McDonald et al., 2006). They can also produce a different type of call (D call), possibly related to feeding, that can resemble a fin whale down-sweeping pulse, but a single event is lasting several seconds, longer than a fin whale call (Mellinger and Clark, 2003; Rice et al., 2021).
Call patterns of any of these species can clearly be distinguished from SDEs which lack down-sweep character and rhythmic sequences, they also have a longer duration.
Earthquakes, tremors and whale calls are beyond the scope of our study and will not be further discussed.
2.4 Automatic SDE Detection
We automatically extracted SDEs using the routine STA/LTA (short-term average/long-term average) algorithm implemented in ObsPy toolbox (Beyreuther et al., 2010) following an approach adopted for several studies of SDEs (e.g., Tary et al., 2012; Embriaco et al., 2014; Franek et al., 2014; Franek et al., 2017; Batsi et al., 2019). First, we visually identified a large number of SDEs present in the data to gain an idea of the best search parameters for the STA/LTA detector, based on their signal characteristics (Figure 3). We conducted the search on vertical channels of all seismometers, because only the strongest SDEs were present on all channels of a seismometer (Figure 3). We have chosen arbitrary two-week long period of data and tested different detection parameters until we obtained satisfactory result. After a careful analysis and testing of STA/LTA trigger sensitivity, we set the following parameters: length of short-term window 0.35 s, length of long-term window 8 s, trigger threshold ratio 5 and de-trigger threshold 2. We restricted the event duration to less than 2.5 s to make sure that local earthquakes from oceanic ridges and whale calls would not be included in the resulting dataset. The final output contained each picked SDE start time and its duration (defined as the difference between trigger and de-trigger time).
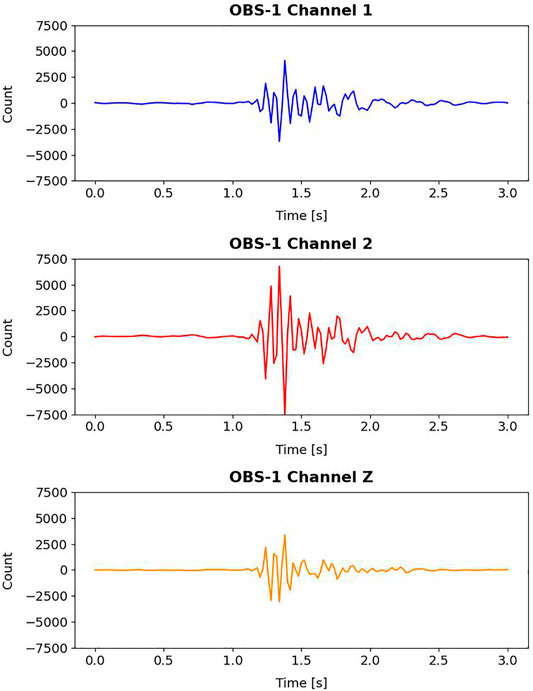
FIGURE 3. An example of short duration event recorded on three channels of OBS-1 station seismometer. Horizontal channels marked as 1 and 2 due to lack of orientation with regards to geographic coordinates.
Overall, the STA/LTA automatic extraction is highly effective for periods with limited SDE activity (Figure 4C). However, in periods of intensive SDEs we notice that the STA/LTA identifies fewer SDEs than observed by visual inspection during the selected period (Figure 4B). Specifically, it fails to trigger detection more than once during longer periods of SDEs activity with practically no low-amplitude intervals in between. Therefore, the number of SDEs during phases of high activity is likely underestimated. Nevertheless, the presence of harmonic tremors does not affect the trigger sensitivity and SDEs are also detected during phases of intense tremor (15:30–15:50, Figure 4A). The use of the vertical seismometer channel for SDE detection further avoided triggering on whale calls.
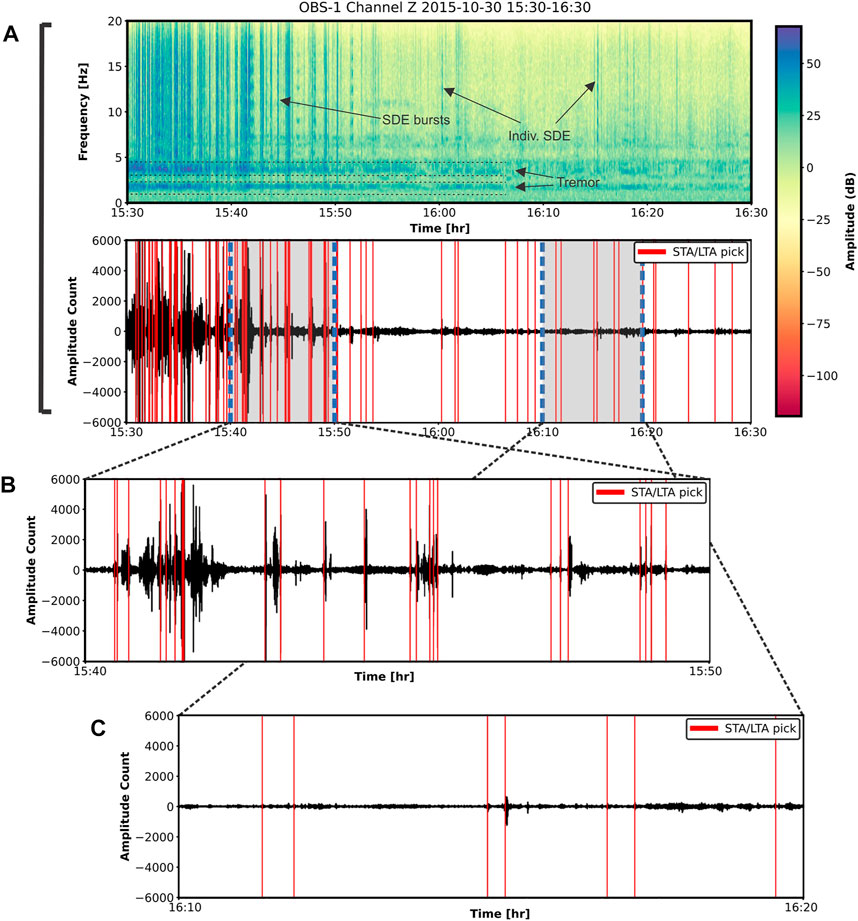
FIGURE 4. Spectrogram of the hour-long subset of the vertical seismometer channel data from OBS-1 (A) containing examples of tremor (horizontal spectral lines below about 5 Hz) and SDEs (thin vertical lines) with the automatic picks of STA/LTA algorithm presented on the corresponding seismograms. Accuracy of the picking in the interval of high number of SDEs (B) and the period of relative quietness (C) are presented below. Parameters used to calculate the spectrogram: window length—10 s, overlap of windows—90%, taper function—Hanning.
3 Results
3.1 Occurrence and Periodicity of Observed SDEs
We detected more than 300,000 events using STA/LTA detector and more than 90,000 on OBS-1 alone throughout the deployment period. They occur as a single event or in bursts of dozens, sometimes hundreds, lasting several hours (Figure 4). We operated the STA/LTA detector on the vertical seismometer channel. However, SDEs are generally visible on all channels of a seismometer, and sometimes also on a hydrophone channel. We observe that the number of SDE occurrences varies with time along the records and these variations are not regular. Also, the observed bursts of SDEs do not occur simultaneously on the neighboring stations, despite their estimated distance of only 250–300 m. This indicates that the origin of the signal is very local, otherwise we would expect simultaneous detection on nearby stations. This is in line with other reports about their occurrence (e.g., Tary et al., 2012; Embriaco et al., 2014; Sgroi et al., 2021).
Periodogram plots reveal a periodic pattern of occurrence of SDEs that can be correlated with major tidal cycles. The SDE occurrence peaks in cycles of about 12.4 h (M2 in Figure 5) on OBSs 1 and 4, and to a lesser extent on OBS-5. There are also spectral peaks at 4.39 h (M6 in Figure 5) and 6.28 h (M4 in Figure 5) on OBS-1. M2, M4 and M6 correspond to the principal lunar semi-diurnal constituent and the first and the second overtide of principal lunar semi-diurnal constituent, respectively (Lopes and Tenreiro Machado, 2017). It can be argued that there are three small peaks related to M2 and other tidal constituents present on OBS-5 (M2? N2 and MU2 in Figure 5). In general, we also observe many more periodicity peaks greater than full-day on the spectra that cannot be assigned to the tides in a direct manner.
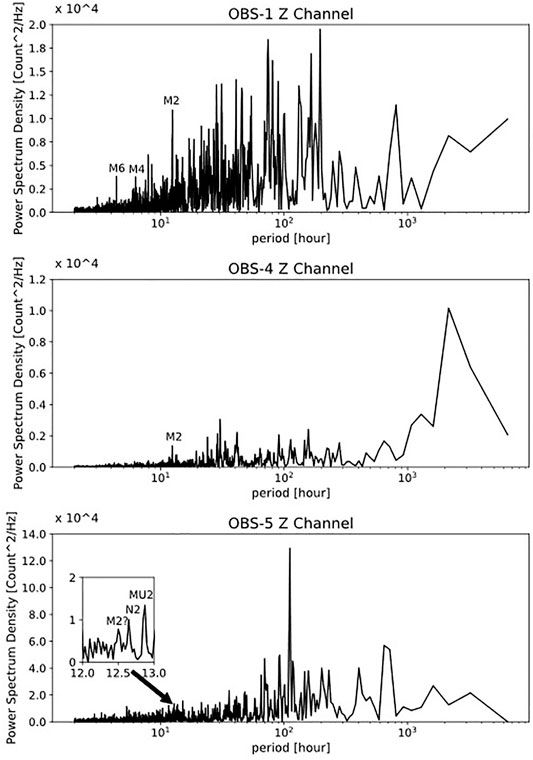
FIGURE 5. Power spectrum density (periodogram) functions for hourly count of SDEs detected on vertical channels of OBS-1, OBS-4, and OBS-5. Labels for corresponding tidal components are as follows: M2—principal lunar semidiurnal, M4—shallow water overtides of principal lunar semidiurnal (first overtide of principal lunar semidiurnal), M6—second overtide of principal lunar semidiurnal, N2—larger lunar elliptic semidiurnal, MU2 – variational.
We conducted similar analysis of periodicity for the tremors to compare the strength of the tidal influence on both processes. We utilized the detection approach of Roman (2017) to obtain an hourly-binned dataset of tremor occurrence. This method uses the pitch detection approach from speech and music processing, due to their similar characteristics to harmonic tremors. It initially assumes that each individual sample has the tremor present. It first determines the fundamental frequency of a signal by consecutively decimating the Fourier transform of a signal and designating a frequency with the highest power as the fundamental one. Then, for the integer multiples of this frequency (harmonics), it measures the relative power ratios between the windows containing the fundamental frequency and its potential harmonics. If this ratio exceeds a predefined value, we can assume that the signal contains tremor, with a given fundamental frequency. We can also decide for how many harmonics the ratio has to be checked and met for a signal to be declared as a tremor.
In the resulting plots, we also observed clear spectral peaks corresponding to tidal cycles on OBS-1 and OBS-4 (Supplementary Figure S1), with the M2 peak more pronounced than in the SDE periodogram. In addition, longer period tidal constituents (K1 and longer periods) are present in the tremor cyclicity. This underlines two points: that we could successfully discriminate SDE events and tremor signals with SDE occurrence patterns differing from tremor occurrence patterns; secondly, that different source mechanisms are responsible for producing tremors and SDEs.
3.2 Periodicity of SDEs and Comparison With Tidal Cycles
To further compare the observed periodicity of SDEs with the periodicity of diurnal tides, we used the models of expected mean sea level height changes for the months of the experiment using pyTMD (Sutterley et al., 2019). We calculated these values for the location of OBS-1 (6°54′30″E, 79°00′17″N) using TPXO 9.2 model (Egbert and Erofeeva, 2002). For this site, we obtained the maximum mean sea level height difference due to tides of about 1.2 m. We then compared the normalized modelled tidal response time series with normalized SDEs time series (Figure 6). Subsequently, we also noticed that occurrence of SDEs matches, albeit in not a consistent way, the pattern represented by tidal cycles calculated for Vestnesa Ridge. It appears that increased numbers of SDEs are usually visible near the peaks of sea level change, but SDEs are not present in every consecutive diurnal tide cycle. More examples of observed SDEs intensity can be found in the supporting material (Supplementary Figures S2–S40). We performed manual picking of the SDEs on a smaller subset of the data and confirmed that the similar periodic pattern is present (Figure 7). Therefore, we can exclude those artefacts caused by the relative insensitivity of the STA/LTA detector in times of SDE bursts affect the SDE periodicity.
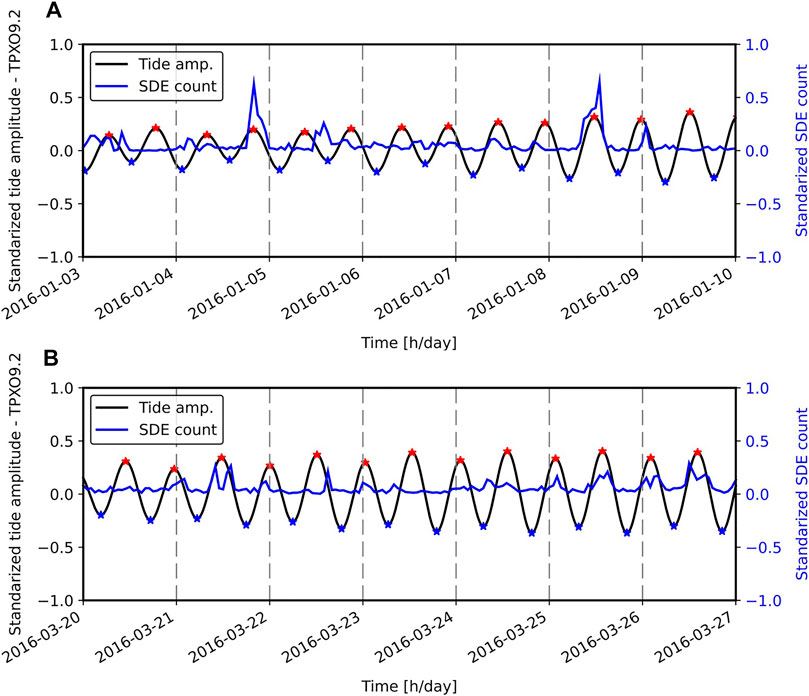
FIGURE 6. Standardized plots of the mean sea level amplitude change due to tides (black line) superimposed on the SDEs hourly count from vertical channel of OBS-1 (blue line) for a week 03.01-09.01.2016 (A) and a week 13.03-19.03.2016 (B). Small red and blue stars indicate moment of high/low tide, respectively. Each day is separated by a dashed vertical line.
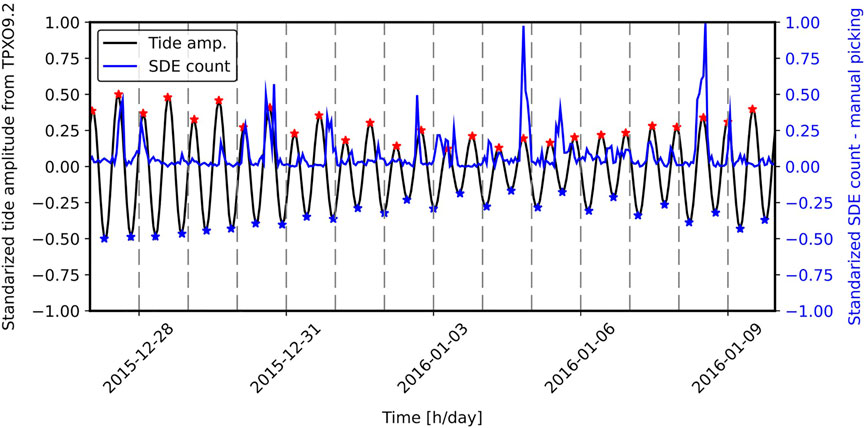
FIGURE 7. Standardized plot of manually picked and subsequently binned hourly count of SDEs observed at vertical channel of OBS-1 vs. relative mean sea level change caused by tides (from TPXO 9.2 model), for arbitrarily selected two-week-long period.
In general, these plots show that the observed relationship between tides and SDE occurrence is not very strong. This agrees with what is observed on periodograms, where peaks of spectral amplitude at the frequencies corresponding to tides are visible, but other, stronger periods are also present. Likewise, a prominent increase in SDE numbers is rarely observed on subsequent tidal cycles. We observe instead that at least a few days can pass with a lesser amount of SDEs. This pattern occurs through the entire dataset, with additional longer quiet periods (on a scale of weeks), where clear increases in SDEs are not observed (Supplementary Figures S2–S40).
3.3 Phase Relationship Between SDE Bursts and Tides
In order to quantify the strength of the relationship between SDEs and tides, we use cross-correlations (Appendix A) of the normalized mean sea level change with the normalized SDE hourly count function as a quantitative measure of similarity. The cross-correlation allows calculation of the lag (i.e., the phase difference between the input time series), at which the relationship is potentially strongest. Since one of the functions used in the calculation has a clear periodic pattern (i.e., roughly 12-h periodicity in the case of the tides), we looked at the cross-correlation lag values only between −12 and 12 h (Figure 8). We detrended the time series prior to the correlation. In the next step, we split the data into monthly intervals and evaluated the relationship of SDE counts to both rising and falling tides. We then generated monthly plots for each OBS using the same approach, with the omission of July 2016, since we only had 5 full days of the record for this month (Figure 9).
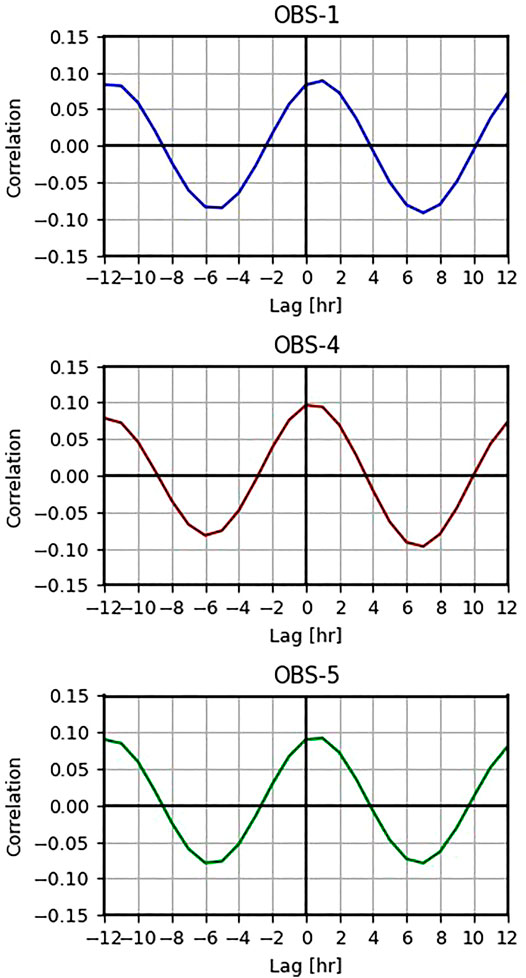
FIGURE 8. Correlation of standardized SDEs hourly count (calculated for vertical channel of seismometer), with standardized tide amplitude for OBS-1, OBS-4, and OBS-5. For each plot the maximum positive correlation occurs at around +1 h (and repeat with periodicity of 12 h)—SDEs peak precedes the point of high tide by 1 h.
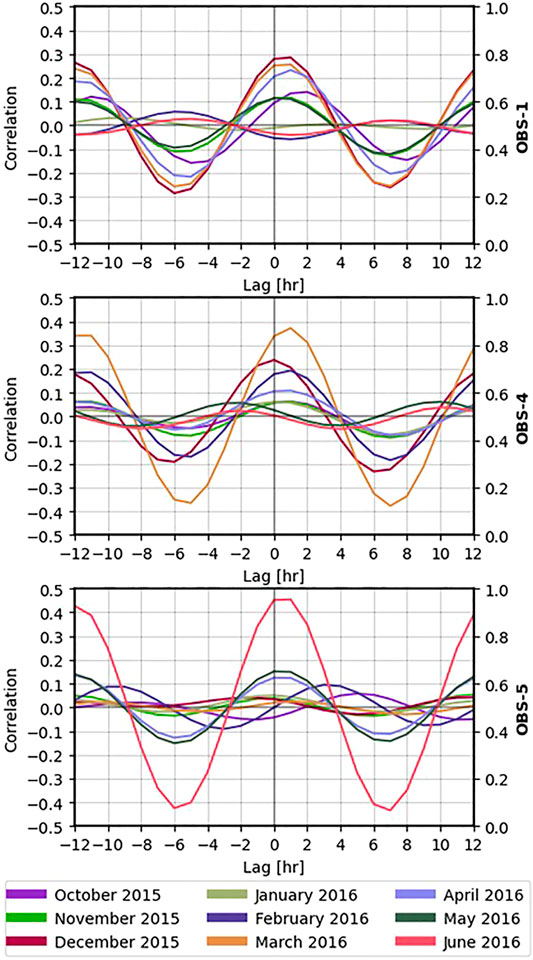
FIGURE 9. Monthly correlation between standardized SDEs hourly count from vertical channels of OBS-1, OBS-4 and OBS-5, and standardized relative sea level change from TPXO 9.2 model.
The cross-correlation between the tidal time series and hourly SDE count time series shows a peak correlation in all three OBS stations between 0–1 h time lag. This indicates that rising tides close to the tidal maximum correspond to the highest likelihood of occurrence of SDEs (Figure 8). Additionally, each correlation peak has a corresponding minimum at roughly 6 h before and after the peak. This is a consequence of the periodic nature of one of the input functions (mean sea level change) for the correlation process, but it also indicates a weaker connection between SDEs and low tides. Shifting the tidal dataset back and forth by an arbitrary number of hours produces a cross correlation function with the maxima and minima shifted by the same number of hours, respectively.
We then study 27 individual samples representing correlation results for month-long subsets of SDE data for each of three OBSs (Table 1). In most (17/27) of the cases, the peak correlation occurs either at 0 h lag or at 1 h lag. Since the input dataset is binned into hour-long intervals, this means that the actual peak occurs at the value between 0 and 1 h. In these cases, a maximum correlation value equal ∼0.1–0.5 (Figure 9). This indicates a stronger relationship between times of a rising tide and peaks in SDEs occurrence rather than between falling tides and peaks in SDE occurrence. The average correlation value for these periods is 0.17. For months where the correlation peak occurs at a time lag other than 0 h or 1 h, the correlation value is much lower (usually <0.05, mean value 0.06), indicating weaker correlation/relationship between SDEs and relative wave height change due to tides. Additionally, among these 10 results with the correlation peak outside of 0–1 h range, only one correlation value is greater than 0.1 (i.e., for 2 h correlation lag in October for OBS-1), so the reliability of these 10 correlation results is poor. In general, the resultant correlation values are low, but there is a clear separation between values observed at lag 0–1 h in most of the months and the correlation results when peak is at different lag or barely recognizable.

TABLE 1. Maximum peak correlation lag time (in h) and corresponding correlation coefficient values for every month of deployment of each OBS. For all peaks occurring outside of the lag window 0–2 h we observe very low, close to 0, values of correlation coefficient.
It is worth remembering however, that the resulting coefficients are neither robust nor resistant (Wilks, 2011). This means that cross correlation may not recognize strong, but non-linear relationships (robustness), or its outcome value can be extremely sensitive to one or a few outlying points pars (resistance). Relatively low coefficient values are caused partially by a high variance in the SDE dataset, where most of the observed counts during tide changes have relatively low value compared to extreme SDEs bursts that we observe sporadically in the data (median value of the normalized SDE occurrence is just 0.0259, 0.0185, and 0.0684 for OBS-1, OBS-4, and OBS-5, respectively). The aforementioned issues with the data quality for OBS-5 are likely the reason behind generally weak correlation for most of the months (with notable distinction of June (0.45), where the correlation is the strongest for the entire dataset from all recorders). In summary the results suggest that SDE peaks are more likely to happen at high and low tide but not at every tidal cycle and only sporadically. There is a stronger connection between high tides and peaks in SDE occurrence than between low tides and peaks in SDE occurrence.
4 Discussion
4.1 Tidal Control on SDEs
The analyses above indicate that:
• SDEs at the investigated site on Vestnesa Ridge have a periodic pattern of distribution
• SDEs can be correlated with diurnal and longer-term periodicity sea level changes to some extent
• The correlation between SDE occurrences and tides is in average low, with a stronger connection between their increase at maximum sea level periods. In such an instance, increase in SDEs does not necessarily occur within each tidal cycle, but with the periods of lower activity in between
Our results reveal that although SDEs are not strongly correlated with sea level changes associated to ocean tides, observing their variability on a month-by-month basis still shows partial effect of tidal sea level oscillations on the intensity of SDE bursts.
While tremor periodicity indicates tidally modulated underwater currents (Supplementary Figure S1; Stähler et al., 2018; Ramakrushana Reddy et al., 2020; Essing et al., 2021), SDEs show a different periodic pattern, suggesting that their link to the sea level changes is via more complex near-seafloor processes.
Mean sea level changes represent pressure difference that impact near-surface geological processes. There are global observations that document a strong link between SDEs (i.e., micro-seismicity), and fluid movement through near seafloor sediments (Sultan et al., 2011; Tary et al., 2012; Embriaco et al., 2014; Franek et al., 2014; Franek et al., 2017; Batsi et al., 2019). Batsi et al. (2019) recreated in the lab (i.e., using a small amount of air and water injected into the sediments within a meter from the geophone) a signal characterized by high frequency content, strong amplitude and short duration that has a remarkable resemblance with SDEs.
All three SDE measurements documented here are concentrated near (<500 m) pockmark with proven gas hydrates and fracture-related seafloor seepage (Figure 1; Bünz et al., 2012; Panieri et al., 2017). The fact that SDEs are not recognized simultaneously on the three OBSs, together with strong relative amplitudes and no clear separation between the P and S wave signals (as in earthquakes), indicate local sources of SDEs that lose energy rapidly.
Discussions on the link between SDEs, tides and seepage dynamics at continental margins have gained significant attention following observations from various margins and geological settings. Several studies document tidal modulated seepage activity at continental margins (e.g., Boles et al., 2001; Torres et al., 2002; Hsu et al., 2013) and hydrothermal systems (e.g., Schultz et al., 1992; Plant et al., 2010). Along west-Svalbard continental margin, a potential effect of tides on the seepage intensity has been inferred from analyses of gas signatures on sonar (Veloso-Alarcon et al., 2019) and in-situ pore fluid pressure data (Sultan et al., 2020). Other studies document temporal relations between SDEs and enhanced methane release to the water column (e.g., Sea of Marmara; Embriaco et al., 2014). Bayrakci et al. (2014) noted a strong increase in the number of SDEs recorded on an OBS deployed directly at a seep location compared to other nearby devices. The polarization of SDEs observed by Hsu et al. (2013) at a mud volcano off Taiwan indicated a source in the shallow subsurface. In their case, the tidal pattern in SDE occurrence matched the periodicity of the gas flux in the water column giving further direct evidence of a link between tidally controlled fluid flow systems and SDE generation.
Very few studies discuss simultaneously mechanisms by which tides may affect seafloor seepage periodicity, which in turn may control the pattern of distribution of micro-seismic signals. Moreover, while a link between temporal modulation of gas release and occurrence of SDE events has been established based on data from various continental margins, the physical process behind this link is still the subject of the debate. We discuss hereafter physical mechanisms that can explain the link between SDE occurrences, sea level changes and seepage dynamics at Vestnesa Ridge gas hydrates and associated seepage system.
4.2 SDEs From a Fracture-controlled Gas Hydrate and Seepage System
Documented SDEs occurrences on Vestnesa Ridge are in line with observations from other margins, possibly reflecting sea level controlled dynamic changes on the seepage system from one or several of the surrounding pockmarks (Figure 1).
Soft, unconsolidated sediments create temporary pathways for migrating gas that undergo closure after the gas release (Boudreau et al., 2005). It has been suggested that SDEs could be the manifestation of opening new fractures allowing for gas expulsion or pockets of gas travelling upwards in the shallow sediment (Tary et al., 2012). Both modeling (Tary et al., 2012) and test in a sediment tank (Batsi et al., 2019), have shown that gas release from the surface would produce signals that resemble the SDEs recorded in the field.
Seepage over the monitored pockmark on Vestnesa Ridge has been documented over multiple yearly surveys since 2009 (e.g., Smith et al., 2014; Panieri et al., 2017). The pockmark is associated with one, among several, vertical fluid migration conduits along Vestnesa Ridge. These conduits are known as gas chimneys or gas pipes and are thought to be formed due to overpressured gas at the base of the gas hydrate stability zone (GHSZ) (Hustoft et al., 2009; Singhroha et al., 2016). The source of gas is both microbial and thermogenic (Pape et al., 2020) and seepage at the seafloor is sustained by pulses of gas migrating though fractured strata (Figures 1C,D) (Bünz et al., 2012; Plaza-Faverola et al., 2015; Singhroha et al., 2016). Buried authigenic carbonate accumulations within the pipes, characterized by high amplitude anomalies in 3D seismic data, indicate periods of enhanced methane release in the past (Himmler et al., 2019; Plaza-Faverola et al., 2015; Schneider et al., 2018). These shallow authigenic carbonate concentrations and gas hydrates promote the entrapment of gas within the upper few meters below the seafloor (Figure 1C) (Plaza-Faverola et al., 2015; Himmler et al., 2019). Over time, trapped gas bypasses local seals and continue through shallow fractures to sustain seafloor seepage at present day (Hong et al., 2021). Such fluid flow systems are known as self-sealed (Hovland et al., 2002).
The physical mechanism usually invoked to explain the modulation of seepage by tides is the forcing exerted by increasing and decreasing hydrostatic pressure on gas (i.e., a compressible fluid) present in the pore-fluids (Römer et al., 2016; Sultan et al., 2020). This change in pore-fluid pressure would also lead to changes in the state of pre-existing fractures in the subsurface, which would lead to enhanced or hindered gas migration. Such mechanical changes generate micro-seismicity (Hsu et al., 2013).
Observations of gas emissions into the water column (Boles et al., 2001; Torres et al., 2002; Plant et al., 2010; Römer et al., 2016; Riedel et al., 2018) at Cascadia margin and inferred from pore fluid pressure changes (Sultan et al., 2020) at Vestnesa Ridge point to the highest seepage activity during low tides, which would then lead to the largest number of SDEs also during low tides (i.e., assuming that the three processes: fracture opening, gas seepage, and generation of SDEs, occur simultaneously). This is not entirely consistent with the seismological SDE pattern we observe. We suggest that the key to understanding this apparent discrepancy is in the dynamics of the fluid migration system. The system monitored on Vestnesa Ridge has a constant supply of gas from the deeper sediments (e.g., Knies et al., 2018; Daszinnies et al., 2021) and seafloor seepage is continuous (Smith et al., 2014). Thus, it is possible that changes in pressure due to tides only modulate but do not control the seepage activity.
A constant input of gas (e.g., from the base of the gas hydrate stability zone; Singhroha et al., 2016) into the shallow sediment may result in overpressure-driven pulses of gas migration upwards (Hustoft et al., 2009). Micro-seismicity generation can happen both during high and low tides, provided there is enough gas present, and an effective stress of sediments is overcome (Hsu et al., 2013). Hsu et al. (2013) points out, that for a specific location, the vertical stress of a rock stays more or less constant throughout the tidal cycle, leading to a greater pressure difference between gas-filled sediments and the water column at a high tide compared to at a low tide. This leads to larger observed micro-seismicity response during a tidal peak than during a tidal low, which is what they observed, and what we also have noticed during tidal cycles with micro-seismic activity present. In their case, the micro-seismic pattern is directly matched with the gas emission intensity measurement in the water column. Furthermore, in this study it is postulated that in a case of an insufficient methane replenishment (occurring on a scale larger than a single tidal cycle), there is a smaller gas charge, not strong enough to overcome the pressure difference when the influence of tides is largest (high tide). This mechanism can explain observations of increased gas emissions during low tide (e.g., Römer et al., 2016; Riedel et al., 2018; Sultan et al., 2020). Slower replenishment of the gas (on a scale of at least few tidal cycles), could also lead to gaps in the micro-seismic activity, which is what we have observed.
Complex thermodynamic behaviors of gas hydrates may be having an effect on the response of the seepage system to sea level changes and subsequently on the pattern of micro-seismicity generated in response to fluid migration. Normally, solubility of the methane in the pore water increases with the increase in pressure, but in a system supporting stable conditions for methane hydrate to form, the opposite situation is possible (Handa, 1990; Tishchenko et al., 2005; Sun and Duan, 2007; Liu and Flemings, 2011). This is especially true at low temperatures encountered at deep (>1200 m) seafloors. Specific pressure and temperature conditions may favor exsolution of methane from the aqueous phase during high tides, leading to either formation of gas hydrate or generation of methane bubbles that fracture very shallow sediments and release in the form of bubbles. While the change in solubility will be very small, it has been shown that for shallow, unconsolidated sediments reopening of previously existing fractures and bubble generation is possible at a pressure difference provided by tides (Boudreau, 2012). This will not lead to a large change in the amount of methane seeping, but actually, the smaller the bubbles generated, the easier they move to the seafloor, either by initiating minor fractures (assuming linear elastic fracture mechanics) or through pre-existing fluid-filled cracks/pathways (Johnson et al., 2002; Boudreau et al., 2005; Algar et al., 2011a; Algar et al., 2011b; Boudreau, 2012). A conceptual model of such a cycle is presented in Figure 10. Such a change of release would probably not produce an observable difference in the acoustic flares observed in sonar data.
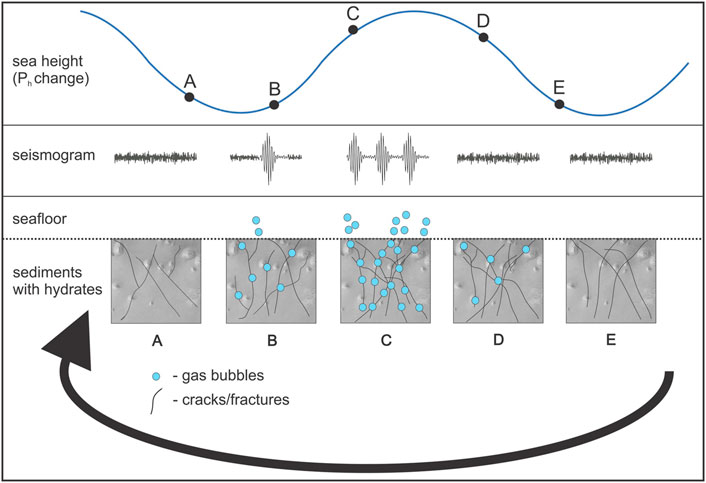
FIGURE 10. Conceptual model for a potential explanation of micro-seismicity generation from a near-surface gas hydrate system, driven by solubility changes. (A) Initial conditions. (B) Increase in tidal pressure leads to gas exsolution and bubble formation which reopens fractures. (C) Maximum number of bubbles is being generated when the pressure difference from tides is approaching highest value, consequently the largest amount of short duration events is observed. (D) During the falling tide, pressure decrease leads to closing of existing fractures and bubble formation. (E) For the next tidal cycle, smaller amounts of gas in pore fluids prohibit from immediate repetition of the process, consequently this pattern is observed only after few more tidal cycles.
How gas hydrate thermodynamics affect seepage periodicity at continental margins is a largely understudied, yet highly relevant problem that deserves broader investigation.
5 Conclusion
Seismological data from three ocean bottom seismometers (OBS) obtained at Vestnesa Ridge reveals, in addition to information about local seismicity, continuous records of tremor-like signals and a large number of short duration events (SDEs). In line with observations from other margins, the tremors documented here are likely caused by the effect of tidal currents on the OBS instrumentation. These currents exhibit strong variability that can be linked to semi-diurnal tides and observed patterns of tremor occurrence match the periodicity of modelled tides for the site.
Comparably to other studies reporting SDEs, our analysis support local, near-surface origin of the observed events. Lack of simultaneous detections of SDEs on closely-spaced OBSs and no observations of SDEs in hydrophone channels point to shallow, subsurface SDE origin.
Our results indicate that both tremors and SDEs occurrences in the investigated setting have a periodic behavior, and their periodicity is comparable to tidal cycles. While the relationship between tides and tremors is through tide-generated currents at the sea-bottom, the relation between tides and SDEs reveals different periodic pattern, in addition to a clear tidal component. SDE bursts generally correlate better with local tide maxima.
SDE distribution, periodic behavior and signal characteristics from Vestnesa Ridge compare to reports from other seepage sites worldwide. A potential connection between SDEs, sea-level changes and seepage dynamics in this deep marine gas hydrate system is explained by:
• Sediment fracturing and gas release caused by small pressure changes due to tides
• Insufficient gas charge unable to overcome pressure difference at a high tide, leading to emission only during periods of low tide, whilst also explaining gaps between the tidal cycles with increased SDE bursts
• Alternatively, complex thermodynamic behavior of gas hydrate under pressure changes due to tides likely affects seepage periodicity and near-surface deformation. This is under-investigated, yet highly relevant problem for quantifying seafloor seepage at continental margins
More quantitative modelling of the gas hydrate behavior in the sediments influenced by tidal pressure variations is necessary to verify how it affects the seepage and shallow sediments.
Data Availability Statement
The datasets presented in this study can be found at UiT’s open research data repository (DataverseNO): https://doi.org/10.18710/TCWUQN.
Author Contributions
SB, APF, and PF (former colleague at the Center) designed and conducted the ocean bottom seismic (OBS) experiment. PD conducted the processing and analysis of OBS records. SS and PD worked on the cross correlation with modelled tides. PD prepared the manuscript with significant contributions from APF, VS, and SS. HR contributed to the conceptualization of the proposed model and discussion.
Funding
This work is part of the SEAMSTRESS project, supported by the Tromsø Research Foundation (TFS) and the Research Council of Norway (grant nr. 287865). The work is also supported by the Research Council of Norway through its Centers of Excellence funding scheme grant 223259 (Centre for Arctic Gas Hydrate, Environment and Climate—CAGE).
Conflict of Interest
The authors declare that the research was conducted in the absence of any commercial or financial relationships that could be construed as a potential conflict of interest.
Publisher’s Note
All claims expressed in this article are solely those of the authors and do not necessarily represent those of their affiliated organizations, or those of the publisher, the editors and the reviewers. Any product that may be evaluated in this article, or claim that may be made by its manufacturer, is not guaranteed or endorsed by the publisher.
Acknowledgments
We thank the crew of R/V Helmer Hanssen for their help with deployment and recovery of OBSs. We also thank Peter Franek for his initial work with the datasets and valuable assistance at an early stage of data processing. We thank the Reviewers Kimihiro Mochizuki and Christopher Schmidt for the constructive feedback that helped to improve the final publication. We also thank the Associate Editor Mourad Bezzeghoud. Regional map was created using GMT (Wessel et al., 2019). Plotting waveforms and spectrograms was done using Pyrocko (Heimann et al., 2017).
Supplementary Material
The Supplementary Material for this article can be found online at: https://www.frontiersin.org/articles/10.3389/feart.2022.831526/full#supplementary-material
Appendix A Cross-Correlation
For two N-element equal-interval (1 h) time series SDE(t) = {SDE(tn)} and Tide(t) = {Tide(tn)}) with the lag value k such as -max_lag <= k <= max_lag, lagged cross-correlation coefficient (Pearson product-moment coefficient of linear correlation) is given by (Crockett, 2019):
where the covariance and standard deviations (
where
References
Algar, C. K., Boudreau, B. P., and Barry, M. A. (2011a). Initial Rise of Bubbles in Cohesive Sediments by a Process of Viscoelastic Fracture. J. Geophys. Res. 116 (B4). doi:10.1029/2010jb008133
Algar, C. K., Boudreau, B. P., and Barry, M. A. (2011b). Release of Multiple Bubbles from Cohesive Sediments. Geophys. Res. Lett. 38 (8). doi:10.1029/2011gl046870
Ambrose, W. G., Panieri, G., Schneider, A., Plaza‐Faverola, A., Carroll, M. L., Åström, E. K. L., et al. (2015). Bivalve Shell Horizons in Seafloor Pockmarks of the Last Glacial‐interglacial Transition: a Thousand Years of Methane Emissions in the A Rctic O Cean. Geochem. Geophys. Geosyst. 16 (12), 4108–4129. doi:10.1002/2015gc005980
Batsi, E., Tsang‐Hin‐Sun, E., Klingelhoefer, F., Bayrakci, G., Chang, E. T. Y., Lin, J. Y., et al. (2019). Nonseismic Signals in the Ocean: Indicators of Deep Sea and Seafloor Processes on Ocean‐Bottom Seismometer Data. Geochem. Geophys. Geosyst. 20 (8), 3882–3900. doi:10.1029/2019gc008349
Bayrakci, G., Scalabrin, C., Dupré, S., Leblond, I., Tary, J.-B., Lanteri, N., et al. (2014). Acoustic Monitoring of Gas Emissions from the Seafloor. Part II: a Case Study from the Sea of Marmara. Mar. Geophys. Res. 35 (3), 211–229. doi:10.1007/s11001-014-9227-7
Beccari, V., Basso, D., Spezzaferri, S., Rüggeberg, A., Neuman, A., and Makovsky, Y. (2020). Preliminary Video-Spatial Analysis of Cold Seep Bivalve Beds at the Base of the continental Slope of Israel (Palmahim Disturbance). Deep Sea Res. Part Topical Stud. Oceanography 171, 104664. doi:10.1016/j.dsr2.2019.104664
Berndt, C., Feseker, T., Treude, T., Krastel, S., Liebetrau, V., Niemann, H., et al. (2014). Temporal Constraints on Hydrate-Controlled Methane Seepage off Svalbard. Science 343 (6168), 284–287. doi:10.1126/science.1246298
Beyreuther, M., Barsch, R., Krischer, L., Megies, T., Behr, Y., and Wassermann, J. (2010). ObsPy: A Python Toolbox for Seismology. Seismological Res. Lett. 81 (3), 530–533. doi:10.1785/gssrl.81.3.530
Boles, J. R., Clark, J. F., Leifer, I., and Washburn, L. (2001). Temporal Variation in Natural Methane Seep Rate Due to Tides, Coal Oil Point Area, California. J. Geophys. Res. 106 (C11), 27077–27086. doi:10.1029/2000jc000774
Boudreau, B. P., Algar, C., Johnson, B. D., Croudace, I., Reed, A., and Furukawa, Y. (2005). Bubble Growth and Rise in Soft Sediments. Geology 33 (6). doi:10.1130/g21259.1
Boudreau, B. P. (2012). The Physics of Bubbles in Surficial, Soft, Cohesive Sediments. Mar. Pet. Geology. 38 (1), 1–18. doi:10.1016/j.marpetgeo.2012.07.002
Bowman, D. C., and Wilcock, W. S. D. (2013). Unusual Signals Recorded by Ocean Bottom Seismometers in the Flooded Caldera of Deception Island Volcano: Volcanic Gases or Biological Activity? Antartic Sci. 26 (3), 267–275. doi:10.1017/s0954102013000758
Bünz, S., Polyanov, S., Vadakkepuliyambatta, S., Consolaro, C., and Mienert, J. (2012). Active Gas Venting through Hydrate-Bearing Sediments on the Vestnesa Ridge, Offshore W-Svalbard. Mar. Geology. 332-334, 189–197. doi:10.1016/j.margeo.2012.09.012
Buskirk, R. E., Frohlich, C., Latham, G. V., Chen, A. T., and Lawton, J. (1981). Evidence that Biological Activity Affects Ocean Bottom Seismograph Recordings. Mar. Geophys. Researches 5 (2), 189–205.
Chang, E. T. Y., Chao, B. F., Chen, G. Y., and Liau, J. M. (2016). Internal Tides Recorded at Ocean Bottom off the Coast of Southeast Taiwan. J. Geophys. Res. Oceans 121 (5), 3381–3394. doi:10.1002/2015jc011370
Chouet, B. (1992). “A Seismic Model for the Source of Long-Period Events and Harmonic Tremor.” in Volcanic Seismology. Berlin, Heidelberg: Springer, 133–156. doi:10.1007/978-3-642-77008-1_11
Ciotoli, G., Procesi, M., Etiope, G., Fracassi, U., and Ventura, G. (2020). Influence of Tectonics on Global Scale Distribution of Geological Methane Emissions. Nat. Commun. 11 (1), 2305. doi:10.1038/s41467-020-16229-1
Consolaro, C., Rasmussen, T. L., Panieri, G., Mienert, J., Bünz, S., and Sztybor, K. (2015). Carbon Isotope (δ13C) Excursions Suggest Times of Major Methane Release during the Last 14 Kyr in Fram Strait, the Deep-Water Gateway to the Arctic. Clim. Past 11 (4), 669–685. doi:10.5194/cp-11-669-2015
Crémière, A., Lepland, A., Chand, S., Sahy, D., Condon, D. J., Noble, S. R., et al. (2016). Timescales of Methane Seepage on the Norwegian Margin Following Collapse of the Scandinavian Ice Sheet. Nat. Commun. 7, 11509. doi:10.1038/ncomms11509
Crockett, R. (2019). A Primer on Fourier Analysis for the Geosciences. Cambridge: Cambridge University Press.
Crutchley, G. J., Klaeschen, D., Planert, L., Bialas, J., Berndt, C., Papenberg, C., et al. (2014). The Impact of Fluid Advection on Gas Hydrate Stability: Investigations at Sites of Methane Seepage Offshore Costa Rica. Earth Planet. Sci. Lett. 401, 95–109. doi:10.1016/j.epsl.2014.05.045
Daszinnies, M., Plaza-Faverola, A., Sylta, Ø., Bünz, S., Mattingsdal, R., Tømmerås, A., et al. (2021). The Plio-Pleistocene Seepage History off Western Svalbard Inferred from 3D Petroleum Systems Modelling. Mar. Pet. Geology. 128, 105023. doi:10.1016/j.marpetgeo.2021.105023
Di, P., Feng, D., Tao, J., and Chen, D. (2020). Using Time-Series Videos to Quantify Methane Bubbles Flux from Natural Cold Seeps in the South China Sea. Minerals 10 (3), 216. doi:10.3390/min10030216
Díaz, J., Gallart, J., and Gaspà, O. (2007). Atypical Seismic Signals at the Galicia Margin, North Atlantic Ocean, Related to the Resonance of Subsurface Fluid-Filled Cracks. Tectonophysics 433 (1-4), 1–13. doi:10.1016/j.tecto.2007.01.004
Duennebier, F. K., Blackinton, G., and Sutton, G. H. (1981). Current-generated Noise Recorded on Ocean Bottom Seismometers. Mar. Geophys. Res. 5 (1), 109–115. doi:10.1007/bf00310316
Edwards, E. F., Hall, C., Moore, T. J., Sheredy, C., and Redfern, J. V. (2015). Global Distribution of Fin Whales B Alaenoptera Physalus in the post-whaling Era (1980-2012). Mammal Rev. 45 (4), 197–214. doi:10.1111/mam.12048
Egbert, G. D., and Erofeeva, S. Y. (2002). Efficient Inverse Modeling of Barotropic Ocean Tides. J. Atmos. Oceanic Technol. 19 (2), 183–204. doi:10.1175/1520-0426(2002)019<0183:eimobo>2.0.co;2
Eiken, O., and Hinz, K. (1993). Contourites in the Fram Strait. Sediment. Geology. 82 (1-4), 15–32. doi:10.1016/0037-0738(93)90110-q
Embriaco, D., Marinaro, G., Frugoni, F., Monna, S., Etiope, G., Gasperini, L., et al. (2014). Monitoring of Gas and Seismic Energy Release by Multiparametric Benthic Observatory along the North Anatolian Fault in the Sea of Marmara (NW Turkey). Geophys. J. Int. 196 (2), 850–866. doi:10.1093/gji/ggt436
Essing, D., Schlindwein, V., Schmidt-Aursch, M. C., Hadziioannou, C., and Stähler, S. C. (2021). Characteristics of Current-Induced Harmonic Tremor Signals in Ocean-Bottom Seismometer Records. Seismological Res. Lett. doi:10.1785/0220200397
Etiope, G. (2015). “Gas Seepage and Past Climate Change,” in Natural Gas Seepage: The Earth’s Hydrocarbon Degassing (Cham: Springer International Publishing), 165–182. doi:10.1007/978-3-319-14601-0_8
Ferré, B., Jansson, P. G., Moser, M., Serov, P., Portnov, A., Graves, C. A., et al. (2020). Reduced Methane Seepage from Arctic Sediments during Cold Bottom-Water Conditions. Nat. Geosci. 13 (2), 144–148. doi:10.1038/s41561-019-0515-3
Franek, P., Mienert, J., Buenz, S., and Géli, L. (2014). Character of Seismic Motion at a Location of a Gas Hydrate‐bearing Mud Volcano on the SW Barents Sea Margin. J. Geophys. Res. Solid Earth 119 (8), 6159–6177. doi:10.1002/2014jb010990
Franek, P., Plaza-Faverola, A., Mienert, J., Buenz, S., Ferré, B., and Hubbard, A. (2017). Microseismicity Linked to Gas Migration and Leakage on the Western Svalbard Shelf. Geochem. Geophys. Geosyst. 18 (12), 4623–4645. doi:10.1002/2017gc007107
Gaspà Rebull, O., Cusí, J. D., Ruiz Fernández, M., and Muset, J. G. (2006). Tracking Fin Whale Calls Offshore the Galicia Margin, North East Atlantic Ocean. The J. Acoust. Soc. America 120 (4), 2077–2085. doi:10.1121/1.2336751
Grevemeyer, I., Gràcia, E., Villaseñor, A., Leuchters, W., and Watts, A. B. (2015). Seismicity and Active Tectonics in the Alboran Sea, Western Mediterranean: Constraints from an Offshore‐onshore Seismological Network and Swath Bathymetry Data. J. Geophys. Res. Solid Earth 120 (12), 8348–8365. doi:10.1002/2015jb012073
Handa, Y. P. (1990). Effect of Hydrostatic Pressure and Salinity on the Stability of Gas Hydrates. J. Phys. Chem. 94 (6), 2652–2657. doi:10.1021/j100369a077
Heimann, S., Kriegerowski, M., Isken, M., Cesca, S., Daout, S., Grigoli, F., et al. (2017). Pyrocko - an Open-Source Seismology Toolbox and Library. V. 0.3. GFZ Data Serv.
Himmler, T., Sahy, D., Martma, T., Bohrmann, G., Plaza-Faverola, A., Bünz, S., et al. (2019). A 160,000-Year-Old History of Tectonically Controlled Methane Seepage in the Arctic. Sci. Adv. 5 (8), eaaw1450. doi:10.1126/sciadv.aaw1450
Hong, W. L., Pape, T., Schmidt, C., Yao, H., Wallmann, K., and Plaza-Faverola, A. (2021). Interactions between Deep Formation Fluid and Gas Hydrate Dynamics Inferred from Pore Fluid Geochemistry at Active Pockmarks of the Vestnesa Ridge, West Svalbard Margin. Mar. Pet. Geology. 127. doi:10.1016/j.marpetgeo.2021.104957
Horozal, S., Bahk, J.-J., Urgeles, R., Kim, G. Y., Cukur, D., Kim, S.-P., et al. (2017). Mapping Gas Hydrate and Fluid Flow Indicators and Modeling Gas Hydrate Stability Zone (GHSZ) in the Ulleung Basin, East (Japan) Sea: Potential Linkage between the Occurrence of Mass Failures and Gas Hydrate Dissociation. Mar. Pet. Geology. 80, 171–191. doi:10.1016/j.marpetgeo.2016.12.001
Hovland, M., Gardner, J. V., and Judd, A. G. (2002). The Significance of Pockmarks to Understanding Fluid Flow Processes and Geohazards. Geofluids 2, 127–136. doi:10.1046/j.1468-8123.2002.00028.x
Howe, J. A., Shimmield, T. M., Harland, R. E. X., and Eyles, N. (2007). Late Quaternary Contourites and Glaciomarine Sedimentation in the Fram Strait. Sedimentology 55 (1), 179–200. doi:10.1111/j.1365-3091.2007.00897.x
Hsu, S.-K., Wang, S.-Y., Liao, Y.-C., Yang, T. F., Jan, S., Lin, J.-Y., et al. (2013). Tide-modulated Gas Emissions and Tremors off SW Taiwan. Earth Planet. Sci. Lett. 369-370, 98–107. doi:10.1016/j.epsl.2013.03.013
Hustoft, S., Bünz, S., Mienert, J., and Chand, S. (2009). Gas Hydrate Reservoir and Active Methane-Venting Province in Sediments on < 20 Ma Young Oceanic Crust in the Fram Strait, Offshore NW-Svalbard. Earth Planet. Sci. Lett. 284 (1-2), 12–24. doi:10.1016/j.epsl.2009.03.038
Johnson, B. D., Boudreau, B. P., Gardiner, B. S., and Maass, R. (2002). Mechanical Response of Sediments to Bubble Growth. Mar. Geology. 187 (3-4), 347–363. doi:10.1016/s0025-3227(02)00383-3
Judd, A., and Hovland, M. (2007). Seabed Fluid Flow : The Impact on Geology, Biology, and the marine Environment. Cambridge: Cambridge University Press.
Karstens, J., Haflidason, H., Becker, L. W. M., Berndt, C., Rüpke, L., Planke, S., et al. (2018). Glacigenic Sedimentation Pulses Triggered post-glacial Gas Hydrate Dissociation. Nat. Commun. 9 (1), 635. doi:10.1038/s41467-018-03043-z
Knies, J., Daszinnies, M., Plaza-Faverola, A., Chand, S., Sylta, Ø., Bünz, S., et al. (2018). Modelling Persistent Methane Seepage Offshore Western Svalbard since Early Pleistocene. Mar. Pet. Geology. 91, 800–811. doi:10.1016/j.marpetgeo.2018.01.020
Kvenvolden, K. A., Lorenson, T. D., and Reeburgh, W. S. (2001). Attention Turns to Naturally Occurring Methane Seepage. Eos Trans. AGU 82 (40), 457. doi:10.1029/01eo00275
Liu, X., and Flemings, P. B. (2011). Capillary Effects on Hydrate Stability in marine Sediments. J. Geophys. Res. Solid Earth 116 (B7). doi:10.1029/2010jb008143
Liu, Y., Tao, C., Liu, C., Qiu, L., Schlindwein, V., Zhang, H., et al. (2018). Seismic Activity Recorded by a Single OBS/H Near the Active Longqi Hydrothermal Vent at the Ultraslow Spreading Southwest Indian Ridge (49°39′ E). Mar. Georesources Geotechnology 37 (2), 201–211. doi:10.1080/1064119x.2017.1420114
Lopes, M. A., and Tenreiro Machado, J. (2017). Tidal Analysis Using Time–Frequency Signal Processing and Information Clustering. Entropy 19 (8). e19080390. doi:10.3390/e19080390
Løviknes, S., Jensen, K. H., Krafft, B. A., Anthonypillai, V., and Nøttestad, L. (2021). Feeding Hotspots and Distribution of Fin and Humpback Whales in the Norwegian Sea from 2013 to 2018. Front. Mar. Sci. 8.
Mau, S., Römer, M., Torres, M. E., Bussmann, I., Pape, T., Damm, E., et al. (2017). Widespread Methane Seepage along the continental Margin off Svalbard - from Bjørnøya to Kongsfjorden. Sci. Rep. 7, 42997. doi:10.1038/srep42997
McDonald, M. A., Hildebrand, J. A., and Webb, S. C. (1995). Blue and Fin Whales Observed on a Seafloor Array in the Northeast pacific. J. Acoust. Soc. Am. 98 (2 Pt 1), 712–721. doi:10.1121/1.413565
McDonald, M. A., Mesnick, S. L., and Hildebrand, J. A. (2006). Biogeographic Characterization of Blue Whale Song Worldwide: Using Song to Identify Populations. J. Cetacean Res. Manage. 8 (1), 55–65.
Meier, M., Schlindwein, V., Scholz, J. R., Geils, J., Schmidt-Aursch, M. C., and Kruger, F. (2021). Segment-Scale Seismicity of the Ultraslow Spreading Knipovich Ridge. Geochem. Geophys. Geosystems 22 (2), e2020GC009375. doi:10.1029/2020gc009375
Mellinger, D. K., and Clark, C. W. (2003). Blue Whale (Balaenoptera Musculus) Sounds from the North Atlantic. J. Acoust. Soc. America 114 (2), 1108–1119. doi:10.1121/1.1593066
Mishra, C. K., Dewangan, P., Sriram, G., Kumar, A., and Dakara, G. (2020). Spatial Distribution of Gas Hydrate Deposits in Krishna-Godavari Offshore basin, Bay of Bengal. Mar. Pet. Geology. 112. doi:10.1016/j.marpetgeo.2019.104037
Monigle, P. W., Bohnenstiehl, D. R., Tolstoy, M., and Waldhauser, F. (2009). Seismic Tremor at the 9°50′N East Pacific Rise Eruption Site. Geochem. Geophys. Geosystems 10 (11). doi:10.1029/2009gc002561
Morano, J. L., Salisbury, D. P., Rice, A. N., Conklin, K. L., Falk, K. L., and Clark, C. W. (2012). Seasonal and Geographical Patterns of Fin Whale Song in the Western North Atlantic Ocean. J. Acoust. Soc. America 132 (2), 1207–1212. doi:10.1121/1.4730890
Ostrovsky, A. A. (1989). On the Nature of Microshocks Recorded by Ocean Bottom Seismographs. Mar. Geophys. Res. 11 (2), 113–118. doi:10.1007/bf00285662
Ottesen, D., Dowdeswell, J. A., and Rise, L. (2005). Submarine Landforms and the Reconstruction of Fast-Flowing Ice Streams within a Large Quaternary Ice Sheet: The 2500-Km-Long Norwegian-Svalbard Margin (57°–80°N). GSA Bull. 117 (7-8), 1033–1050. doi:10.1130/b25577.1
Panieri, G., Bünz, S., Fornari, D. J., Escartin, J., Serov, P., Jansson, P., et al. (2017). An Integrated View of the Methane System in the Pockmarks at Vestnesa Ridge, 79°N. Mar. Geology. 390, 282–300. doi:10.1016/j.margeo.2017.06.006
Pape, T., Bünz, S., Hong, W. L., Torres, M. E., Riedel, M., and Panieri, G. (2020). Origin and Transformation of Light Hydrocarbons Ascending at an Active Pockmark on Vestnesa Ridge, Arctic Ocean. J. Geophys. Res. Solid Earth 125 (1). doi:10.1029/2018jb016679
Petersen, C. J., Bünz, S., Hustoft, S., Mienert, J., and Klaeschen, D. (2010). High-resolution P-Cable 3D Seismic Imaging of Gas Chimney Structures in Gas Hydrated Sediments of an Arctic Sediment Drift. Mar. Pet. Geology. 27 (9), 1981–1994. doi:10.1016/j.marpetgeo.2010.06.006
Plant, J. N., Johnson, K. S., Fitzwater, S. E., Sakamoto, C. M., Coletti, L. J., and Jannasch, H. W. (2010). Tidally Oscillating Bisulfide Fluxes and Fluid Flow Rates Observed with In Situ Chemical Sensors at a Warm spring in Monterey Bay, California. Deep Sea Res. Oceanographic Res. Pap. 57 (12), 1585–1595. doi:10.1016/j.dsr.2010.10.001
Plaza-Faverola, A., Bünz, S., Johnson, J. E., Chand, S., Knies, J., Mienert, J., et al. (2015). Role of Tectonic Stress in Seepage Evolution along the Gas Hydrate-Charged Vestnesa Ridge, Fram Strait. Geophys. Res. Lett. 42 (3), 733–742. doi:10.1002/2014gl062474
Plaza-Faverola, A., Bünz, S., and Mienert, J. (2010). Fluid Distributions Inferred from P-Wave Velocity and Reflection Seismic Amplitude Anomalies beneath the Nyegga Pockmark Field of the Mid-Norwegian Margin. Mar. Pet. Geology. 27 (1), 46–60. doi:10.1016/j.marpetgeo.2009.07.007
Plaza-Faverola, A., and Keiding, M. (2019). Correlation between Tectonic Stress Regimes and Methane Seepage on the Western Svalbard Margin. Solid Earth 10 (1), 79–94. doi:10.5194/se-10-79-2019
Plaza-Faverola, A., Pecher, I., Crutchley, G., Barnes, P. M., Bünz, S., Golding, T., et al. (2014). Submarine Gas Seepage in a Mixed Contractional and Shear Deformation Regime: Cases from the Hikurangi Oblique-Subduction Margin. Geochem. Geophys. Geosyst. 15 (2), 416–433. doi:10.1002/2013gc005082
Plaza-Faverola, A., Vadakkepuliyambatta, S., Hong, W.-L., Mienert, J., Bünz, S., Chand, S., et al. (2017). Bottom-simulating Reflector Dynamics at Arctic Thermogenic Gas Provinces: An Example from Vestnesa Ridge, Offshore West Svalbard. J. Geophys. Res. Solid Earth 122 (6), 4089–4105. doi:10.1002/2016jb013761
Ramakrushana Reddy, T., Dewangan, P., Arya, L., Singha, P., and Raju, K. A. (2020). Tidal Triggering of the Harmonic Noise in Ocean-Bottom Seismometers. Seismological Res. Lett. 91 (2A), 803–813. doi:10.1785/0220190080
Rice, A., Širović, A., Trickey, J. S., Debich, A. J., Gottlieb, R. S., and Wiggins, S. M. (2021). Cetacean Occurrence in the Gulf of Alaska from Long-Term Passive Acoustic Monitoring. Mar. Biol. 168 (5). doi:10.1007/s00227-021-03884-1
Riedel, M., Scherwath, M., Römer, M., Veloso, M., Heesemann, M., and Spence, G. D. (2018). Distributed Natural Gas Venting Offshore along the Cascadia Margin. Nat. Commun. 9 (1), 3264. doi:10.1038/s41467-018-05736-x
Ritzmann, O., Jokat, W., Czuba, W., Guterch, A., Mjelde, R., and Nishimura, Y. (2004). A Deep Seismic Transect from Hovgård Ridge to Northwestern Svalbard across the continental-ocean Transition: A Sheared Margin Study. Geophys. J. Int. 157 (2), 683–702. doi:10.1111/j.1365-246x.2004.02204.x
Roman, D. C. (2017). Automated Detection and Characterization of Harmonic Tremor in Continuous Seismic Data. Geophys. Res. Lett. 44 (12), 6065–6073. doi:10.1002/2017gl073715
Römer, M., Riedel, M., Scherwath, M., Heesemann, M., and Spence, G. D. (2016). Tidally Controlled Gas Bubble Emissions: A Comprehensive Study Using Long-Term Monitoring Data from the NEPTUNE Cabled Observatory Offshore Vancouver Island. Geochem. Geophys. Geosyst. 17 (9), 3797–3814. doi:10.1002/2016gc006528
Römer, M., Torres, M., Kasten, S., Kuhn, G., Graham, A. G. C., Mau, S., et al. (2014). First Evidence of Widespread Active Methane Seepage in the Southern Ocean, off the Sub-antarctic Island of South Georgia. Earth Planet. Sci. Lett. 403, 166–177. doi:10.1016/j.epsl.2014.06.036
Schlindwein, V., Demuth, A., Geissler, W. H., and Jokat, W. (2013). Seismic gap beneath Logachev Seamount: Indicator for Melt Focusing at an Ultraslow Mid-ocean ridge? Geophys. Res. Lett. 40 (9), 1703–1707. doi:10.1002/grl.50329
Schneider, A., Panieri, G., Lepland, A., Consolaro, C., Crémière, A., Forwick, M., et al. (2018). Methane Seepage at Vestnesa Ridge (NW Svalbard) since the Last Glacial Maximum. Quat. Sci. Rev. 193, 98–117. doi:10.1016/j.quascirev.2018.06.006
Schultz, A., Delaney, J. R., and McDuff, R. E. (1992). On the Partitioning of Heat Flux between Diffuse and point Source Seafloor Venting. J. Geophys. Res. 97 (B9). doi:10.1029/92jb00889
Sgroi, T., Monna, S., Embriaco, D., Giovanetti, G., Marinaro, G., and Favali, P. (2014). Geohazards in the Western Ionian Sea: Insights from Non-earthquake Signals Recorded by the NEMO-SN1 Seafloor Observatory. Oceanog 27 (2), 154–166. doi:10.5670/oceanog.2014.51
Sgroi, T., Polonia, A., Beranzoli, L., Billi, A., Bosman, A., Costanza, A., et al. (2021). One Year of Seismicity Recorded through Ocean Bottom Seismometers Illuminates Active Tectonic Structures in the Ionian Sea (Central Mediterranean). Front. Earth Sci. 9, 643. doi:10.3389/feart.2021.661311
Shipley, T. H., Houston, M. H., Buffler, R. T., Shaub, F. J., McMillen, K. J., Laod, J. W., et al. (1979). Seismic Evidence for Widespread Possible Gas Hydrate Horizons on Continental Slopes and Rises1. AAPG Bull. 63 (12), 2204–2213. doi:10.1306/2f91890a-16ce-11d7-8645000102c1865d
Singhroha, S., Bünz, S., Plaza-Faverola, A., and Chand, S. (2020). Detection of Gas Hydrates in Faults Using Azimuthal Seismic Velocity Analysis, Vestnesa Ridge, W-Svalbard Margin. J. Geophys. Res. Solid Earth 125 (2). doi:10.1029/2019jb017949
Singhroha, S., Bünz, S., Plaza-Faverola, A., and Chand, S. (2016). Gas Hydrate and Free Gas Detection Using Seismic Quality Factor Estimates from High-Resolution P-cable 3D Seismic Data. Interpretation 4 (1), SA39–SA54. doi:10.1190/int-2015-0023.1
Singhroha, S., Chand, S., and Bünz, S. (2019). Constraints on Gas Hydrate Distribution and Morphology in Vestnesa Ridge, Western Svalbard Margin, Using Multicomponent Ocean‐Bottom Seismic Data. J. Geophys. Res. Solid Earth 124 (5), 4343–4364. doi:10.1029/2018jb016574
Smith, A. J., Mienert, J., Bünz, S., and Greinert, J. (2014). Thermogenic Methane Injection via Bubble Transport into the Upper Arctic Ocean from the Hydrate-Charged Vestnesa Ridge, Svalbard. Geochem. Geophys. Geosyst. 15 (5), 1945–1959. doi:10.1002/2013gc005179
Sohn, R. A., Hildebrand, J. A., Webb, S. C., and Fox, C. G. (1995). Hydrothermal microseismicity at the megaplume site on the southern Juan de Fuca Ridge. Bull. Seismological Soc. America 85 (3), 775–786.
Soule, D. C., and Wilcock, W. S. D. (2013). Fin whale tracks recorded by a seismic network on the Juan de Fuca Ridge, Northeast Pacific Ocean. J. Acoust. Soc. America 133 (3), 1751–1761. doi:10.1121/1.4774275
Stähler, S. C., Schmidt‐Aursch, M. C., Hein, G., and Mars, R. (2018). A Self‐Noise Model for the German DEPAS OBS Pool. Seismological Res. Lett. 89 (5), 1838–1845. doi:10.1785/0220180056
Storrie, L., Lydersen, C., Andersen, M., Wynn, R. B., and Kovacs, K. M. (2018). Determining the Species Assemblage and Habitat Use of Cetaceans in the Svalbard Archipelago, Based on Observations from 2002 to 2014. Polar Res. 37 (1). doi:10.1080/17518369.2018.1463065
Sultan, N., Plaza-Faverola, A., Vadakkepuliyambatta, S., Buenz, S., and Knies, J. (2020). Impact of Tides and Sea-Level on Deep-Sea Arctic Methane Emissions. Nat. Commun. 11 (1), 5087. doi:10.1038/s41467-020-18899-3
Sultan, N., Riboulot, V., Ker, S., Marsset, B., Géli, L., and Tary, J. B. (2011). Dynamics of Fault-Fluid-Hydrate System Around a Shale-Cored Anticline in deepwater Nigeria. J. Geophys. Res. 116 (B12). doi:10.1029/2011jb008218
Sun, R., and Duan, Z. (2007). An Accurate Model to Predict the Thermodynamic Stability of Methane Hydrate and Methane Solubility in marine Environments. Chem. Geology. 244 (1-2), 248–262. doi:10.1016/j.chemgeo.2007.06.021
Sutterley, T. C., Markus, T., Neumann, T. A., van den Broeke, M., van Wessem, J. M., and Ligtenberg, S. R. M. (2019). Antarctic Ice Shelf Thickness Change from Multimission Lidar Mapping. The Cryosphere 13 (7), 1801–1817. doi:10.5194/tc-13-1801-2019
Sutton, G. H., McDonald, W. G., Prentiss, D. D., and Thanos, S. N. (1965). Ocean-bottom Seismic Observatories. Proc. IEEE 53 (12), 1909–1921. doi:10.1109/proc.1965.4468
Tary, J. B., Géli, L., Guennou, C., Henry, P., Sultan, N., Çağatay, N., et al. (2012). Microevents Produced by Gas Migration and Expulsion at the Seabed: a Study Based on Sea Bottom Recordings from the Sea of Marmara. Geophys. J. Int. 190 (2), 993–1007. doi:10.1111/j.1365-246x.2012.05533.x
Taylor, M. H., Dillon, W. P., and Pecher, I. A. (2000). Trapping and Migration of Methane Associated with the Gas Hydrate Stability Zone at the Blake Ridge Diapir: New Insights from Seismic Data. Mar. Geology. 164 (1), 79–89. doi:10.1016/s0025-3227(99)00128-0
Thomsen, L., Barnes, C., Best, M., Chapman, R., Pirenne, B., Thomson, R., et al. (2012). Ocean Circulation Promotes Methane Release from Gas Hydrate Outcrops at the NEPTUNE Canada Barkley Canyon Node. Geophys. Res. Lett. 39 (16). doi:10.1029/2012gl052462
Tishchenko, P., Hensen, C., Wallmann, K., and Wong, C. S. (2005). Calculation of the Stability and Solubility of Methane Hydrate in Seawater. Chem. Geology. 219 (1-4), 37–52. doi:10.1016/j.chemgeo.2005.02.008
Torres, M. E., McManus, J., Hammond, D., De Angelis, M., Heeschen, K., and Colbert, S. (2002). Fluid and Chemical Fluxes in and Out of Sediments Hosting Methane Hydrate Deposits on Hydrate Ridge, OR, I: Hydrological Provinces. Earth Planet. Sci. Lett. 201 (3-4), 525–540. doi:10.1016/s0012-821x(02)00733-1
Tsang-Hin-Sun, E., Batsi, E., Klingelhoefer, F., and Géli, L. (2019). Spatial and Temporal Dynamics of Gas-Related Processes in the Sea of Marmara Monitored with Ocean Bottom Seismometers. Geophys. J. Int. 216 (3), 1989–2003. doi:10.1093/gji/ggy535
Ugalde, A., Gaite, B., Ruiz, M., Villaseñor, A., and Ranero, C. R. (2019). Seismicity and Noise Recorded by Passive Seismic Monitoring of Drilling Operations Offshore the Eastern Canary Islands. Seismological Res. Lett. doi:10.1785/0220180353
Veloso, M., Greinert, J., Mienert, J., and De Batist, M. (2015). A New Methodology for Quantifying Bubble Flow Rates in Deep Water Using Splitbeam Echosounders: Examples from the A Rctic Offshore NW‐ S Valbard. Limnol. Oceanogr. Methods 13 (6), 267–287. doi:10.1002/lom3.10024
Veloso-Alarcon, M. E., Janson, P., De Batist, M., Minshull, T. A., Westbrook, G. K., and Palikes, H. (2019). Variability of Acoustically Evidenced Methane Bubble Emissions Offshore Western Svalbard. Geophys. Res. Lett. 46 (15), 9072–9081.
Vogt, P. R., and Crane, K. (1994). Methane-generated( ) Pockmarks on Young, Thickly Sedimented Oceanic Crust in the Arctic. Vestnesa ridge, Fram Strait. Geology 22 (3). doi:10.1130/0091-7613(1994)022<0255:mgpoyt>2.3.co;2
Wallmann, K., Riedel, M., Hong, W. L., Patton, H., Hubbard, A., Pape, T., et al. (2018). Gas Hydrate Dissociation off Svalbard Induced by Isostatic Rebound rather Than Global Warming. Nat. Commun. 9 (1), 83. doi:10.1038/s41467-017-02550-9
Webb, S. C. (1998). Broadband Seismology and Noise under the Ocean. Rev. Geophys. 36 (1), 105–142. doi:10.1029/97rg02287
Wessel, P., Luis, J. F., Uieda, L., Scharroo, R., Wobbe, F., Smith, W. H. F., et al. (2019). The Generic Mapping Tools Version 6. Geochem. Geophys. Geosyst. 20, 5556–5564. doi:10.1029/2019gc008515
Keywords: ocean-bottom seismometer, micro-seismicity, short duration events, methane seepage, gas hydrates, tidal cycle
Citation: Domel P, Singhroha S, Plaza-Faverola A, Schlindwein V, Ramachandran H and Bünz S (2022) Origin and Periodic Behavior of Short Duration Signals Recorded by Seismometers at Vestnesa Ridge, an Active Seepage Site on the West-Svalbard Continental Margin. Front. Earth Sci. 10:831526. doi: 10.3389/feart.2022.831526
Received: 08 December 2021; Accepted: 02 February 2022;
Published: 02 March 2022.
Edited by:
Mourad Bezzeghoud, Universidade de Évora, PortugalReviewed by:
Kimihiro Mochizuki, The University of Tokyo, JapanChristopher Schmidt, Helmholtz Association of German Research Centres (HZ), Germany
Copyright © 2022 Domel, Singhroha, Plaza-Faverola, Schlindwein, Ramachandran and Bünz. This is an open-access article distributed under the terms of the Creative Commons Attribution License (CC BY). The use, distribution or reproduction in other forums is permitted, provided the original author(s) and the copyright owner(s) are credited and that the original publication in this journal is cited, in accordance with accepted academic practice. No use, distribution or reproduction is permitted which does not comply with these terms.
*Correspondence: P. Domel, przemyslaw.domel@uit.no