Shear Creep Properties and Creep Model of Gravel Sliding Zone: A Case Study of the Zhoujia Landslide in China
 Shizhuang Chen1,2
  Weiya Xu
 Long Yan
- 1Key Laboratory of Ministry of Education for Geomechanics and Embankment Engineering, Hohai University, Nanjing, China
- 2Research Institute of Geotechnical Engineering, Hohai University, Nanjing, China
- 3Powerchina Huadong Engineering Corporation Limited, Hangzhou, China
- 4Department of Civil and Environmental Engineering, University of Waterloo, Waterloo, ON, Canada
Creep behavior of landslide sliding zones is closely related to the long-term stability and safety of landslides. In this paper, shear creep tests are carried out on undisturbed samples of the gravel sliding zone in the Zhoujia landslide. Creep properties, such as creep rate and long-term strength, of the sliding zone are studied. The result shows that the sliding zone has typical time-dependent behavior. The relationship between the steady strain rate and shear stress can be described by an exponential equation. The long-term strengths of the sliding zone under different normal stresses are determined by using the isochronous curve cluster method. A nonlinear viscoelastic-plastic creep model is developed based on the Nishihara model. The model is shown to be suitable for describing the accelerated creep deformation of the sliding zone. The results obtained are of practical significance for understanding the deformations of the Zhoujia landslide.
1 Introduction
Landslide is an important geological phenomenon, in which a soil or rock mass on a slope slips along the shear failure surface (Xu et al., 2021). As one of the most frequently occurring geological disasters, it often causes heavy casualties, economic losses, and even catastrophic consequences (Froude and Petley, 2018; Lin and Wang, 2018; Yan et al., 2019; Wang H. et al., 2020). On June 18, 1972, 67 people were killed and 20 injured in the landslide caused by heavy rain on Baoshan Road, Mid-levels, Hong Kong, China. On 22 March 2014 (Au, 1998), the Oso landslide in the United States occurred on a large scale with a volume of 8.3 million m3, resulting in 43 deaths (Stark et al., 2017). China is one of the most serious areas in the world with landslide hazard. Especially since the 1980s, occurrences of large landslides in southwest China have been increasing year by year (Huang, 2009; Xu et al., 2014).
For most landslides, the entire process from formation to instability is characterized by distinct creep deformation (Oberender and Puzrin, 2016; Sun et al., 2016), which is a critical factor to consider in the stability evaluation and prediction of landslides. The evolution of deformation and stability of creeping landslides are affected by combined effects of internal and external factors (Sun et al., 2017). On the one hand, the deformation and mechanical properties of landslide materials, especially soil in the landslide zones, have a time effect affecting the behavior of landslides. On the other hand, the seepage fields and stress fields of slopes are continuously changing affected by a number of factors, such as rainfall, rise and fall of reservoir water level, and ground load, which may induce landslide sliding. Therefore, studies on the deformation and failure of creeping landslides should be based on the creep properties of the landslide materials. In recent years, there have been increasing efforts aimed at studying creep properties and creep models of sliding zones. Xu (2012) summarized landslide deformation, failure behavior, and deformation-time curves of a large number of landslides, and found that macroscopic deformation and failure behavior of creeping landslides were mainly caused by the flow and rupture of mesoscale particles of rock and soil mass from the perspective of mesomechanics. Ren et al. (2021) analyzed the mechanism of shear failure of sliding zones from the meso-structures of shear planes, based on direct shear tests and high-precision 3D laser scanning technology. From the results of direct shear tests of soil-rock mixture (SRM), Yu et al. (2021) found that the higher the rock content, the stronger the bond between soil and rock, and the greater the shear strength. Tang et al. (2020) conducted triaxial creep tests on loess under different water contents and pressure conditions; it was found that creep behavior of loess is significant at high moisture levels and that less time-dependent deformation occurs at high confining pressures. Wang L. et al. (2020) investigated the effect of shear rate on shear residual strength of slip zone soils. Although theoretical and experimental studies on homogeneous materials, such as clay and silty clay, have garnered a lot of attentions in recent years, there has been a lack of research on gravel soil. Significant influence of large-size gravel on characteristics of deformation and strength of soil was demonstrated in a study by Cheng et al. (Zhanlin et al., 2007). Therefore, large-scale creep tests on gravel sliding zones are necessary for better understanding of the deformation evolution and stability of creeping landslides.
Based on the results of large-scale creep shear tests of gravel sliding zones, the creep properties of the sliding zone of the Zhoujia landslide, which is of great importance for further understanding the deformation and failure mechanism of the landslide, are investigated in this paper. A nonlinear viscoelastic-plastic creep (NVPC) model is proposed. Compared with the existing traditional models, this model is more suitable for describing accelerated creep deformation under shear load. The model can be applied in stability analysis of the Zhoujia landslide, providing an important reference for the risk control of the area and the safety of the reservoir.
2 Background of the Zhoujia Landslide
The Zhoujia landslide is located on the right bank of Yalong River in Sichuan Province of southwest China, which is about 9.2–11.0 km away from the dam site of Kala Hydropower Station. The landslide is M-shaped and is divided into three zones: Zone A, Zone B1, and Zone B2, as shown in Figure 1. The length of the landslide, in the direction parallel to the river, is about 1840 m. The elevations of the leading edge and the trailing edge of the landslide are 1931 and 2,730 m, respectively, with a difference in elevations of about 800 m. The span of the landslide, in the direction perpendicular to the river, is about 1,210 m. The average thickness of the landslide is 47.9 m, and the total volume is about 7,299 × 104 m3. The geological profile I-I′ of the Zhoujia landslide, shown in Figure 2, indicates that it is mainly composed of surface colluvial slope deposit (Q4col+dl), block stone layer (Q3del-k), pebbly silt (Q3del-f), and sliding zone (Q3del-h). The inclinometer profile of borehole INzj1-1 shows that significant horizontal displacement has occurred at depths of 17 and 52 m. This implies a double shear-surface structure of the landslide.
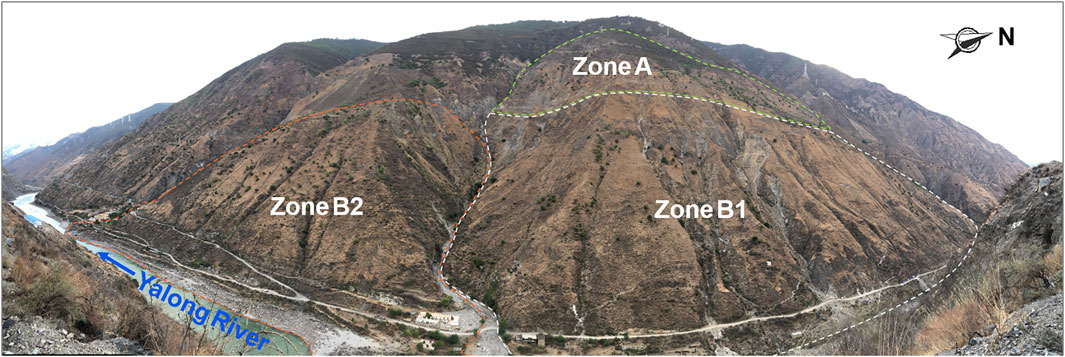
FIGURE 1. The Zhoujia landslide.
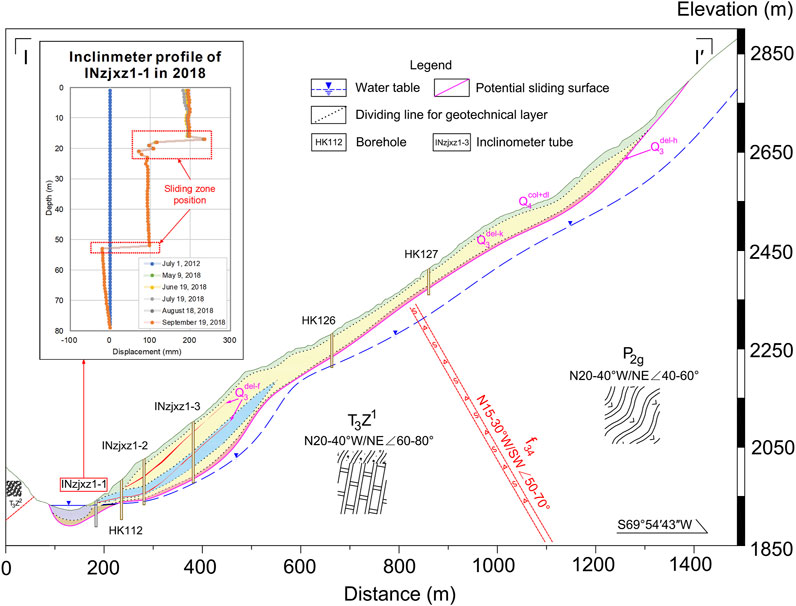
FIGURE 2. Profile I-I′ of the Zhoujia landslide.
3 Methodology
3.1 Test Materials
The sampling location is in exploration adit TD37 (elevation 2,191.8 m) in Zone B1 of the Zhoujia landslide, 63.5–65.0 m away from the entrance of the exploration adit. The exposed sliding zone (Figure 3A) is composed of mainly gray-yellow and gray-brown gravel soil, and its thickness is about 0.3–1.0 m. The content of gravel is 50–60%, and the structure of sliding zone is dense. Experiments on basic physical properties were conducted on the sliding zone and the results indicate that the average density is 2.3 g/cm3 and the water content is 10.3%; hence, the average dry density of sliding zone is 2.1 g/cm3. The distribution of particle size is shown in Figure 4.
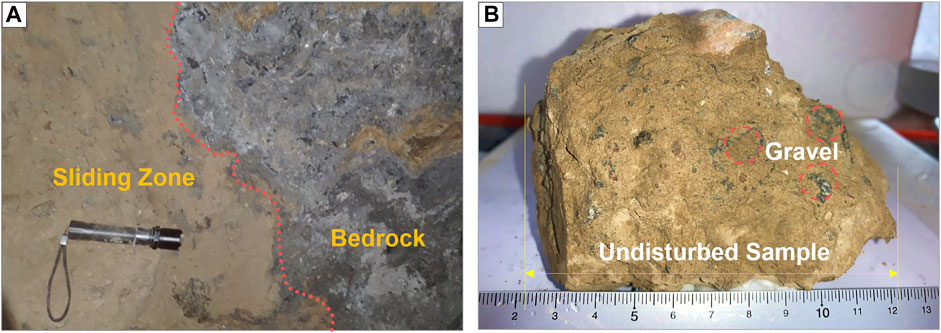
FIGURE 3. Sliding zone and rock sample (A) Exposed sliding zone, (B) An undisturbed sample.
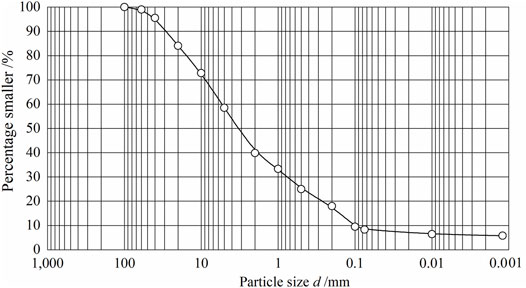
FIGURE 4. Distribution of particle size of sliding zone.
The undisturbed sample of the sliding zone were prepared in the field in Figure 3B. Considering the size limitation of the direct shear box (150 × 150 × 150 mm), the sampling location was carefully selected so that the maximum gravel size did not exceed 75 mm. If the size of gravel was larger than 75 mm, they were replaced with fine-grained soil in the process of sample preparation. The samples were sealed with a thin plastic film to preserve the in situ moisture content.
3.2 Test Equipment and Procedure
Creep experiments were carried out on a CSS-3940YJ shear rheological testing machine developed by Changchun Testing Machine Research Institute, China. All tests are conducted in the laboratory condition with constant temperature (24 ± 0.5°C) and humidity. The samples are consolidated for at least 24 h until the vertical settlement is less than 0.05 mm/h. Direct shear tests are first carried out on the sliding zone. The normal stresses, which are the converted overburden earth pressures at each sampling location, are set at 851, 1,100, and 1,380 kPa. The normal stress is kept constant until completion of the test, and the shear rate is 0.02 mm/min. Two or three groups of tests are repeated under each normal stress.
According to the results of direct shear tests, the shear creep test procedure is formulated. The samples are consolidated for at least 24 h until the vertical settlement tended to be constant. Shear creep tests are then carried out. Because the number of prepared samples is limited, the multi-loading method is adopted. Each shear loading increment is 1/11 to 1/5 of the peak strength of direct shear under the corresponding normal stress. At least five levels of shear load are applied, and the loading rate is 0.1 kN/min. When the shear deformation is less than 5 × 10⁻⁴ mm/day, the next level of the shear load is applied.
4 Experimental Results
4.1 Direct Shear Test
A series of direct shear tests under different normal stresses are carried out first to study the shear mechanical properties of the sliding zone and to provide data support for estimating shear stress levels of shear creep tests. The stress-strain curves of the sliding zone under various normal stresses are presented in Figure 5B. It is obvious that the stress-strain curves have no distinct peaks and generally exhibit ideal elastic-plastic characteristics. With the increase of normal stress, the shear strength of the sliding zone increases gradually. Deformations of the samples can be divided into three stages. During the initial loading stage, the slope of the stress-strain curve is relatively small, which means that shear stress increases slowly. This can be attributed to the closure of pores and cracks between gravel and soil. With the increase of shear stress, the slope of the stress-strain curve increases rapidly. When the stress is close to the peak value, the soil in the sample reaches yield, and the slope of the stress-strain curve decreases gradually. Lateral expansion occurs in the sample, with soil or gravel extruding. When the shear stress exceeds the peak shear strength, the soil-rock structure in the sample breaks down and recombines, and the stress-strain curve shows strain-hardening characteristics. In Figure 5A, the Mohr-Coulomb criterion is used to fit the relationship between peak shear strength and residual shear strength under different normal stresses. It can be seen that there are good linear relationships between the normal stress and the peak shear strength and between the normal stress and residual shear strength. The internal angles of friction are 33.42° and 33.02° and the corresponding cohesions are 91.49 and 80.64 kPa, respectively.
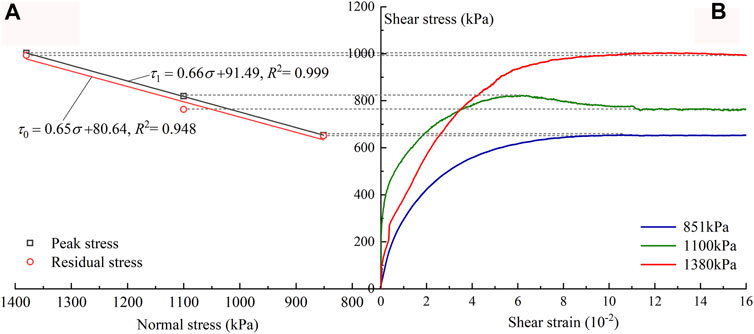
FIGURE 5. Results of direct shear tests. (A) Fitting curves of peak stress and residual stress, (B) Stress-strain curves under different normal stresses.
4.2 Shear Creep Test
Similar to most creeping landslides in reservoir areas, the Zhoujia landslide is moving slowly with obvious creep properties. Because creep properties of the sliding zone are critically important for the long-term safety and stability of Kala Hydropower Station during both construction and operation, multi-loading shear creep tests were carried out under different normal stresses. The stress conditions are listed in Table 1.
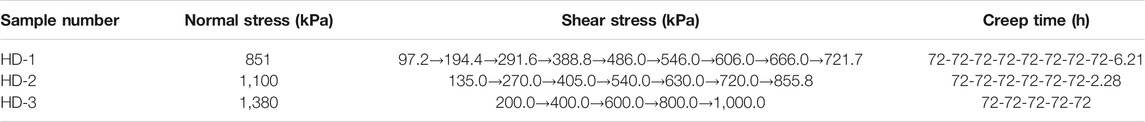
TABLE 1. Applied shear stresses under different normal stresses.
4.2.1 Shear Creep Properties
The classical shear creep properties of all samples during the loading processes are shown in Figure 6. The deformation curves are divided into three creep stages: transient creep, steady-state creep, and accelerated creep (Jia et al., 2018; Han et al., 2021). It is obvious that the samples exhibit characteristics of transient deformation at the beginning of each loading process, with large shear displacement occurring in a short period of time. Transient deformation is a large part of the total deformation. As time goes by, the shear strain rate gradually decays to a constant, and the sample enters a steady creep stage. Finally, the sample breaks down, and the accelerated creep stage takes place.
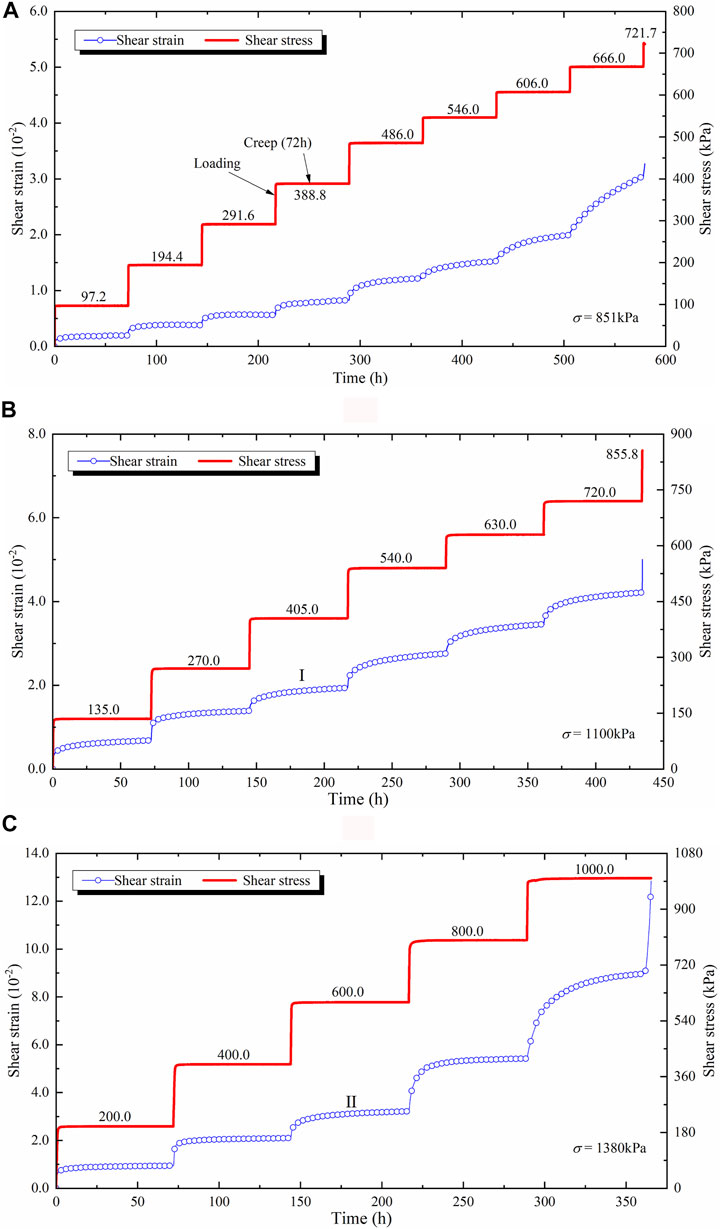
FIGURE 6. Results of shear creep tests of undisturbed samples of the sliding zone under normal stresses of (A) 851 kPa, (B) 1,100 kPa, (C) 1,380 kPa.
It is found that shear strain increases step-by-step with step-wise increase of shear stress under the same normal stress. However, there are special cases, such as stage Ⅰ in Figure 6B and stage Ⅱ in Figure 6C. This is due to the friction of one gravel with another gravel on the failure surface in the loading process, resulting in occlusal effect, which prevents the deformation of samples. In Figure 7, white friction scratches appear on the failure surface. With the same shear stress increment, the creep deformation of the sample under normal stress of 1,380 kPa is greater than that under normal stress of 1,100 kPa, which is greater than that under normal stress of 851 kPa.
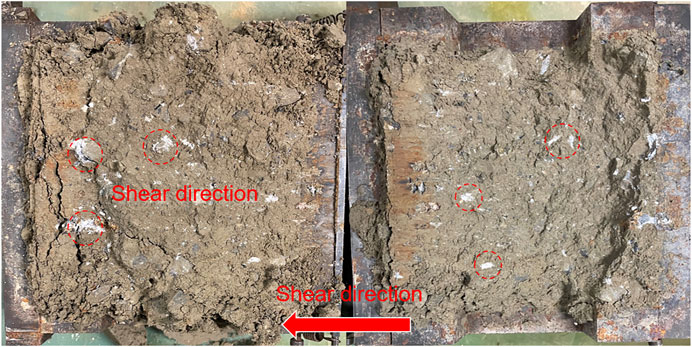
FIGURE 7. The failure surface of the sample.
4.2.2 Shear Creep Rate
The variations of shear creep deformation and shear strain rate with time under shear stresses of 194.4 and 666.0 kPa are presented in Figure 8A,B, respectively, for sample HD-3. When the shear stress is less than the value of the last stage (Figure 8A), the shear strain rate versus time curve exhibits an L-shaped characteristic: the shear creep rate is very large initially, then it decreases rapidly and approaches a small constant value, usually less than 0.06 × 10⁻² mm/h. At the final shear stress level (Figure 8B), the shear strain rate versus time curve exhibits a U-shaped characteristic: the shear creep rate decreases rapidly to a small constant value, and then the creep rate increases abruptly until the test is stopped.
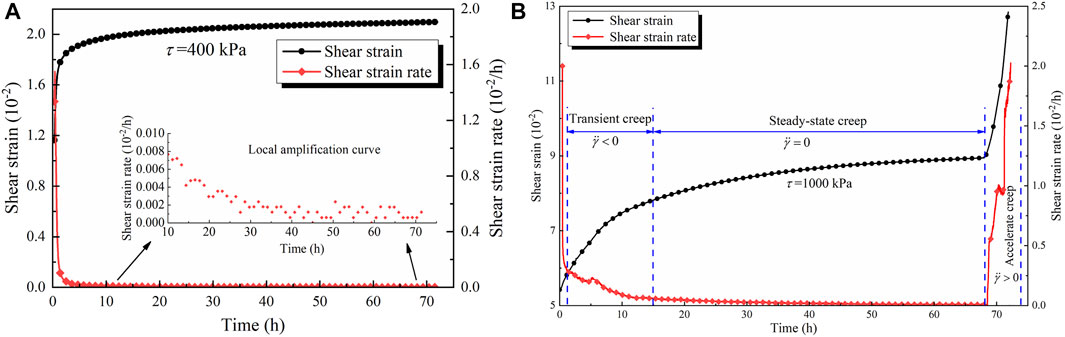
FIGURE 8. Creep behavior of sample HD-3 (A) Shear creep curve under shear stress 400kPa, (B) Shear strain and strain rate vs time at the final stress level.
It is found that the steady-state creep rate increases with the shear stress level. The exponential function can be used to fit the experimental data (Figure 9) as follows (Jia et al., 2018)
where α and β are constant parameters, τc is the shear stress, and vc is the corresponding steady-state creep rate. The values of parameter α are 1.845 × 10⁻⁴, 9.207 × 10⁻⁴, and 2.501 × 10⁻⁴, the values of β are 0.0058, 0.0025, and 0.0042, and the corresponding R2 values are 0.951, 0.966, and 0.998, respectively, under normal stresses of 851, 1,100, 1,380 kPa. The high values of R2 indicate that the curves fit the experimental results well.
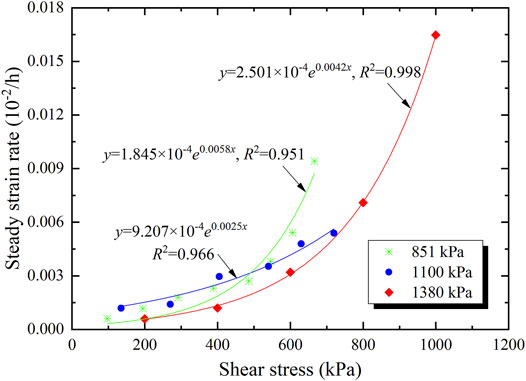
FIGURE 9. Relationship between steady strain rate and shear stress.
4.2.3 Long-Term Shear Strength
It is of great significance to obtain the long-term shear strengths of sliding zones for the long-term safety and stability of landslides (Liu et al., 2004; Shen et al., 2012). In this study, the isochronous curve cluster method (Li et al., 2010) is applied to determine the long-term strength of the sliding zone of the Zhoujia landslide. Shear strains corresponding to different shear stresses at a certain time interval are selected, and the shear stress-strain isochronous curves are plotted, as shown in Figure 10 for sample HD-3. It is obvious that these isochronous clusters of curves have great similarities. The shear stress corresponding to the turning point of clusters of curves from linear to nonlinear is defined as the long-term strength. Values of the long-term strength of the sliding zone are listed in Table 2. It can be seen that the long-term strengths of the three samples are lower than their instantaneous strength, and the reduction range is 13–18%.
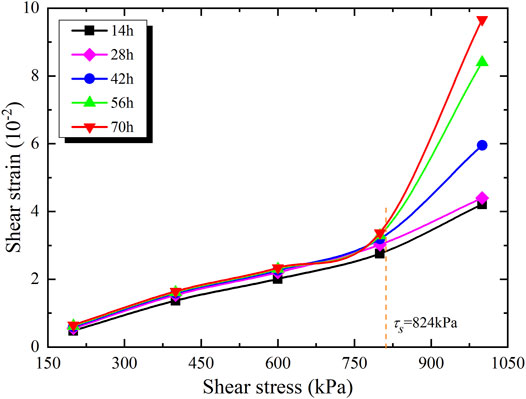
FIGURE 10. Isochronous curve cluster graph of sample HD-3.
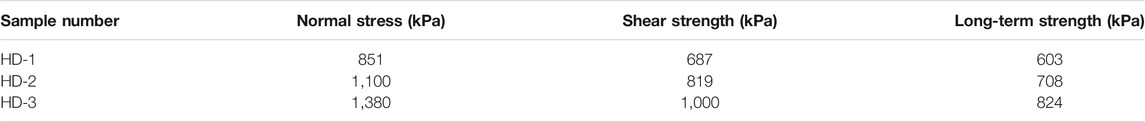
TABLE 2. Long-term strength of samples under different normal stresses.
5 Shear Creep Model and Verification
5.1 Describing Creep Behavior Using Fractional Calculus
The fractional calculus is a branch of calculus that studies differential and integral operators of any order. It is a mathematical tool for solving problems of physical and mechanical modeling effectively. Based on Riemann-Liouvelle’s theory (Koeller, 1984; Adolfsson et al., 2005), Scott-Blair described the constitutive equation of rock or soil as (Blair, 1944)
where
Based on Eq. 2, a new sticky pot element, named Able (Zhou et al., 2012), was defined to describe the creep deformations of materials between ideal solids and ideal fluids. When the shear stress
where
5.2 Nonlinear Viscoplastic Element
Rock or soil generally exhibits accelerated creep properties under high shear stress, and nonlinear creep elements are used to describe this stage. In this study, a nonlinear viscoplastic model is used to describe the creep behavior as follows (Xu et al., 2006)
where m is creep index, which reflects the rate of shear creep in the accelerated creep stage.
5.3 NVPC Model
The Nishihara model is a good and simple model to describe the creep properties fairly comprehensively. However, it can only be used to describe the creep curve prior to the accelerated creep stage. As shown in Figure 11A, it is composed of a Hookean solid (H), a viscoelastic body (N/H), and a viscoplastic body (N/St.V) connected in series. G1 represents the instantaneous shear modulus, G2 represents the viscoelastic shear modulus,
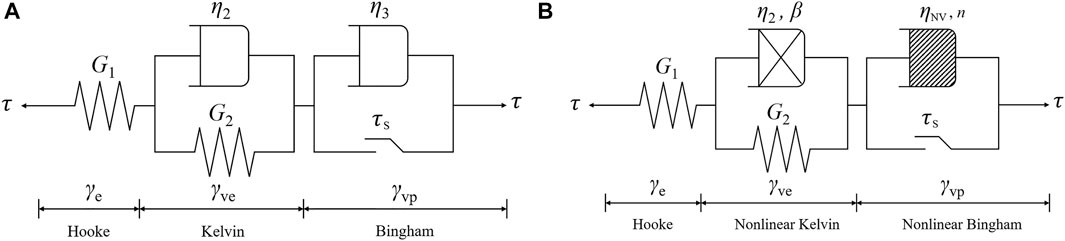
FIGURE 11. Schematic diagrams of the creep models (A) Nishihara model, (B) NVPC model.
Under the assumption that τ is the total shear stress and γ is the total shear displacement, the constitutive equation of the Nishihara model can be expressed as follows (Jiang et al., 2013; Wang et al., 2019)
However, the Nishihara model cannot describe the nonlinear accelerated creep properties of sliding zones. In order to describe the creep properties of sliding zones more accurately, based on the theory of fractional calculus as expressed by Eq. 3, the Newtonian element in the Nishihara model is replaced by Able element, and the viscoplastic body model (N/St.V) is replaced by the nonlinear viscoplastic element model described by Eq. 4. Finally, the long-term strength of the sliding zone obtained by shear creep tests is measured as the threshold of nonlinear accelerated creep. Considering the strains of three parts of the model, NVPC model is established in Figure 11B, which can reflect the characteristics of three-stage creep of a sliding zone as
where n is the value of fractional order, k is a non-negative integer,
5.4 Identification of the Parameters
In order to verify the NVPC model proposed in this study, the creep parameters are identified based on the shear creep test data of sliding zone sample HD-3, as shown in Table 3.
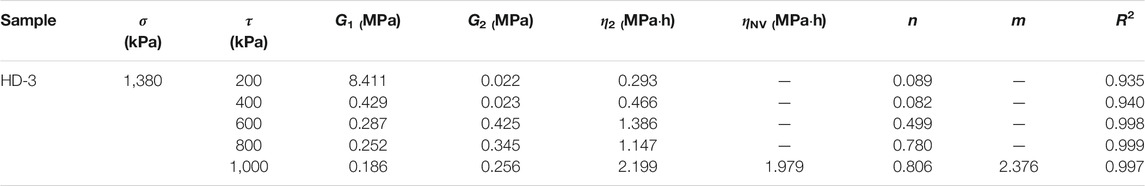
TABLE 3. The fitting parameter values of the NVPC model.
These parameters are substituted into the model to obtain theoretical results and compared with the experimental test values, as shown in Figure 12A. The result obtained using the Nishihara model is also plotted for comparison in Figure 12B. It is obvious that Nishihara model has errors in the accelerated creep stage. Whereas the NVPC model can describe the three shear creep stages, particularly the accelerated creep stage, indicating that the creep model proposed in this study is appropriate.
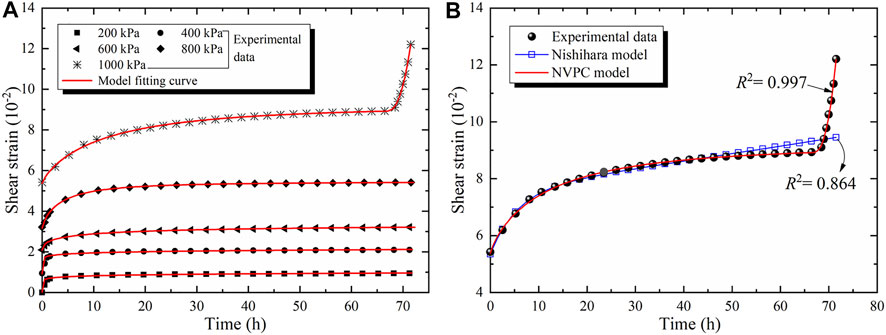
FIGURE 12. Comparison between the theoretical results and the experimental data (A) and (B).
6 Conclusions and Future Work
The following conclusions can be drawn from this study:
(1) Shear creep tests of three undisturbed samples taken from the Zhoujia landslide are performed under normal stresses of 851, 1,100, and 1,380 kPa, respectively. The shear creep curves of the sliding zone exhibit three creep stages: transient, steady-state, and accelerated creep stages. The tested samples from the sliding zone exhibit nonlinear viscoplastic deformations under the shear stresses. The applied normal stress has a significant influence on these stages.
(2) In the transient creep stage, the creep rate attenuates quickly from a large value to a small constant value with the increase of time and enters the steady creep stage, displaying an L-shaped curve of shear strain rate versus time. When entering the accelerated creep stage, the creep rate increases rapidly until the test is stopped, displaying a U-shaped curve of shear strain rate versus time. The relationship between the steady strain rate and shear stress can be described satisfactorily by an exponential equation. The empirical relation is useful for monitoring and forecasting creep deformations of the Zhoujia landslide.
(3) NVPC model is proposed to describe all three creep stages of the sliding zone of the Zhoujia landslide. Based on the long-term strength parameters obtained from the tests, the parameters are identified. The results from the theoretical model are in good agreement with the experimental values.
In this paper, the analytical nonlinear viscoelastic-plastic creep model is established, and numerical verification of the model is not performed, which will be done in future work.
Data Availability Statement
The original contributions presented in the study are included in the article/supplementary material, further inquiries can be directed to the corresponding author.
Author Contributions
SC wrote the manuscript. SC and MS carried out relevant experiments. All authors discussed about the contents.
Funding
This study was supported by Research Grants (No. 51939004, 52109122) from the National Natural Science Foundation of China.
Conflict of Interest
The authors JH and WW are employed by Power China Huadong Engineering Corporation Limited.
The remaining authors declare that the research was conducted in the absence of any commercial or financial relationships that could be construed as a potential conflict of interest.
Publisher’s Note
All claims expressed in this article are solely those of the authors and do not necessarily represent those of their affiliated organizations, or those of the publisher, the editors and the reviewers. Any product that may be evaluated in this article, or claim that may be made by its manufacturer, is not guaranteed or endorsed by the publisher.
Acknowledgments
The authors would like to thank the Power China Huadong Engineering Corporation Limited for access to the study site.
References
Adolfsson, K., Enelund, M., and Olsson, P. (2005). On the Fractional Order Model of Viscoelasticity. Mech. Time-depend Mater. 9 (1), 15–34. doi:10.1007/s11043-005-3442-1
Au, S. W. C. (1998). Rain-induced Slope Instability in Hong Kong. Eng. Geology. 51 (1), 1–36. doi:10.1016/s0013-7952(98)00038-6
Blair, G. W. S. (1944). Analytical and Integrative Aspects of the Stress-Strain-Time Problem. J. Sci. Instrum. 21 (5), 80–84. doi:10.1088/0950-7671/21/5/302
Froude, M. J., and Petley, D. N. (2018). Global Fatal Landslide Occurrence from 2004 to 2016. Nat. Hazards Earth Syst. Sci. 18 (8), 2161–2181. doi:10.5194/nhess-18-2161-2018
Han, G., Hou, J., Zhou, H., Zhang, C., Gao, Y., Yang, L., et al. (2021). Shear Creep Experimental Study on Constitutive Model of Interlayer Shear Weakness Zones. Chin. J. Rock Mech. Eng. 40 (5), 958–971. doi:10.13722/j.cnki.jrme.2020.0881
Jia, C. J., Xu, W. Y., Wang, R. B., Wang, S. S., and Lin, Z. N. (2018). Experimental Investigation on Shear Creep Properties of Undisturbed Rock Discontinuity in Baihetan Hydropower Station. Int. J. Rock Mech. Mining Sci. 104, 27–33. doi:10.1016/j.ijrmms.2018.02.011
Jiang, Q., Qi, Y., Wang, Z., and Zhou, C. (2013). An Extended Nishihara Model for the Description of Three Stages of sandstone Creep. Geophys. J. Int. 193 (2), 841–854. doi:10.1093/gji/ggt028
Koeller, R. C. (1984). Applications of Fractional Calculus to the Theory of Viscoelasticity. J. Appl. Mech. 51 (2), 299–307. doi:10.1115/1.3167616
Li, L., Xu, W., Wang, W., Guo, Y., and Zhao, H. (2010). Estimation of Long-Term Strength for Xiangjiaba sandstone Based on Creep Tests. Eng. Mech. 27 (11), 127–136.
Lin, Q., and Wang, Y. (2018). Spatial and Temporal Analysis of a Fatal Landslide Inventory in China from 1950 to 2016. Landslides 15 (12), 2357–2372. doi:10.1007/s10346-018-1037-6
Liu, X., Deng, J., and Li, Y. (2004). Shear Strength Properties of Slip Soils of Landslides: an Overview. Rock Soil Mech. 25 (11), 1849–1854. doi:10.16285/j.rsm.2004.11.038
Oberender, P. W., and Puzrin, A. M. (2016). Observation-guided Constitutive Modelling for Creeping Landslides. Géotechnique 66 (3), 232–247. doi:10.1680/jgeot.15.LM.003
Ren, S., Zhang, Y., Xu, N., and Wu, R. (2021). Mesoscopic Response Mechanism of Shear Surface Roughness and Residual Strength in Gravelly Sliding Zone Soils. Chin. J. Geotechnical Eng. 43 (8), 1473–1482. doi:10.11779/CJGE202108012
Runqiu, H. (2009). Some Catastrophic Landslides since the Twentieth century in the Southwest of China. Landslides 6 (1), 69–81. doi:10.1007/s10346-009-0142-y
Shen, M., Chen, H., and Zhang, Q. (2012). Method for Determining Long-Term Strength of Discontinuity Using Shear Creep Test. Chin. J. Rock Mech. Eng. 31 (1), 1–7.
Stark, T. D., Baghdady, A. K., Hungr, O., and Aaron, J. (2017). Case Study: Oso, Washington, Landslide of March 22, 2014-Material Properties and Failure Mechanism. J. Geotechnical Geoenvironmental Eng. 143 (5), 1. doi:10.1061/(asce)gt.1943-5606.0001615
Sun, M., Tang, H., Wang, M., Shan, Z., and Hu, X. (2016). Creep Behavior of Slip Zone Soil of the Majiagou Landslide in the Three Gorges Area. Environ. Earth Sci. 75 (16), 1. doi:10.1007/s12665-016-6002-x
Sun, M., Tang, H., Wang, X., Hu, X., Wang, M., and Ni, W. (2017). Creep Properties of Sliding-Zone Soil from a Creeping Landslide. Rock Soil Mech. 38 (2), 385–391+399. doi:10.16285/j.rsm.2017.02.011
Tang, H., Duan, Z., Wang, D., and Dang, Q. (2020). Experimental Investigation of Creep Behavior of Loess under Different Moisture Contents. Bull. Eng. Geol. Environ. 79 (1), 411–422. doi:10.1007/s10064-019-01545-8
Wang, H., Liu, S., Xu, W., Yan, L., Qu, X., and Xie, W.-C. (2020a). Numerical Investigation on the Sliding Process and deposit Feature of an Earthquake-Induced Landslide: a Case Study. Landslides 17 (11), 2671–2682. doi:10.1007/s10346-020-01446-y
Wang, J., Wang, X., Zhan, H., Qiu, H., and Hu, S. (2019). A New Superlinear Viscoplastic Shear Model for Accelerated Rheological Deformation. Comput. Geotechnics 114, 103132. doi:10.1016/j.compgeo.2019.103132
Wang, L., Han, J., Liu, S., and Yin, X. (2020b). Variation in Shearing Rate Effect on Residual Strength of Slip Zone Soils Due to Test Conditions. Geotech Geol. Eng. 38 (3), 2773–2785. doi:10.1007/s10706-020-01186-9
Xu, L., Meng, X., and Xu, X. (2014). Natural hazard Chain Research in China: A Review. Nat. Hazards 70 (2), 1631–1659. doi:10.1007/s11069-013-0881-x
Xu, Q. (2012). Theoretical Studies on Prediction of Landslides Using Slope Deformation Process Data. J. Eng. Geology. 20 (2), 145–151.
Xu, Q., Wang, W., Li, L., and Cao, Y. (2021). Failure Mechanism of Gently Inclined Shallow Landslides along the Soil-Bedrock Interface on Ring Shear Tests. Bull. Eng. Geol. Environ. 80 (5), 3733–3746. doi:10.1007/s10064-021-02171-z
Xu, W., Yang, S., and Chu, W. (2006). Nonlinear Viscoelastic-Plastic Rheological Model (Hohai Model) of Rock and its Engineering Application. Chin. J. Rock Mech. Eng. 25 (3), 433–447.
Yan, L., Xu, W., Wang, H., Wang, R., Meng, Q., Yu, J., et al. (2019). Drainage Controls on the Donglingxing Landslide (China) Induced by Rainfall and Fluctuation in Reservoir Water Levels. Landslides 16 (8), 1583–1593. doi:10.1007/s10346-019-01202-x
Yu, J., Jia, C., Xu, W., Zhang, Q., and Wu, C. (2021). Granular Discrete Element Simulation of the Evolution Characteristics of the Shear Band in Soil-Rock Mixture Based on Particle Rotation Analysis. Environ. Earth Sci. 80 (6), 1. doi:10.1007/s12665-021-09484-y
Zhanlin, C., Hongshun, D., and Liangping, W. U. (2007). Experimental Study on Mechanical Behaviour of Granular Material. Chin. J. Geotechnical Eng. 29 (8), 1151–1158.
Keywords: Zhoujia landslide, sliding zone, long-term stability, shear creep test, creep properties, NVPC model
Citation: Chen S, Xu W, Sun M, Yan L, Hou J, Wu W and Xie W-C (2022) Shear Creep Properties and Creep Model of Gravel Sliding Zone: A Case Study of the Zhoujia Landslide in China. Front. Earth Sci. 10:838183. doi: 10.3389/feart.2022.838183
Received: 17 December 2021; Accepted: 24 January 2022;
Published: 18 February 2022.
Edited by:
Dongxing Wang, Wuhan University, ChinaReviewed by:
Xiaoliang Xu, China Three Gorges University, ChinaYuyuan Chen, Kyushu University, Japan
Copyright © 2022 Chen, Xu, Sun, Yan, Hou, Wu and Xie. This is an open-access article distributed under the terms of the Creative Commons Attribution License (CC BY). The use, distribution or reproduction in other forums is permitted, provided the original author(s) and the copyright owner(s) are credited and that the original publication in this journal is cited, in accordance with accepted academic practice. No use, distribution or reproduction is permitted which does not comply with these terms.
*Correspondence: Weiya Xu, wyxuhhu@163.com